Article

Identification and Validation of Reference Genes for Seashore Paspalum Response to Abiotic Stresses

1
College of Agro-grassland Science, Nanjing Agricultural University, Nanjing 210095, China
2
Department of Plant Biology and Pathology, Rutgers University, New Brunswick, NJ 08901, USA
*
Authors to whom correspondence should be addressed.
Int. J. Mol. Sci. 2017, 18(6), 1322; https://doi.org/10.3390/ijms18061322
Submission received: 19 April 2017 / Revised: 16 June 2017 / Accepted: 16 June 2017 / Published: 21 June 2017
(This article belongs to the Section Molecular Plant Sciences)

Abstract

:
Seashore paspalum (Paspalum vaginatum) is among the most salt- and cadmium-tolerant warm-season perennial grass species widely used as turf or forage. The objective of this study was to select stable reference genes for quantitative real-time polymerase chain reaction (qRT-PCR) analysis of seashore paspalum in response to four abiotic stresses. The stability of 12 potential reference genes was evaluated by four programs (geNorm, NormFinder, BestKeeper, and RefFinder). U2AF combined with glyceraldehyde-3-phosphate dehydrogenase (GAPDH) showed stable expression in Cd-treated leaves and cold-treated roots. U2AF and FBOX were the most stable reference genes in Cd-treated roots and cold-treated leaves. In Polyethylene Glycol (PEG)- or salt-treated roots, the reference gene U2AF paired with either ACT or CYP were stable. SAND and CACS exhibited the most stability in salt-treated leaves, and combining UPL, PP2A, and EF1a was most suitable for PEG-treated leaves. The stability of U2AF and instability of UPL and TUB was validated by analyzing the expression levels of four target genes (MT2a, VP1, PIP1, and Cor413), and were shown to be capable of detecting subtle changes in expression levels of the target genes in seashore paspalum. This study demonstrated that FBOX, U2AF, and PP2A could be used in future molecular studies that aim to understand the mechanisms of abiotic stress tolerance in seashore paspalum.

Graphical Abstract

1. Introduction

Quantifying the level of gene expression is a critical step for gene discovery and molecular analysis [1]. Quantitative real-time polymerase chain reaction (qRT-PCR) is commonly used and regarded as a highly effective method for measuring gene expression levels across different tissues, developmental periods, and biotic or abiotic stress conditions [2]. However, the accuracy of qRT-PCR analysis is dependent on the stability of reference genes, the quantity and purity of mRNA templates, the enzymatic efficiency in cDNA synthesis, and the efficacy of PCR amplification [3]. Among those factors, the stability of reference genes is likely a key factor in controlling the precision of qRT-PCR results.
A number of reference genes have been screened from many plant species, and the specific reference genes suitable for gene expression quantification vary with plant species [4,5], as a result of their having different response mechanisms. These traditional reference genes include those associated with primary metabolism or other cellular processes, such as actin (ACT), tubulin (TUB), elongation factor 1a (EF1a), glyceraldehyde-3-phosphate dehydrogenase (GAPDH), and 18s ribosomal RNA (18S rRNA) [6,7]. However, recent studies have found that some of these commonly used reference genes present unstable expression in different plant species, tissues, or environmental conditions. For example, ACT was unstable under salinity, drought, cold, and heat stress in Bermuda grass (Cynodon dactylon) [8] but had stable expression in Kentucky bluegrass (Poa pratensis) [4]. The expression of GAPDH and TUB in Peking willow (Salix matsudana) showed large variations under drought and salt treatments [9]. Therefore, microarray and transcriptome data were used to develop new reference genes with highly stable expression levels, such as SAND family protein (SAND), F-box/kelch-repeat protein (F-box), clathrin adapter complex subunit family protein (CACS), splicing factor (U2AF), and TIP41-like family protein (TIP41), all of which were identified in Arabidopsis thaliana [10]. Homologous genes of the new reference genes listed above were identified in other species following Basic Local Alignment Search Tool (BLAST) alignment analyses of transcriptome and EST data. Results of other studies showed that CACS of buckwheat (Fagopyrum esculentum) and cork oak (Quercus suber) and TIP41 and SAND of Caragana intermedia were demonstrated to have stable expression under different experimental conditions [11,12,13]. CYP and U2AF were shown to be the most stable genes in different tissues of switchgrass (Panicum virgatum) under different stress conditions [14]. The previous work strongly suggests that it is important to select suitable reference genes for different organs in specific plant species under various environmental conditions in order to accurately quantify expression levels of target genes using qRT-PCR.
Seashore paspalum (Paspalum vaginatum) is a widely used forage and turfgrass species with a broad range of variability in stress tolerance genes, particularly those associated with salinity and cadmium tolerance [15]. Identification of stable reference genes under different environmental conditions is imperative for efficient molecular breeding and discovery of stress-related genes in seashore paspalum. The objective of this study was to identify stable reference genes for qRT-PCR analysis of target-gene expression levels in leaves and roots of seashore paspalum under salinity, drought, cold, and heat stress. The expression levels of four target genes (MT2a, VP1, PIP1, and Cor413) isolated from seashore paspalum were used to validate the effectiveness of the selected genes identified in the study as references. According to homolog comparison between seashore paspalum transcriptome data and Arabidopsis microarray data, 12 candidate reference genes, including the five traditional genes (EF1a, ACT, GAPDH, TUB, and UPL) and the seven new genes selected from Arabidopsis (SAND, CACS, FBOX, PP2A, CYP, U2AF, and TIP41), were examined in this study.

2. Results

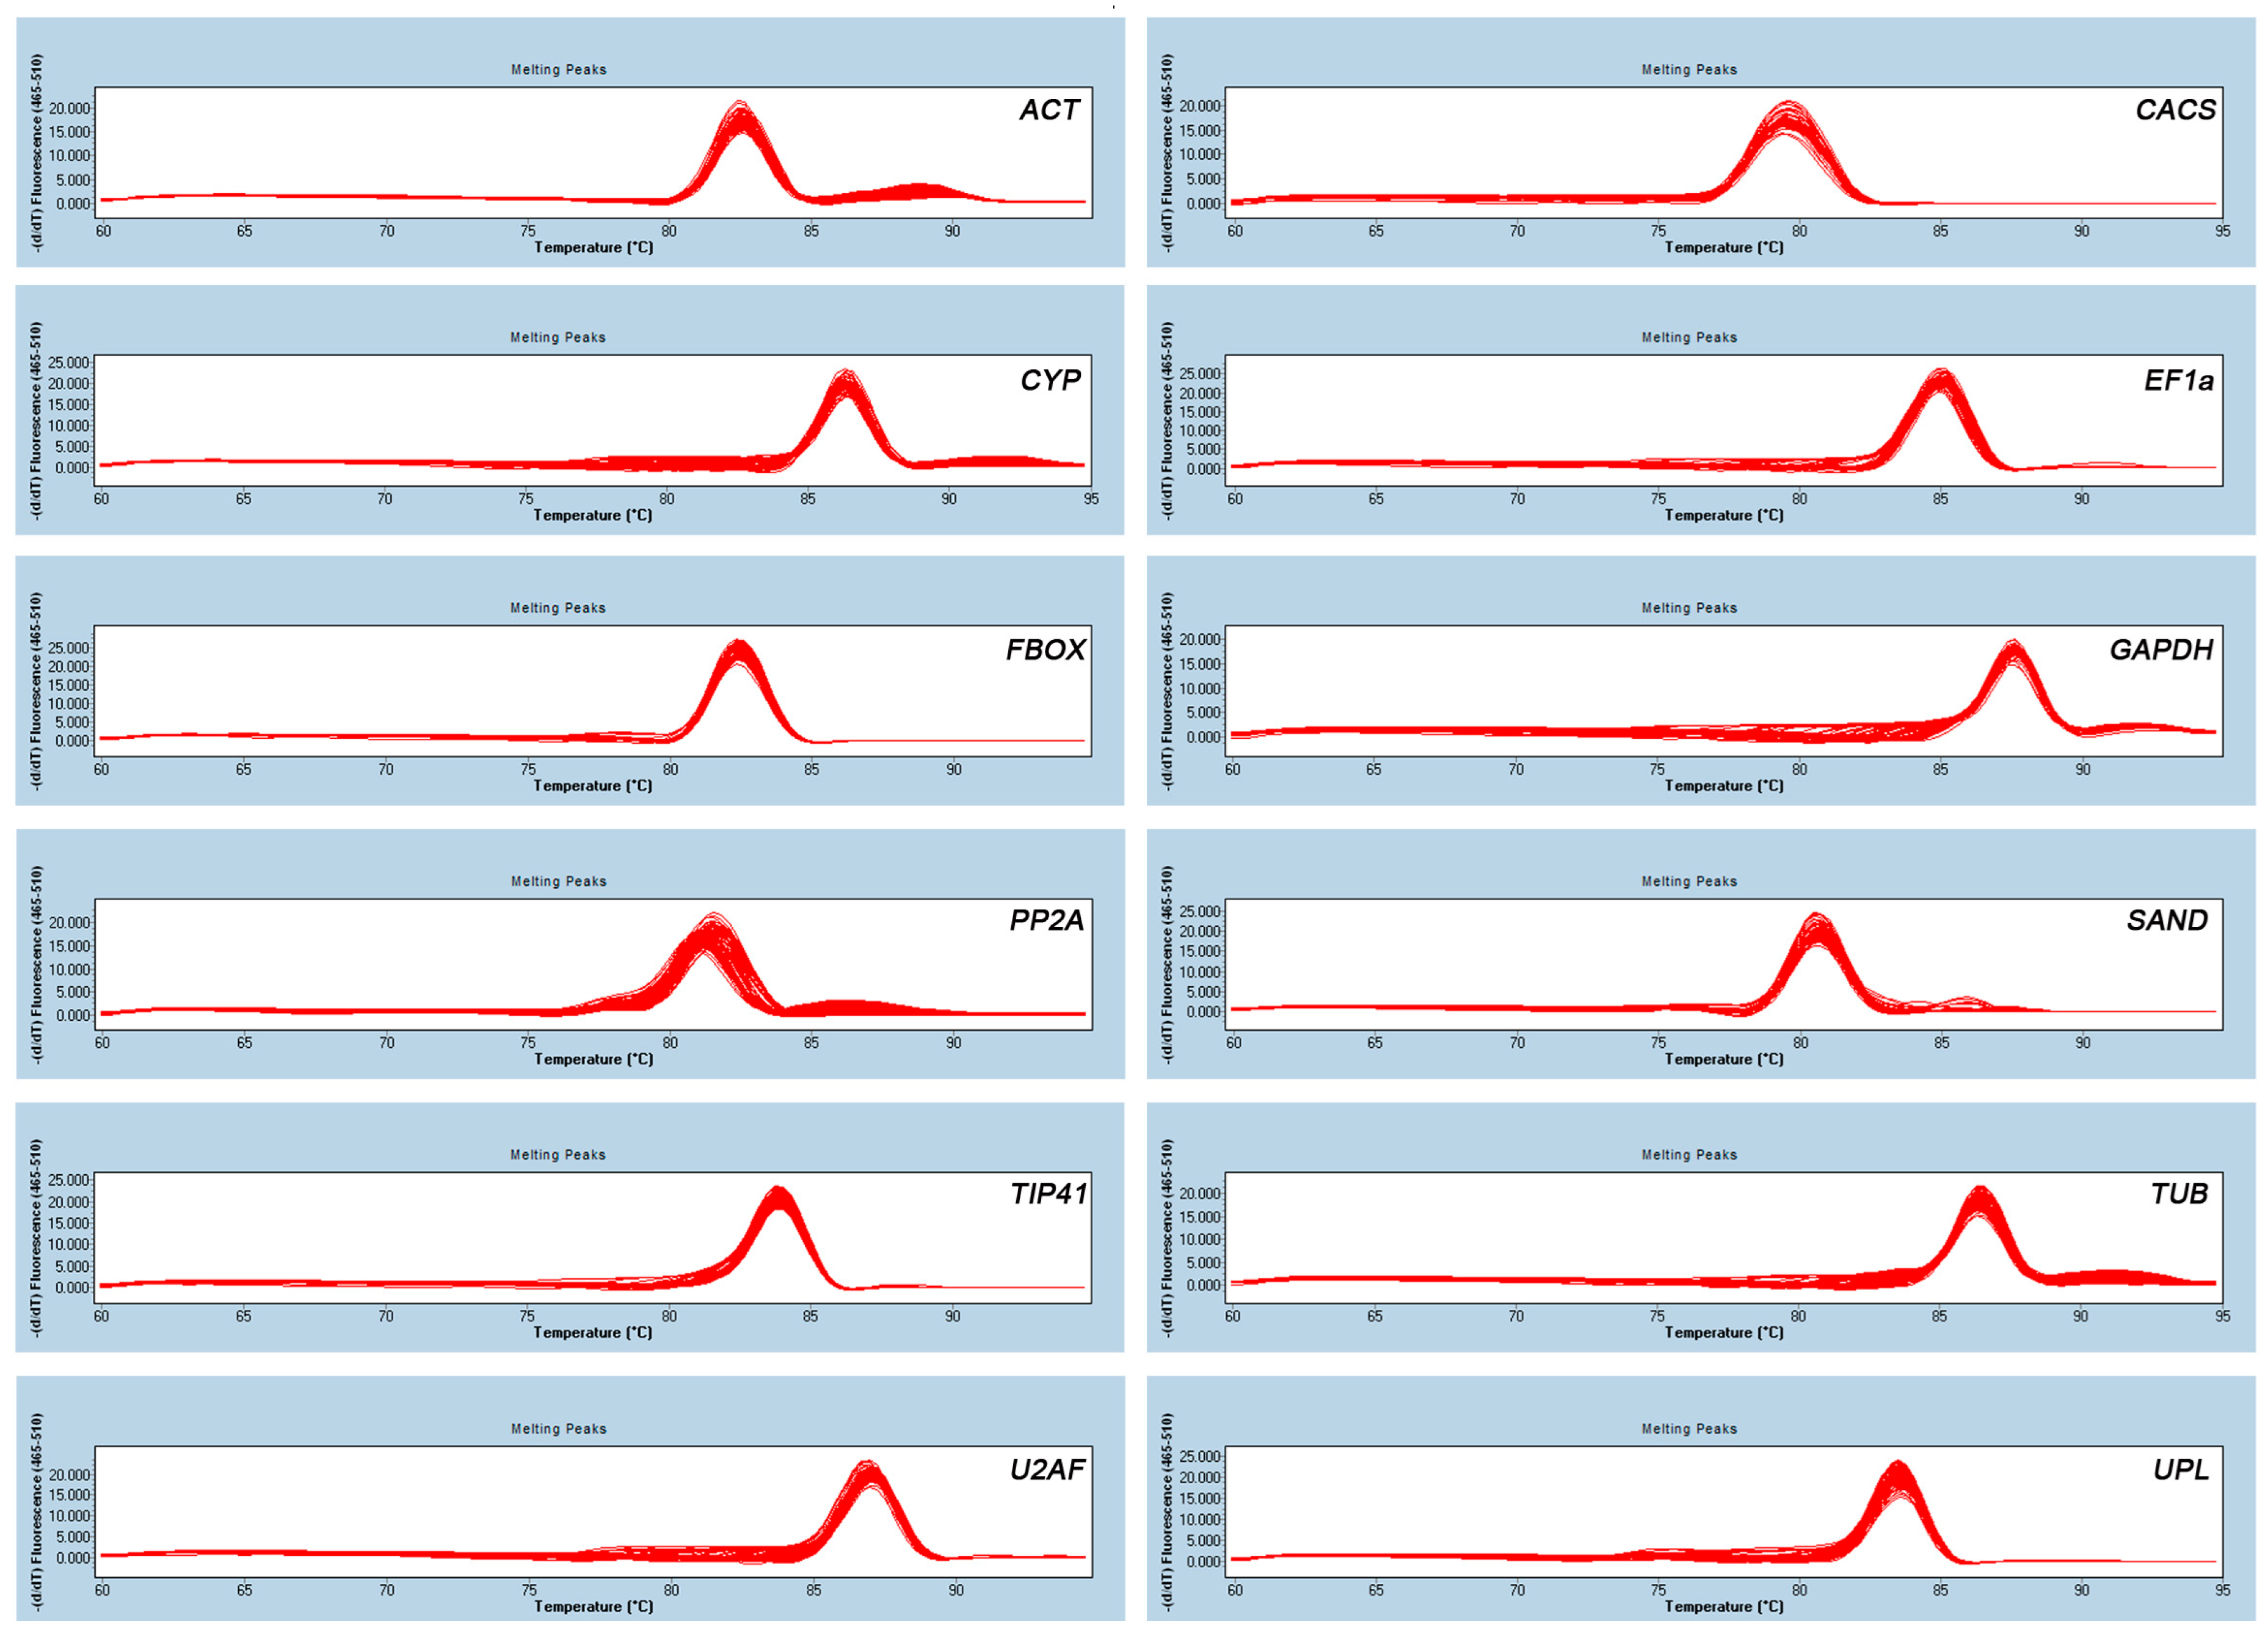
2.1. Identification of PCR Amplicons, Primer Specificity, and Amplification Efficiency of qRT-PCR

The names, primer sequences, and amplicon lengths of the 12 reference genes are given in Table 1. Primer specificities were confirmed by analyzing melting curve assays of qRT-PCR amplicons that produced a single peak (Figure 1). The sequences of PCR amplicons were nearly identical (97–100% in similarity) to the corresponding transcriptome data of seashore paspalum (data not shown). qRT-PCR efficiencies measured by the LinRegPCR software (Version 2012.0) for all 12 genes varied from 1.89 to 1.98 (Table 2), indicating acceptable efficiency (1.8 ≤ E ≤ 2) [16].

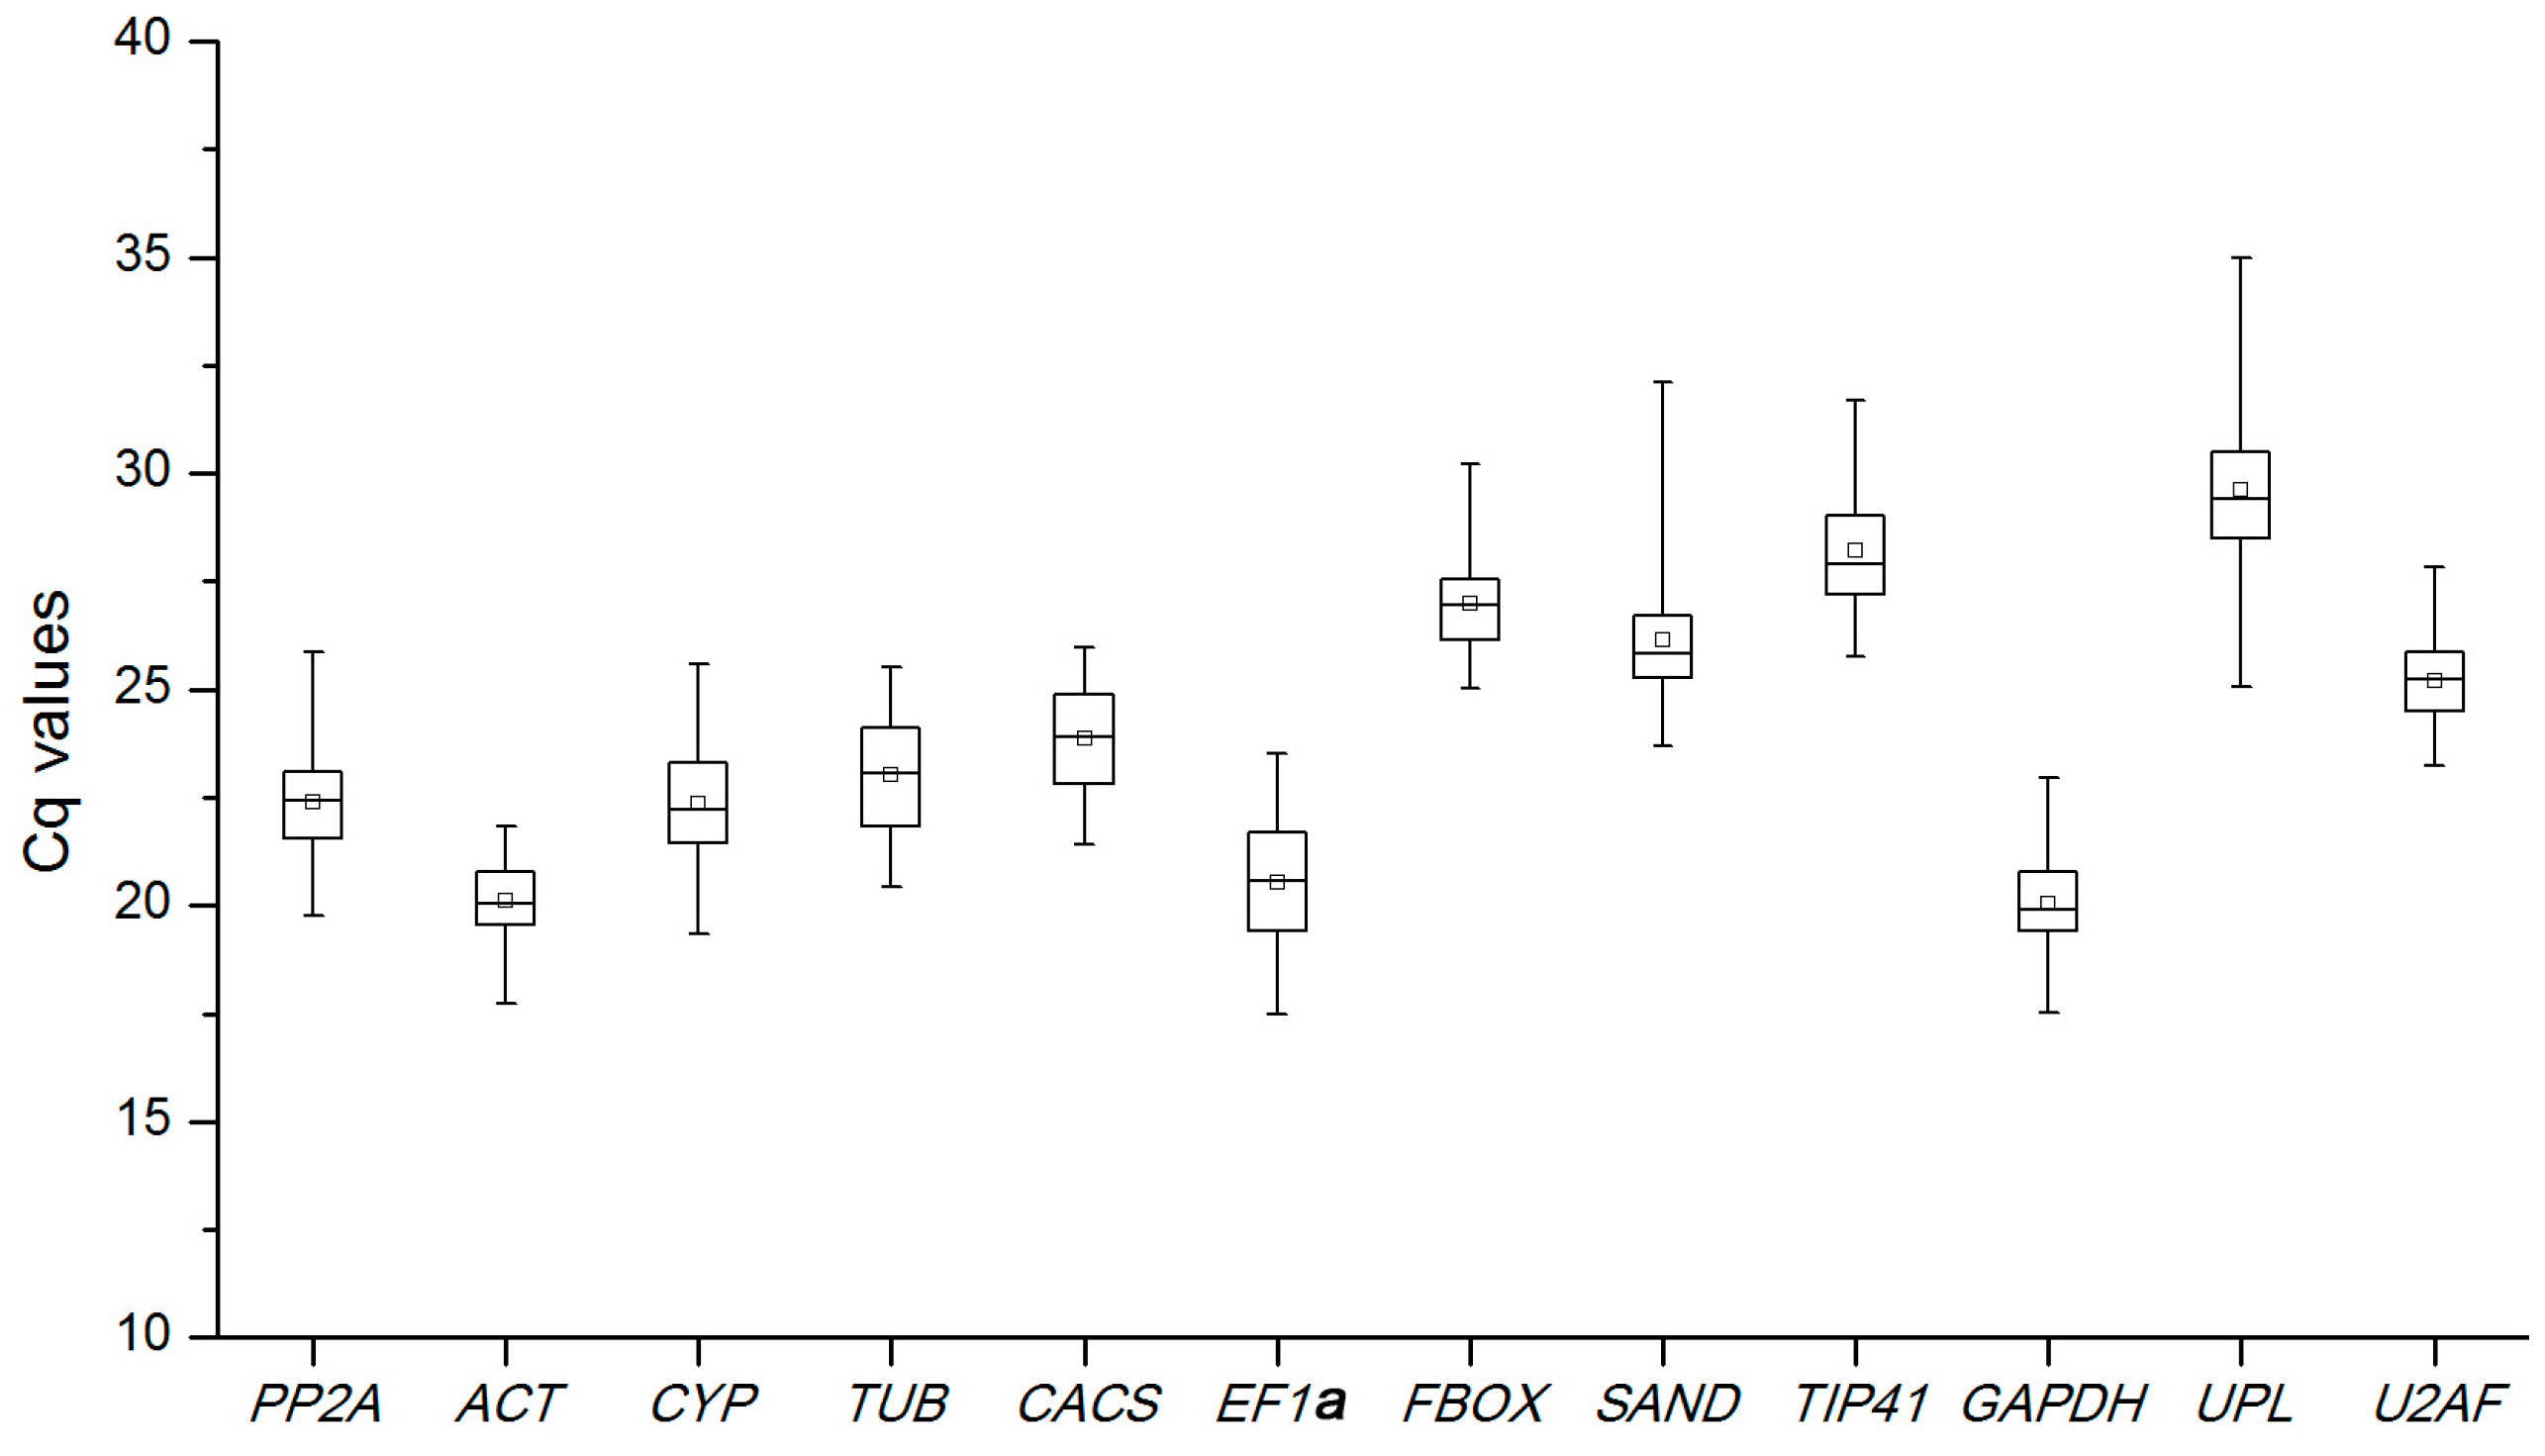
2.2. Expression Levels and Variations of Reference Genes

The quantification cycle (Cq) values of the 12 candidate reference genes were measured by qRT-PCR analysis and ranged from 18 to 32 (Figure 2), with the lower Cq values showing higher mRNA transcript levels. Variations in each reference gene are exhibited in the box plot (Figure 1). Among the 12 candidate reference genes, UBL had the lowest expression level with a mean Cq of 29.6, while GAPDH showed the highest expression level with a mean Cq of 20.1 (Figure 2). The coefficients of variation (lower values represent higher variability) of the 12 reference genes were 3.75% (FBOX), 3.96% (U2AF), 4.15% (ACT), 4.42% (TIP41), 5.25% (CACS), 5.31% (SAND), 5.37% (TUB), 5.40% (PP2A), 5.42% (GAPDH), 5.46% (UBL), 5.79% (CYP), and 6.65% (EF1α).

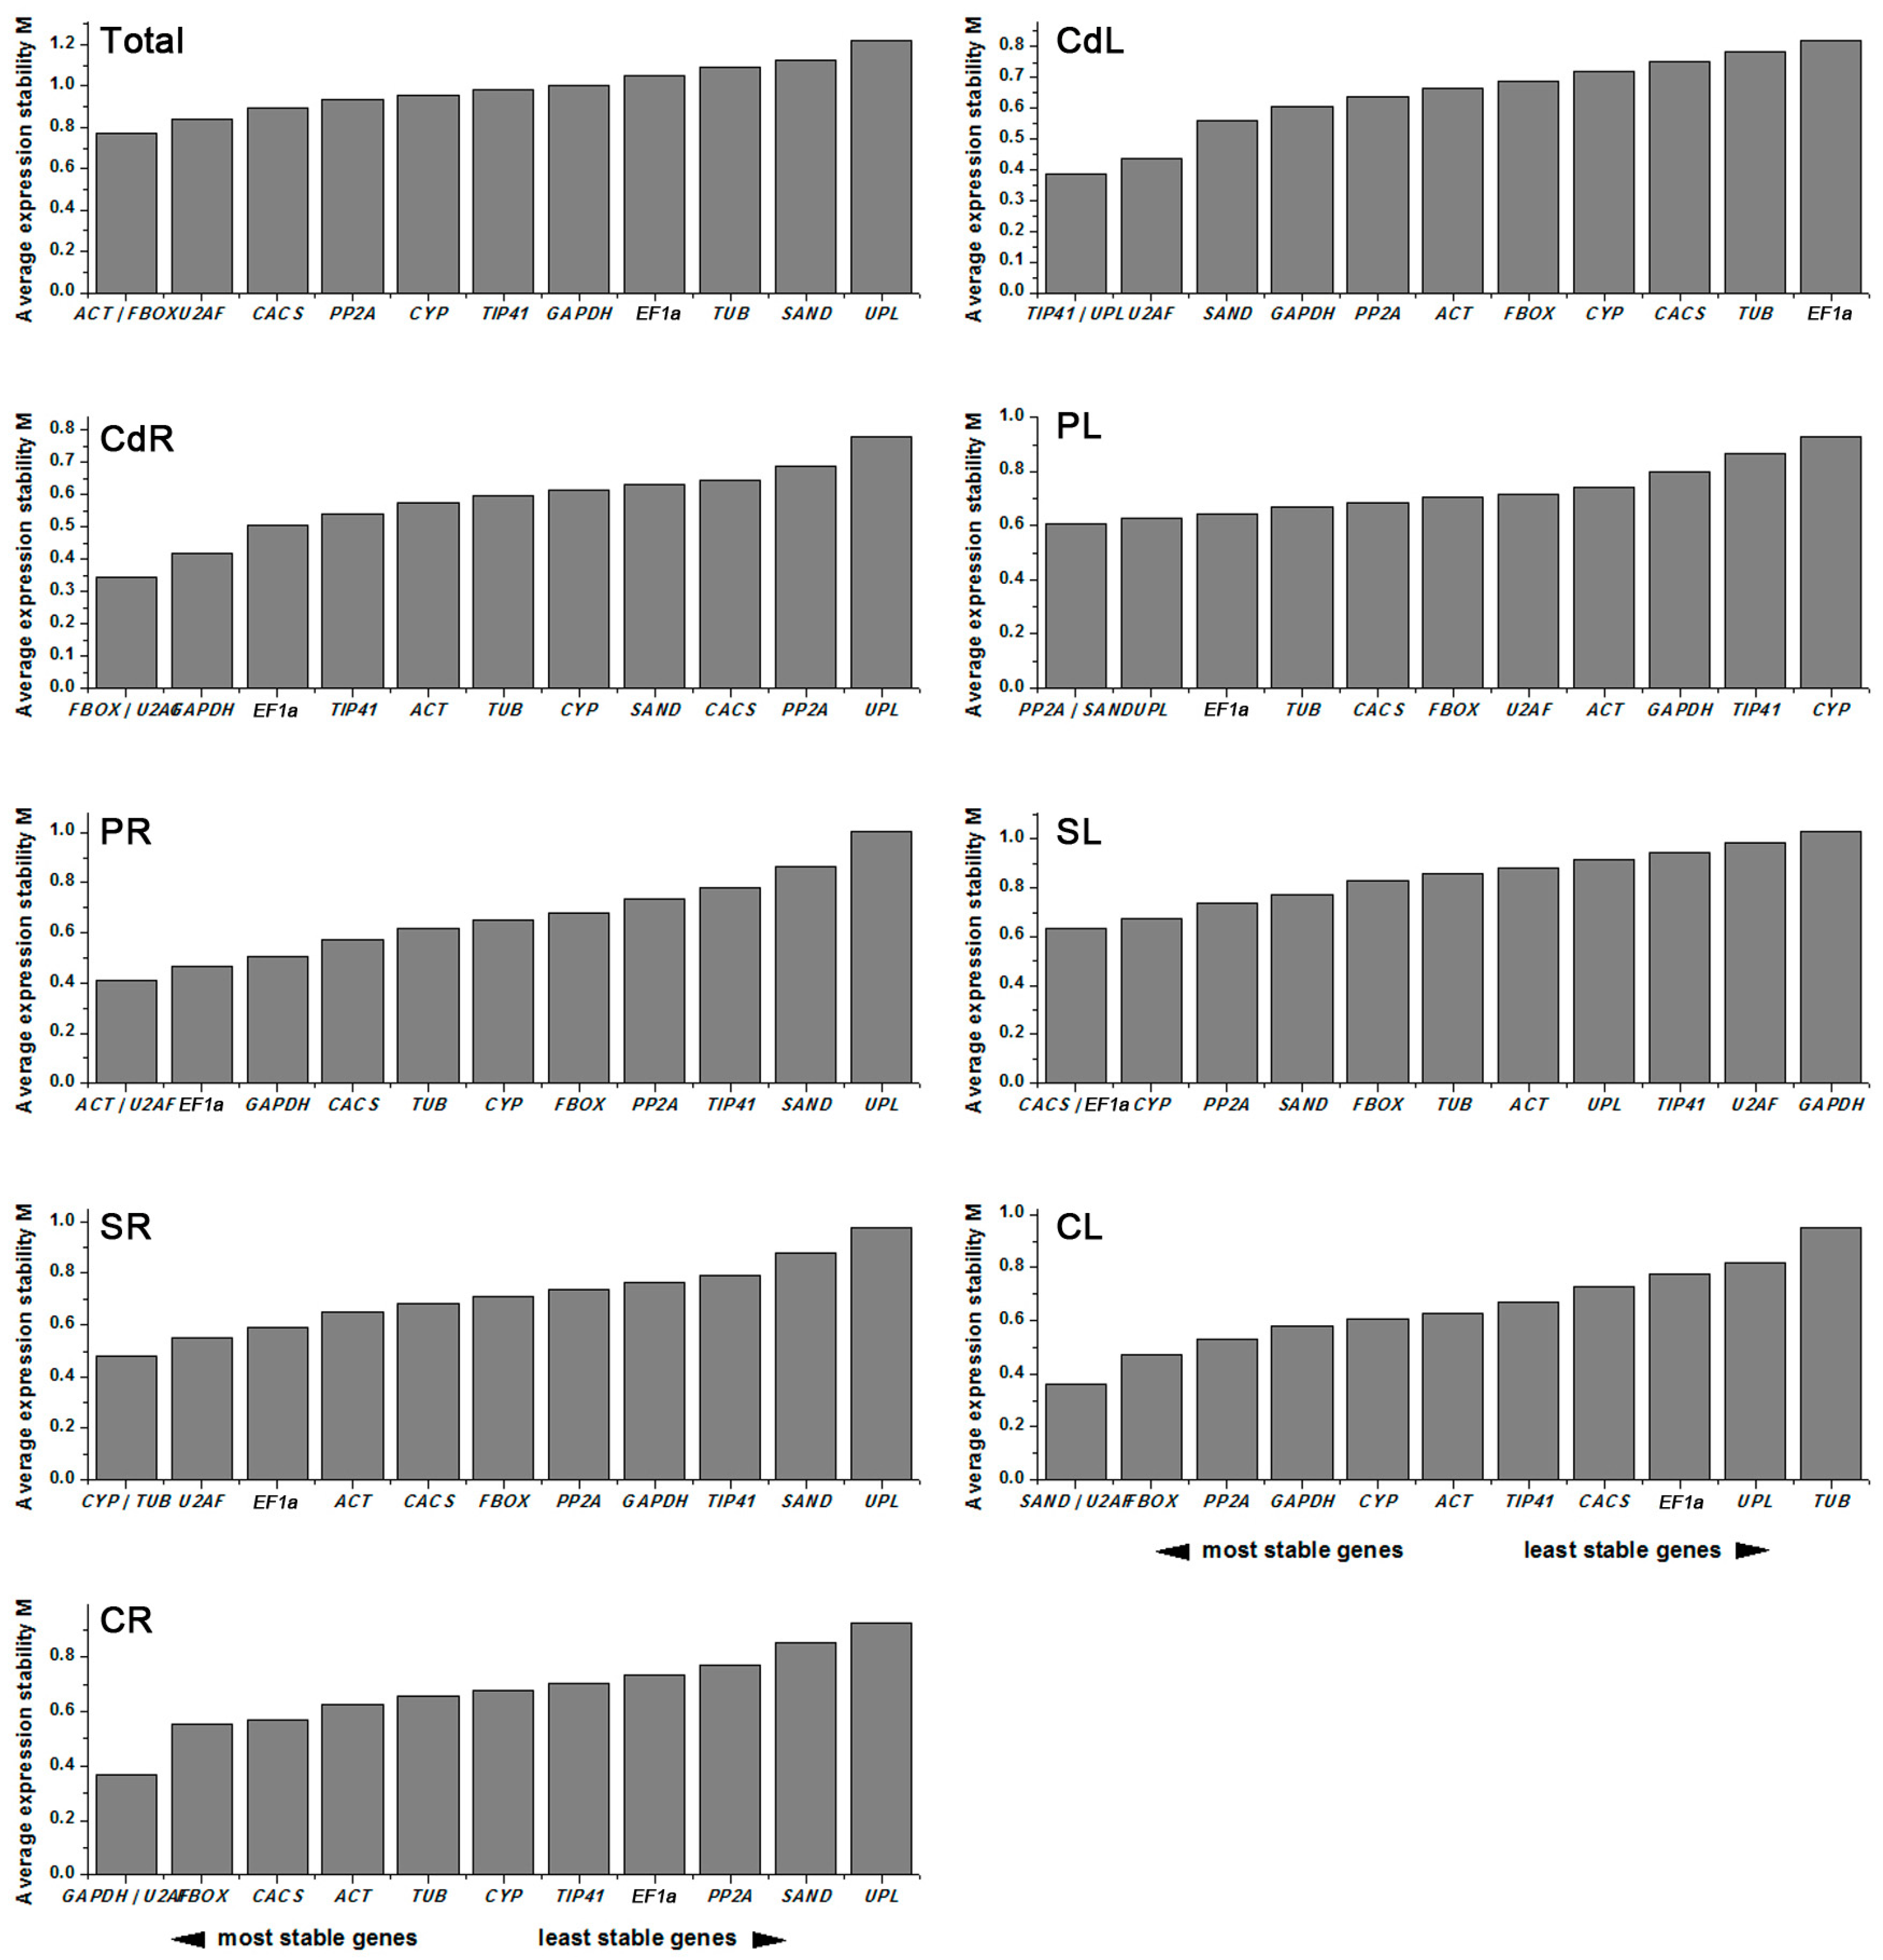
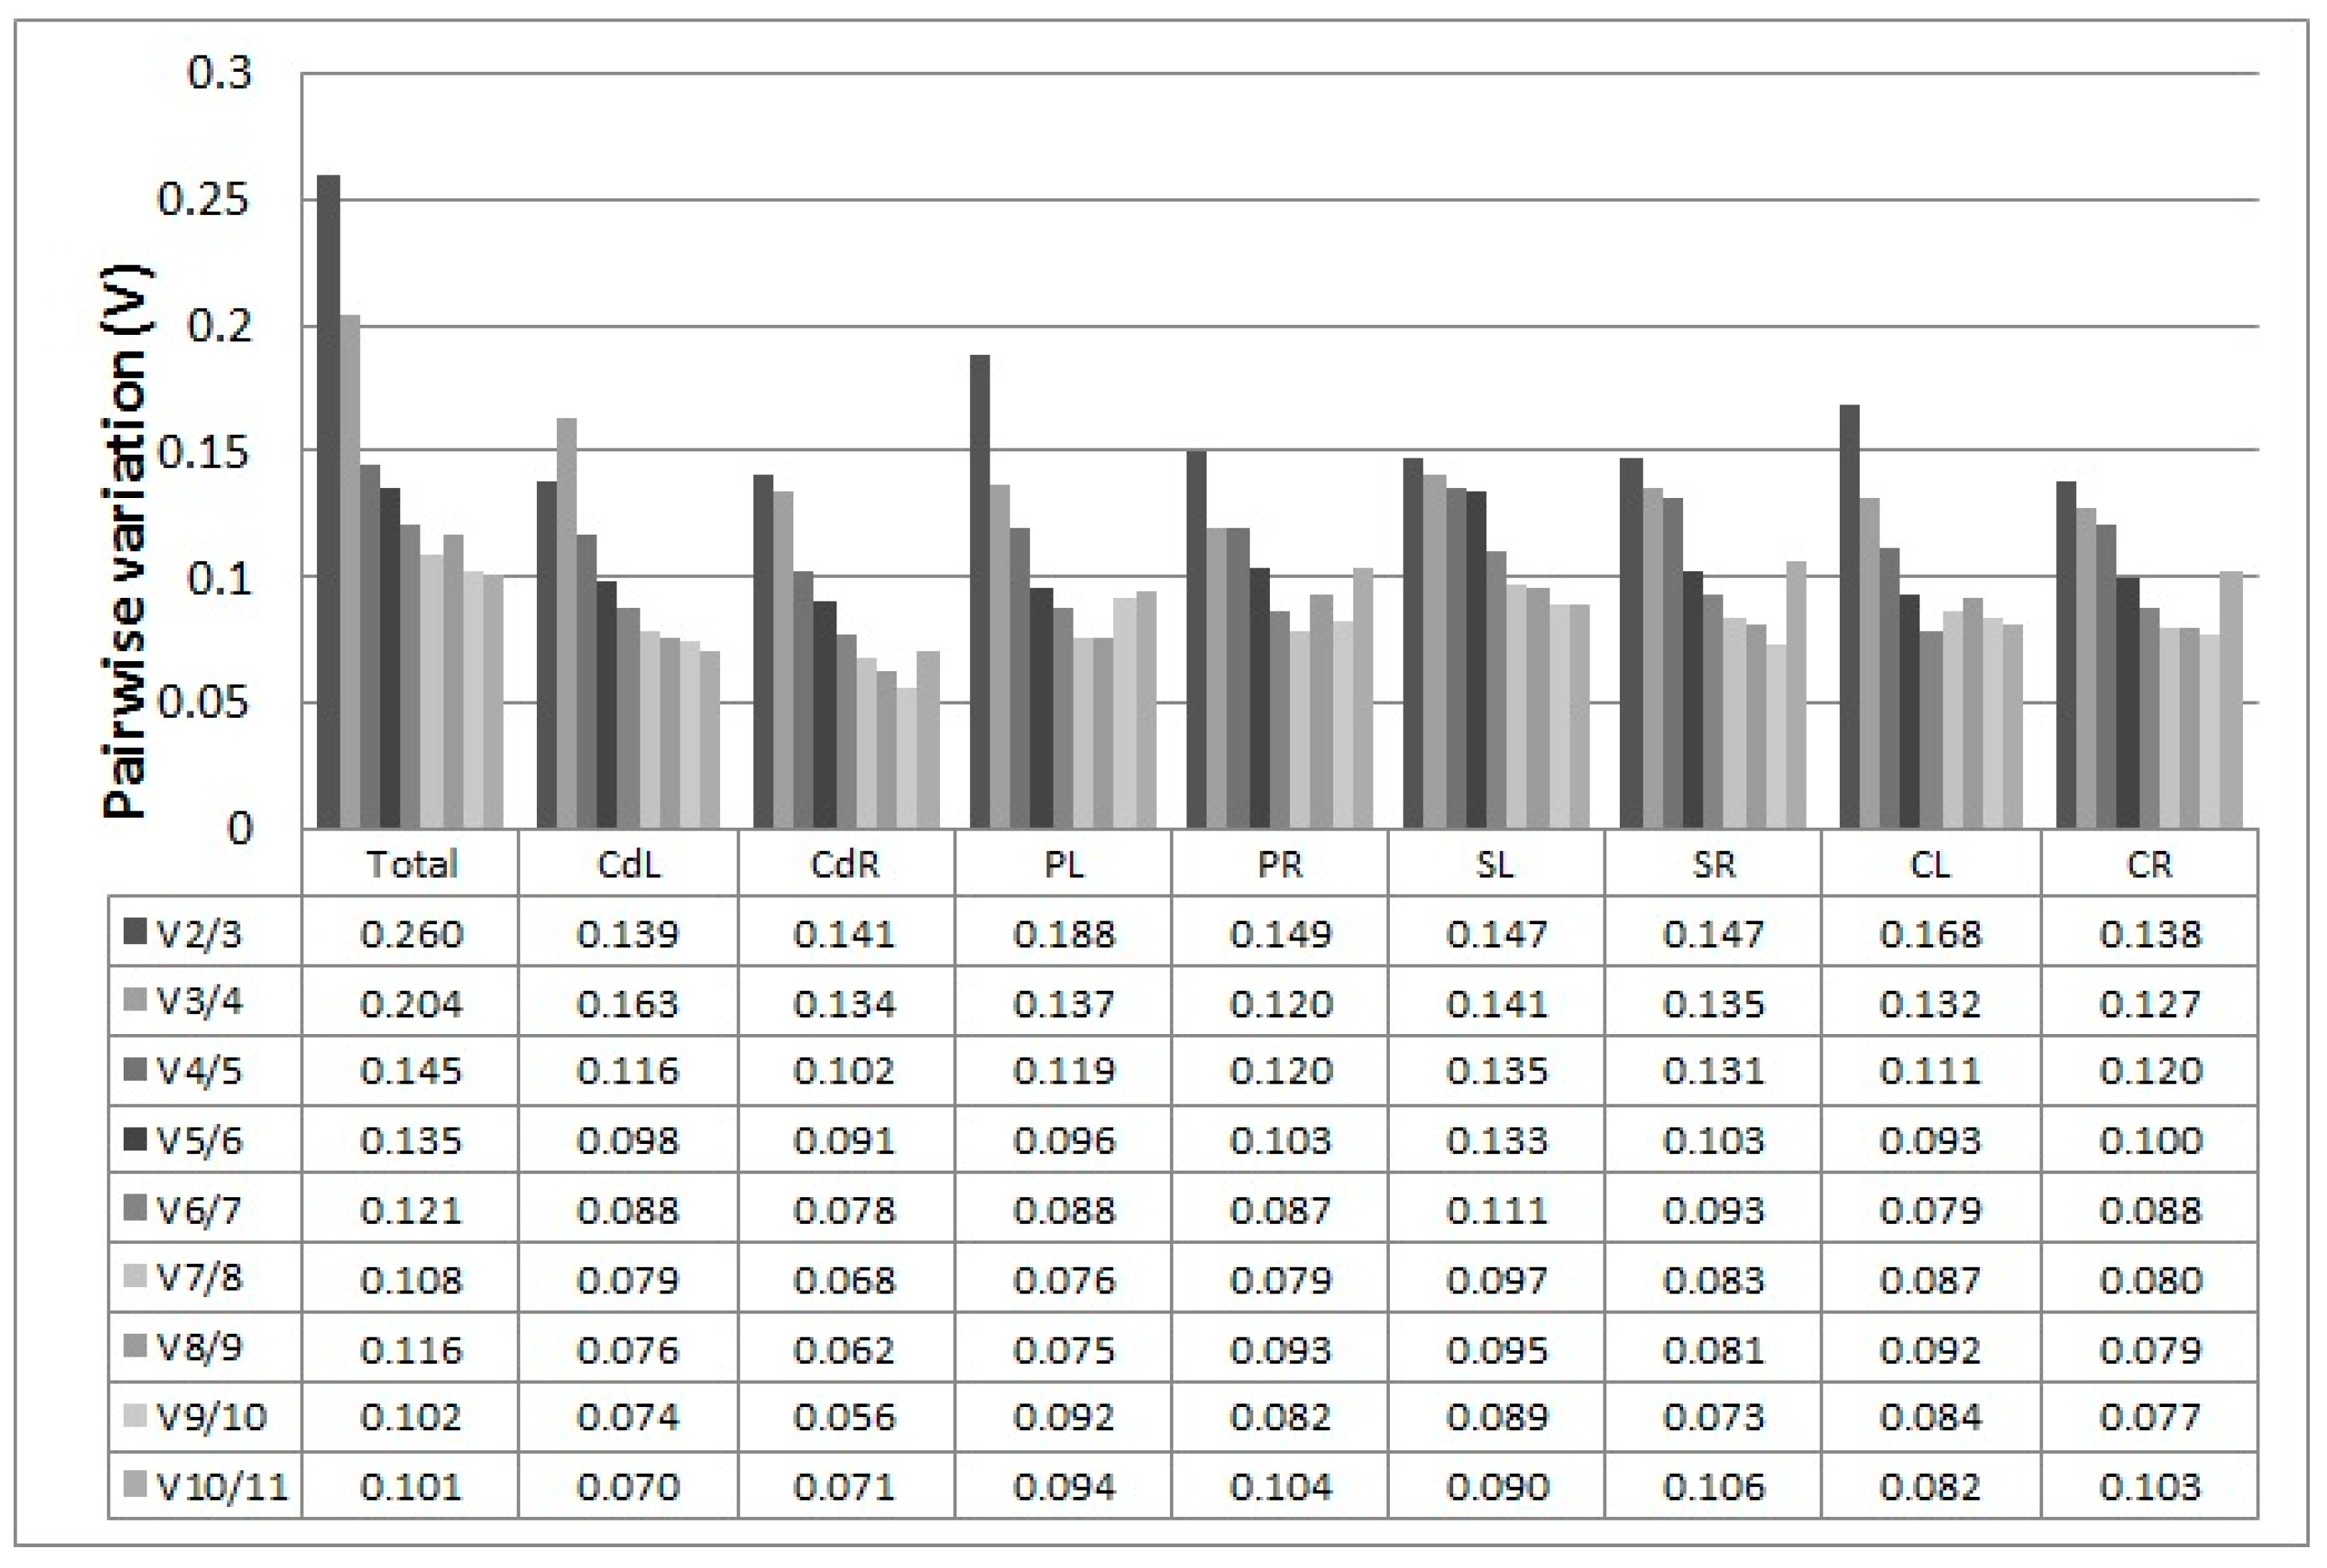
2.3. Stability of Candidate Reference Genes

2.3.1. geNorm Analysis

The M values calculated by geNorm software (V3.5, Ghent, Belgium), were applied to evaluate the stability of reference genes by comparing the average variation of a gene to all others. The M value of 1.5 was used as a threshold for expression stability, and M values lower than 1.5 indicated higher stability. Based on this principle, it was determined that out of all samples, ACT and FBOX from both leaf and root tissues had the same M values and were the two most stable reference genes for all stress treatments. Similarly, stabilities of reference genes were evaluated, including TIP41/UPL in cadmium-treated leaves (CdL), FBOX/U2AF in cadmium-treated roots (CdR), PP2A/SAND in PEG-treated leaves (PL), ACT/U2AF in PEG-treated roots (PR), CACS/EF1a in salt-treated leaves (SL), CYP/TUB in salt-treated roots (SR), SAND/U2AF in cold-treated leaves (CL), and GAPDH/U2AF in cold-treated roots (CR) (Figure 3).
The geNorm program is typically used for determining the optimal number of reference genes required for accurate normalization. When a small variation appears between Vn/n+1 and Vn+1/Vn+2 or the Vn/n+1 value is lower than the threshold of 0.15, the value (n) can be considered as the optimal number of reference genes. The V2/3 values for the CdL, CdR, PR, SL, SR, and CR samples were lower than 0.15 (Figure 4), indicating that two reference genes were suitable for normalization. Three reference genes were selected after the V3/4 values of PL and CL samples were indicated to be below 0.15. The V4/5 value (0.145) of all samples showed that four genes could be useful for normalization of all the samples.

2.3.2. NormFinder Analysis

Evaluation values detected by NormFinder (V0953, Aarhus, Denmark) are shown in Table 3, with lower values indicating higher stability. Among all samples, the four reference genes with the highest stability overall were FBOX (0.519), ACT (0.604), U2AF (0.67) and PP2A (0.673) (Table 3). U2AF and GAPDH were identified as the two most stable genes in CdL and PR samples, while U2AF and FBOX were ranked as having the highest stability in CdR and SR samples. UPL or SAND was the most stable gene in PL and SL samples. U2AF had the highest stability in CL and CR samples. TUB and UPL had the lowest stability rankings out of all samples except for PL.

2.3.3. BestKeeper Analysis

The rankings of reference genes based on CV and SD values by BestKeeper (Version1.0, Munich, Germany) analysis are shown in Table 4, with lower SD and CV representing higher stability. FBOX and U2AF exhibited the highest stability of CdL, CdR, and PR samples. The most stable genes were FBOX and CACS for CL and CR samples, U2AF and ACT for SR samples, PP2A and ACT for SL samples, and UPL and TUB for PL samples.

2.3.4. RefFinder Analysis

RefFinder (Version 1.0), available online: http://www.leonxie.com/referencegene.php) analysis was performed to obtain a comprehensive evaluation of candidate reference genes by integrating three common analysis programs (geNorm, Normfinder, and BestKeeper) and the ΔCq method. According to the analysis of RefFinder and geNorm (Table 5), the four most stable genes for all samples were FBOX, ACT, U2AF and PP2A, while UPL was the least stable reference gene. U2AF combined with different genes could be used as reference genes for CdL, CdR, PR, SR, CL, and CR samples. UPL, PP2A, and EF1a from PL samples and SAND and CACS from SL samples were suitable reference genes, while UPL presented unstable expression in total samples that included CdR, PR, SR, and CR.

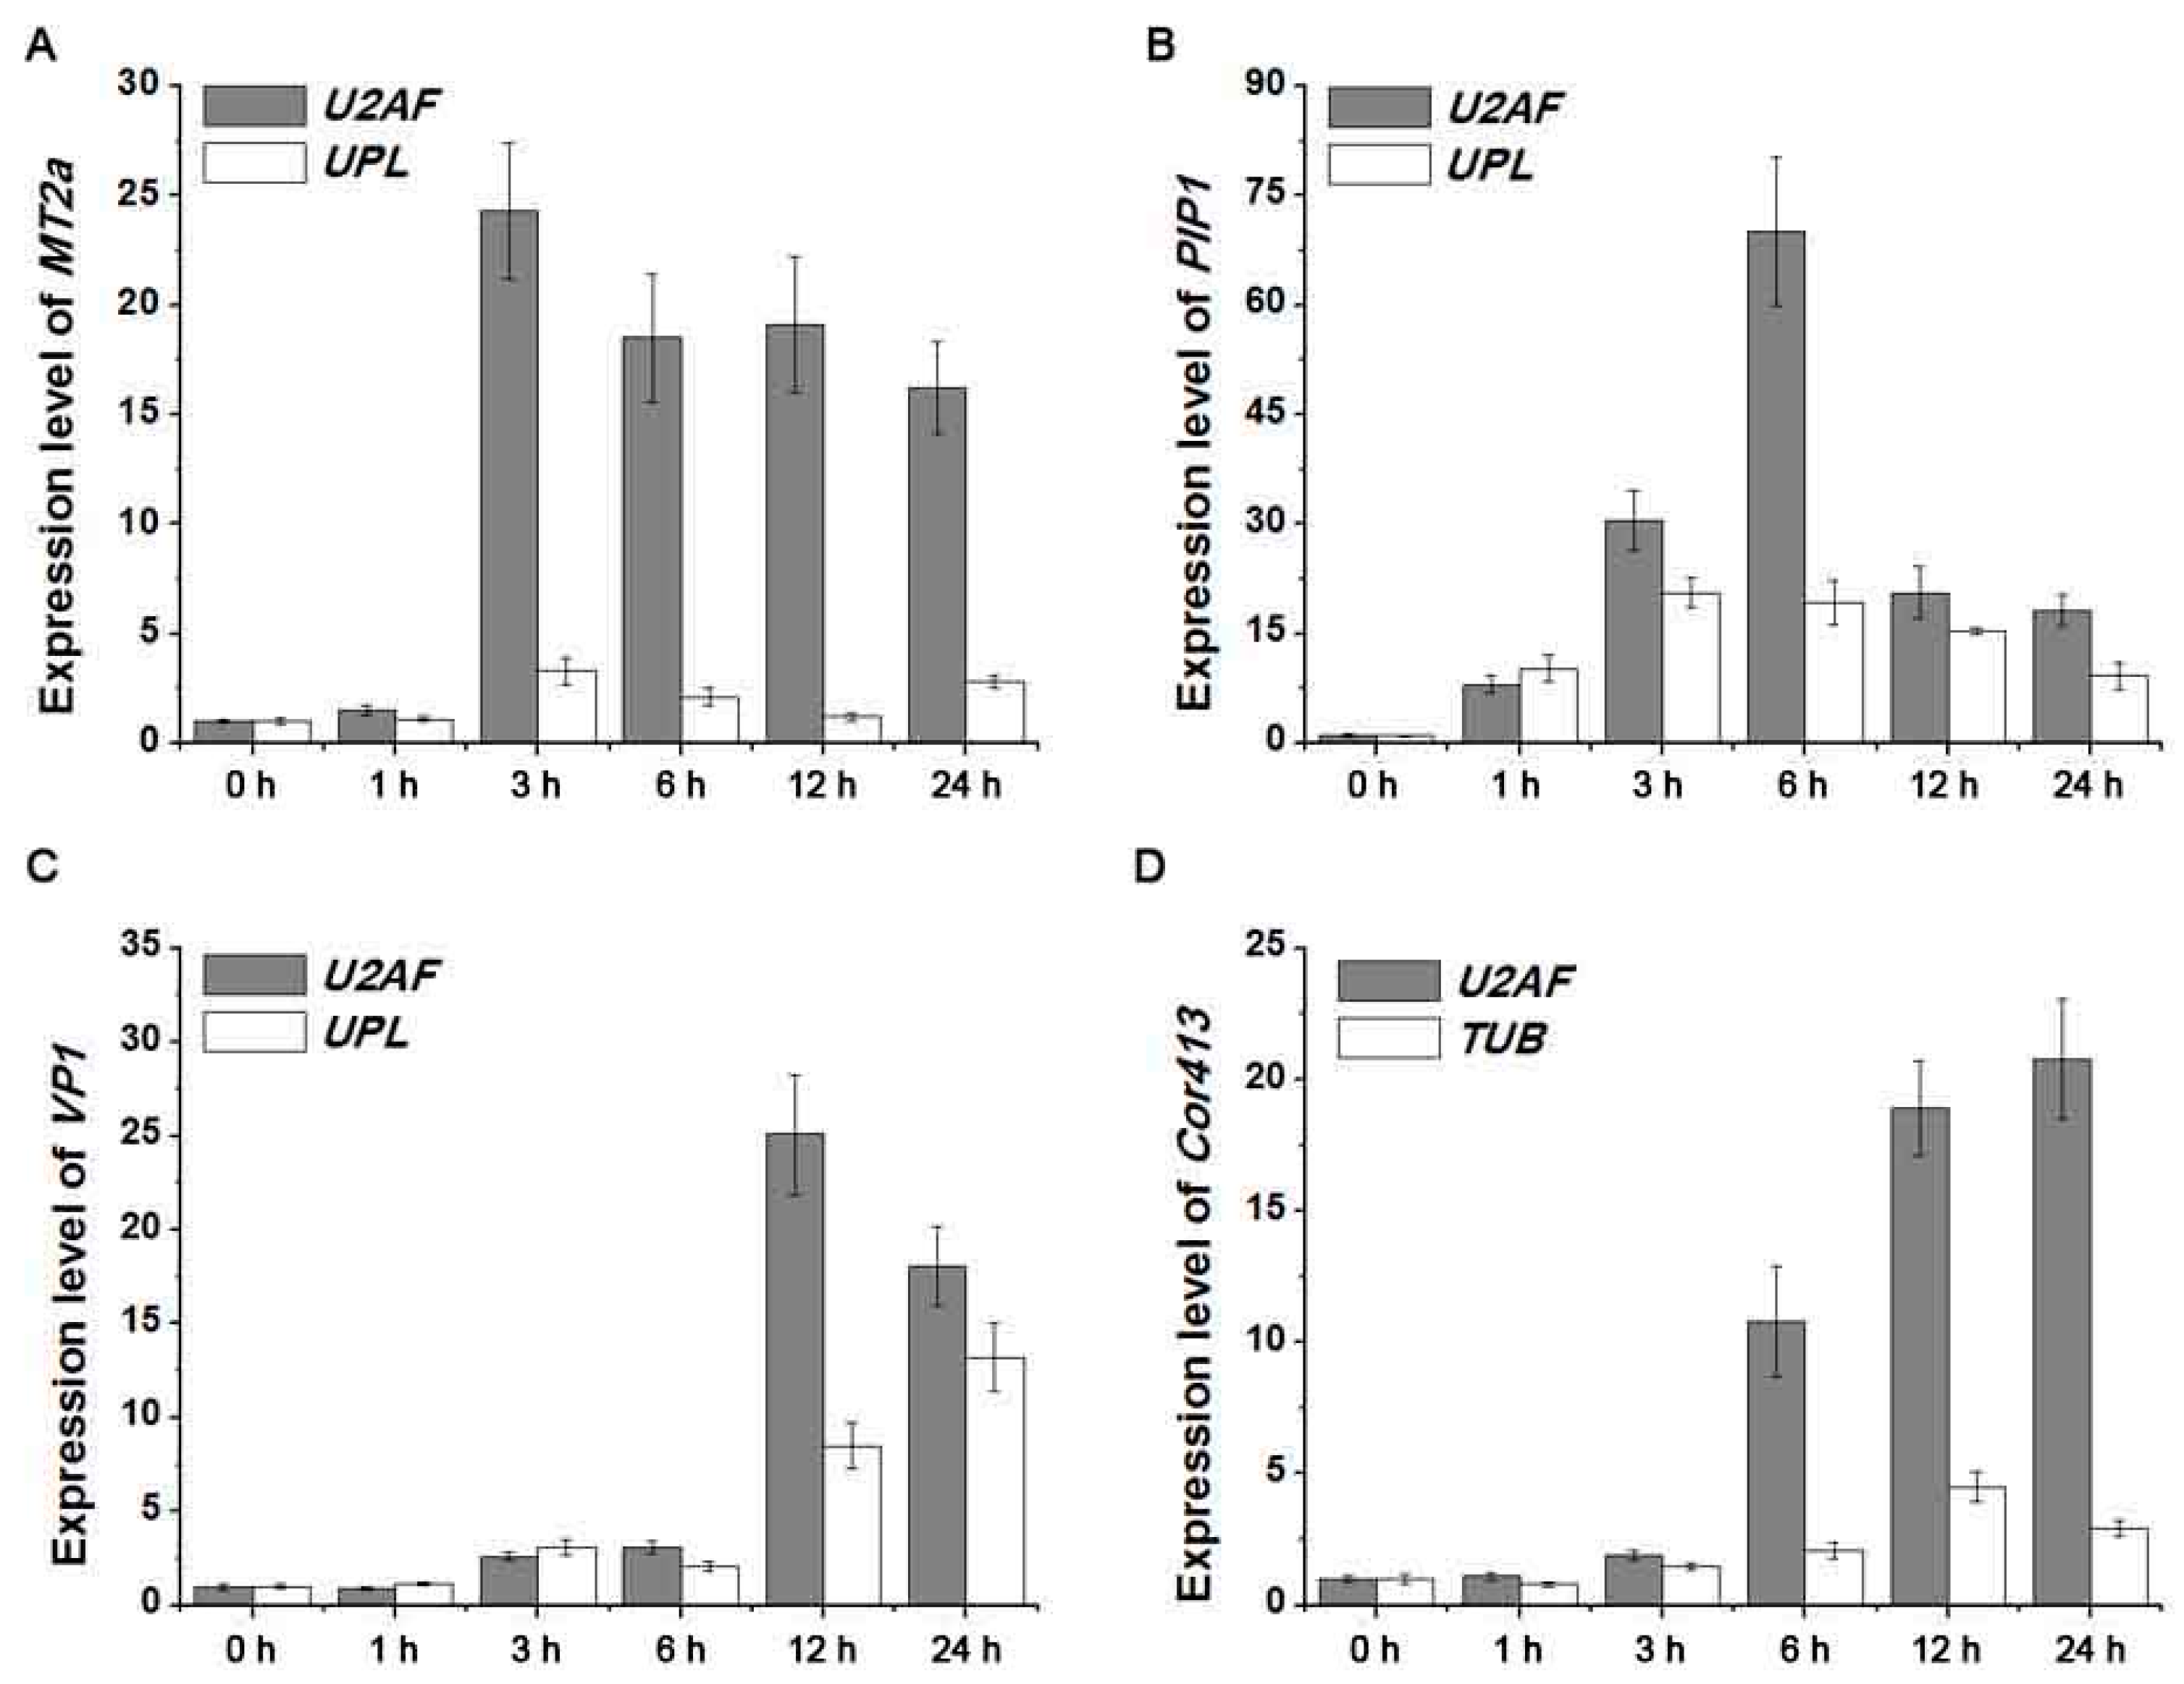
2.4. Detection of Four Target Gene Expression Levels Normalized by Screened Reference Genes

To confirm the utility of the reference genes, the expression patterns of four target genes were detected (Figure 5), including MT2a in cadmium-treated roots (CdR) samples, PIP1 in PEG-treated roots (PR) samples, VP1 in salt-treated roots (SR) samples, and Cor413 in cold-treated leaves (CL) samples. The most stable reference gene, U2AF, and two unstable genes, UPL and TUB, were selected for qRT-PCR analysis out of the four samples, and the results exhibited significant differences in fold changes and response timing (Figure 5). Under cadmium treatment, MT2a expression normalized by U2AF exhibited a 20-fold increase after 3 h, but showed a three-fold increase when normalized by UPL. The expression of PIP1 was highest at 6 h when controlled by reference gene U2AF but reached the same level of expression at 3 h when normalized by UPL. Similar differences were also found in SR and CL samples. These results demonstrate that the accuracy of qRT-PCR analysis could be altered by the use of different reference genes.

3. Discussion

Previous studies have shown that there is no single reference gene that can be used for the quantification of target gene expression levels for all experimental conditions or plant species. Reference genes have been identified for several perennial grass species, including Poa pratensis [4], Cynodon dactylon [8], Lolium perenne [17], Panicum virgatum [14], Agrostis stolonifera [18], and Festuca arundinacea [19]. This study is the first to identify several reference genes suitable for qRT-PCR normalization in both leaves and roots of seashore paspalum exposed to four abiotic stresses (salinity, heavy metal cadmium, drought, and cold).
In previous studies, geNorm, NormFinder, and BestKeeper, produced different results, because each of the three software have different calculation methods [8,18]. RefFinder, a comprehensive program that integrates data from geNorm, Normfinder, BestKeeper and the ΔCq method, is used to screen reference genes and obtain an accurate evaluation [8,13,18]. By interpreting results from four commonly used methods (GeNorm, NormFinder, BestKeeper, and RefFinder), several stable reference genes under different conditions in seashore paspalum were identified in this study. U2AF was reported to serve as a stable reference gene associated with nematode inoculation in Pinus massoniana [20]; however, its use as a stable reference gene for abiotic stresses has not yet been reported. The current study found that U2AF showed stable expression in most samples with the exception of leaves under salinity and drought stress in seashore paspalum. FBOX was used as a stable reference gene for the normalization of cold-stressed or salicylic acid-treated rapeseed (Brassica napus) and for different tissues, organs, and developmental stages of aromatic litsea (Litsea cubeba) [21,22], as well as for cadmium-stressed soybean (Glycine max) samples [23]. By contrast, FBOX exhibited unstable expression in large leaf gentian (Gentiana macrophylla) leaves and roots in response to silver and copper stress [24]. FBOX was the most stable reference gene for total samples, cadmium-treated roots, and cold-treated leaves in this study. The expression levels of PP2A and CACS in Bermuda grass were stable in roots and leaves under salt stress, in leaves under drought stress, and in roots exposed to cold and heat stress [8]. In previous studies on PEG-treated roots of buckwheat and C. intermedia, SAND was identified as having the most stable expression following abiotic stress [11,13]. The current study indicated that SAND and CACS in salt-treated leaves and PP2A in PEG- and cold-treated leaves exhibited stable expression.
It is particularly interesting to note that several reference genes exhibited differential expression patterns in seashore paspalum with respect to other grass species under same types of abiotic stresses. It was previously reported that UPL was the most stable reference gene in salt-treated roots and cold-treated roots of Bermuda grass and creeping bentgrass [8,18]; however, UPL exhibited the most unstable expression in salt-treated roots and cold-treated roots of seashore paspalum in this study. Several other widely used reference genes, including TUB, GAPDH, and EF1α, have been utilized for gene expression normalization in different plant species, but expression patterns in different species under different environmental conditions are variable [12,13,23]. EF1α and TUB showed the most stable expression under salinity and drought stress in soybean and black gram (Vigna mungo) [25,26] and under cold treatment in desert poplar (Populus euphratica) [27]. In this study, however, stabilities of EF1α and TUB were lower than those of several other reference genes under the four abiotic stresses. GAPDH was a more stable reference gene for PEG-treated leaves of buffalo grass (Buchloe dactyloides) [28], but it exhibited unstable expression in rice (Oryza sativa) under various environmental conditions [29]. In the current study, GAPDH showed stable expression in cadmium-treated leaves but unstable expression in salt-treated leaves. The results from this study, when compared to those produced previously by others, suggest that unique reference genes should be used for the accurate quantification of gene expression in seashore paspalum.
Expression levels of target genes were found to vary significantly when normalized using stable and unstable reference genes, which led to misinterpretation of experimental results. In this study, stabilities of reference genes were further validated by examining the expression patterns of four target genes. The results showed that expression patterns of the target genes in response to cadmium, salt, drought, and cold stress were variable due to the use of different references genes, indicating the importance of internal control genes for qRT-PCR analysis. The stable reference genes identified and validated in this study have provided accurate qRT-PCR results that may be used for target gene expression of seashore paspalum under different abiotic stresses in the future. Findings from this study will help facilitate the identification of stress-responsive genes and molecular mechanisms conferring stress tolerance to seashore paspalum in future work. The current results furthermore provide suitable resources for qRT-PCR analysis in other species closely related to seashore paspalum.

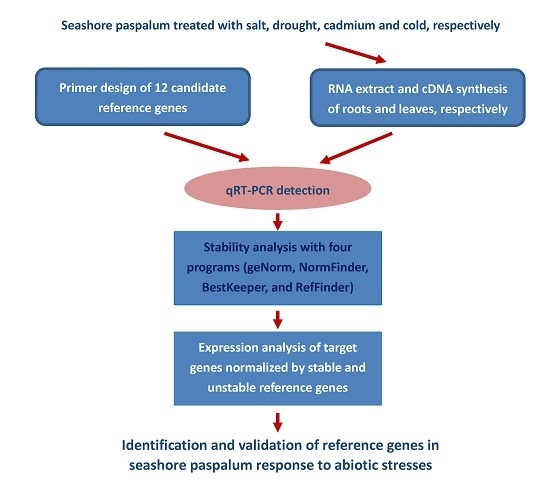
4. Materials and Methods

4.1. Plant Materials and Stress Treatments

Seashore paspalum (cv. ‘SeaIsle 2000’) was collected from field plots located at the Grass Research Centre of Nanjing Agricultural University in Nanjing, China. Stolons measuring 4–5 cm in length and having two nodes were hydroponically cultivated for 10 days in half strength Hoagland’s nutrient solution in a controlled-climate growth chamber (MT8070iE, shoreline Technology, Xubang, Jinan, China) with 12 h photoperiod (850 µmol photons m−2·s−1), 28/25 °C (day/night) and 60% relative humidity. Seedlings were transferred to nutrient solution containing 250 mM NaCl for salinity treatment, 1 mM cadmium for heavy metal treatment, or 20% PEG6000 for drought treatment. Cold stress was imposed at 3 °C in an incubator (Haier, Qingdao, China). Each treatment was performed using three biological replicates having three plants in each replicate. Leaves and roots were separately collected at 0, 1, 3, 6, 12, and 24 h of each treatment, and the tissue was immediately frozen in liquid nitrogen and stored at −80 °C for further analysis.

4.2. Total RNA Isolation and cDNA Synthesis

Total RNA was isolated according to the RNAiso kit (TaKaRa, Dalian, China) and was then treated with RNase-free DNaseI (TaKaRa). RNA concentration was detected spectrophotometrically (NanoDrop 2000, Thermo, Waltham, MA, USA) at wavelengths of 230, 260, and 280 nm, and the 260/280 nm ratio within the range of 1.80–2.20 and 260/230 nm ratio at approximately 2.00 were obtained. First-strand cDNA was synthesized based on 0.5 μg total RNA using the M-MLV reverse transcription system (TaKaRa), according to the manufacturer’s instructions. The cDNAs were diluted in a 1:20 ratio of CDNA to nuclease-free water prior to the qRT-PCR analyses.

4.3. Selection of Reference Genes and Primer Design

Arabidopsis nucleotide sequences from the potential reference genes served as query sequences for a TBLASTX search of the seashore paspalum transcriptome database (unpublished). Twelve candidate reference genes (EF1a, ACT, GAPDH, TUB, UPL, SAND, CACS, F-box, PP2A, CYP, U2AF, and TIP41) were identified and corresponding NCBI accession numbers and gene ontologies are given in Table 1. Specific primers for qRT-PCR were designed using Primer Premier 5.0 software to have melting temperatures between 55–65 °C, primer lengths between 19–24 bp, and amplicon lengths between 100–300 bp (Table 1).

4.4. qRT-PCR Analysis

The qRT-PCR procedure was performed using the LightCycler 480 SYBR Green I Master reaction system with a LightCycler 480 II instrument (Roche, Basel, Switzerland). Each 15-μL reaction mixture consisted of 7.5 μL of 2× concentrated SYBR Green I Master Mix, 5 μL of diluted cDNA, 0.4 μL of each primer (10 µM total), and 1.7 µL double-distilled water. The reaction conditions included an initial denaturation step at 95 °C for 10 min followed by 45 cycles of 95 °C for 15 s, 58 °C for 15 s, and 72 °C for 30 s, after which a melt curve was produced at 60–95 °C. Each qRT-PCR analysis was performed in triplicate.

4.5. Stability Analysis

Amplification efficiencies of each qRT-PCR were calculated by the slope of the line (E = 10slope), with the software LinRegPCR, based on Log (fluorescence) per cycle number data as an assumption-free method to calculate starting concentrations of mRNAs, which is available on request [30]. The stability of reference genes was determined with four programs, including GeNorm [1], NormFinder [31], BestKeeper [32] and RefFinder (available online: http://www.leonxie.com/referencegene.php). For GeNorm and NormFinder analysis, quantification cycle (Cq) values were converted into relative quantities using the formula 2−ΔCq, in which ΔCq = each corresponding Cq value-minimum Cq value. The expression stability measurement (M) was determined by the GeNorm program based on the average variations of a particular gene against all the other control genes in their expression levels. Through the NormFinder program, the stability value represented inter- and intra-group variation and lowest stability was ranked highest. The BestKeeper program was applied to measure the comparisons of the coefficient of variance (CV) and the standard deviation (SD), and the lowest SD and CV were used as detection indexes for the most stable reference genes. RefFinder was used to make a comprehensive analysis based on the data from GeNorm (M values), NormFinder (Stability values), BestKeeper (CV and SD), and ΔCq values.

4.6. Validation of Reference Genes by Expression Analysis of Four Stress-Related Genes under Abiotic Stresses

Previous reports showed that MT2a, VP1, PIP1, and Cor413 were responsive to various abiotic stresses [33,34,35,36]. The four homologs MT2a, VP1, PIP1, and Cor413 (Genbank accession numbers shown in Table 1) from seashore paspalum were obtained from the transcriptome data (unpublished). For the validation of selected reference genes from qRT-PCR data, the expression levels of these four genes were analyzed using the most stable and highly varying reference genes under different treatments, calculated using the 2−ΔΔCq method. Three technical replicates were performed for each biological sample.

4.7. Statistical Analysis

A one-way analysis of variance (ANOVA) was performed to calculate whether treatment means were statistically different from one another (p = 0.05) using the SPSS v13.0 software (IBM, Chicago, IL, USA).

5. Conclusions

This study provides the first systematic study for screening stable reference genes for use as the internal control in qRT-PCR analysis in leaves and roots of seashore paspalum under four different abiotic stresses. FBOX, U2AF, and PP2A could be applied as stable reference genes in future molecular studies that aim to understand the mechanisms of abiotic stress tolerance in seashore paspalum.

Acknowledgments

This work was supported by the program of National Natural Science Foundation of China (NSFC, 31672193) and the China Postdoctoral Science Foundation (2017M611842).

Author Contributions

Yu Liu, Jun Liu, Yu Chen, and Bingru Huang conceived the study and designed the experiments. Yu Liu, Jun Liu, and Yu Chen performed the experiments. Lei Xu and Hui Lai analyzed the data with suggestions from Yu Chen, Zhimin Yang, and Bingru Huang. Yu Liu and Yu Chen wrote the manuscript. All authors read and approved the final manuscript.

Conflicts of Interest

The authors declare no conflict of interest.

References

  1. Vandesompele, J.; de Preter, K.; Pattyn, F.; Poppe, B.; van Roy, N.; de Paepe, A.; Speleman, F. Accurate normalization of real-time quantitative RT-PCR data by geometric averaging of multiple internal control genes. Genome Biol. 2002, 3, RESEARCH0034. [Google Scholar] [CrossRef] [PubMed]
  2. Nicot, N.; Hausman, J.F.; Hoffmann, L.; Evers, D. Housekeeping gene selection for real-time RT-PCR normalization in potato during biotic and abiotic stress. J. Exp. Bot. 2005, 56, 2907–2914. [Google Scholar] [CrossRef] [PubMed]
  3. Saraiva, K.C.; Fernandes de Melo, D.; Morais, V.; Vasconcelos, I.; Costa, J. Selection of suitable soybean EF1α genes as internal controls for real-time PCR analyses of tissues during plant development and under stress conditions. Plant Cell. Rep. 2014, 33, 1453–1465. [Google Scholar] [CrossRef] [PubMed]
  4. Niu, K.; Shi, Y.; Ma, H. Selection of Candidate Reference Genes for Gene Expression Analysis in Kentucky Bluegrass (Poa pratensis L.) under Abiotic Stress. Front. Plant Sci. 2017, 8, 193. [Google Scholar] [CrossRef] [PubMed]
  5. Yang, Q.; Yin, J.; Li, G.; Qi, L.; Yang, F.; Wang, R. Reference gene selection for qRT-PCR in Caragana korshinskii Kom. under different stress conditions. Mol. Biol. Rep. 2014, 41, 2325–2334. [Google Scholar] [CrossRef] [PubMed]
  6. Bao, W.L.; Qu, Y.L.; Shan, X.Y.; Wan, Y.L. Screening and Validation of Housekeeping Genes of the Root and Cotyledon of Cunninghamia lanceolata under Abiotic Stresses by Using Quantitative Real-Time PCR. Int. J. Mol. Sci. 2016, 17, 1198. [Google Scholar] [CrossRef] [PubMed]
  7. Niu, L.J.; Tao, Y.B.; Chen, M.S.; Fu, Q.T.; Li, C.Q.; Dong, Y.L.; Wang, X.L.; He, H.Y.; Xu, Z.F. Selection of Reliable Reference Genes for Gene Expression Studies of a Promising Oilseed Crop, Plukenetia volubilis, by Real-Time Quantitative PCR. Int. J. Mol. Sci. 2015, 16, 12513–12530. [Google Scholar] [CrossRef] [PubMed]
  8. Chen, Y.; Tan, Z.; Hu, B.; Yang, Z.; Xu, B.; Zhuang, L.; Huang, B. Selection and validation of reference genes for target gene analysis with quantitative RT-PCR in leaves and roots of bermudagrass under four different abiotic stresses. Physiol. Plant 2015, 155, 138–148. [Google Scholar] [CrossRef] [PubMed]
  9. Zhang, Y.; Han, X.; Chen, S.; Zheng, L.; He, X.; Liu, M.; Qiao, G.; Wang, Y.; Zhuo, R. Selection of suitable reference genes for quantitative real-time PCR gene expression analysis in Salix matsudana under different abiotic stresses. Sci. Rep. 2017, 7, 40290. [Google Scholar] [CrossRef] [PubMed]
  10. Czechowski, T.; Stitt, M.; Altmann, T.; Udvardi, M.K.; Scheible, W.R. Genome-wide identification and testing of superior reference genes for transcript normalization in Arabidopsis. Plant Physiol. 2005, 139, 5–17. [Google Scholar] [CrossRef] [PubMed]
  11. Demidenko, N.V.; Logacheva, M.D.; Penin, A.A. Selection and validation of reference genes for quantitative real-time PCR in buckwheat (Fagopyrum esculentum) based on transcriptome sequence data. PLoS ONE 2011, 6, e19434. [Google Scholar] [CrossRef] [PubMed]
  12. Marum, L.; Miguel, A.; Ricardo, C.P.; Miguel, C. Reference gene selection for quantitative real-time PCR normalization in Quercus suber. PLoS ONE 2012, 7, e35113. [Google Scholar] [CrossRef]
  13. Zhu, J.; Zhang, L.; Li, W.; Han, S.; Yang, W.; Qi, L. Reference Gene Selection for Quantitative Real-time PCR Normalization in Caragana intermedia under Different Abiotic Stress Conditions. PLoS ONE 2013, 8, e53196. [Google Scholar] [CrossRef] [PubMed]
  14. Gimeno, J.; Eattock, N.; Van Deynze, A.; Blumwald, E. Selection and Validation of Reference Genes for Gene Expression Analysis in Switchgrass (Panicum virgatum) Using Quantitative Real-Time RT-PCR. PLoS ONE 2014, 9, e91474. [Google Scholar] [CrossRef] [PubMed]
  15. Chen, Y.; Chen, C.; Tan, Z.; Liu, J.; Zhuang, L.; Yang, Z.; Huang, B. Functional Identification and Characterization of Genes Cloned from Halophyte Seashore Paspalum Conferring Salinity and Cadmium Tolerance. Front. Plant Sci. 2016, 7, 102. [Google Scholar] [CrossRef] [PubMed]
  16. Pfaffl, M.W. A new mathematical model for relative quantification in real-time RT-PCR. Nucleic Acids Res. 2001, 29, e45. [Google Scholar] [CrossRef] [PubMed]
  17. Huang, L.; Yan, H.; Jiang, X.; Yin, G.; Zhang, X.; Qi, X.; Zhang, Y.; Yan, Y.; Ma, X.; Peng, Y. Identification of candidate reference genes in perennial ryegrass for quantitative RT-PCR under various abiotic stress conditions. PLoS ONE 2014, 9, e93724. [Google Scholar] [CrossRef] [PubMed]
  18. Chen, Y.; Hu, B.; Tan, Z.; Liu, J.; Yang, Z.; Li, Z.; Huang, B. Selection of reference genes for quantitative real-time PCR normalization in creeping bentgrass involved in four abiotic stresses. Plant Cell Rep. 2015, 34, 1825–1834. [Google Scholar] [CrossRef] [PubMed]
  19. Yang, Z.; Chen, Y.; Hu, B.; Tan, Z.; Huang, B. Identification and Validation of Reference Genes for Quantification of Target Gene Expression with Quantitative Real-time PCR for Tall Fescue under Four Abiotic Stresses. PLoS ONE 2015, 10, e0119569. [Google Scholar] [CrossRef] [PubMed]
  20. Wei, Y.C.; Liu, Q.H.; Dong, H.Y.; Zhou, Z.C.; Hao, Y.P.; Chen, X.L.; Xu, L.Y. Selection of Reference Genes for Real-Time Quantitative PCR in Pinus massoniana Post Nematode Inoculation. PLoS ONE 2016, 11, e0147224. [Google Scholar] [CrossRef] [PubMed]
  21. Lin, L.; Han, X.; Chen, Y.; Wu, Q.; Wang, Y. Identification of appropriate reference genes for normalizing transcript expression by quantitative real-time PCR in Litsea cubeba. Mol. Genet. Genom. 2013, 288, 727–737. [Google Scholar] [CrossRef] [PubMed]
  22. Wang, Z.; Chen, Y.; Fang, H.; Shi, H.; Chen, K.; Zhang, Z.; Tan, X. Selection of reference genes for quantitative reverse-transcription polymerase chain reaction normalization in Brassica napus under various stress conditions. Mol. Genet. Genom. 2014, 289, 1023–1035. [Google Scholar] [CrossRef] [PubMed]
  23. Gao, M.M.; Liu, Y.P.; Ma, X.; Shuai, Q.; Gai, J.Y.; Li, Y. Evaluation of Reference Genes for Normalization of Gene Expression Using Quantitative RT-PCR under Aluminum, Cadmium, and Heat Stresses in Soybean. PLoS ONE 2017, 12, e0168965. [Google Scholar] [CrossRef] [PubMed]
  24. He, Y.H.; Yan, H.L.; Hua, W.P.; Huang, Y.Y.; Wang, Z.Z. Selection and Validation of Reference Genes for Quantitative Real-time PCR in Gentiana macrophylla. Front. Plant Sci. 2016, 7, 945. [Google Scholar] [CrossRef] [PubMed]
  25. Kundu, A.; Patel, A.; Pal, A. Defining reference genes for qPCR normalization to study biotic and abiotic stress responses in Vigna mungo. Plant Cell Rep. 2013, 32, 1647–1658. [Google Scholar] [CrossRef] [PubMed]
  26. Ma, S.H.; Niu, H.W.; Liu, C.J.; Zhang, J.; Hou, C.Y.; Wang, D.M. Expression Stabilities of Candidate Reference Genes for RT-qPCR under Different Stress Conditions in Soybean. PLoS ONE 2013, 8, e75271. [Google Scholar] [CrossRef] [PubMed]
  27. Wang, H.L.; Chen, J.; Tian, Q.; Wang, S.; Xia, X.; Yin, W. Identification and validation of reference genes for Populus euphratica gene expression analysis during abiotic stresses by quantitative real-time PCR. Physiol. Plant 2014, 152, 529–545. [Google Scholar] [CrossRef] [PubMed]
  28. Li, W.; Qian, Y.Q.; Han, L.; Liu, J.X.; Sun, Z.Y. Identification of suitable reference genes in buffalo grass for accurate transcript normalization under various abiotic stress conditions. Gene 2014, 547, 55–62. [Google Scholar] [CrossRef] [PubMed]
  29. Jain, M.; Nijhawan, A.; Tyagi, A.K.; Khurana, J.P. Validation of housekeeping genes as internal control for studying gene expression in rice by quantitative real-time PCR. Biochem. Biophys. Res. Commun. 2006, 345, 646–651. [Google Scholar] [CrossRef] [PubMed]
  30. Ruijter, J.M.; Ramakers, C.; Hoogaars, W.M.; Karlen, Y.; Bakker, O.; van den Hoff, M.J.; Moorman, A.F. Amplification efficiency: Linking baseline and bias in the analysis of quantitative PCR data. Nucleic Acids Res. 2009, 37, e45. [Google Scholar] [CrossRef] [PubMed]
  31. Andersen, C.L.; Jensen, J.L.; Orntoft, T.F. Normalization of real-time quantitative reverse transcription-PCR data: A model-based variance estimation approach to identify genes suited for normalization, applied to bladder and colon cancer data sets. Cancer Res. 2004, 64, 5245–5250. [Google Scholar] [CrossRef] [PubMed]
  32. Pfaffl, M.W.; Tichopad, A.; Prgomet, C.; Neuvians, T.P. Determination of stable housekeeping genes, differentially regulated target genes and sample integrity: BestKeeper−Excel-based tool using pair-wise correlations. Biotechnol. Lett. 2004, 26, 509–515. [Google Scholar] [CrossRef] [PubMed]
  33. Chen, Y.; Jiang, J.; Chang, Q.; Gu, C.; Song, A.; Chen, S.; Dong, B.; Chen, F. Cold acclimation induces freezing tolerance via antioxidative enzymes, proline metabolism and gene expression changes in two chrysanthemum species. Mol. Biol. Rep. 2014, 41, 815–822. [Google Scholar] [CrossRef] [PubMed]
  34. Chen, Y.; Li, L.; Zong, J.; Chen, J.; Guo, H.; Guo, A.; Liu, J. Heterologous expression of the halophyte Zoysia matrella H+-pyrophosphatase gene improved salt tolerance in Arabidopsis thaliana. Plant Physiol. Biochem. 2015, 91, 49–55. [Google Scholar] [CrossRef] [PubMed]
  35. Zhou, S.; Hu, W.; Deng, X.; Ma, Z.; Chen, L.; Huang, C.; Wang, C.; Wang, J.; He, Y.; Yang, G.; He, G. Overexpression of the wheat aquaporin gene, TaAQP7, enhances drought tolerance in transgenic tobacco. PLoS ONE 2012, 7, e52439. [Google Scholar] [CrossRef] [PubMed]
  36. Gu, C.S.; Liu, L.Q.; Zhao, Y.H.; Deng, Y.M.; Zhu, X.D.; Huang, S.Z. Overexpression of Iris lactea var. chinensis metallothionein llMT2a enhances cadmium tolerance in Arabidopsis thaliana. Ecotoxicol. Environ. Safe 2014, 105, 22–28. [Google Scholar] [CrossRef] [PubMed]
Figure 1. Primer specificity. Melting curves of 12 genes (EF1αa, CACS, GAPDH, TIP41, SAND, ACT, TUB, PP2A, FBOX, UPL, CYP, and U2AF) showing single peaks.
Ijms 18 01322 g001
Figure 2. The quantification cycle (Cq) values of the 12 candidate reference genes across all samples under four abiotic stresses. Lines across the box plot of Cq value represent the median values. Lower and upper boxes show the 25th percentile to the 75th percentile. Whiskers represent the maximum and minimum values.
Ijms 18 01322 g002
Figure 3. Gene expression stability values (M) and rankings of 12 reference genes as assayed by geNorm. The most stable genes are on the left and the least stable genes are on the right.
Ijms 18 01322 g003
Figure 4. Pairwise variation (V) of the candidate reference genes calculated by geNorm. Vn/Vn+1 values were used to determine the optimal number of reference genes.
Ijms 18 01322 g004
Figure 5. Relative expression of four target genes. (A) MT2a expression detection normalized by reference genes U2AF and UPL; (B) PIP1 expression detection normalized by reference genes U2AF and UPL; (C) VP1 expression detection normalized by reference genes U2AF and UPL; (D) Cor413 expression detection normalized by reference genes U2AF and TUB.
Ijms 18 01322 g005
Table 1. Reference genes and primer sequences.
Gene SymbolGene NameGenBank AccessionArabidopsis Homolog Locus5′-Primer Sequences (Forward/Reverse)-3′Amplicon Length (bp)
EF1aElongation factor 1aKU049721AT5G60390GCGGACTGTGCTGTGCTTATC/AGTGGTGGCATCCATCTTGTT153
CACSClathrin adaptor complex subunitKX268090AT5G46630CACTGTCGAGTGGGTTCGCTAC/GCCGATGAATTTTACTTGTTGC109
GAPDHGlyceraldehyde 3-phosphate dehydrogenaseKX268091AT1G13440GTCGCATGGTACGACAACGAGT/ACGGAAAACAAAAGGCAACTCA221
TIP41TIP41-like family proteinKX268092AT4G34270TGATGAGATTGAGGGATACTCG/TACAGACGGTGGTCACCTTTGG244
SANDSAND family proteinKX268093AT2G28390CGGGGATTATGTTCTATTTTGC/TTATGGTACTGCCTGTGTCGGT266
ACTActin 7KX268094AT5G09810CTTCTCTCAGCACTTTCCAACA/AAACATAACCTGCAATCTCTCC162
TUBAlpha TubulinKX268095AT5G19780GTCGGTGAGGGTATGGAGGAAG/ATGGAAACACACAGCAGCAGTT237
PP2AProtein phosphatase 2AKX268096AT1G13320TAAGGTACTACGCAAACCAAGC/CAACACAATACATACACAGCACACA289
FBOXF-box/kelch-repeat proteinKX268097AT5G15710GTGCTAGCCAGCTCTGCAATAG/ACACATCCGACATCAACGATTC184
UPLE3 ubiquitin protein ligaseKX268098AT3G53090TACTTGGATTCAAATACCTACAGCC/TTAGAACCCCAGAAACACCGCT250
CYPCyclophilinKX268099AT2G29960CTGGAAGAGATACAAACGGATC/GCCACTAATGACAGTTATAGAACG275
U2AFSplicing factor U2afKX268100AT5G42820AGGAGCCCAGTCAGGGAAA/CACGCAGAATAGCAACTCAAAT190
MT2aMetallothionein2aKX268101AT3G09390CAGACTCTCGTCATGGGCGT/TCTCATCGGATCAGGTAGCA247
VP1vacuolar H+-pyrophosphatase 1KX268102AT1G15690GTCCCTCAACATCCTCATCAAG/TAAGTCTAAGGTAACGCCTCCA281
PIP1plasma membrane intrinsic protein 1KX268103AT4G00430AGGGCCATCCCGTTCAAGAG/ATAACAGCGGCGGCATATTA239
Cor413cold-regulated 413 plasma membrane proteinKX268104AT3G50830TCAGGAACGCCTTCAGGAAG/GGATGGCAGAGGAGCACACT134
Table 2. Amplification efficiency of qRT-PCR for 12 reference genes.
GeneCdLCdRPLPRSLSRCLCR
ACT1.93 ± 0.011.96 ± 0.031.95 ± 0.021.93 ± 0.021.97 ± 0.021.92 ± 0.021.95 ± 0.031.94 ± 0.01
CACS1.94 ± 0.021.97 ± 0.021.93 ± 0.021.92 ± 0.021.96 ± 0.021.96 ± 0.011.92 ± 0.021.97 ± 0.02
EF1α1.98 ± 0.011.93 ± 0.011.96 ± 0.031.93 ± 0.011.94 ± 0.041.94 ± 0.021.96 ± 0.021.95 ± 0.03
FBOX1.93 ± 0.021.94 ± 0.031.97 ± 0.031.96 ± 0.021.95 ± 0.021.93 ± 0.021.94 ± 0.021.93 ± 0.02
GADPH1.91 ± 0.021.95 ± 0.021.93 ± 0.021.96 ± 0.021.92 ± 0.021.94 ± 0.031.91 ± 0.021.97 ± 0.02
UPL1.93 ± 0.021.95 ± 0.021.95 ± 0.031.97 ± 0.021.95 ± 0.031.92 ± 0.021.94 ± 0.031.93 ± 0.03
SAND1.94 ± 0.021.95 ± 0.021.94 ± 0.011.96 ± 0.031.93 ± 0.011.95 ± 0.021.94 ± 0.021.96 ± 0.01
TUB1.96 ± 0.011.95 ± 0.011.94 ± 0.021.97 ± 0.021.94 ± 0.031.96 ± 0.031.95 ± 0.031.97 ± 0.02
TIP411.96 ± 0.021.91 ± 0.021.90 ± 0.021.91 ± 0.021.95 ± 0.021.90 ± 0.031.93 ± 0.031.91 ± 0.02
CYP1.93 ± 0.021.94 ± 0.011.94 ± 0.011.96 ± 0.031.93 ± 0.011.95 ± 0.021.94 ± 0.021.96 ± 0.01
PP2A1.95 ± 0.021.96 ± 0.021.95 ± 0.021.96 ± 0.021.93 ± 0.031.97 ± 0.031.89 ± 0.031.96 ± 0.02
U2AF1.96 ± 0.011.93 ± 0.011.89 ± 0.021.92 ± 0.021.94 ± 0.021.91 ± 0.031.91 ± 0.021.92 ± 0.01
CdL and CdR: cadmium-treated leaves and roots, respectively; PL and PR: PEG-treated leaves and roots, respectively; SL and SR: salt-treated leaves and roots, respectively; CL and CR: cold-treated leaves and roots, respectively.
Table 3. Stability analysis of reference genes assayed by NormFinder software.
TotalStabilityCdLStabilityCdRStabilityPLStabilityPRStabilitySLStabilitySRStabilityCLStabilityCRStability
FBOX0.519U2AF0.374U2AF0.223UPL0.391U2AF0.392SAND0.461U2AF0.383U2AF0.326U2AF0.294
ACT0.604GAPDH0.444FBOX0.37PP2A0.402GAPDH0.397CACS0.54FBOX0.455PP2A0.392TIP410.458
U2AF0.67ACT0.471TIP410.376EF1α0.466EF1α0.522TUB0.594CYP0.512FBOX0.443GAPDH0.465
PP2A0.673UPL0.506EF1α0.441SAND0.474FBOX0.535PP2A0.618TUB0.519GAPDH0.48CYP0.525
TIP410.703PP2A0.529GAPDH0.474TUB0.563TIP410.55EF1α0.669TIP410.553CYP0.529TUB0.528
CYP0.773SAND0.53CYP0.478FBOX0.583ACT0.592FBOX0.674CACS0.562SAND0.535FBOX0.555
GAPDH0.778TIP410.594TUB0.484CACS0.618CYP0.687CYP0.738GAPDH0.656ACT0.577ACT0.555
CACS0.811CYP0.606ACT0.519ACT0.638CACS0.687ACT0.755EF1α0.657TIP410.651CACS0.589
SAND0.963FBOX0.619SAND0.527U2AF0.724TUB0.689UPL0.775ACT0.681EF1α0.755PP2A0.694
TUB1.073CACS0.689CACS0.553GAPDH0.857PP2A0.73TIP410.9PP2A0.769CACS0.776EF1α0.869
EF1α1.131TUB0.747PP2A0.815TIP410.953SAND0.999U2AF0.948SAND1.059UPL0.886SAND1.036
UPL1.496EF1α0.833UPL1.163CYP1.09UPL1.612GAPDH1.042UPL1.355TUB1.497UPL1.154
Total: pooled samples from all treatments; CdL and CdR: cadmium-treated leaves and roots, respectively; PL and PR: PEG-treated leaves and roots, respectively; SL and SR: salt-treated leaves and roots, respectively; CL and CR: cold-treated leaves and roots, respectively.
Table 4. Stability analysis of reference genes assayed by BestKeeper software.
RankTotalCV ± SDCdLCV ± SDCdRCV ± SDPLCV ± SDPRCV ± SDSLCV ± SDSRCV ± SDCLCV ± SDCRCV ± SD
1FBOX2.95 ± 0.80FBOX1.61 ± 0.44FBOX1.36 ± 0.35UPL1.42 ± 0.41U2AF2.62 ± 0.67PP2A2.43 ± 0.54U2AF2.28 ± 0.55FBOX1.89 ± 0.52FBOX1.09 ± 0.28
2U2AF3.15 ± 0.79U2AF1.73 ± 0.44U2AF1.58 ± 0.38TUB1.51 ± 0.36FBOX3.67 ± 1.03ACT2.62 ± 0.53ACT2.44 ± 0.47CACS1.92 ± 0.48CACS1.62 ± 0.37
3ACT3.39 ± 0.68UPL1.85 ± 0.54TUB1.96 ± 0.42FBOX1.52 ± 0.41CACS3.75 ± 0.91CYP3.63 ± 0.81PP2A2.49 ± 0.53U2AF1.95 ± 0.51EF1α1.88 ± 0.35
4TIP413.67 ± 1.04CACS1.89 ± 0.47GAPDH2.02 ± 0.39EF1α1.86 ± 0.41ACT3.79 ± 0.79TUB2.00 ± 0.48FBOX2.54 ± 0.67PP2A2.15 ± 0.50TUB2.13 ± 0.46
5SAND3.77 ± 0.99SAND1.92 ± 0.50TIP412.04 ± 0.56SAND1.92 ± 0.49TUB3.81 ± 0.89CACS2.84 ± 0.69CACS2.56 ± 0.58TIP412.32 ± 0.67U2AF2.32 ± 0.58
6UPL4.10 ± 1.22ACT1.97 ± 0.40CACS2019 ± 0.49U2AF1.95 ± 0.49TIP414.02 ± 1.17EF1α3.46 ± 0.74TUB2.75 ± 0.61CYP2.33 ± 0.55ACT2.47 ± 0.48
7GAPDH4.18 ± 0.84GAPDH2.02 ± 0.40ACT2.44 ± 0.47CACS2.04 ± 0.49EF1α4.17 ± 0.85FBOX1.55 ± 0.42EF1α2.75 ± 0.53EF1α2.47 ± 0.54GAPDH2.78 ± 0.56
8PP2A4.32 ± 0.97PP2A2.04 ± 0.46PP2A2.46 ± 0.52PP2A2.10 ± 0.47GAPDH4.20 ± 0.90SAND1.80 ± 0.47CYP2.86 ± 0.60ACT2.56 ± 0.52TIP412.85 ± 0.79
9CACS4.50 ± 1.07CYP2.17 ± 0.49EF1α2.54 ± 0.49ACT2.36 ± 0.48CYP4.83 ± 1.12TIP413.45 ± 0.96TIP413.44 ± 0.95SAND2.58 ± 0.68CYP3.13 ± 0.67
10TUB4.70 ± 1.08TIP412.54 ± 0.72CYP2.60 ± 0.54GAPDH3.41 ± 0.69PP2A4.89 ± 1.16GAPDH4.66 ± 0.92SAND3.83 ± 0.99GAPDH2.96 ± 0.59UPL3.35 ± 1.01
11CYP4.74 ± 1.06TUB2.7 ± 0.66SAND2.65 ± 0.67TIP413.58 ± 1.01UPL5.33 ± 1.67UPL2.39 ± 0.68GAPDH4.03 ± 0.79UPL3.09 ± 0.90PP2A3.63 ± 0.81
12EF1α5.74 ± 1.18EF1α3.22 ± 0.69UPL3.04 ± 0.89CYP3.89 ± 0.90SAND5.42 ± 1.49U2AF2.89 ± 0.75UPL4.08 ± 1.22TUB4.21 ± 0.97SAND4.47 ± 1.17
Total: pooled samples from all treatments; CdL and CdR: cadmium-treated leaves and roots, respectively; PL and PR: PEG-treated leaves and roots, respectively; SL and SR: salt-treated leaves and roots, respectively; CL and CR: cold-treated leaves and roots, respectively.
Table 5. Most stable and least stable combination of reference genes based on RefFinder analysis.
Experimental Treatments
TotalCdLCdRPLPRSLSRCLCR
MostLeastMostLeastMostLeastMostLeastMostLeastMostLeastMostLeastMostLeastMostLeast
FBOXUPLU2AFEF1aU2AFUPLUPLCYPU2AFUPLSANDGAPDHU2AFUPLU2AFTUBU2AFUPL
ACT GAPDH FBOX PP2A ACT CACS CYP PP2A GAPDH
U2AF EF1a FBOX
PP2A

