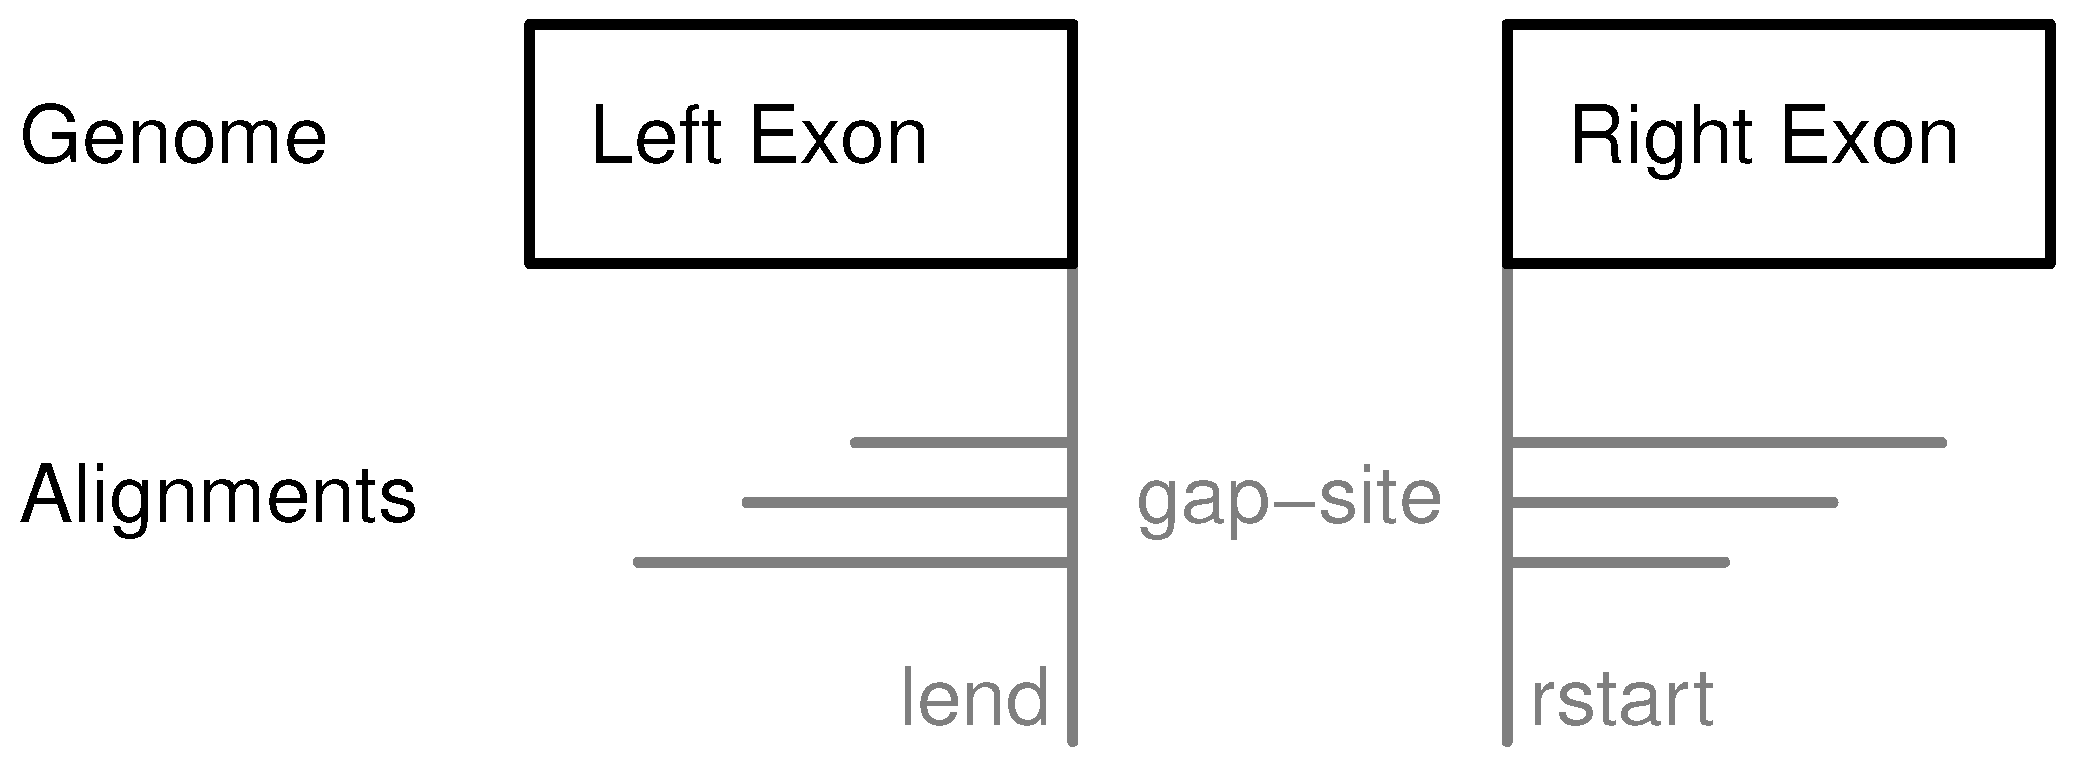
Figure 1.
Definition of gap-sites. Since no strand information is provided by alignments, gap-site positions are defined reading direction of genomic sequence (left to right). lend is defined as position of last exonic nucleotide on the left side. rstart is defined as position of first exonic nucleotide on right side. The “left” and “right” side are directions on genomic reference sequence, defined by lower and higher position coordinates respectively relative to the actual reading position (in accordance with common reading orientation). The gap-site is covered by three alignments (nAligns = 3).
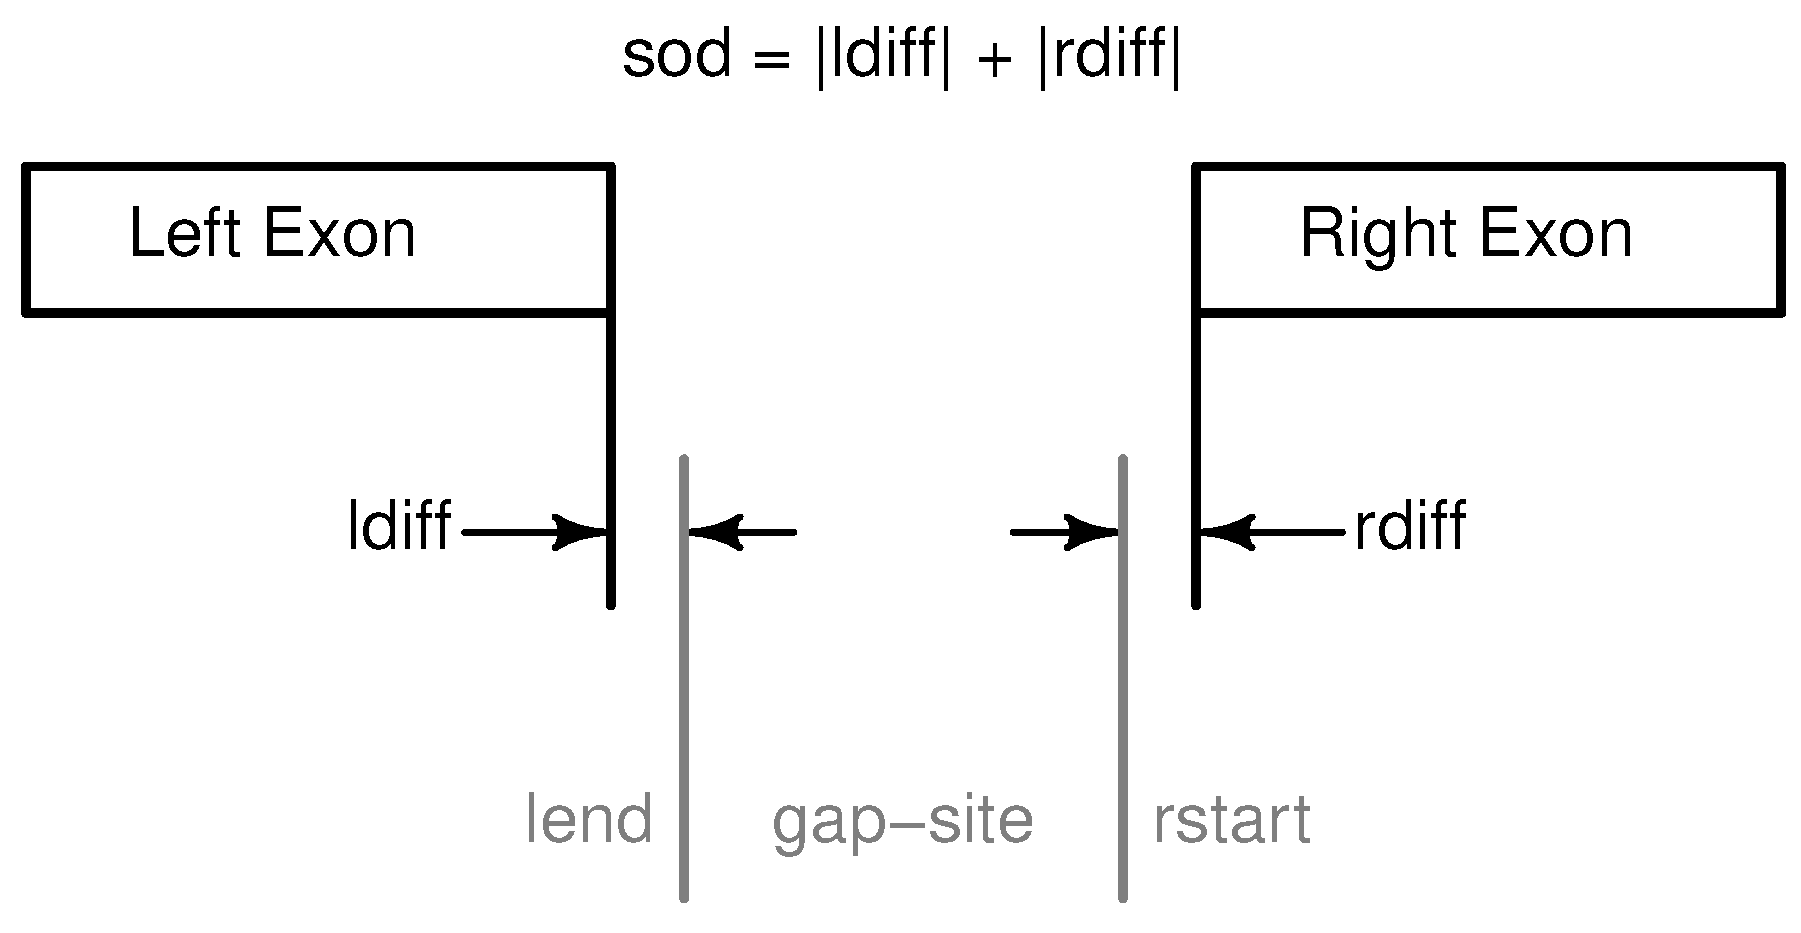
Figure 2.
Annotation of gap-sites in R package refGenome. Annotation of a gap-sites as implemented in (CRAN) R package refGenome. Distance to annotated sites is expressed in sod (sum of distances, ≥0). Note that in Ensembl annotation (GTF-files) the two exons are represented as two distinct features.
Figure 3.
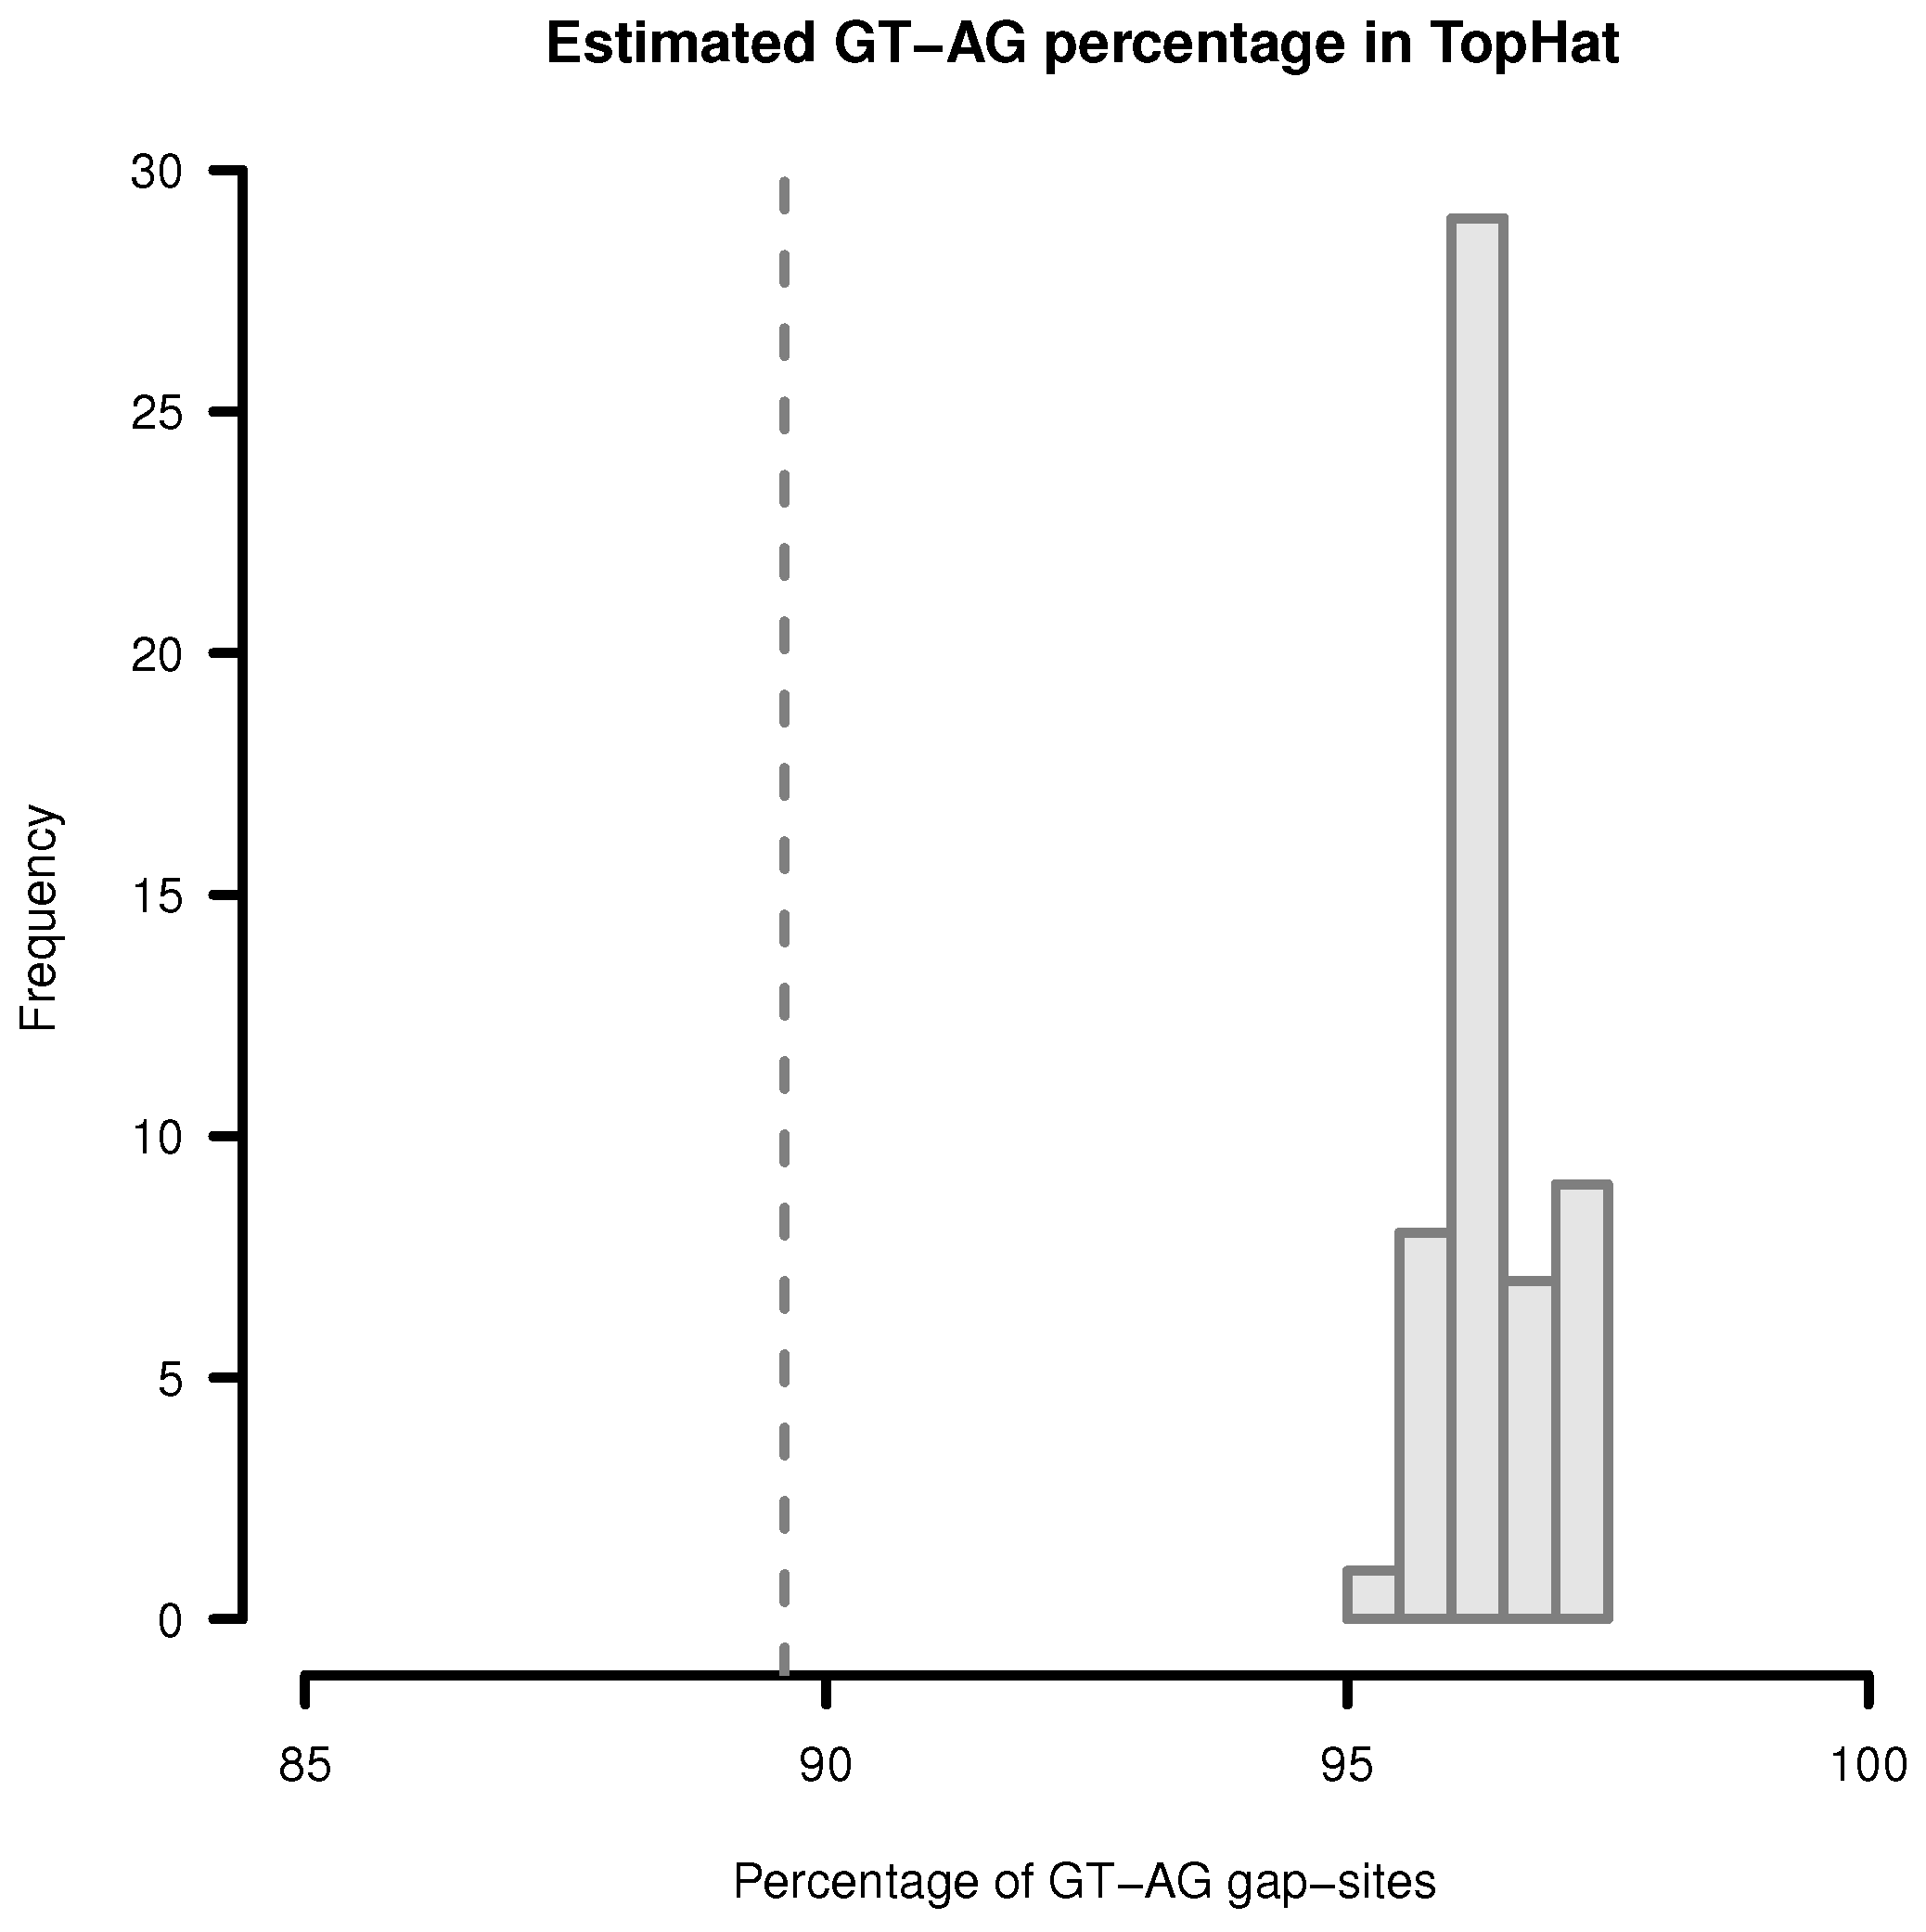
Estimation of GT-AG-site percentage in gap-sites reported by TopHat. Upper limit for percentage of GT-AG gap-sites (estimated by adding proportions of GT-AG and CT-AG) in TopHat alignments. Gap-sites were collected 54 times from single transcriptomes (vertical bars). Dashed vertical line (89.6%) indicates estimated percentage when gap-sites are collected from the complete batch of 54 transcriptomes.
Figure 3.
Estimation of GT-AG-site percentage in gap-sites reported by TopHat. Upper limit for percentage of GT-AG gap-sites (estimated by adding proportions of GT-AG and CT-AG) in TopHat alignments. Gap-sites were collected 54 times from single transcriptomes (vertical bars). Dashed vertical line (89.6%) indicates estimated percentage when gap-sites are collected from the complete batch of 54 transcriptomes.
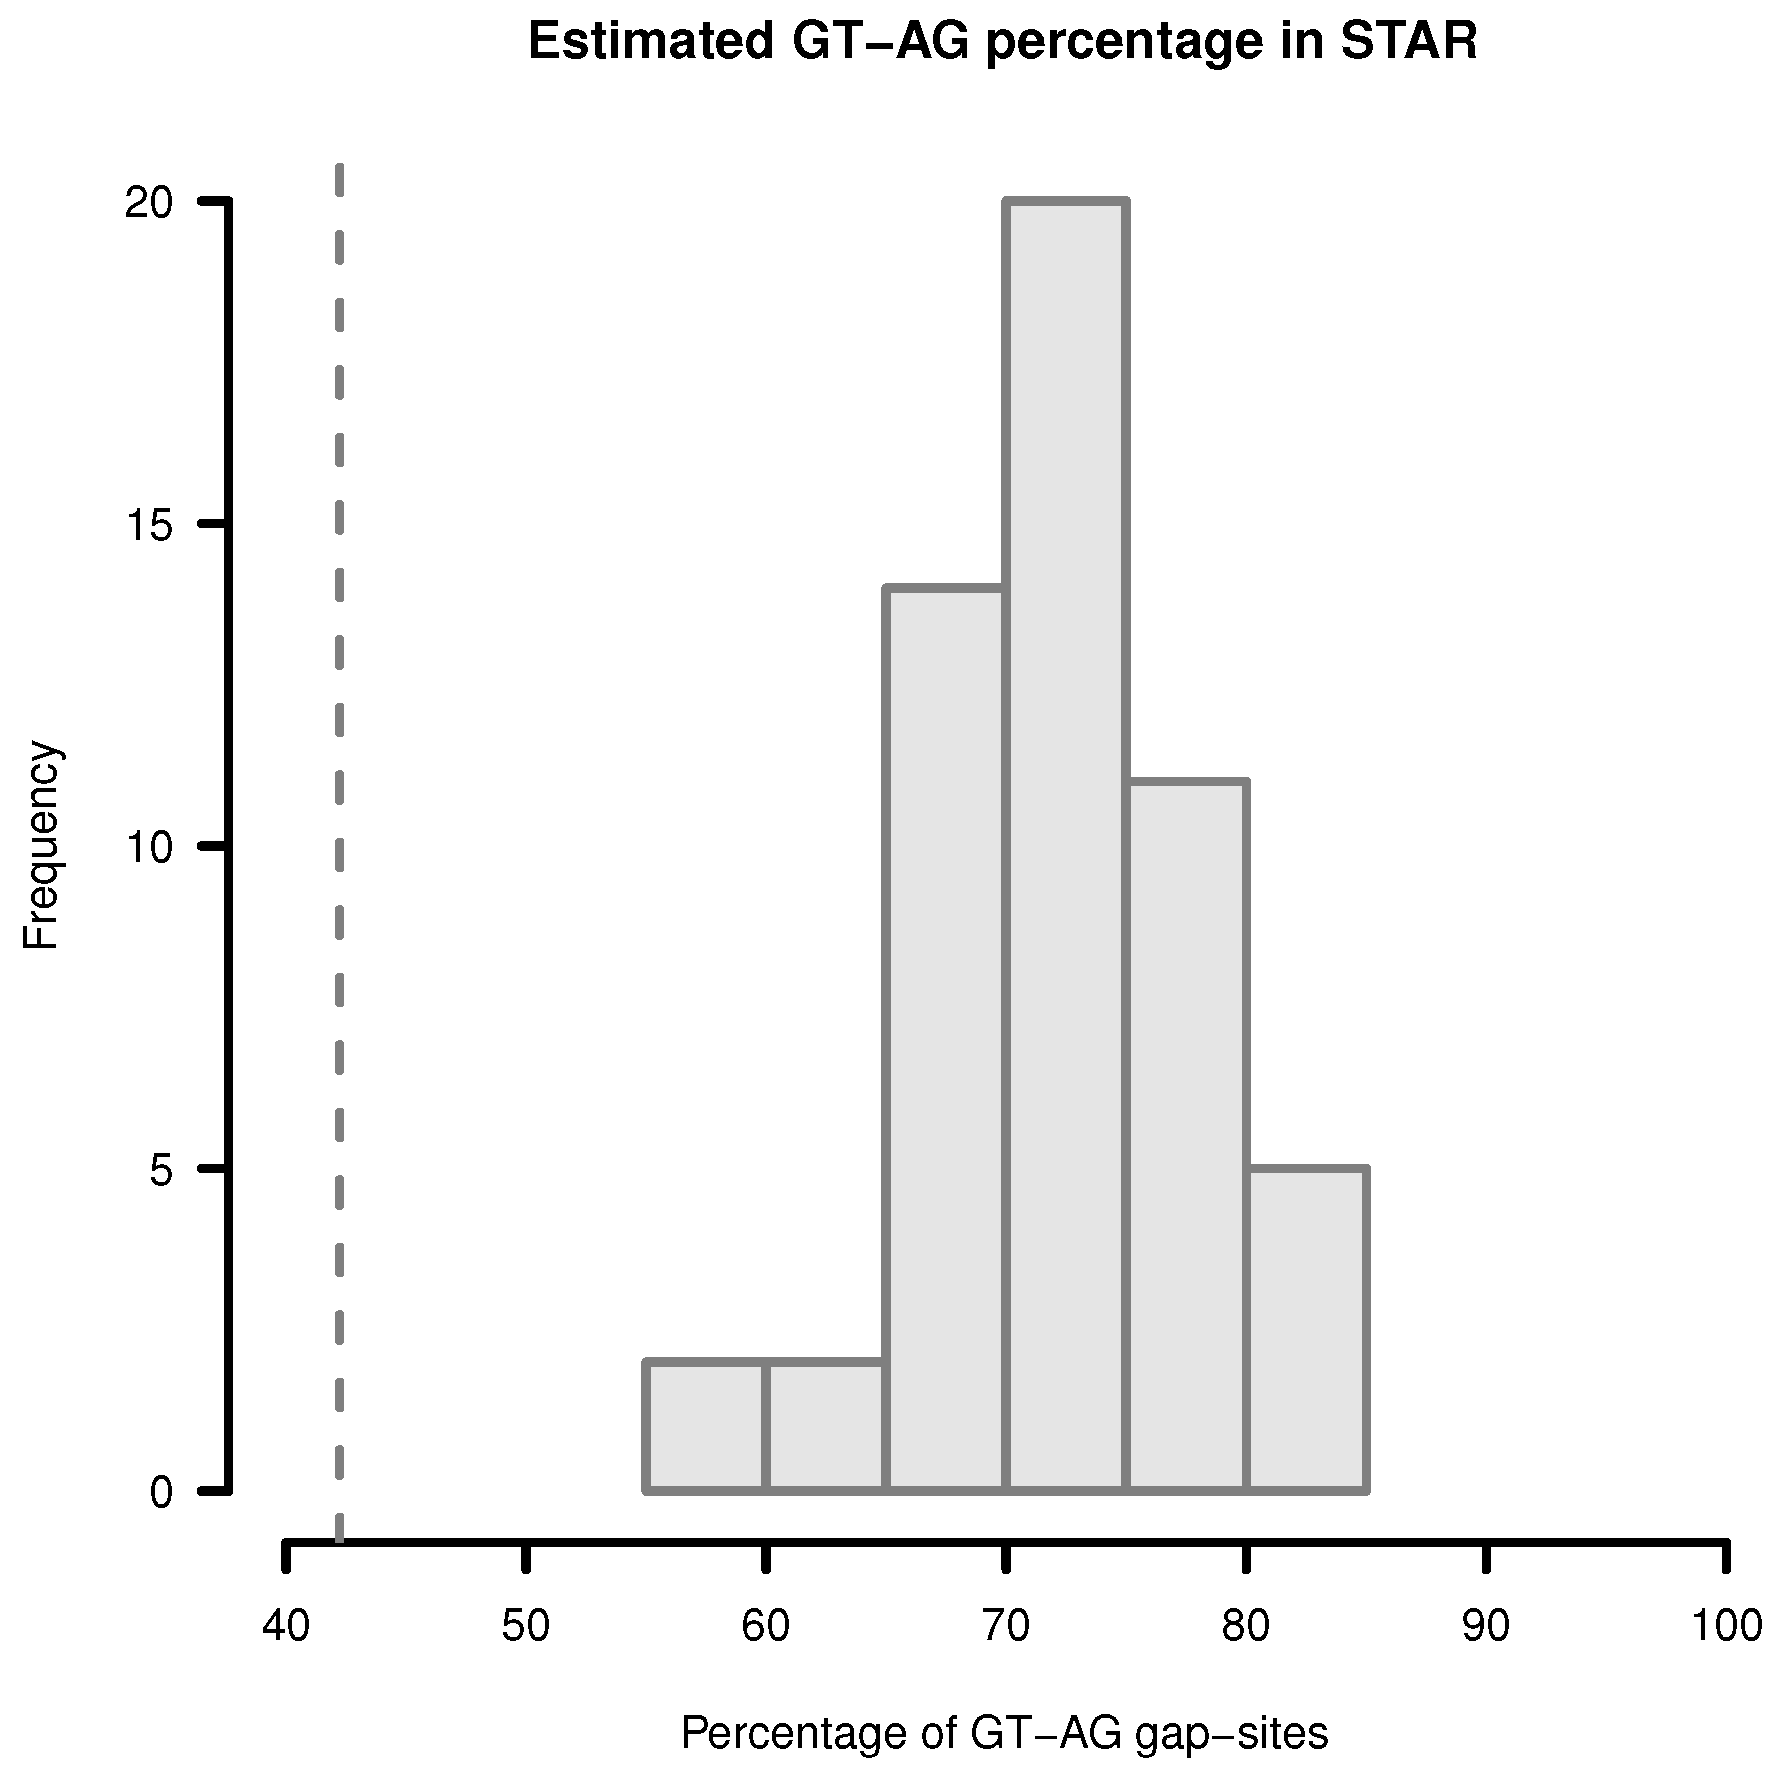
Figure 4.
Estimation of GT-AG-site percentage in gap-sites reported by STAR. Upper limit for percentage of GT-AG gap-sites (added proportions of GT-AG and CT-AG) in STAR alignments. Gap-sites were collected 54 times from single transcriptomes (vertical bars). Dashed vertical line (42.2%) indicates estimated percentage when gap-sites are collected from the complete batch of 54 transcriptomes.
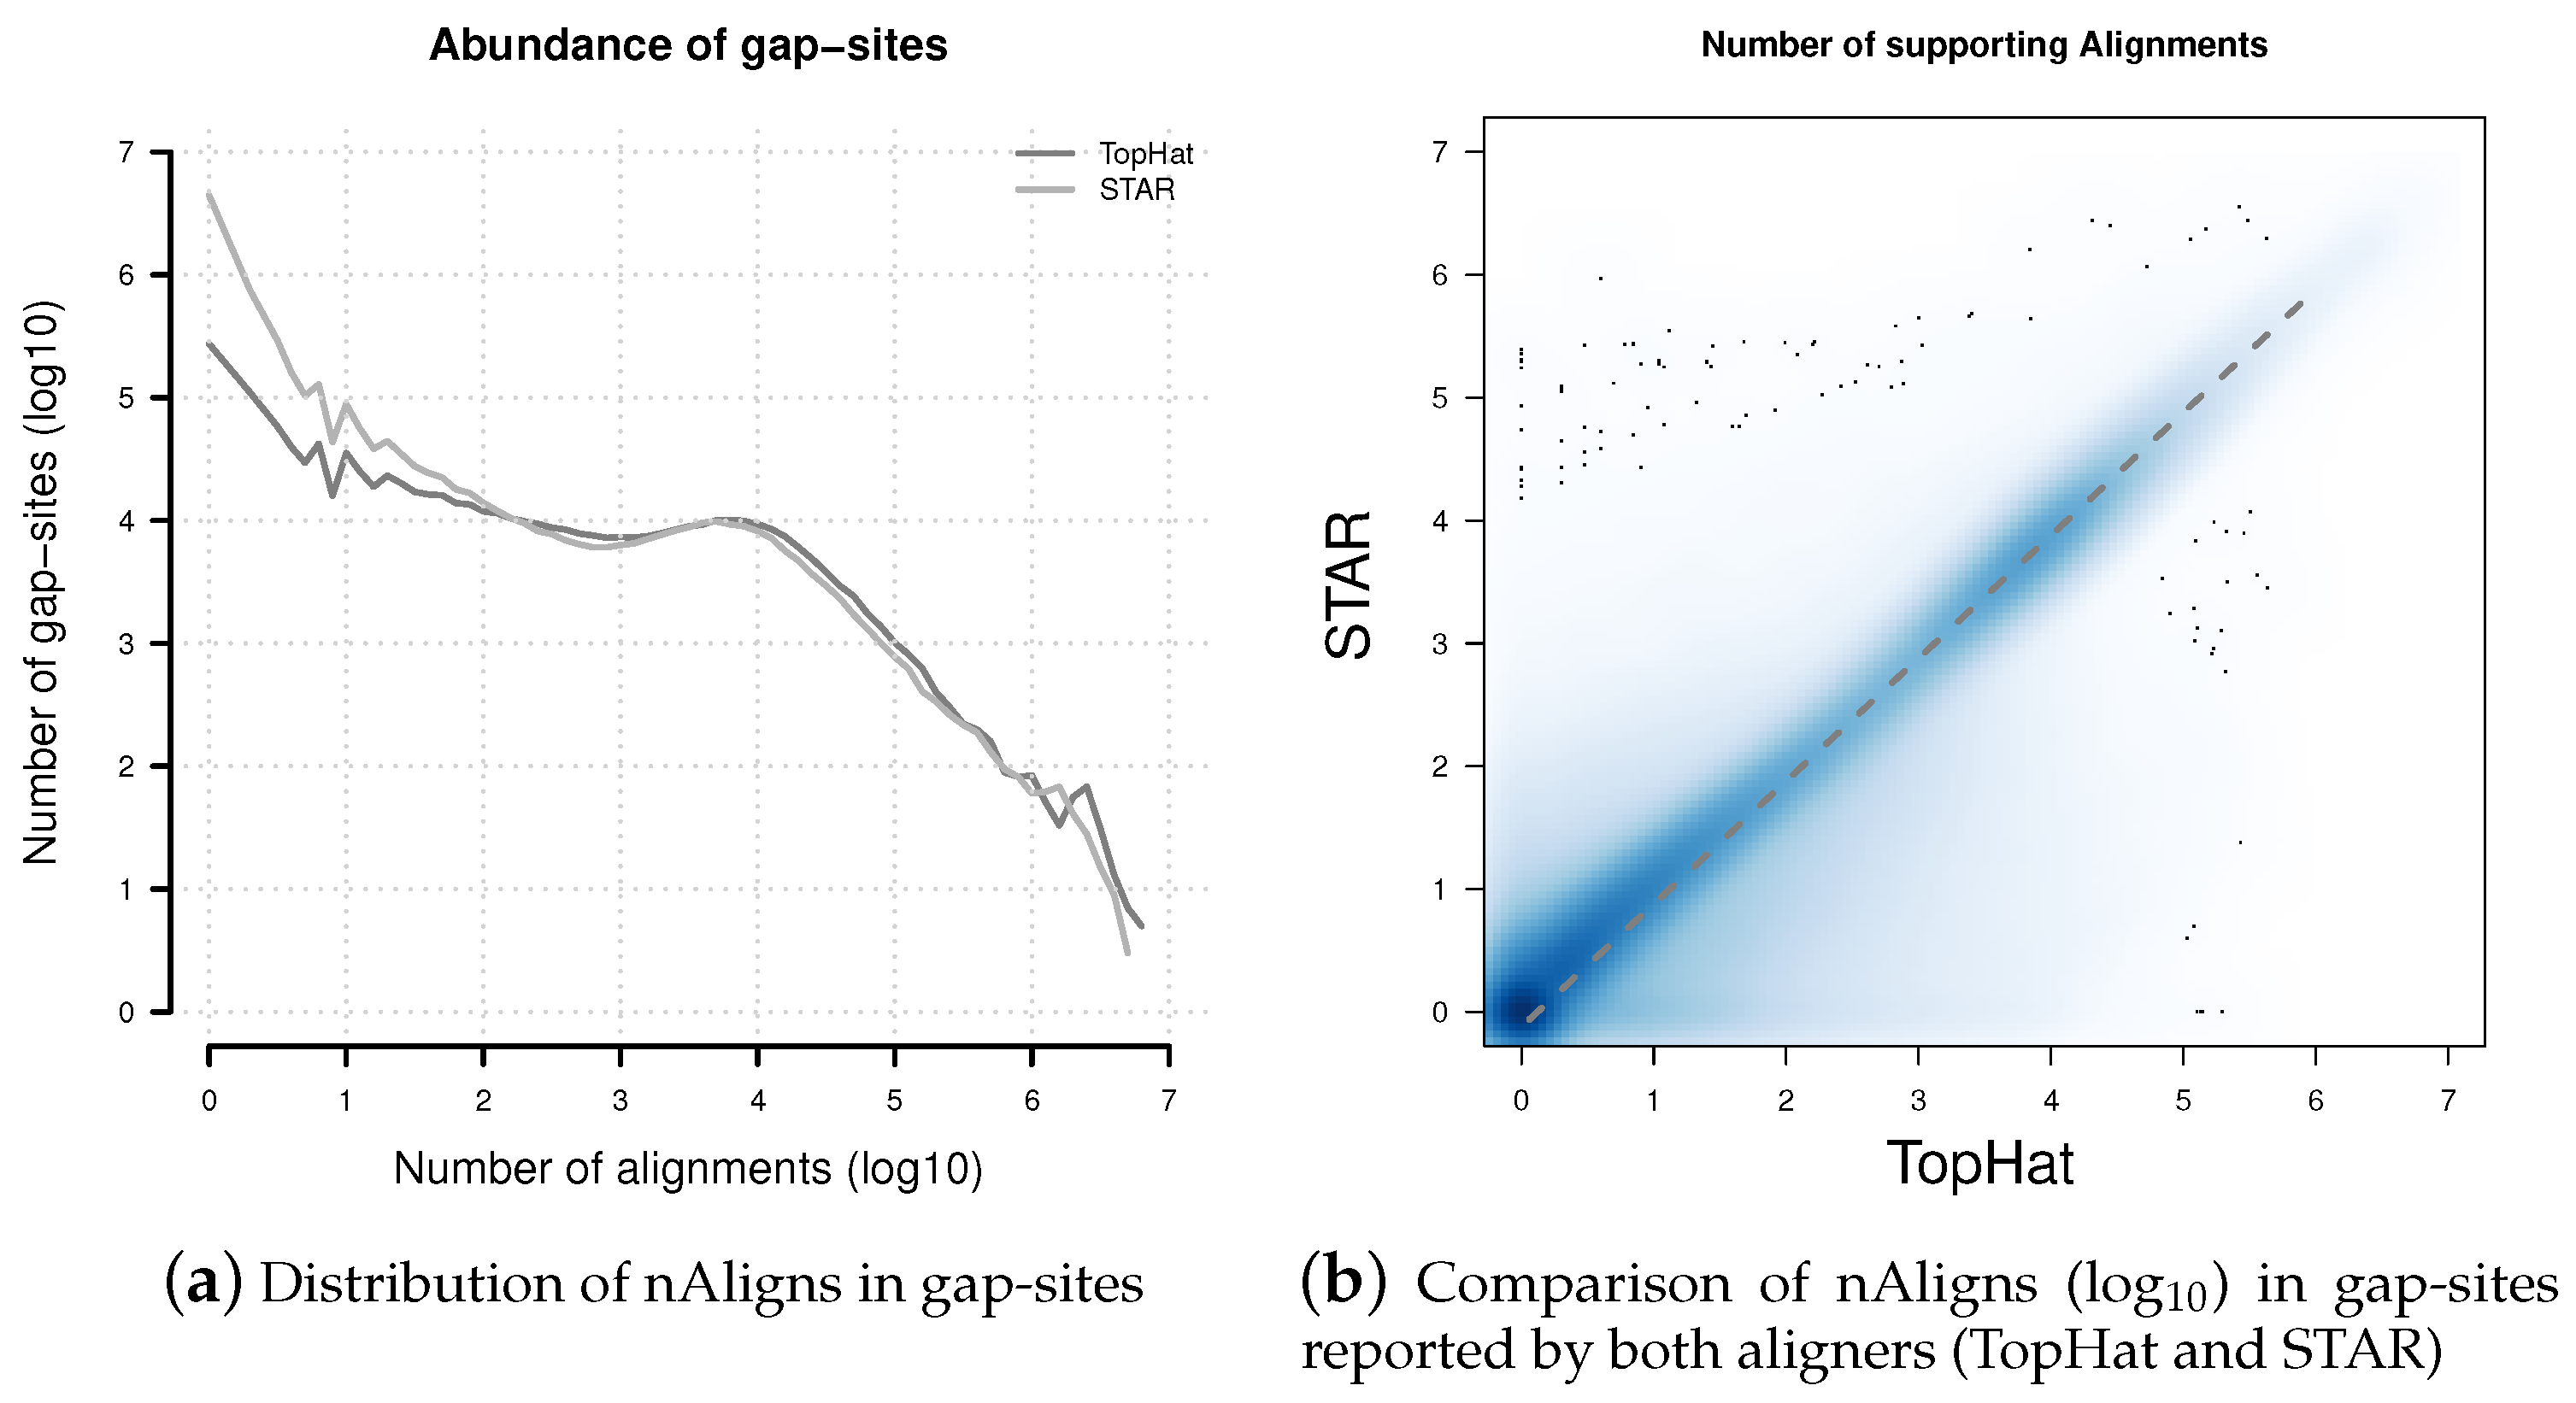
Figure 5.
Distribution of nAligns values in gap-sites present in TopHat and STAR alignments. (a) Distribution of alignment coverage on gap-sites reported by TopHat and STAR; (b) Alignment coverage on gap-sites reported by both aligners (TopHat and STAR). The dashed line represents data from a linear regression model: nAlignsSTAR = 0.756 × nAlignsTopHat. Coordinates of both axes in both sub-figures are logarithmised (log10).
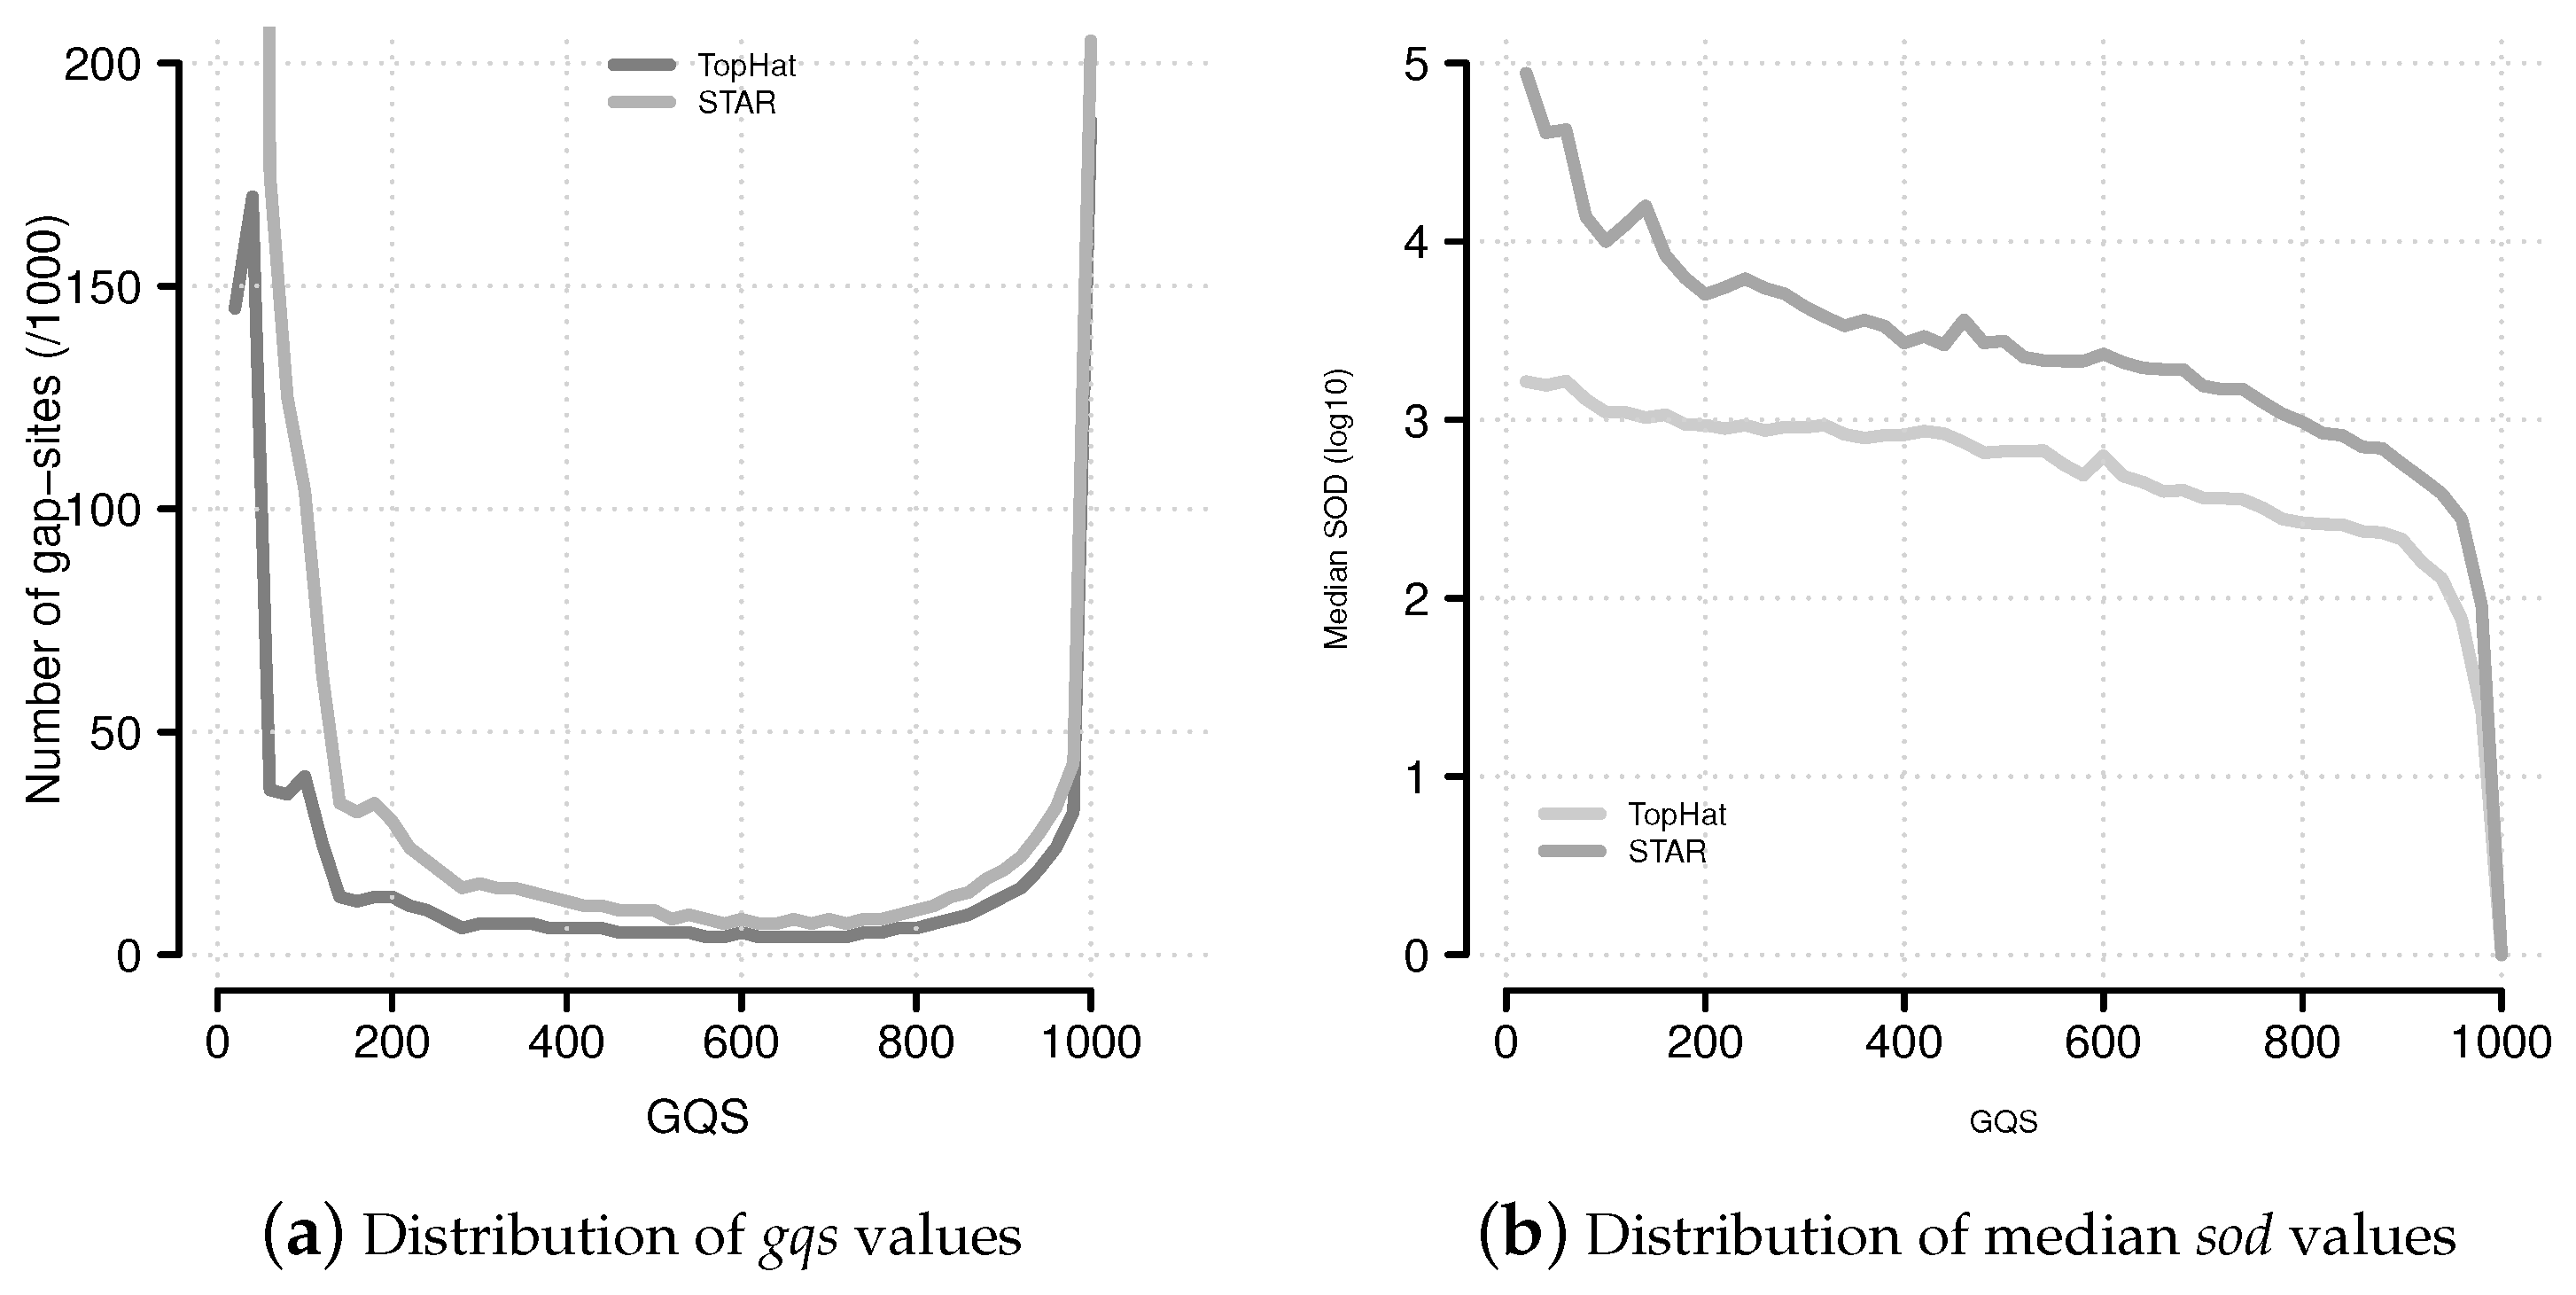
Figure 6.
Distribution of
gqs and
sod values. (
a) The distribution of
gqs values follows a characteristic U-shaped pattern. This pattern is similar to the multiplicity of events (
Supplemental Data Figure 9); (
b) Median
sod (distance of gap-site to annotated site) values for
gqs categories.
Figure 6.
Distribution of
gqs and
sod values. (
a) The distribution of
gqs values follows a characteristic U-shaped pattern. This pattern is similar to the multiplicity of events (
Supplemental Data Figure 9); (
b) Median
sod (distance of gap-site to annotated site) values for
gqs categories.
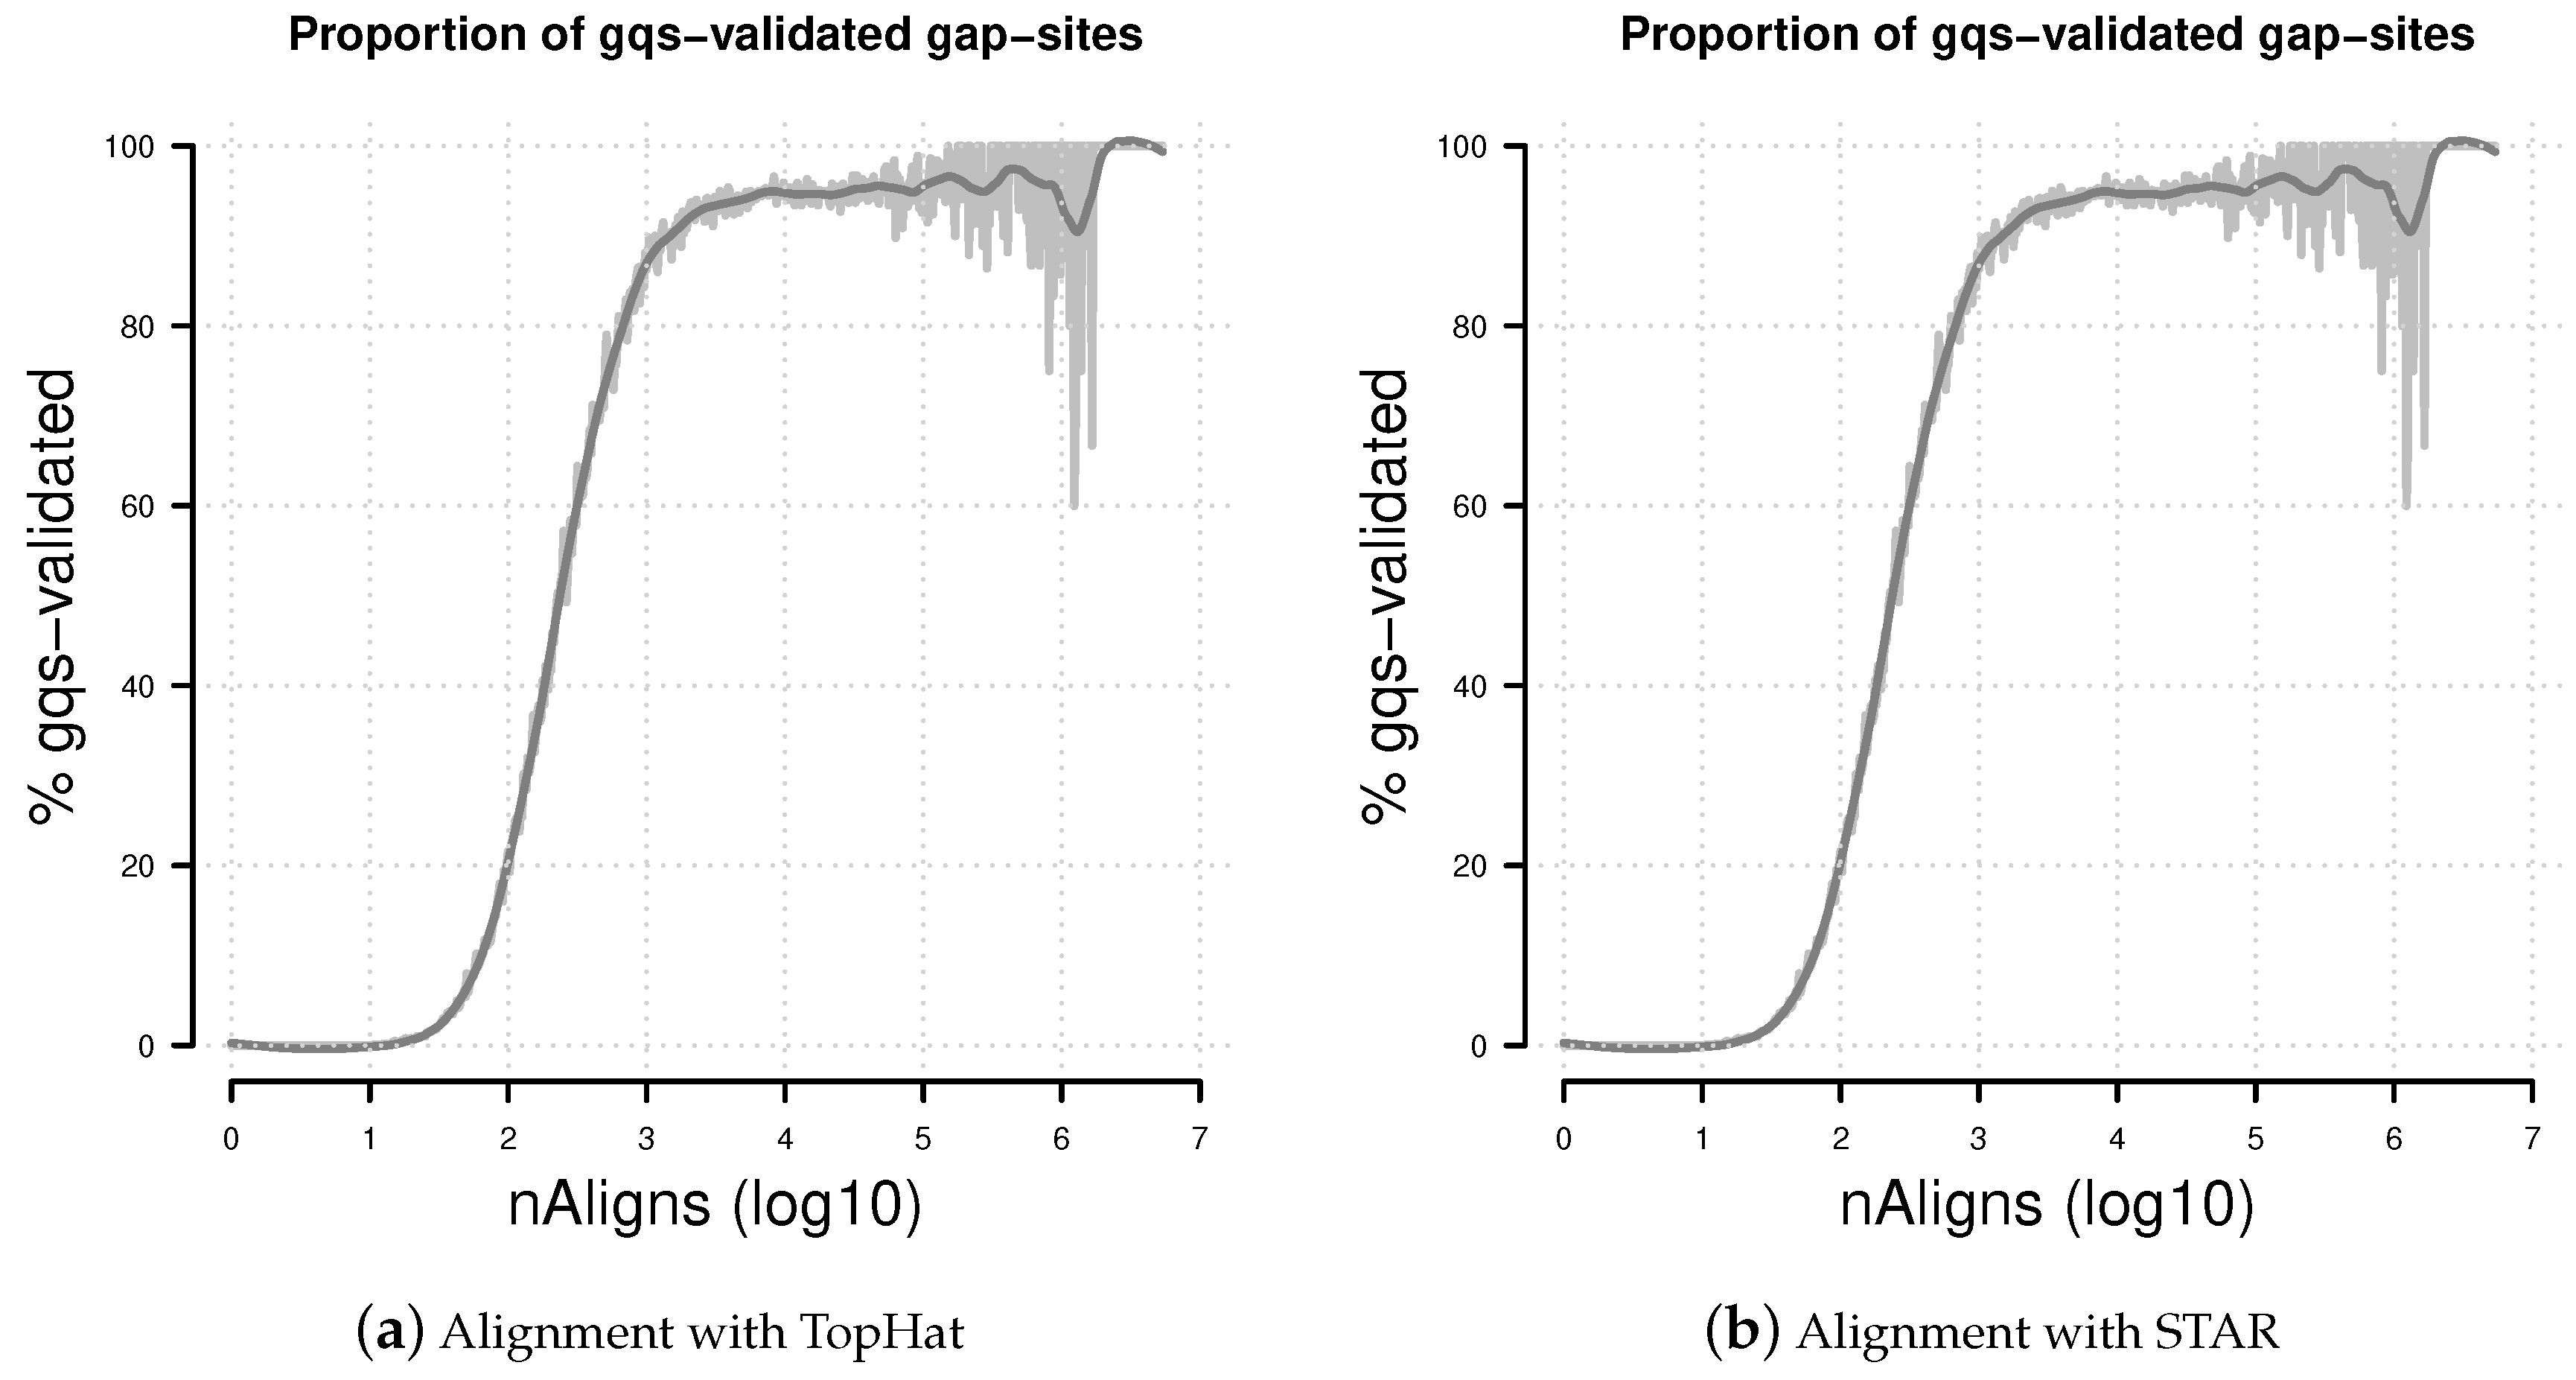
Figure 7.
Percentage of gqs-validated gap-sites. Proportion of gqs-validated gap-sites for different alignment coverage’s. (a) Alignments from TopHat aligner; (b) Alignments from STAR aligner. The rising proportions of gqs-validated gap-sites reflects the fact that gqs-validation is more likely for higher alignment coverage.
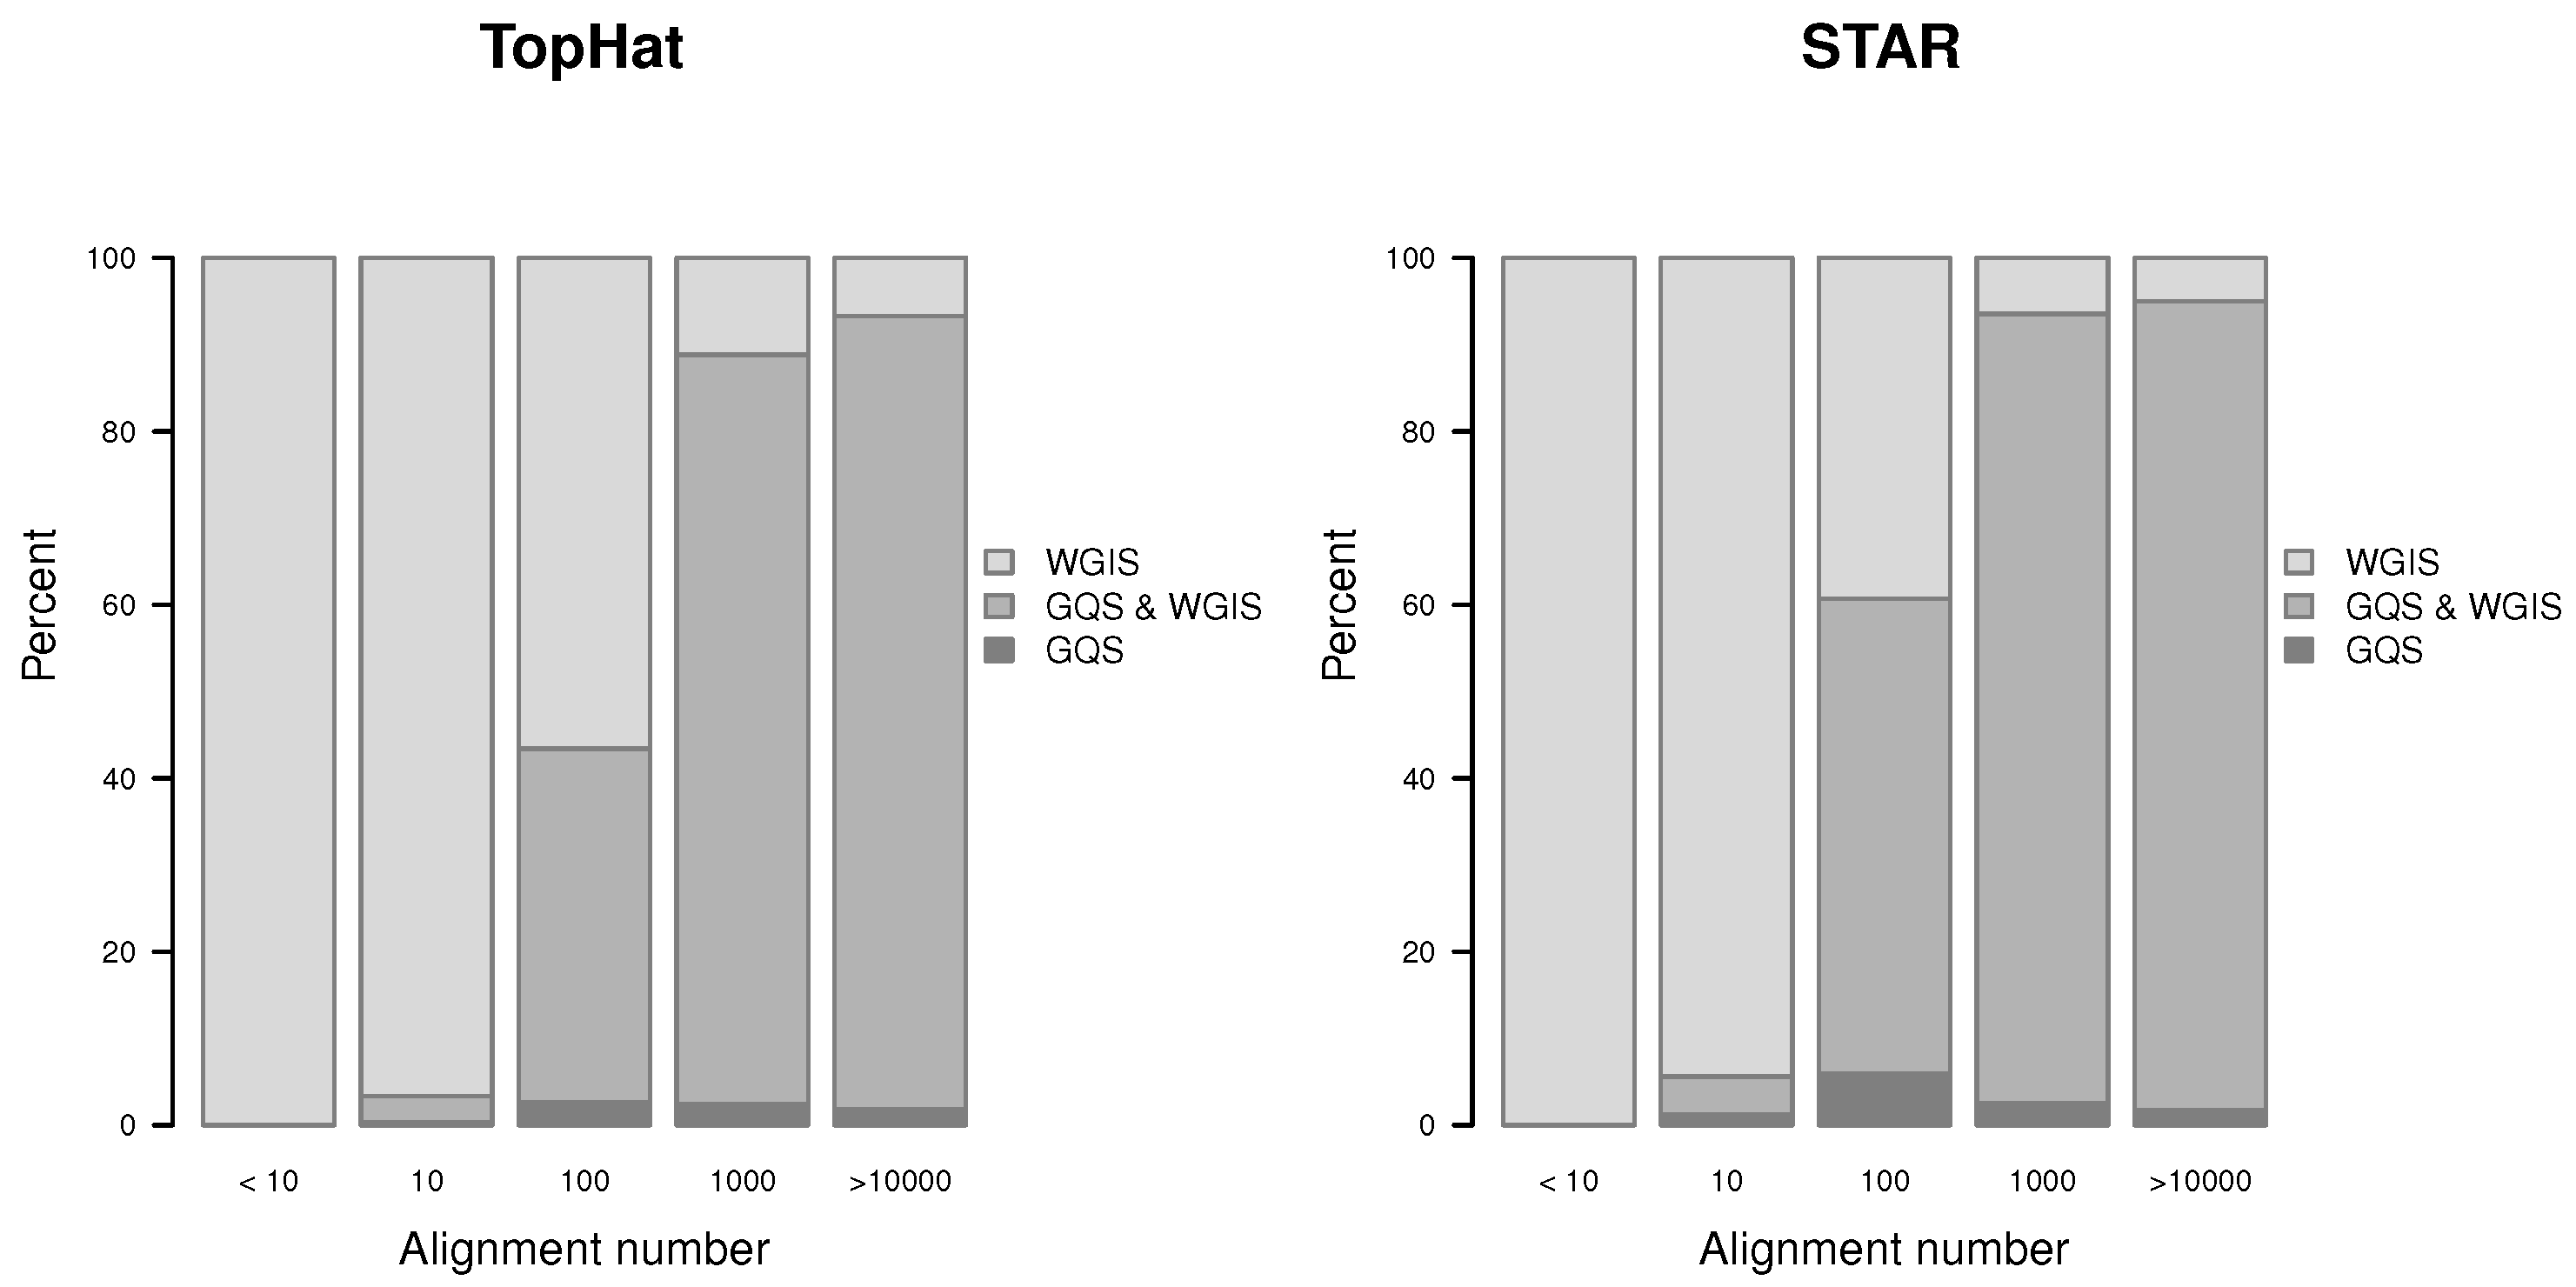
Figure 8.
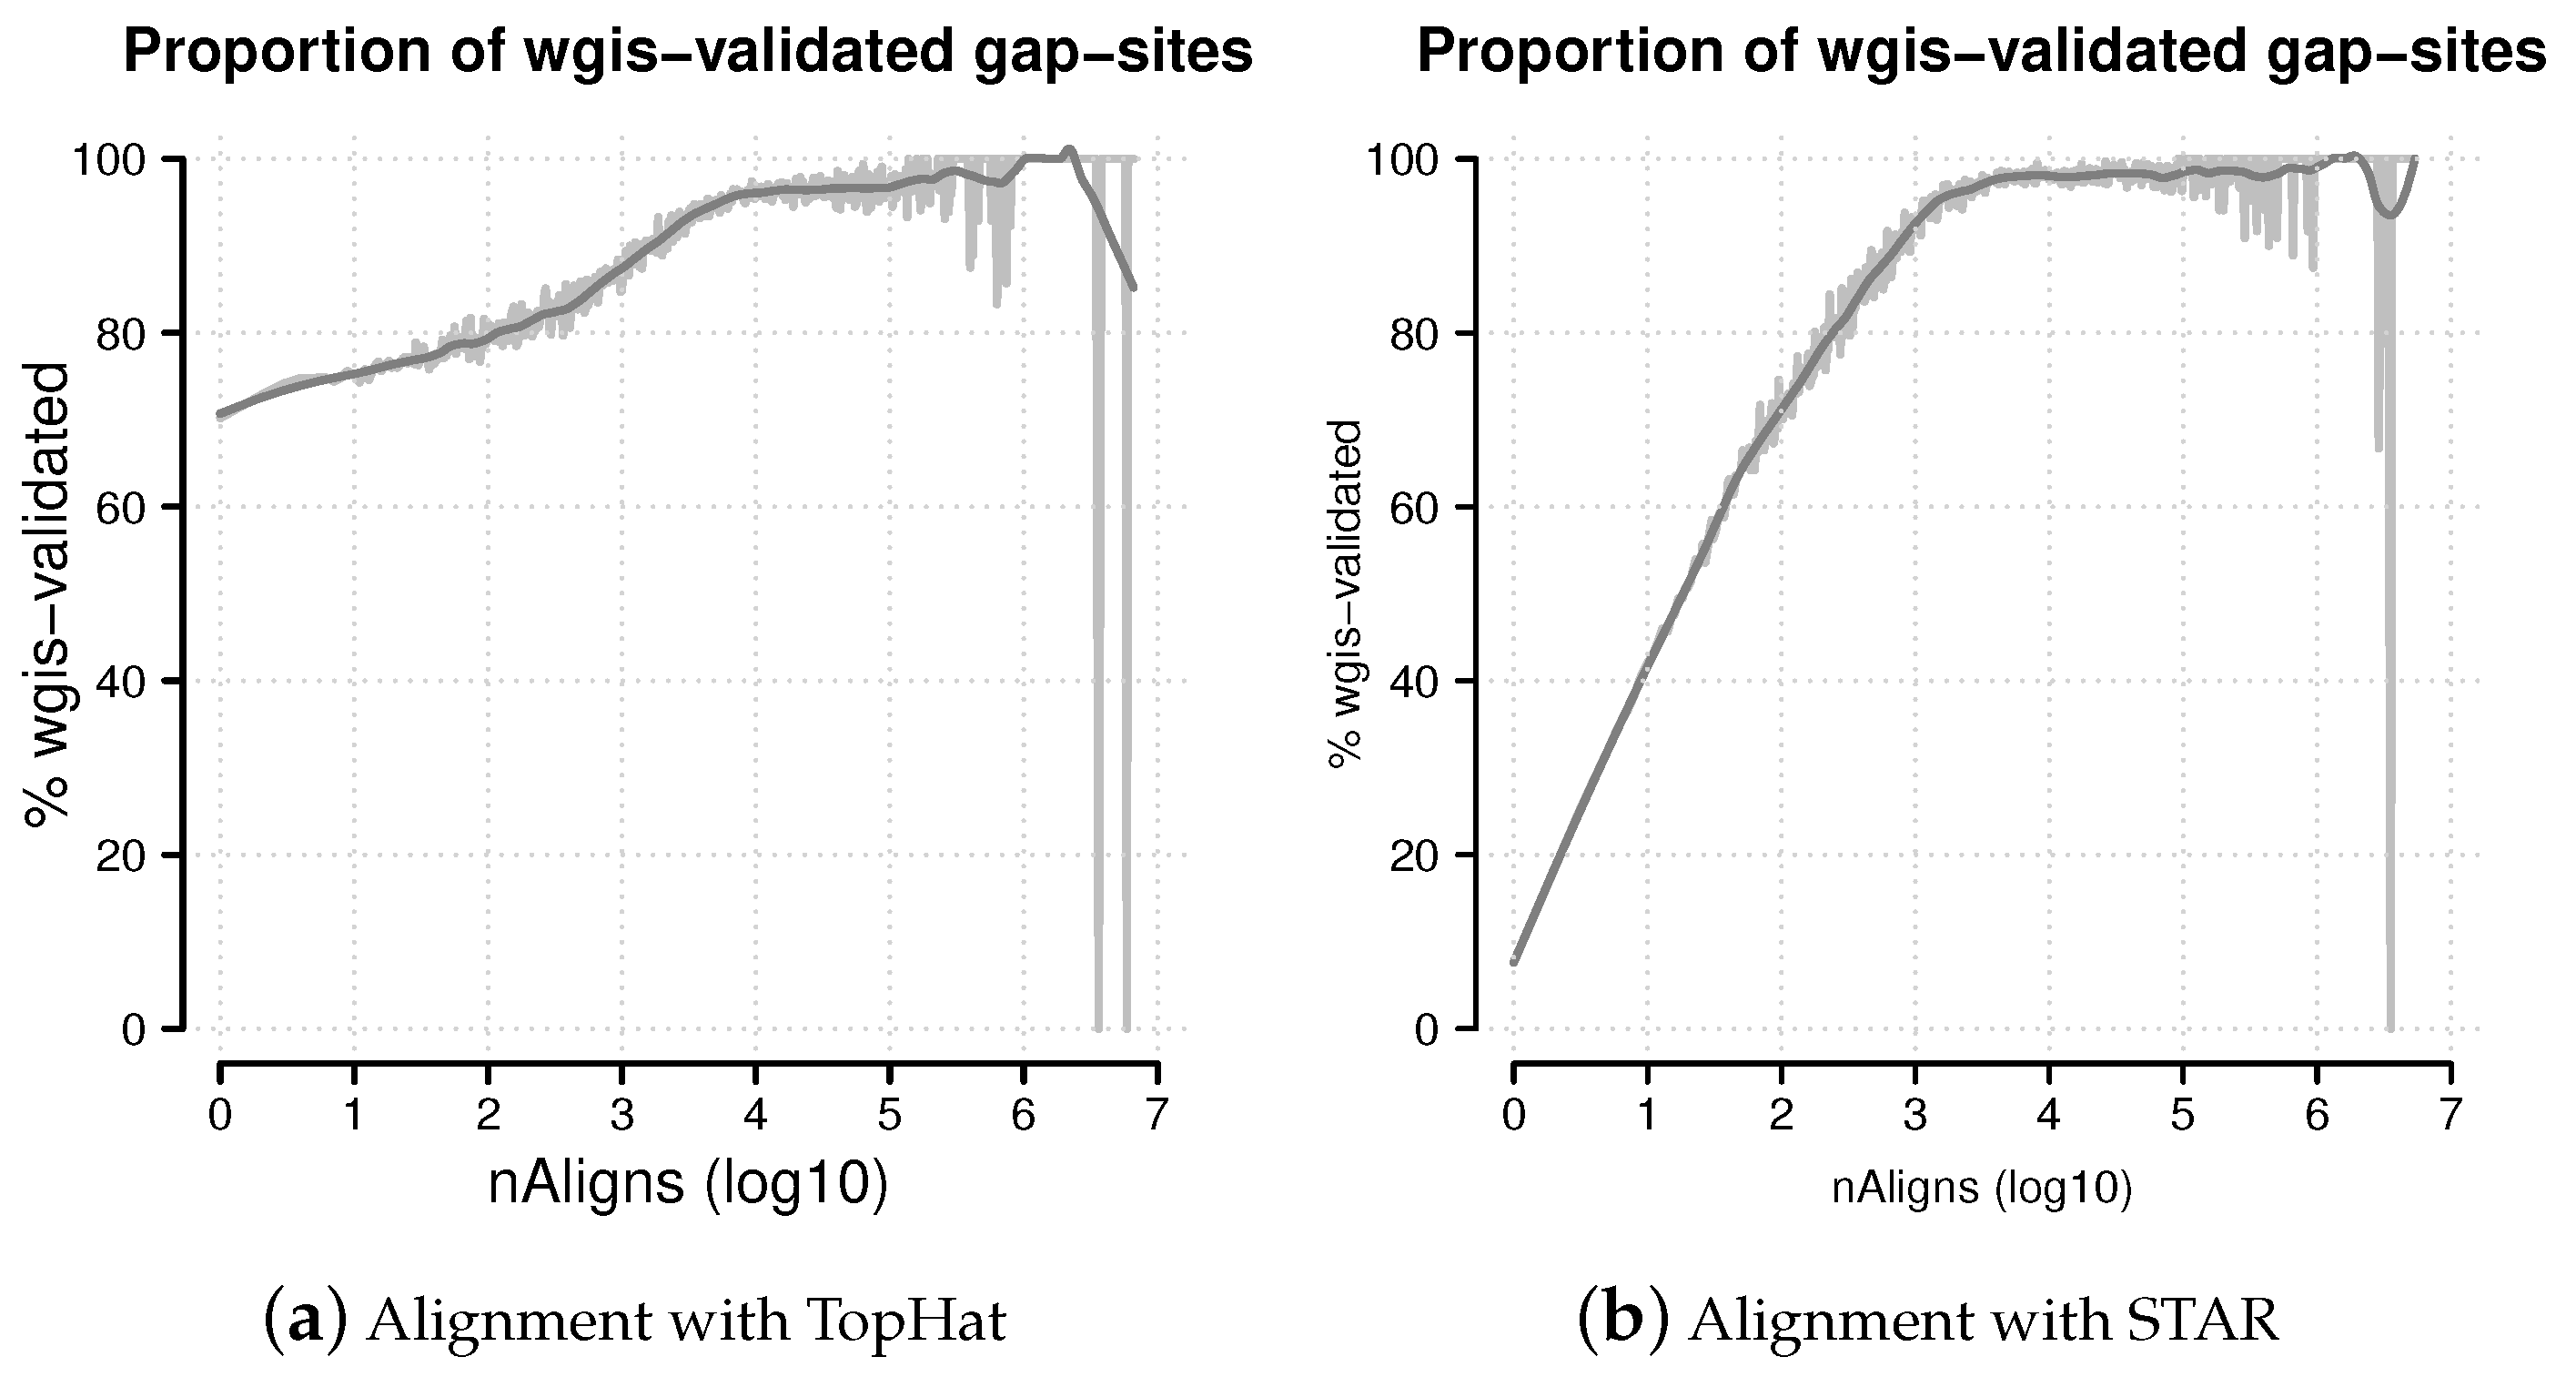
Percentage of wgis-validated gap-sites. Proportion of wgis-validated gap-sites for different alignment coverage’s (nAligns). Gap-sites were categorised by log10(nAligns) value (rounded by one digit). For each category, the proportion of wgis validated gap-sites were tabled. The raw proportions were smoothed using a loess model. (a) Alignments from TopHat aligner. The proportion of wgis-validated gap-sites is >70% throughout the whole range; (b) Alignments from STAR aligner. For nAligns >19 (log10(nAligns) >1.28), the majority of gap-sites (>50%) are validated by wgis.
Figure 8.
Percentage of wgis-validated gap-sites. Proportion of wgis-validated gap-sites for different alignment coverage’s (nAligns). Gap-sites were categorised by log10(nAligns) value (rounded by one digit). For each category, the proportion of wgis validated gap-sites were tabled. The raw proportions were smoothed using a loess model. (a) Alignments from TopHat aligner. The proportion of wgis-validated gap-sites is >70% throughout the whole range; (b) Alignments from STAR aligner. For nAligns >19 (log10(nAligns) >1.28), the majority of gap-sites (>50%) are validated by wgis.
Figure 9.
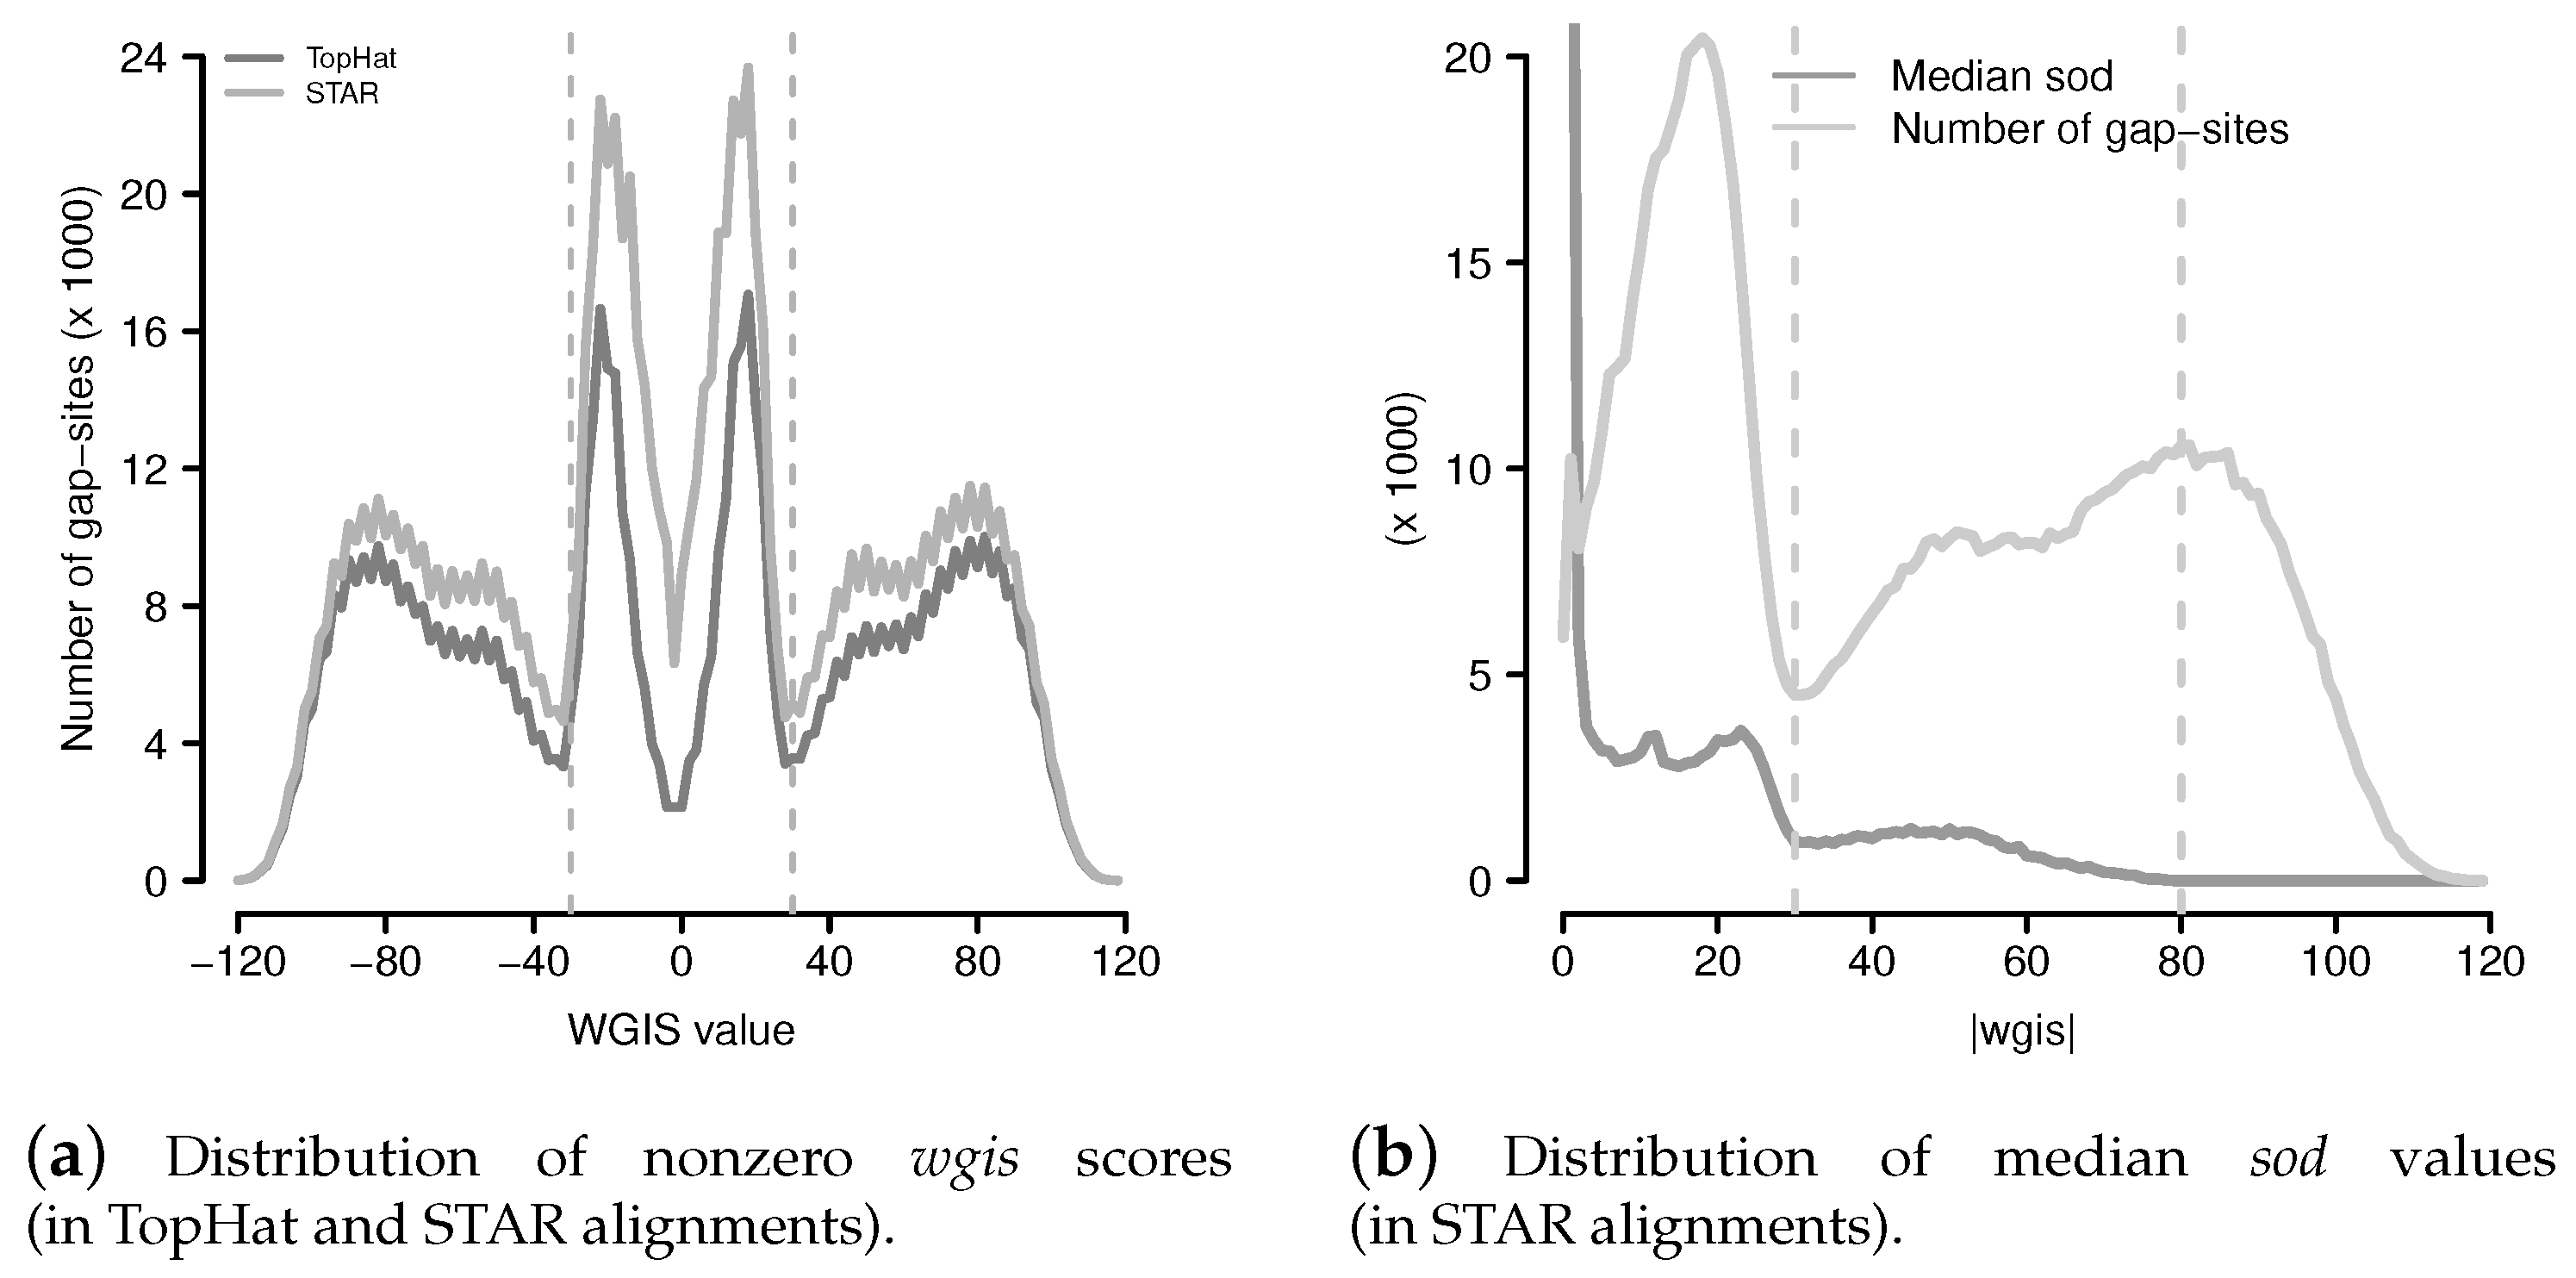
Distribution of wgis and median sod values. (a) Distribution of non zero wgis (wgis values were cut into ranges of width 2 for reduction of scattering); (b) Distribution of median sod and number of gap-sites from STAR with respect to absolute wgis values (. Range limits are drawn at (local minimum of number of gap-sites) and at (where median sod drops to <10).
Figure 9.
Distribution of wgis and median sod values. (a) Distribution of non zero wgis (wgis values were cut into ranges of width 2 for reduction of scattering); (b) Distribution of median sod and number of gap-sites from STAR with respect to absolute wgis values (. Range limits are drawn at (local minimum of number of gap-sites) and at (where median sod drops to <10).
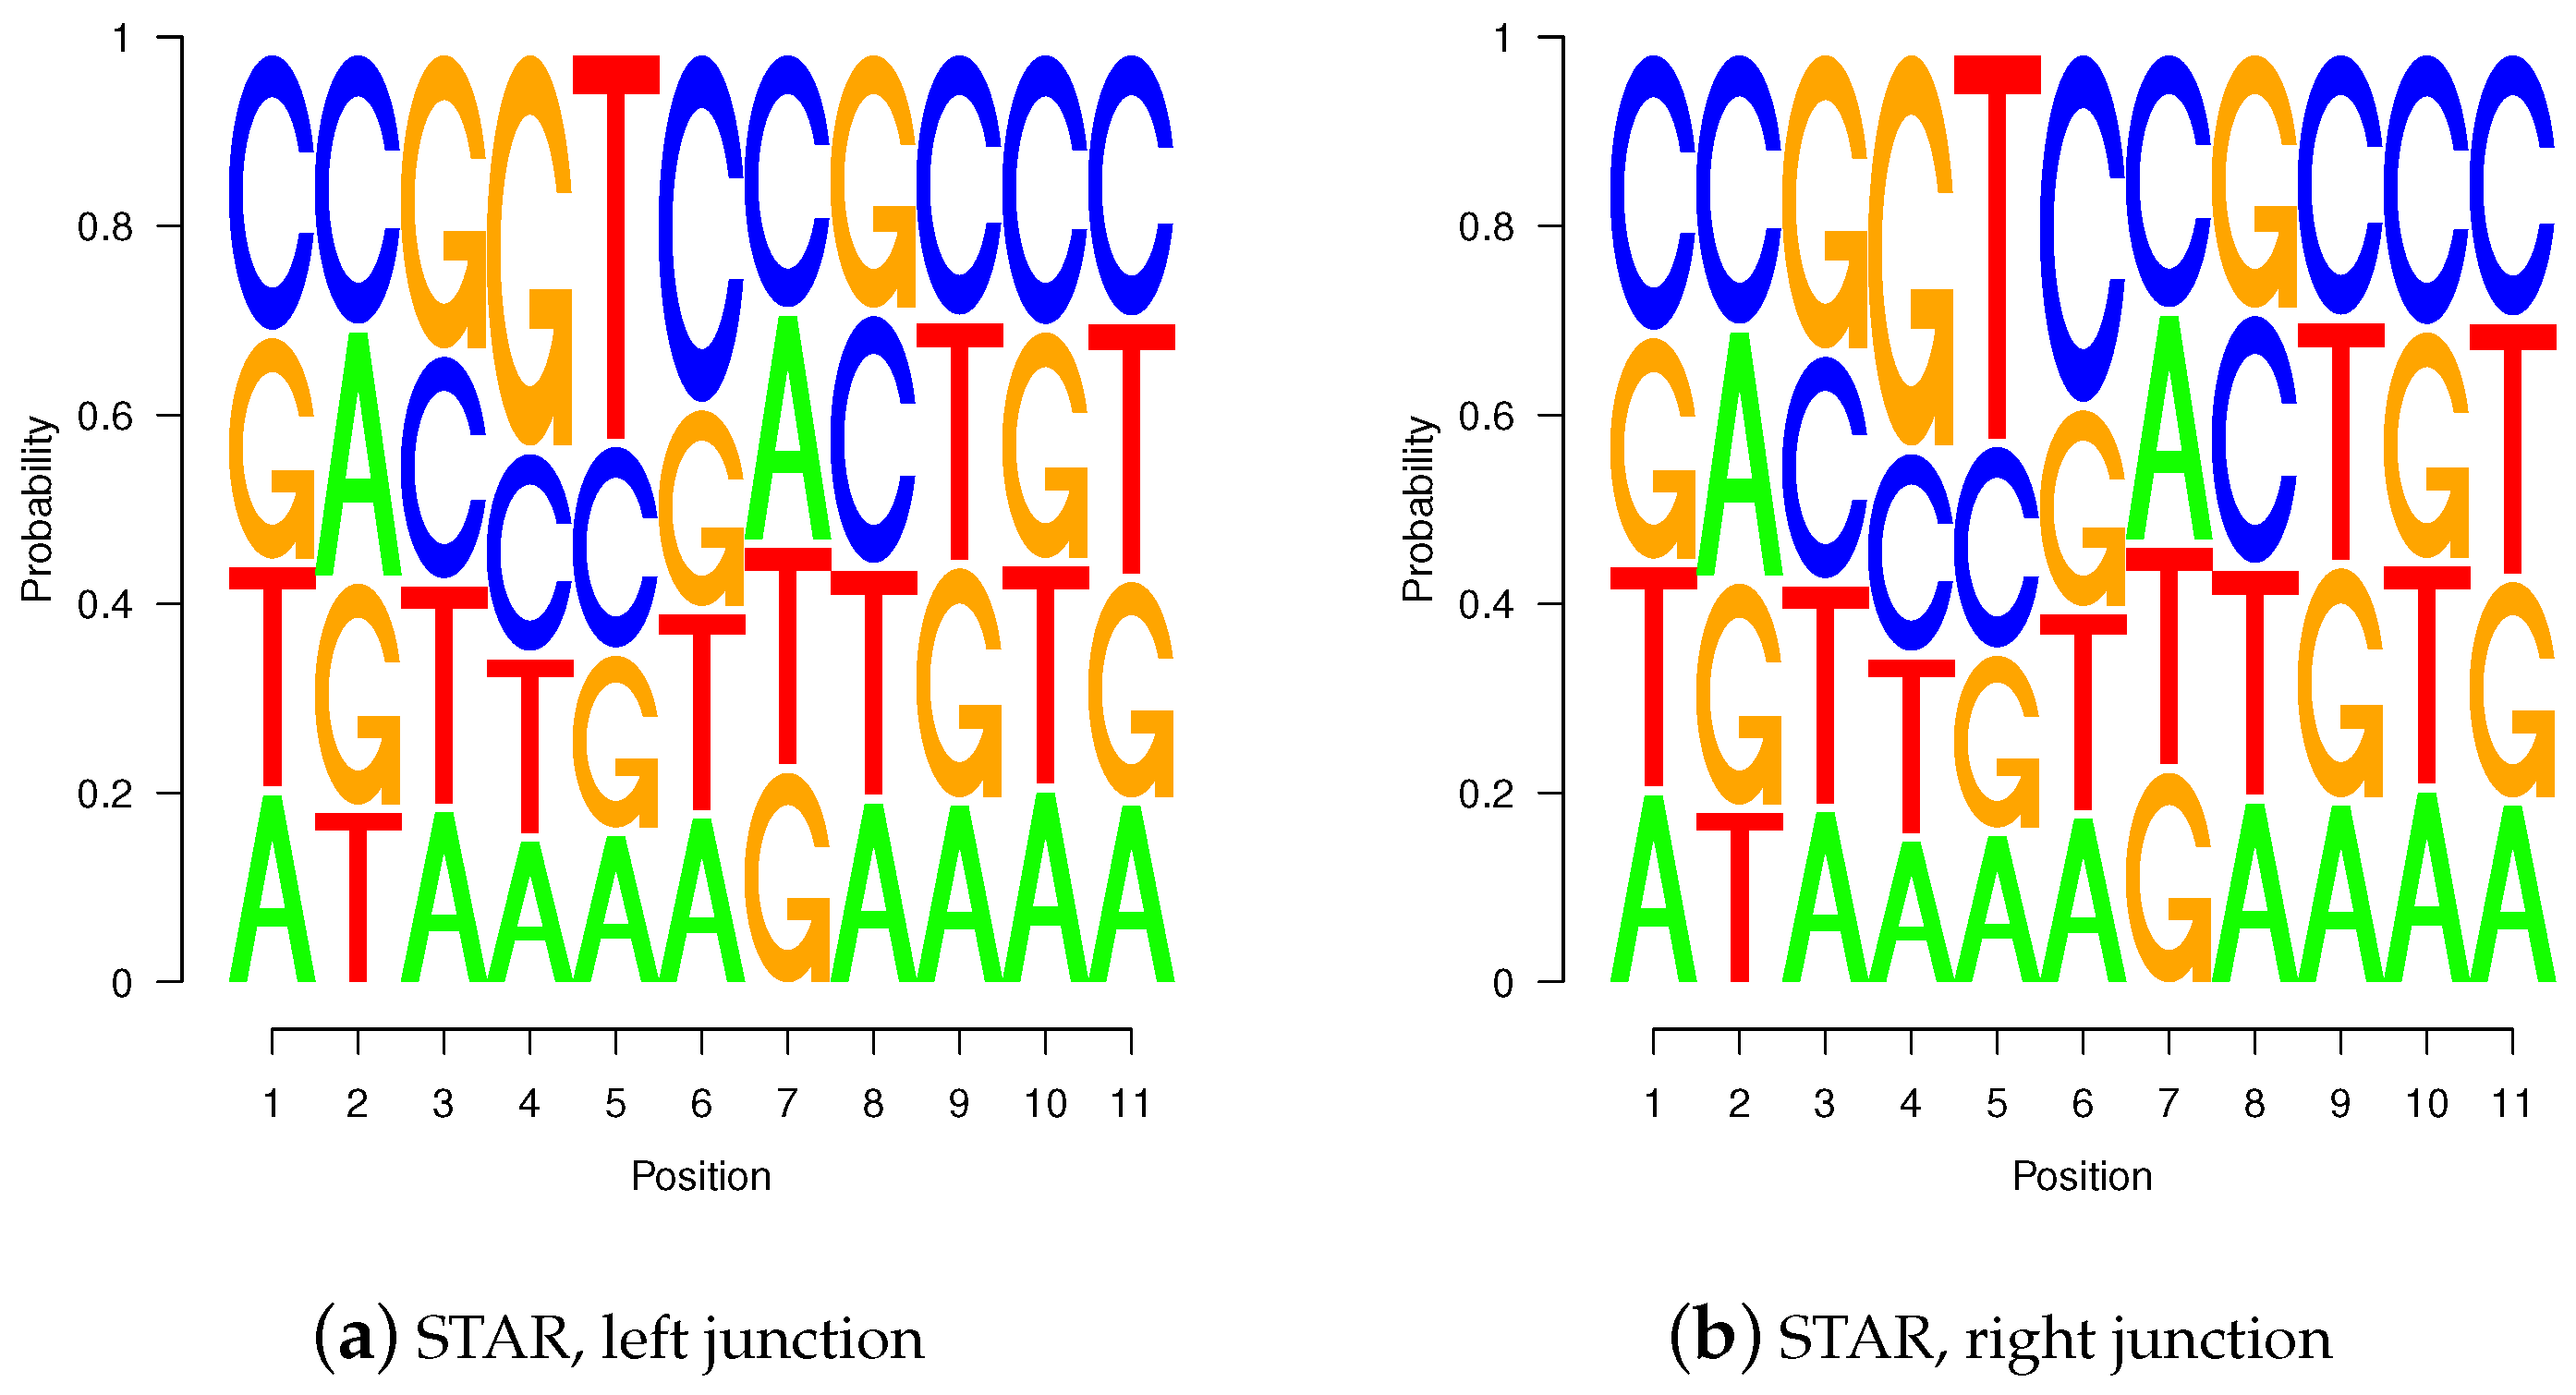
Figure 10.
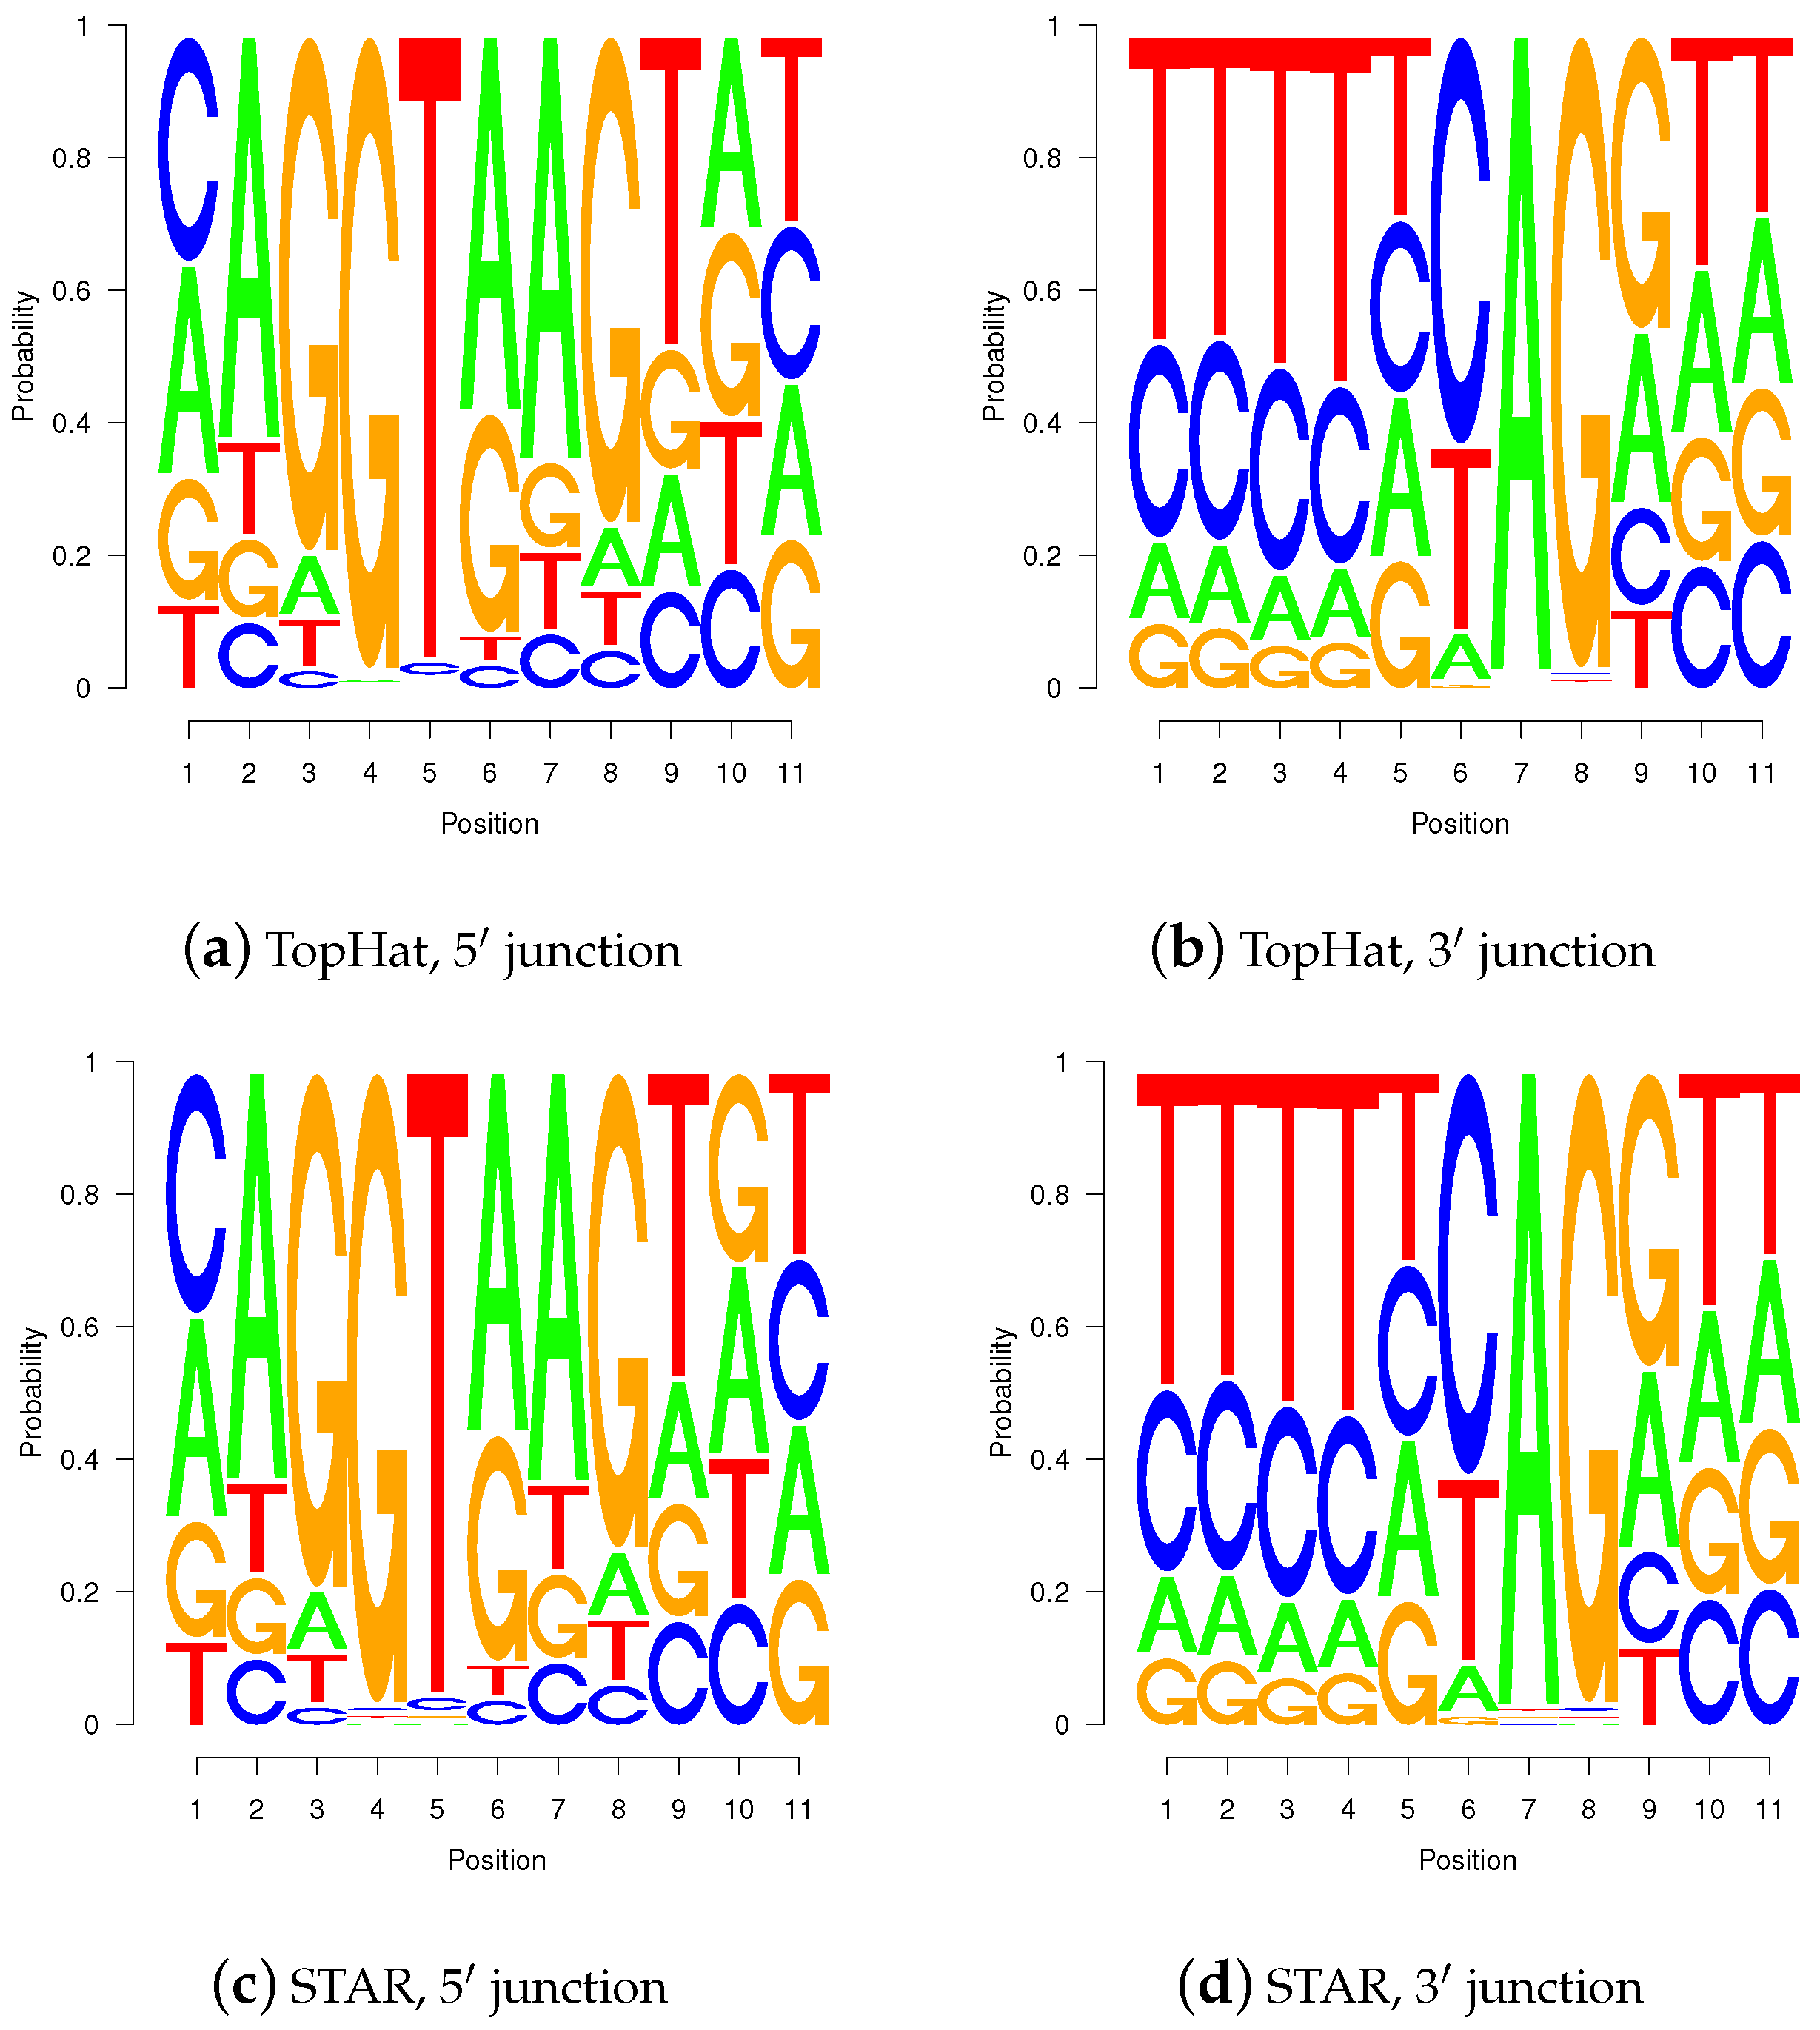
Sequence logos for wgis verified gap-sites. Sequence logos for wgis verified gap-sites (GQL > 0). Tabled nucleotides are corrected for strand orientation reported by wgis. (a,c) Splice-junction is located between position 3 and 4 (gap-site lend is located at position 3); (b,d) Splice-junction is located between position 8 and 9 (gap-site rstart is located at position 9). Sequence logos for wgis validated gap-sites show a high degree of similarity in alignments from TopHat and STAR.
Figure 10.
Sequence logos for wgis verified gap-sites. Sequence logos for wgis verified gap-sites (GQL > 0). Tabled nucleotides are corrected for strand orientation reported by wgis. (a,c) Splice-junction is located between position 3 and 4 (gap-site lend is located at position 3); (b,d) Splice-junction is located between position 8 and 9 (gap-site rstart is located at position 9). Sequence logos for wgis validated gap-sites show a high degree of similarity in alignments from TopHat and STAR.
Figure 11.
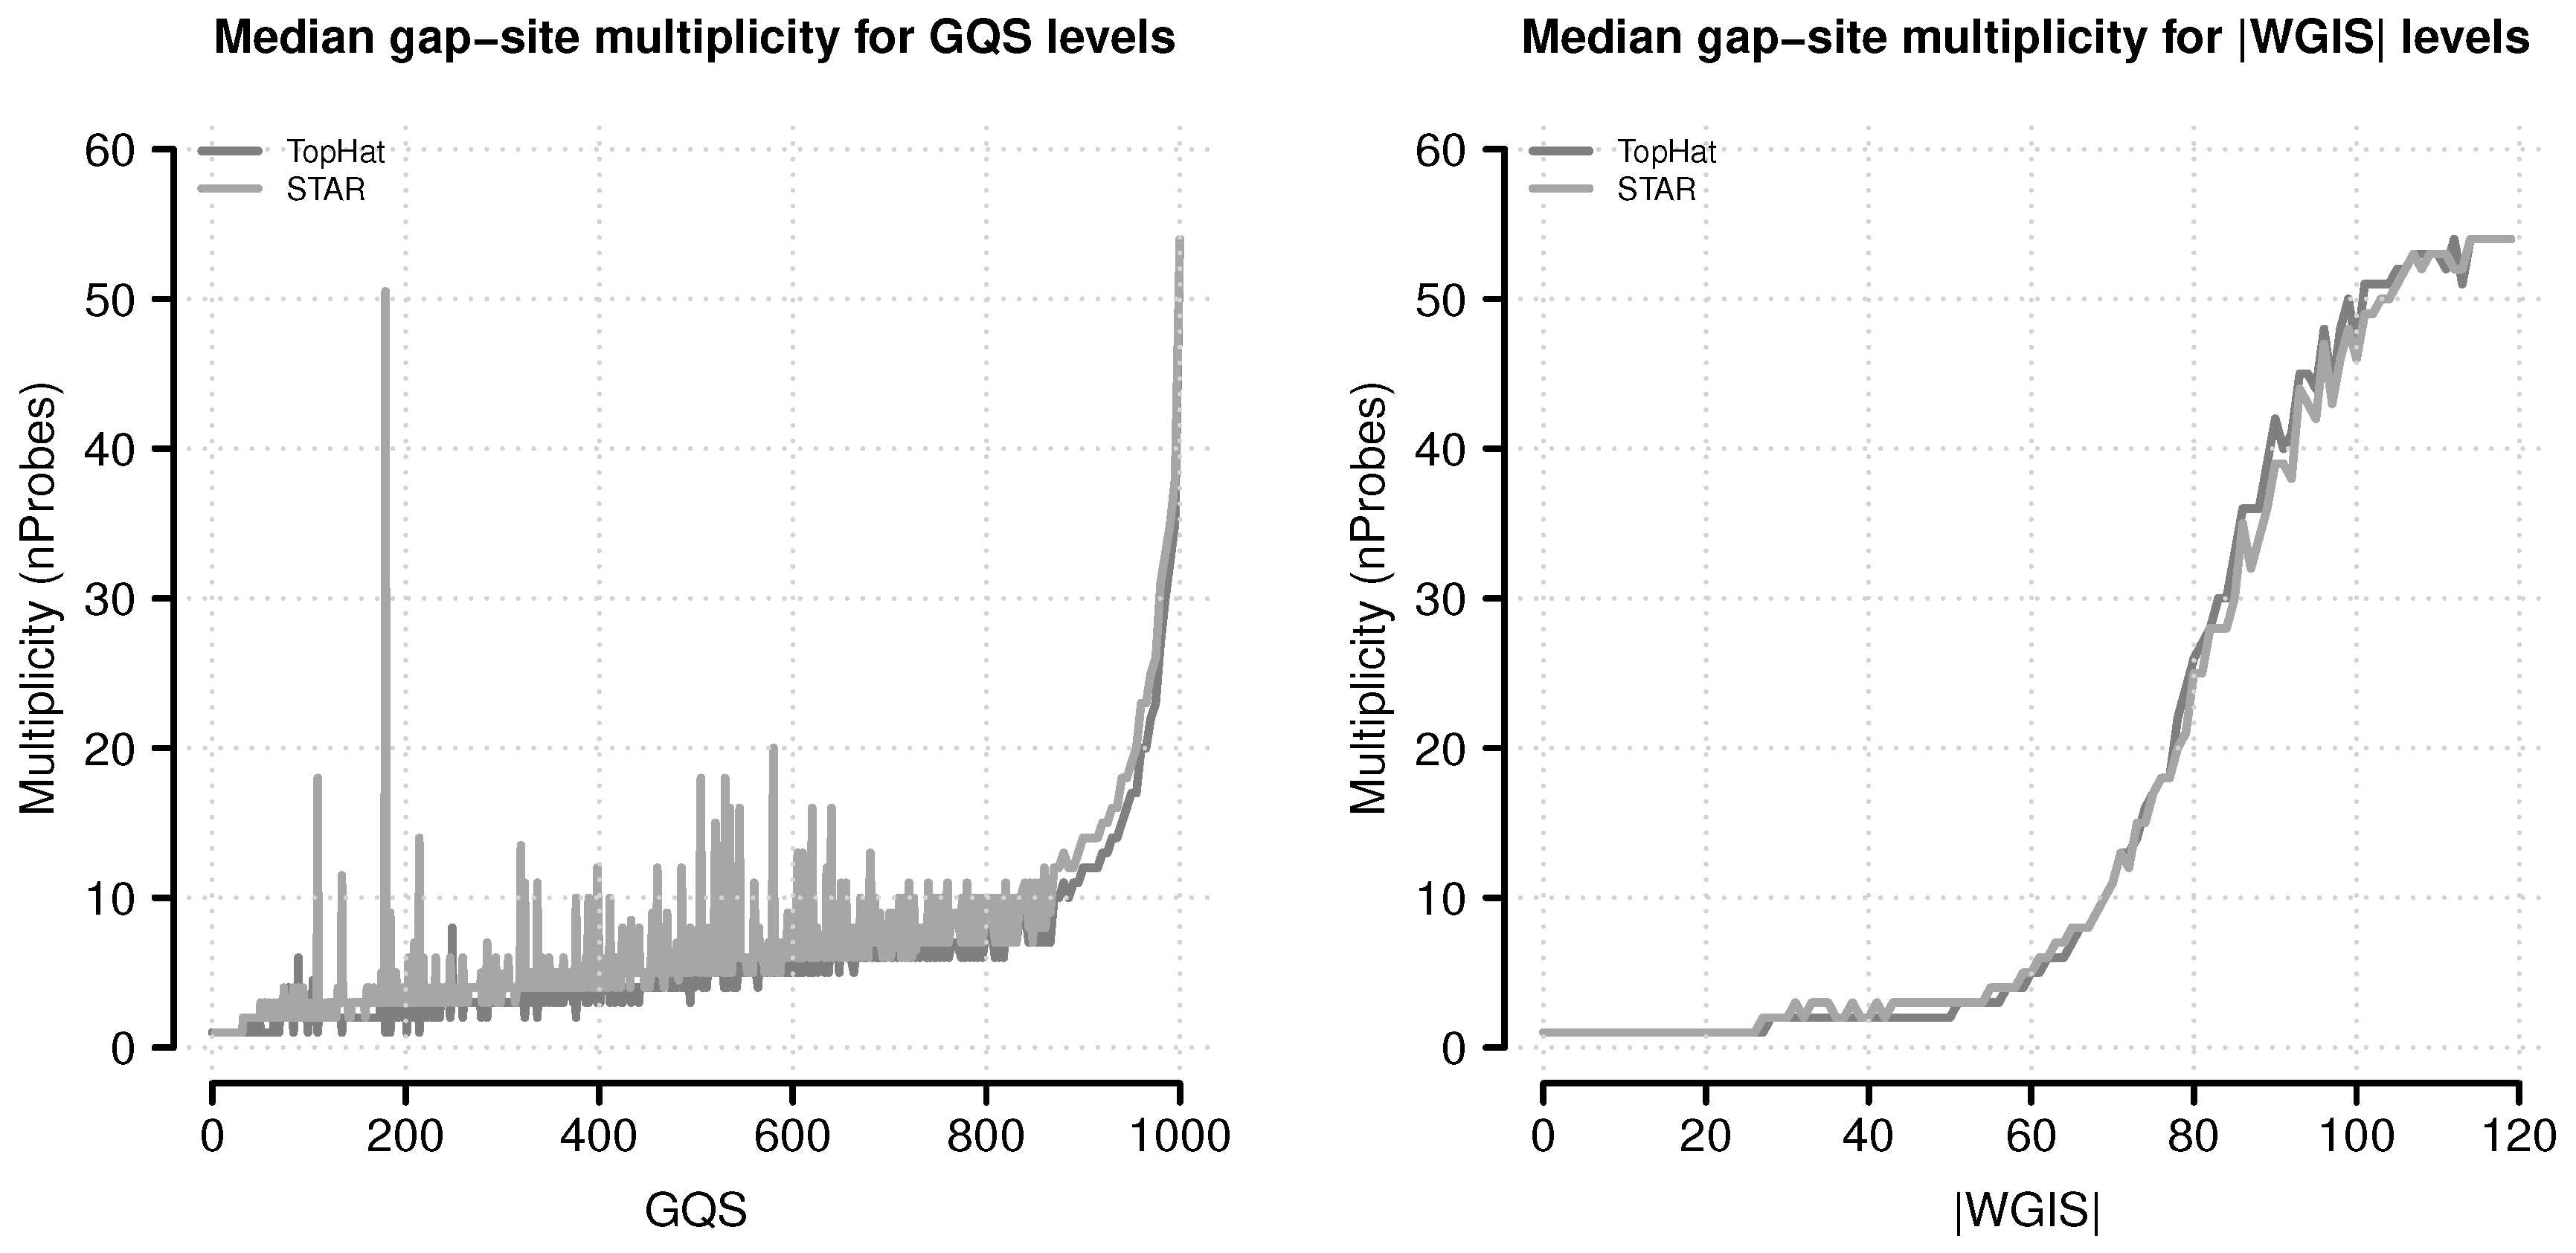
Median gap-site multiplicities for different score levels. Gap-site multiplicity (nProbes, the number of samples in which a gap-site is identified) are used as category (absolute values of wgis are rounded to integral numbers). For each score category, the median nProbes value is calculated and displayed in the figure. (Left) Gap-site multiplicities for different gqs values; (Right) Gap-site multiplicities for different values.
Figure 11.
Median gap-site multiplicities for different score levels. Gap-site multiplicity (nProbes, the number of samples in which a gap-site is identified) are used as category (absolute values of wgis are rounded to integral numbers). For each score category, the median nProbes value is calculated and displayed in the figure. (Left) Gap-site multiplicities for different gqs values; (Right) Gap-site multiplicities for different values.
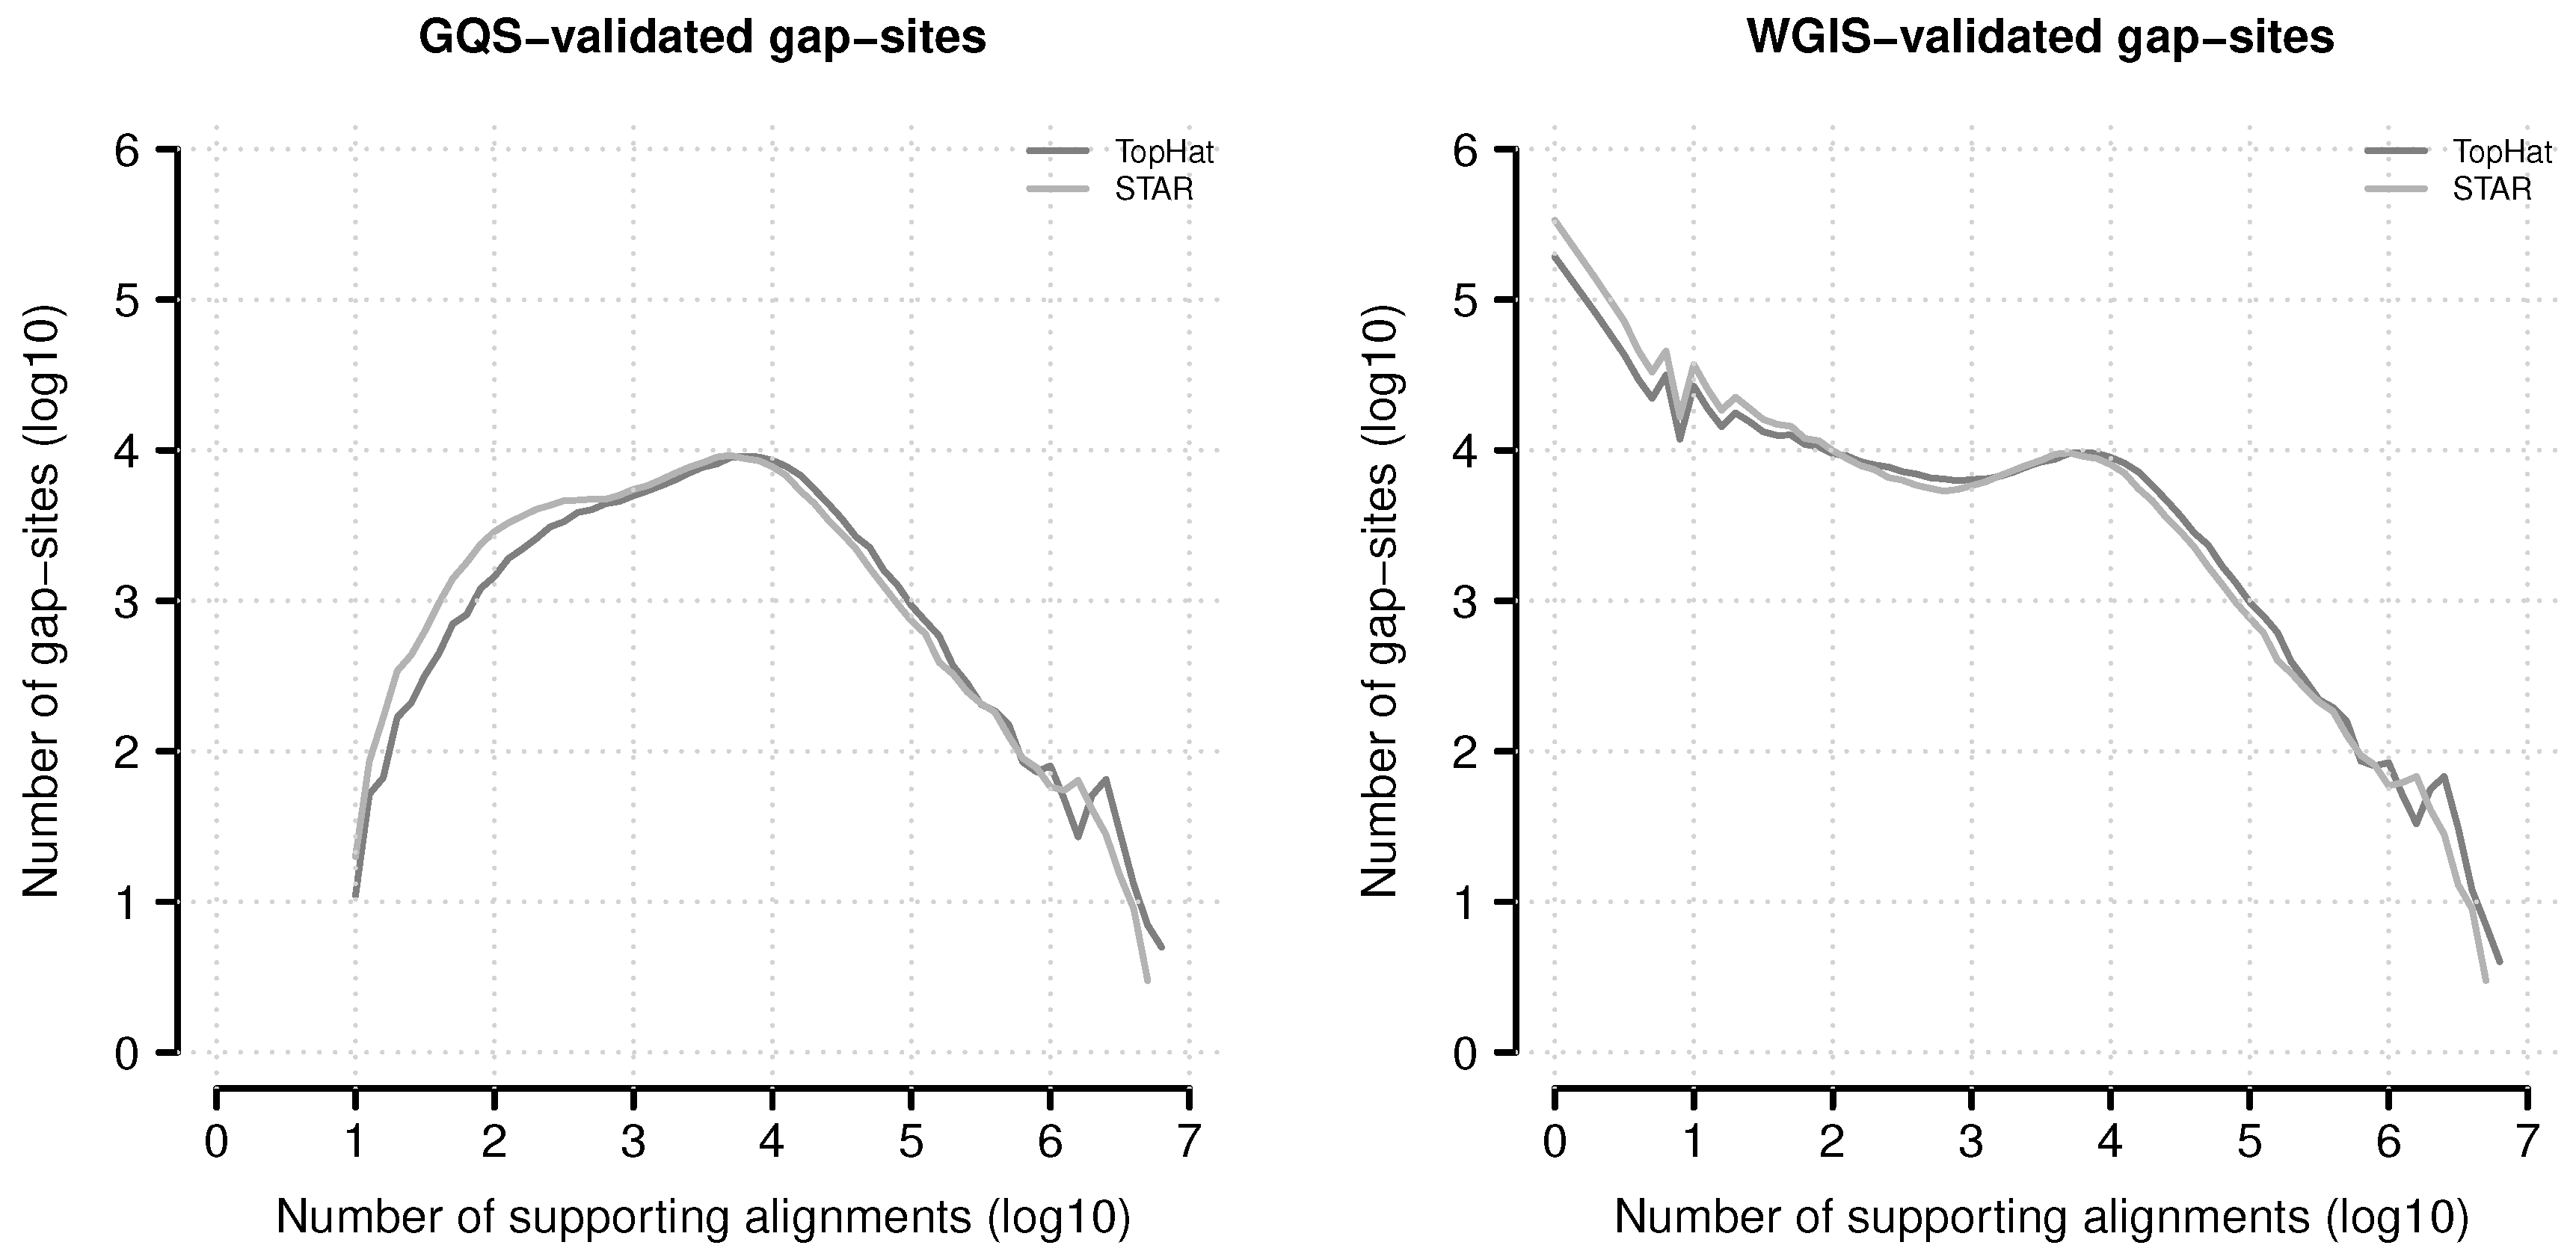
Figure 12.
Absolute numbers of verified gap-sites for different alignment depth’s. Gap-sites were categorised according to number of supporting alignments (nAligns): The log10(nAligns) value rounded to one digit was used as category (x-axis). The lines display the log10 of tabled validated gap-sites (gqs-validated left, wgis-validated right).
Figure 13.
Proportion of verified gap-sites for different alignment depth’s.
Figure 13.
Proportion of verified gap-sites for different alignment depth’s.
Figure 14.
Sequence logos for gap-sites not validated by wgis. Sequence logos for (5,421,981) gap-sites not validated by wgis (GQL = 0) from STAR aligner. Tabled nucleotides are corrected for strand orientation reported by wgis. (a) Splice-junction is located between position 3 and 4 (gap-site lend is located at position 3); (b) Splice-junction is located between position 8 and 9 (gap-site rstart is located at position 9).
Table 1.
Global statistics for TopHat and STAR aligner.
Table 1.
Global statistics for TopHat and STAR aligner.
| | | Gap-Sites |
|---|
| Aligner | Alignment Gaps | Number | Coverage | Single Align | All Samples |
|---|
| TopHat | 2,999,472,708 | 1,000,380 | 2999 | 273,994 | 120,434 |
| STAR | 2,410,424,541 | 6,487,577 | 371 | 4,437,270 | 129,758 |
Table 2.
Percentage of intronic dinucleotides on gqs-validated gap-sites.
Table 2.
Percentage of intronic dinucleotides on gqs-validated gap-sites.
| Left IDIN | | Right IDIN | | Combined |
|---|
| IDIN | TopHat | STAR | | IDIN | TopHat | STAR | | IDIN | TopHat | STAR |
|---|
| GT | 49.65 | 49.26 | | AG | 50.10 | 49.68 | | GT-AG | 49.54 | 49.13 |
| CT | 49.65 | 49.09 | | AC | 49.20 | 48.60 | | CT-AC | 49.07 | 48.46 |
| GC | 0.56 | 0.61 | | GC | 0.59 | 0.60 | | CT-GC | 0.59 | 0.54 |
| TG | | 0.06 | | GG | | 0.16 | | GC-AG | 0.56 | 0.48 |
| CA | | 0.09 | | CC | | 0.14 | | AT-AC | 0.14 | 0.04 |
| AT | 0.14 | 0.08 | | AT | 0.11 | 0.11 | | GT-AT | 0.11 | 0.04 |
Table 3.
gql: Definition and distribution.
Table 3.
gql: Definition and distribution.
| | TopHat | STAR |
|---|
| gql | wgis | Ntotal | Ptotal (%) | Pval (%) | Ntotal | Ptotal (%) | Pval (%) |
|---|
| 0 | | | | = | 0 | 230,053 | 23.0 | | 5,421,981 | 83.6 | |
| 1 | 0 | < | | ≤ | 30 | 256,950 | 25.7 | 33.4 | 446,316 | 6.9 | 41.9 |
| 2 | 30 | < | | ≤ | 80 | 331.955 | 33.2 | 43.1 | 416,316 | 6.4 | 39.1 |
| 3 | 80 | < | | | | 181,422 | 18.1 | 23.6 | 202,964 | 3.1 | 19.1 |
Table 4.
Strand corrected intronic dinucleotide pairs of wgis-validated gap-sites.
Table 4.
Strand corrected intronic dinucleotide pairs of wgis-validated gap-sites.
| IDIN-Pair | TopHat | STAR | Literature |
|---|
| | gql1 | gql2 | gql3 | gql1 | gql2 | gql3 | |
|---|
| GT-AG | 95.70 | 98.71 | 100.00 | 94.76 | 98.66 | 100.00 | 99.24 % |
| GC-AG | 3.83 | 1.24 | | 3.38 | 1.15 | | 0.7 % |
| GT-AT | 0.23 | 0.03 | | 0.16 | 0.02 | | |
| AT-AC | 0.04 | | | 0.02 | | | 0.05% |
| CT-AC | 0.20 | 0.02 | | 0.54 | 0.02 | | |
Table 5.
Validation numbers of gap-sites.
Table 5.
Validation numbers of gap-sites.
| Aligner | Not Validated | GQS | WGIS | GQS & WGIS | Sum |
|---|
| STAR | 5,449,996 | 5548 | 125,217 | 597 | 5,581,358 |
| STAR & TopHat | 587,008 | 22,798 | 161,127 | 135,286 | 906,219 |
| TopHat | 78,044 | 680 | 15,164 | 273 | 94,161 |
| Sum | 6,115,048 | 29,026 | 301,508 | 136,156 | 6,581,738 |


