
Pan-Cancer Mutational and Transcriptional Analysis of the Integrator Complex

 ,
, 

 ,
,  and
and 
Abstract
:
1. Introduction
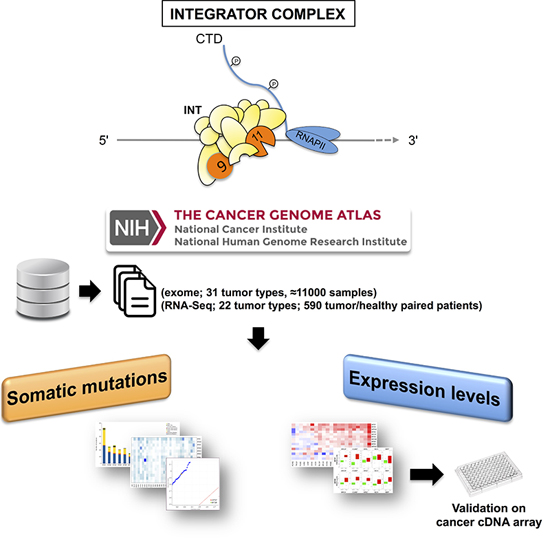
2. Results
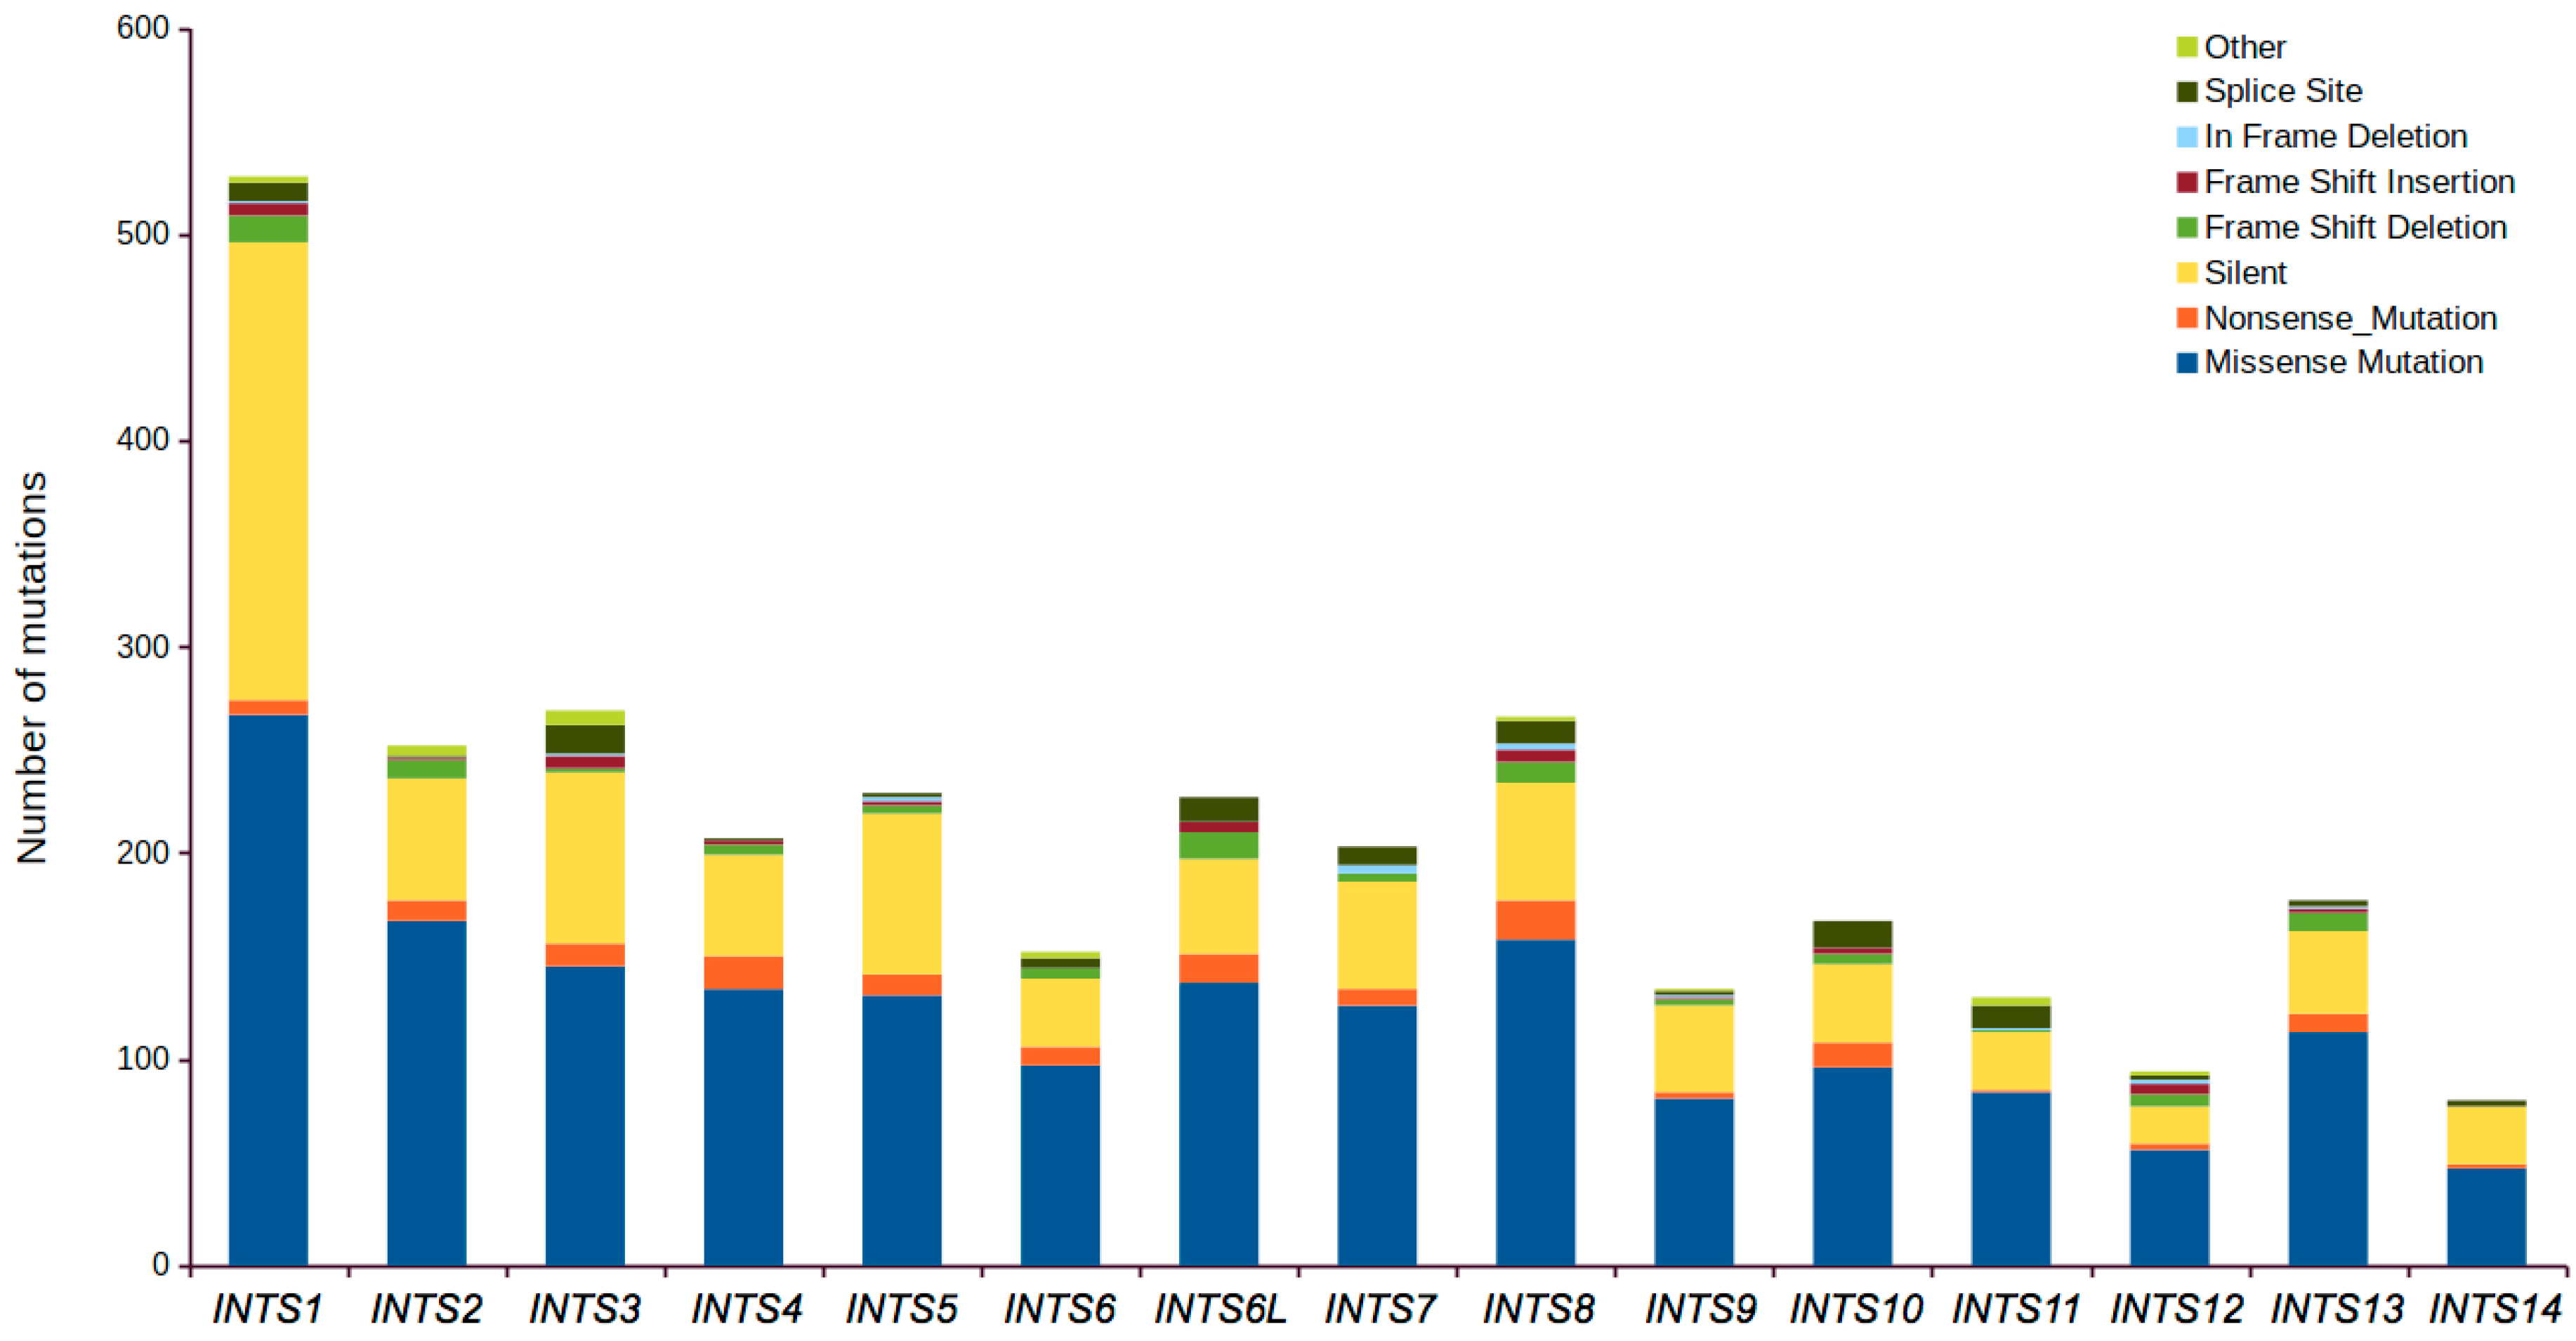
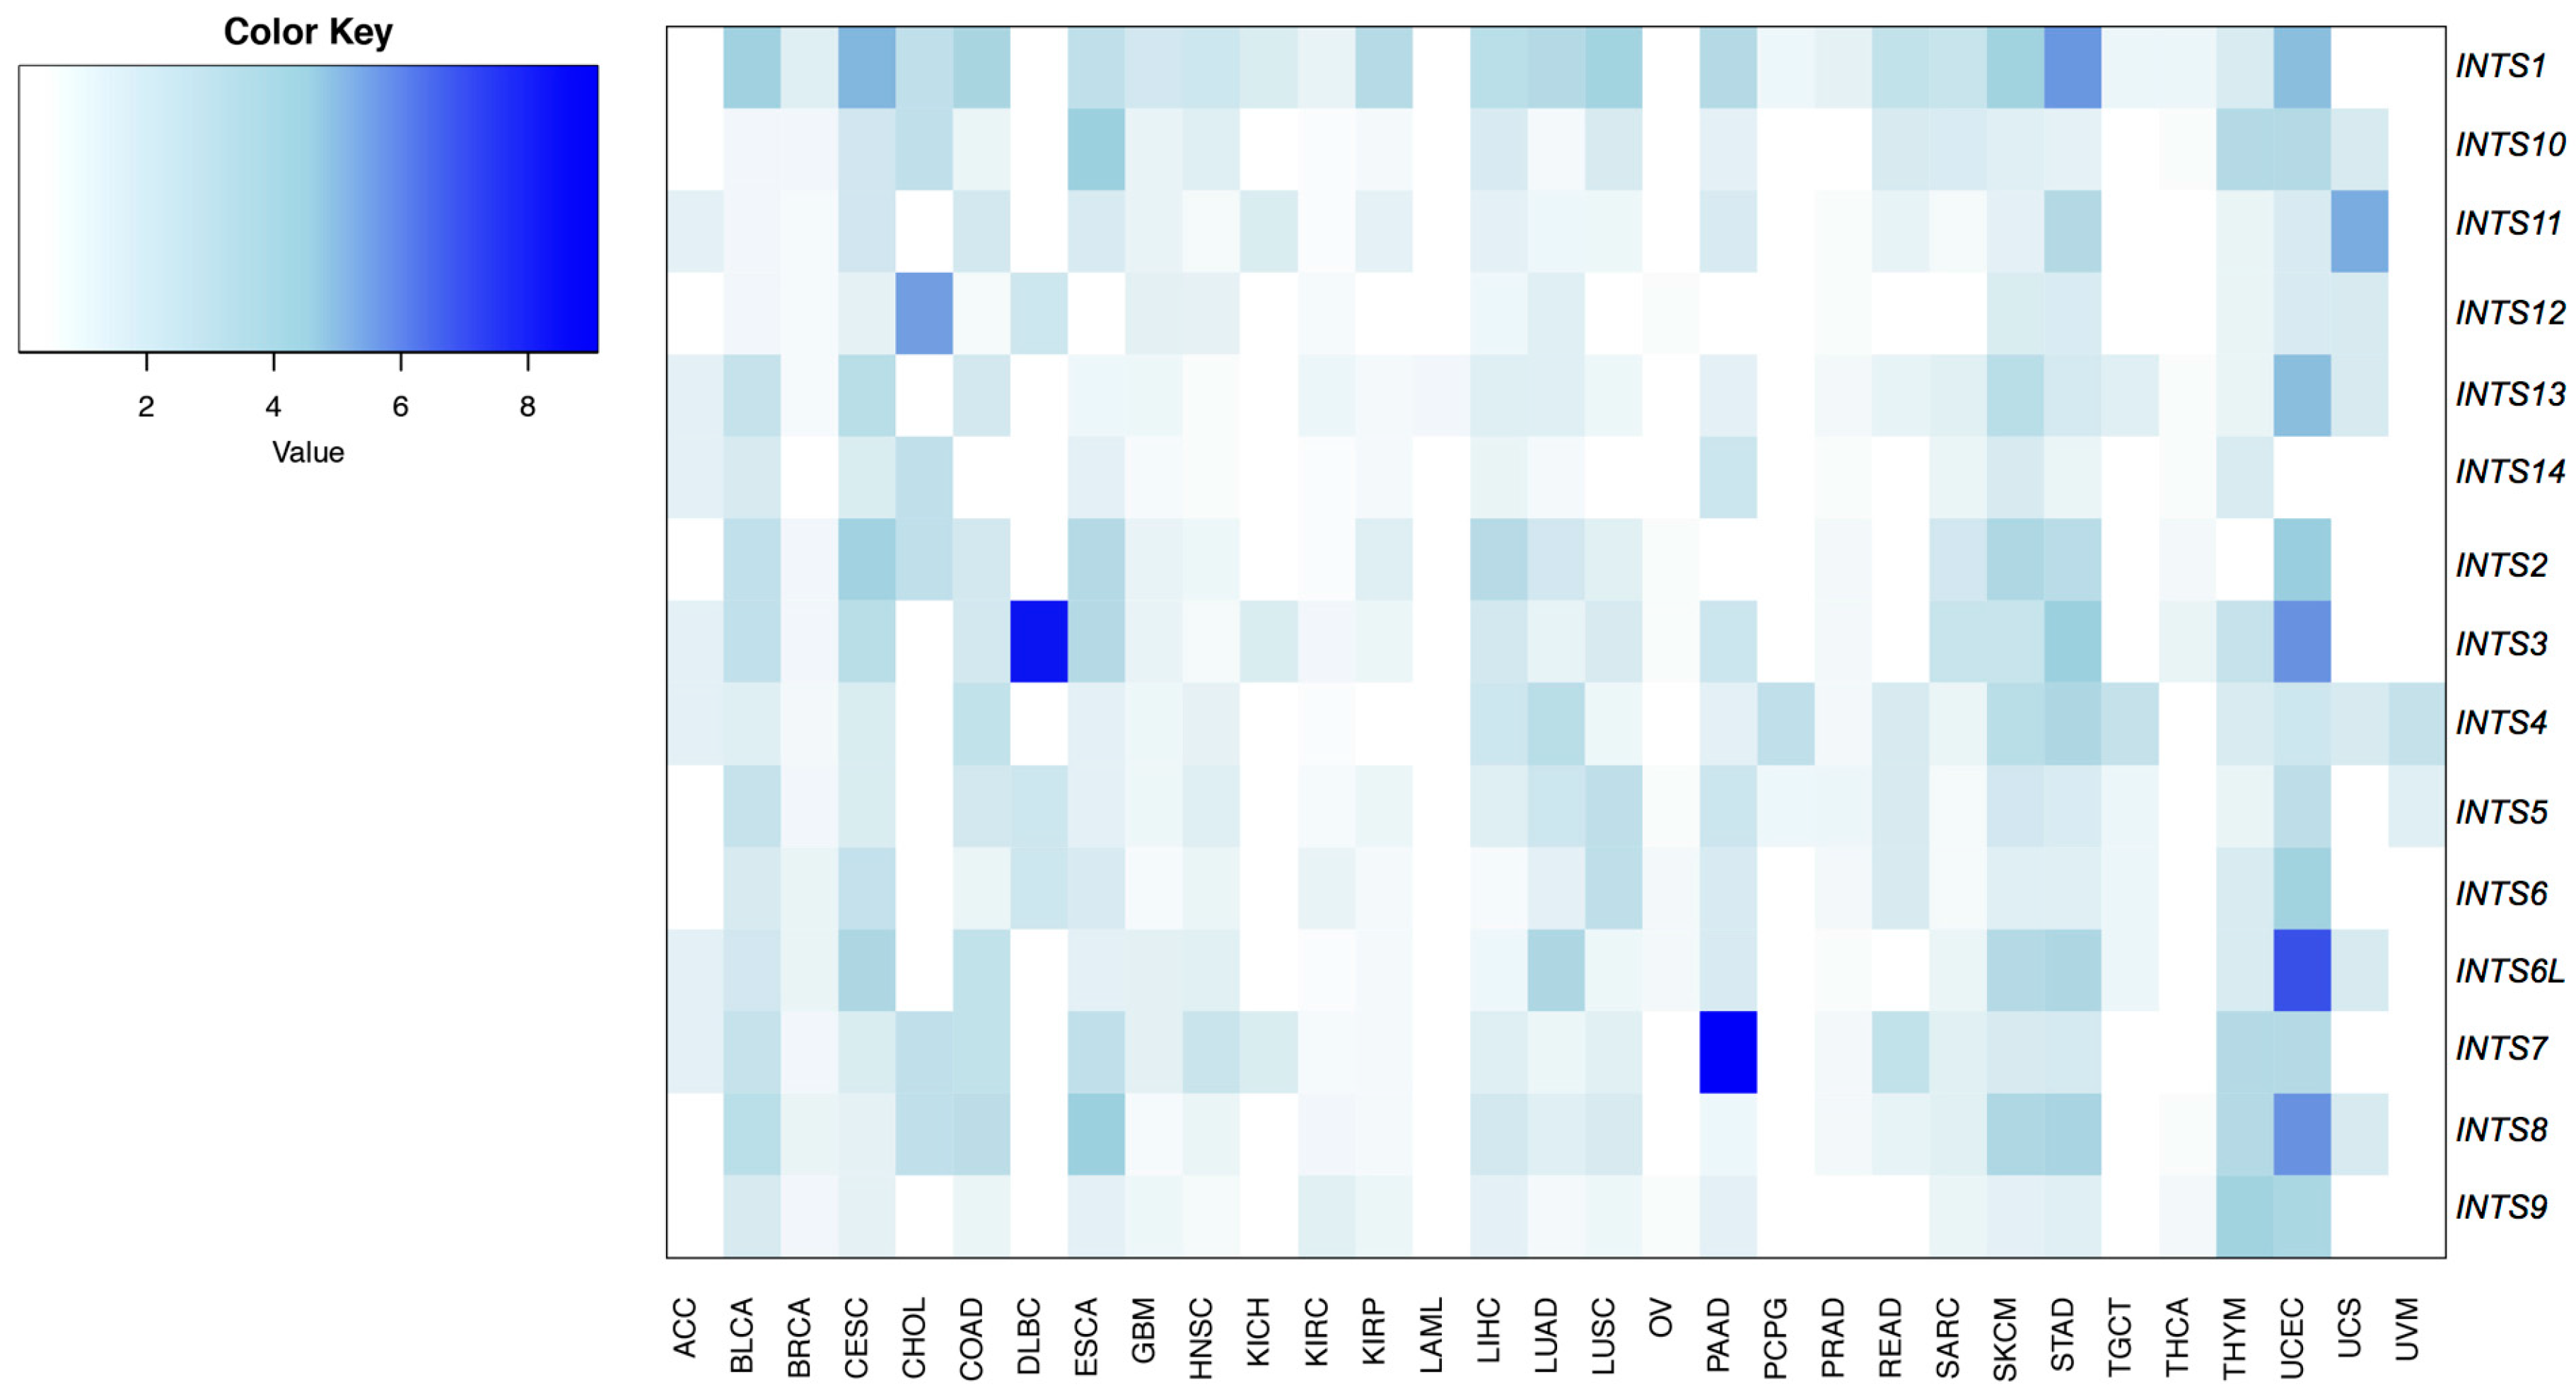
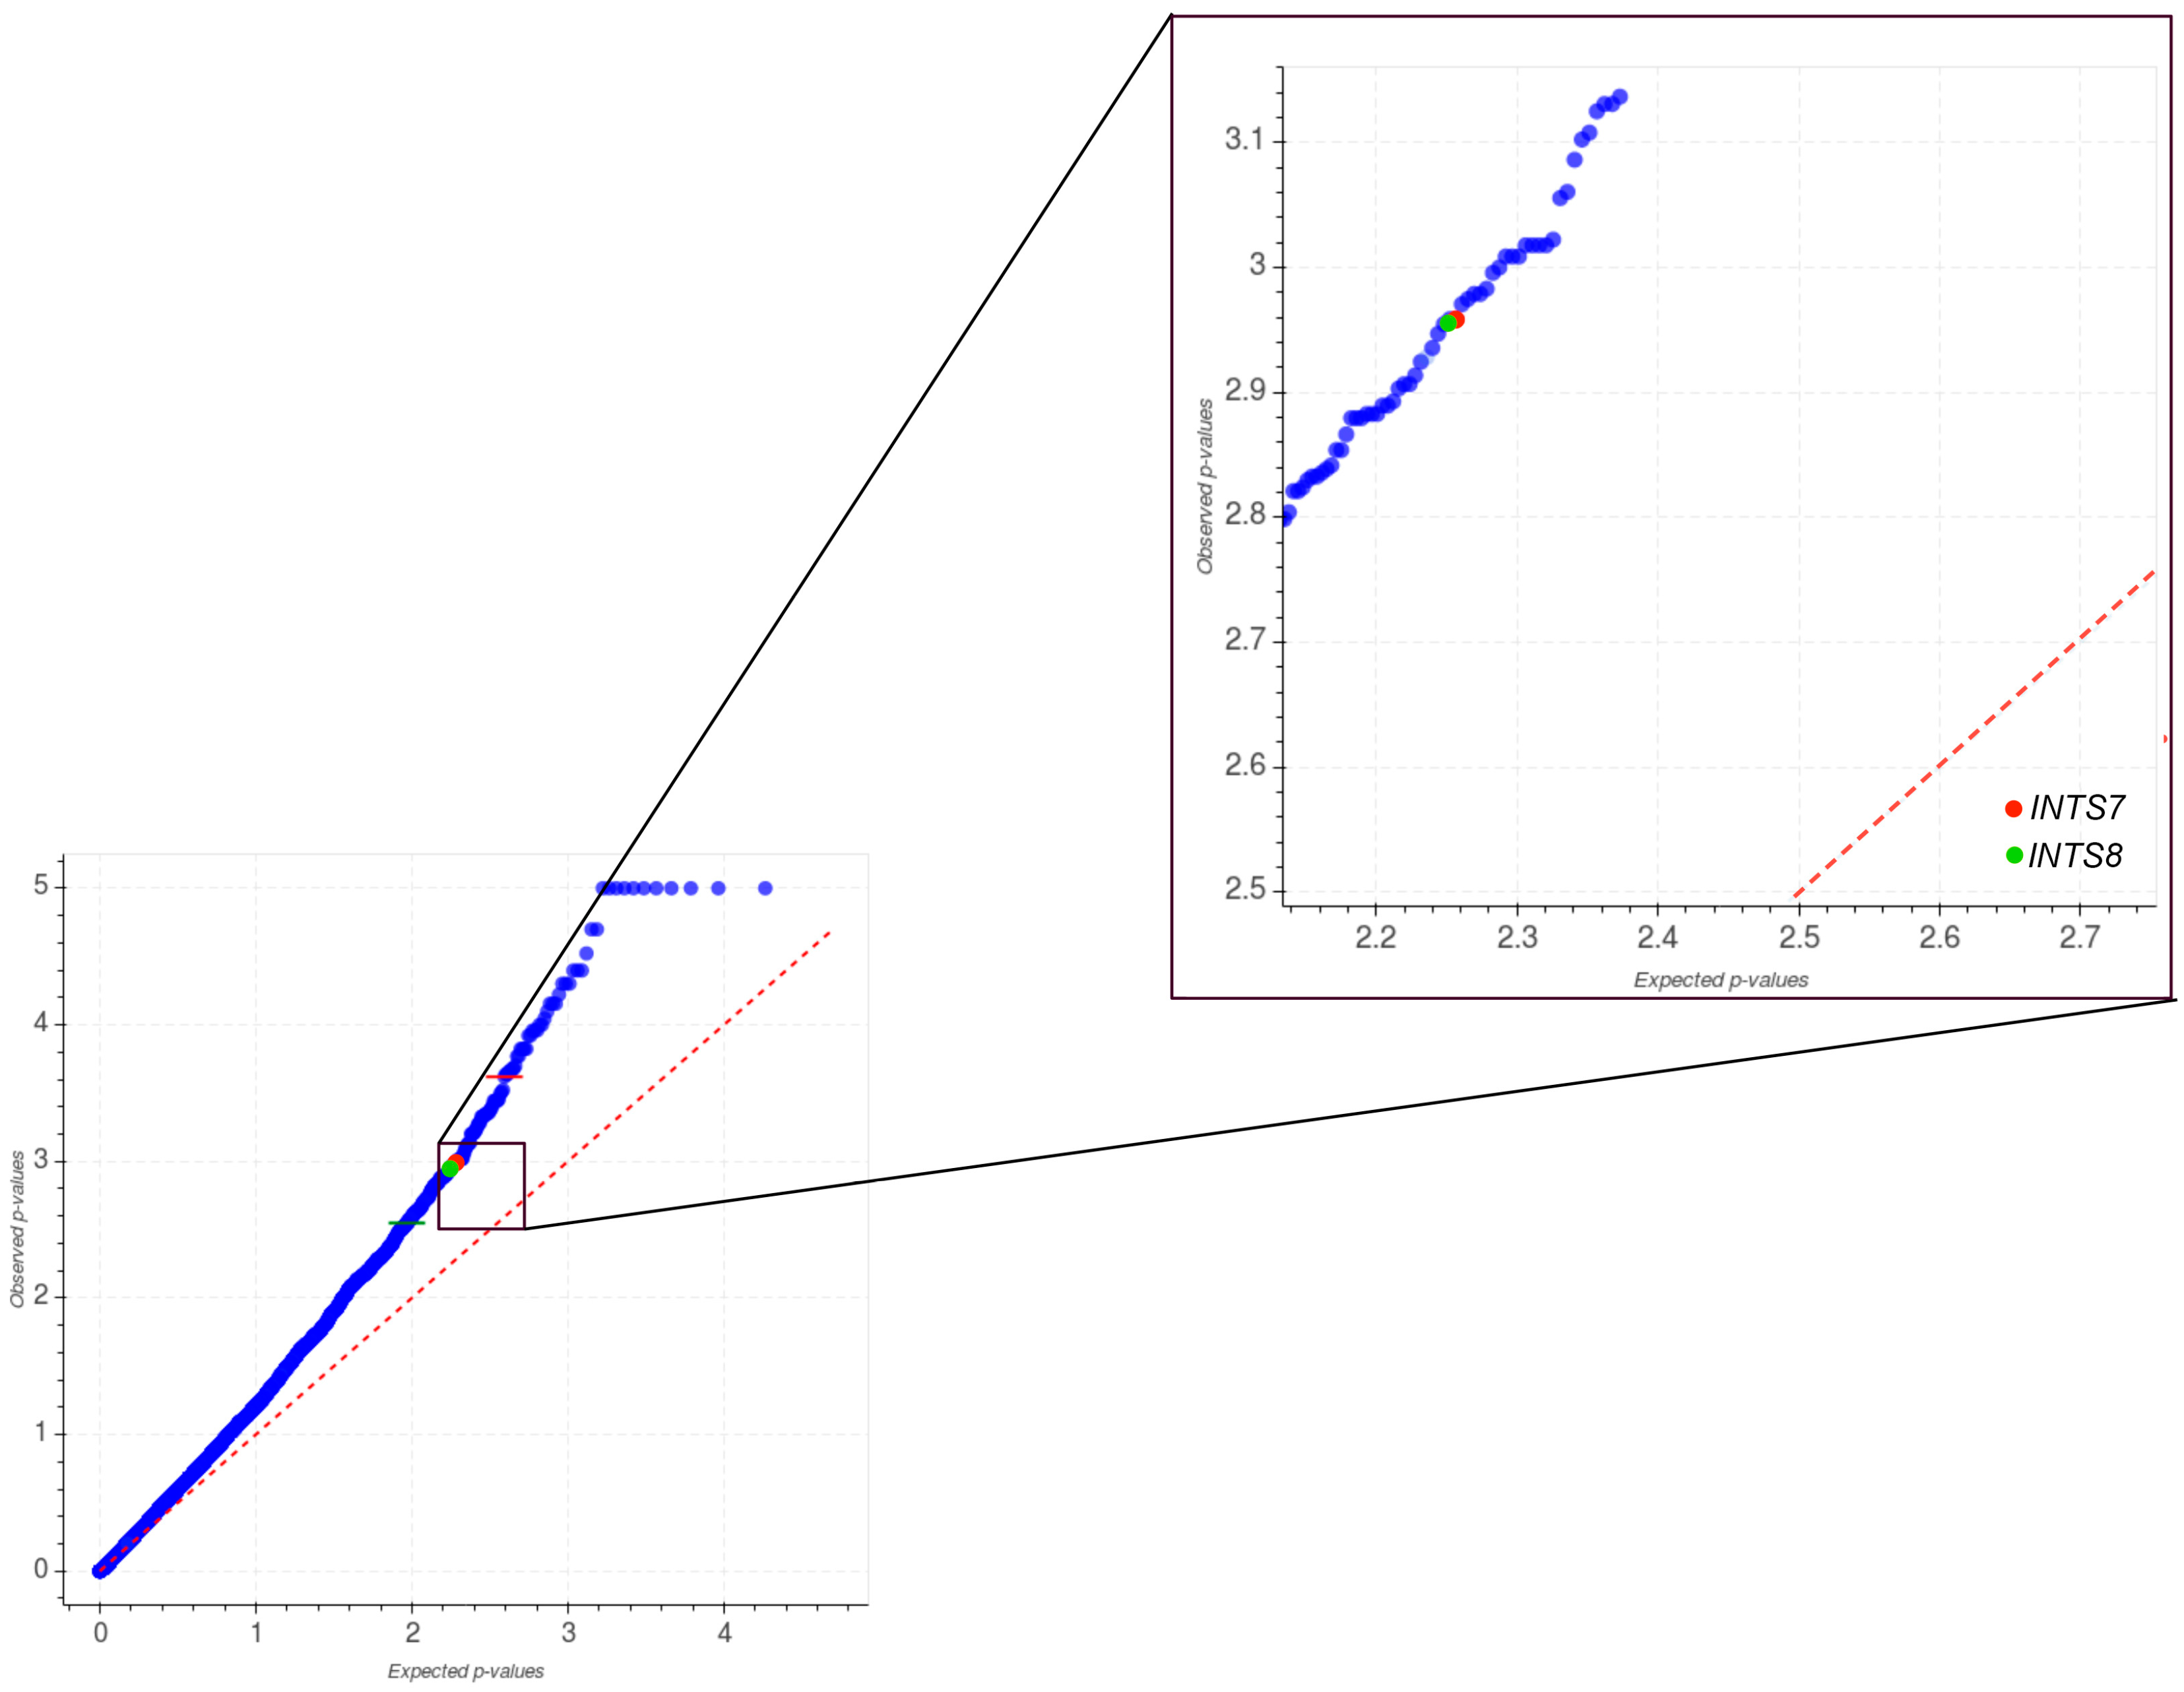
2.1. Mutational Profiling of Integrator Complex across Human Cancers
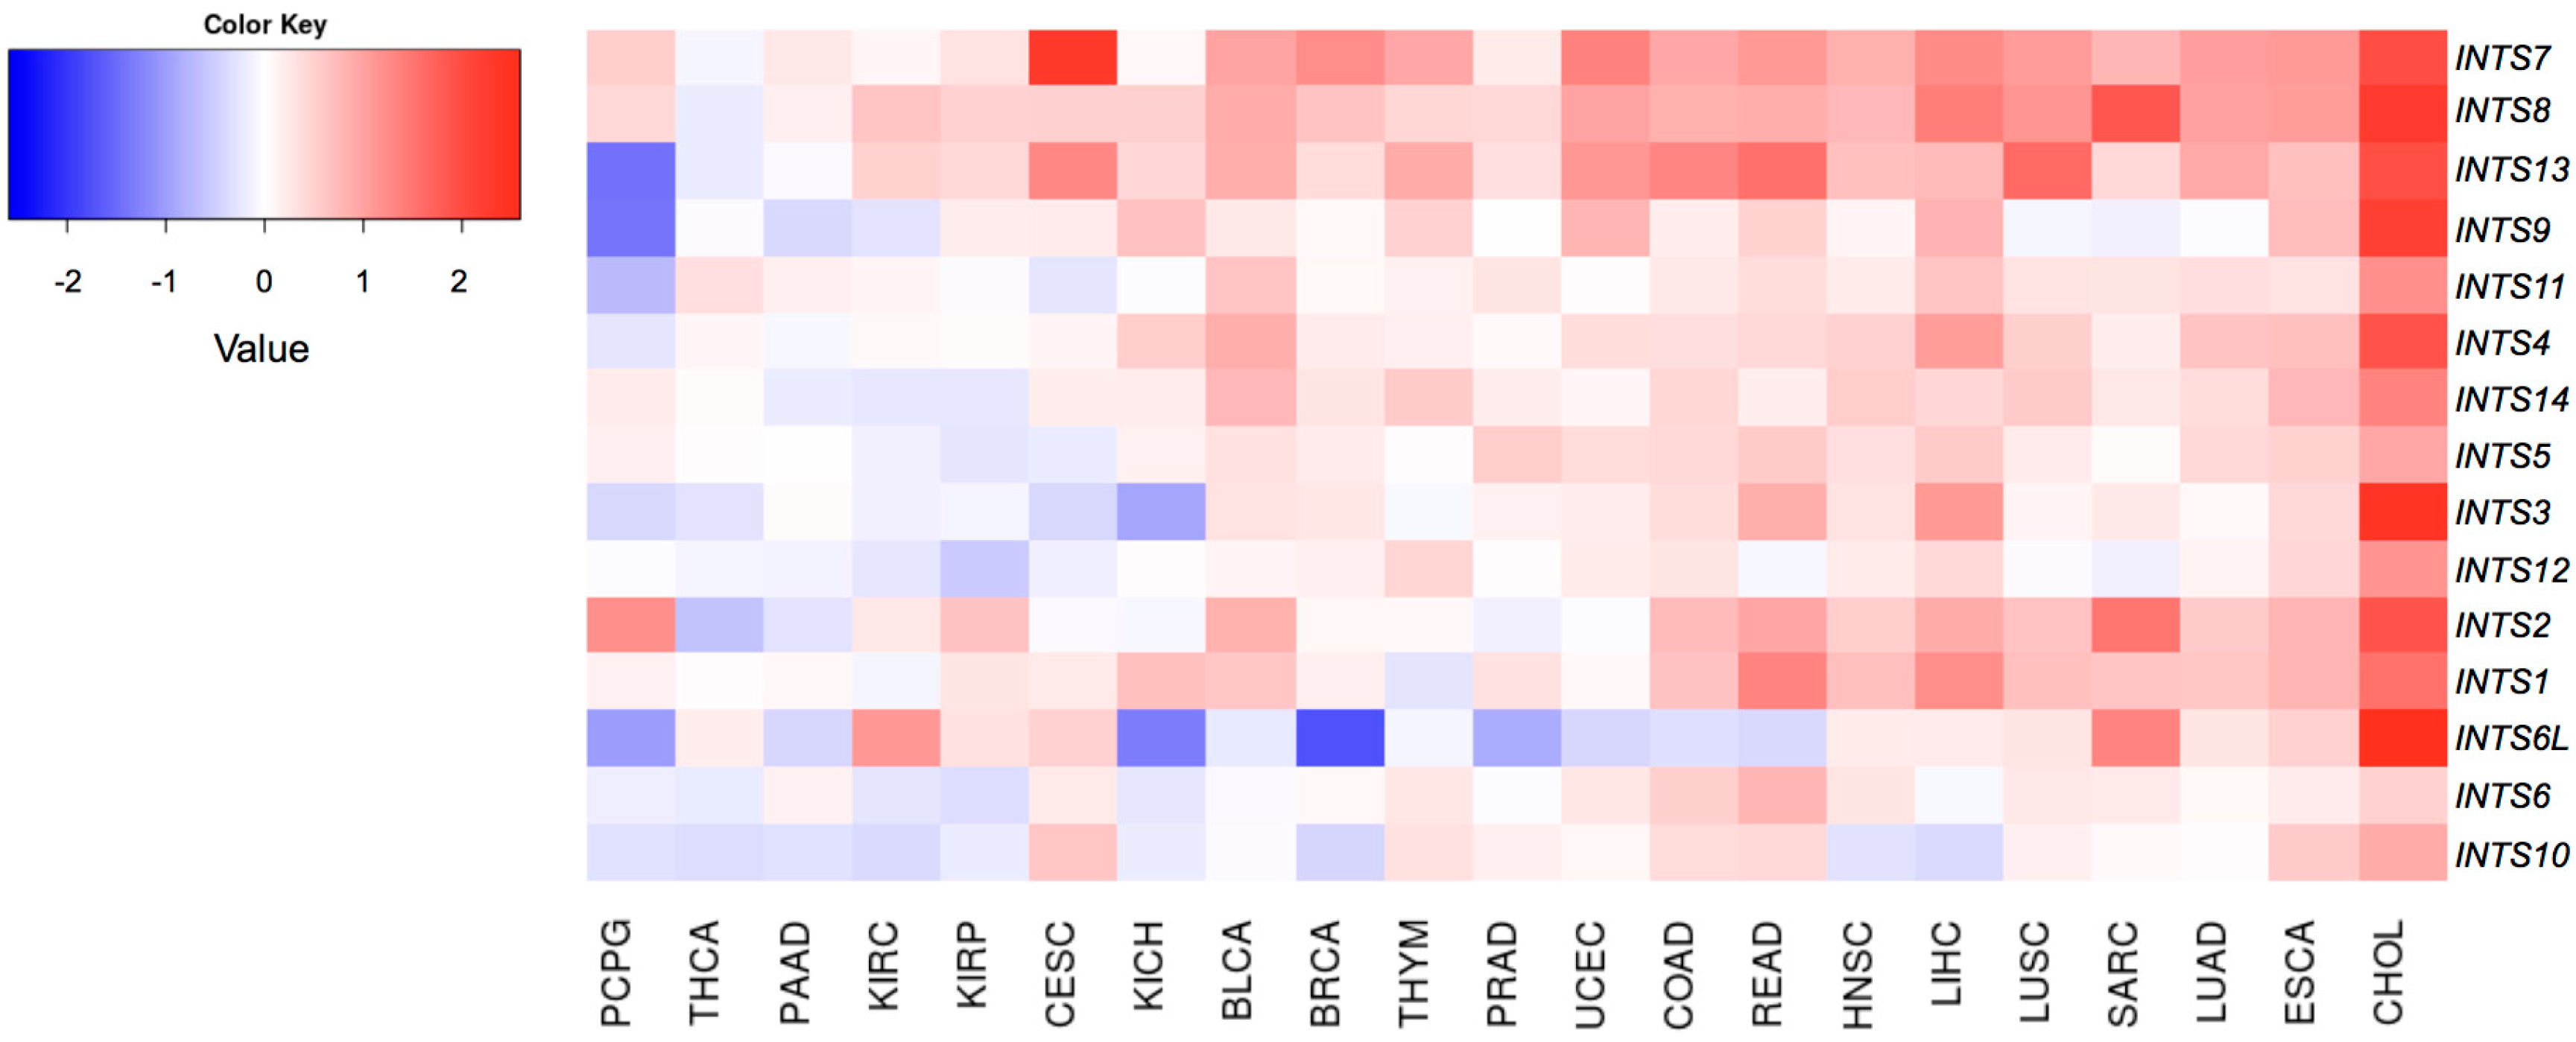
2.2. Differentially Expressed INT Subunits across Human Cancers
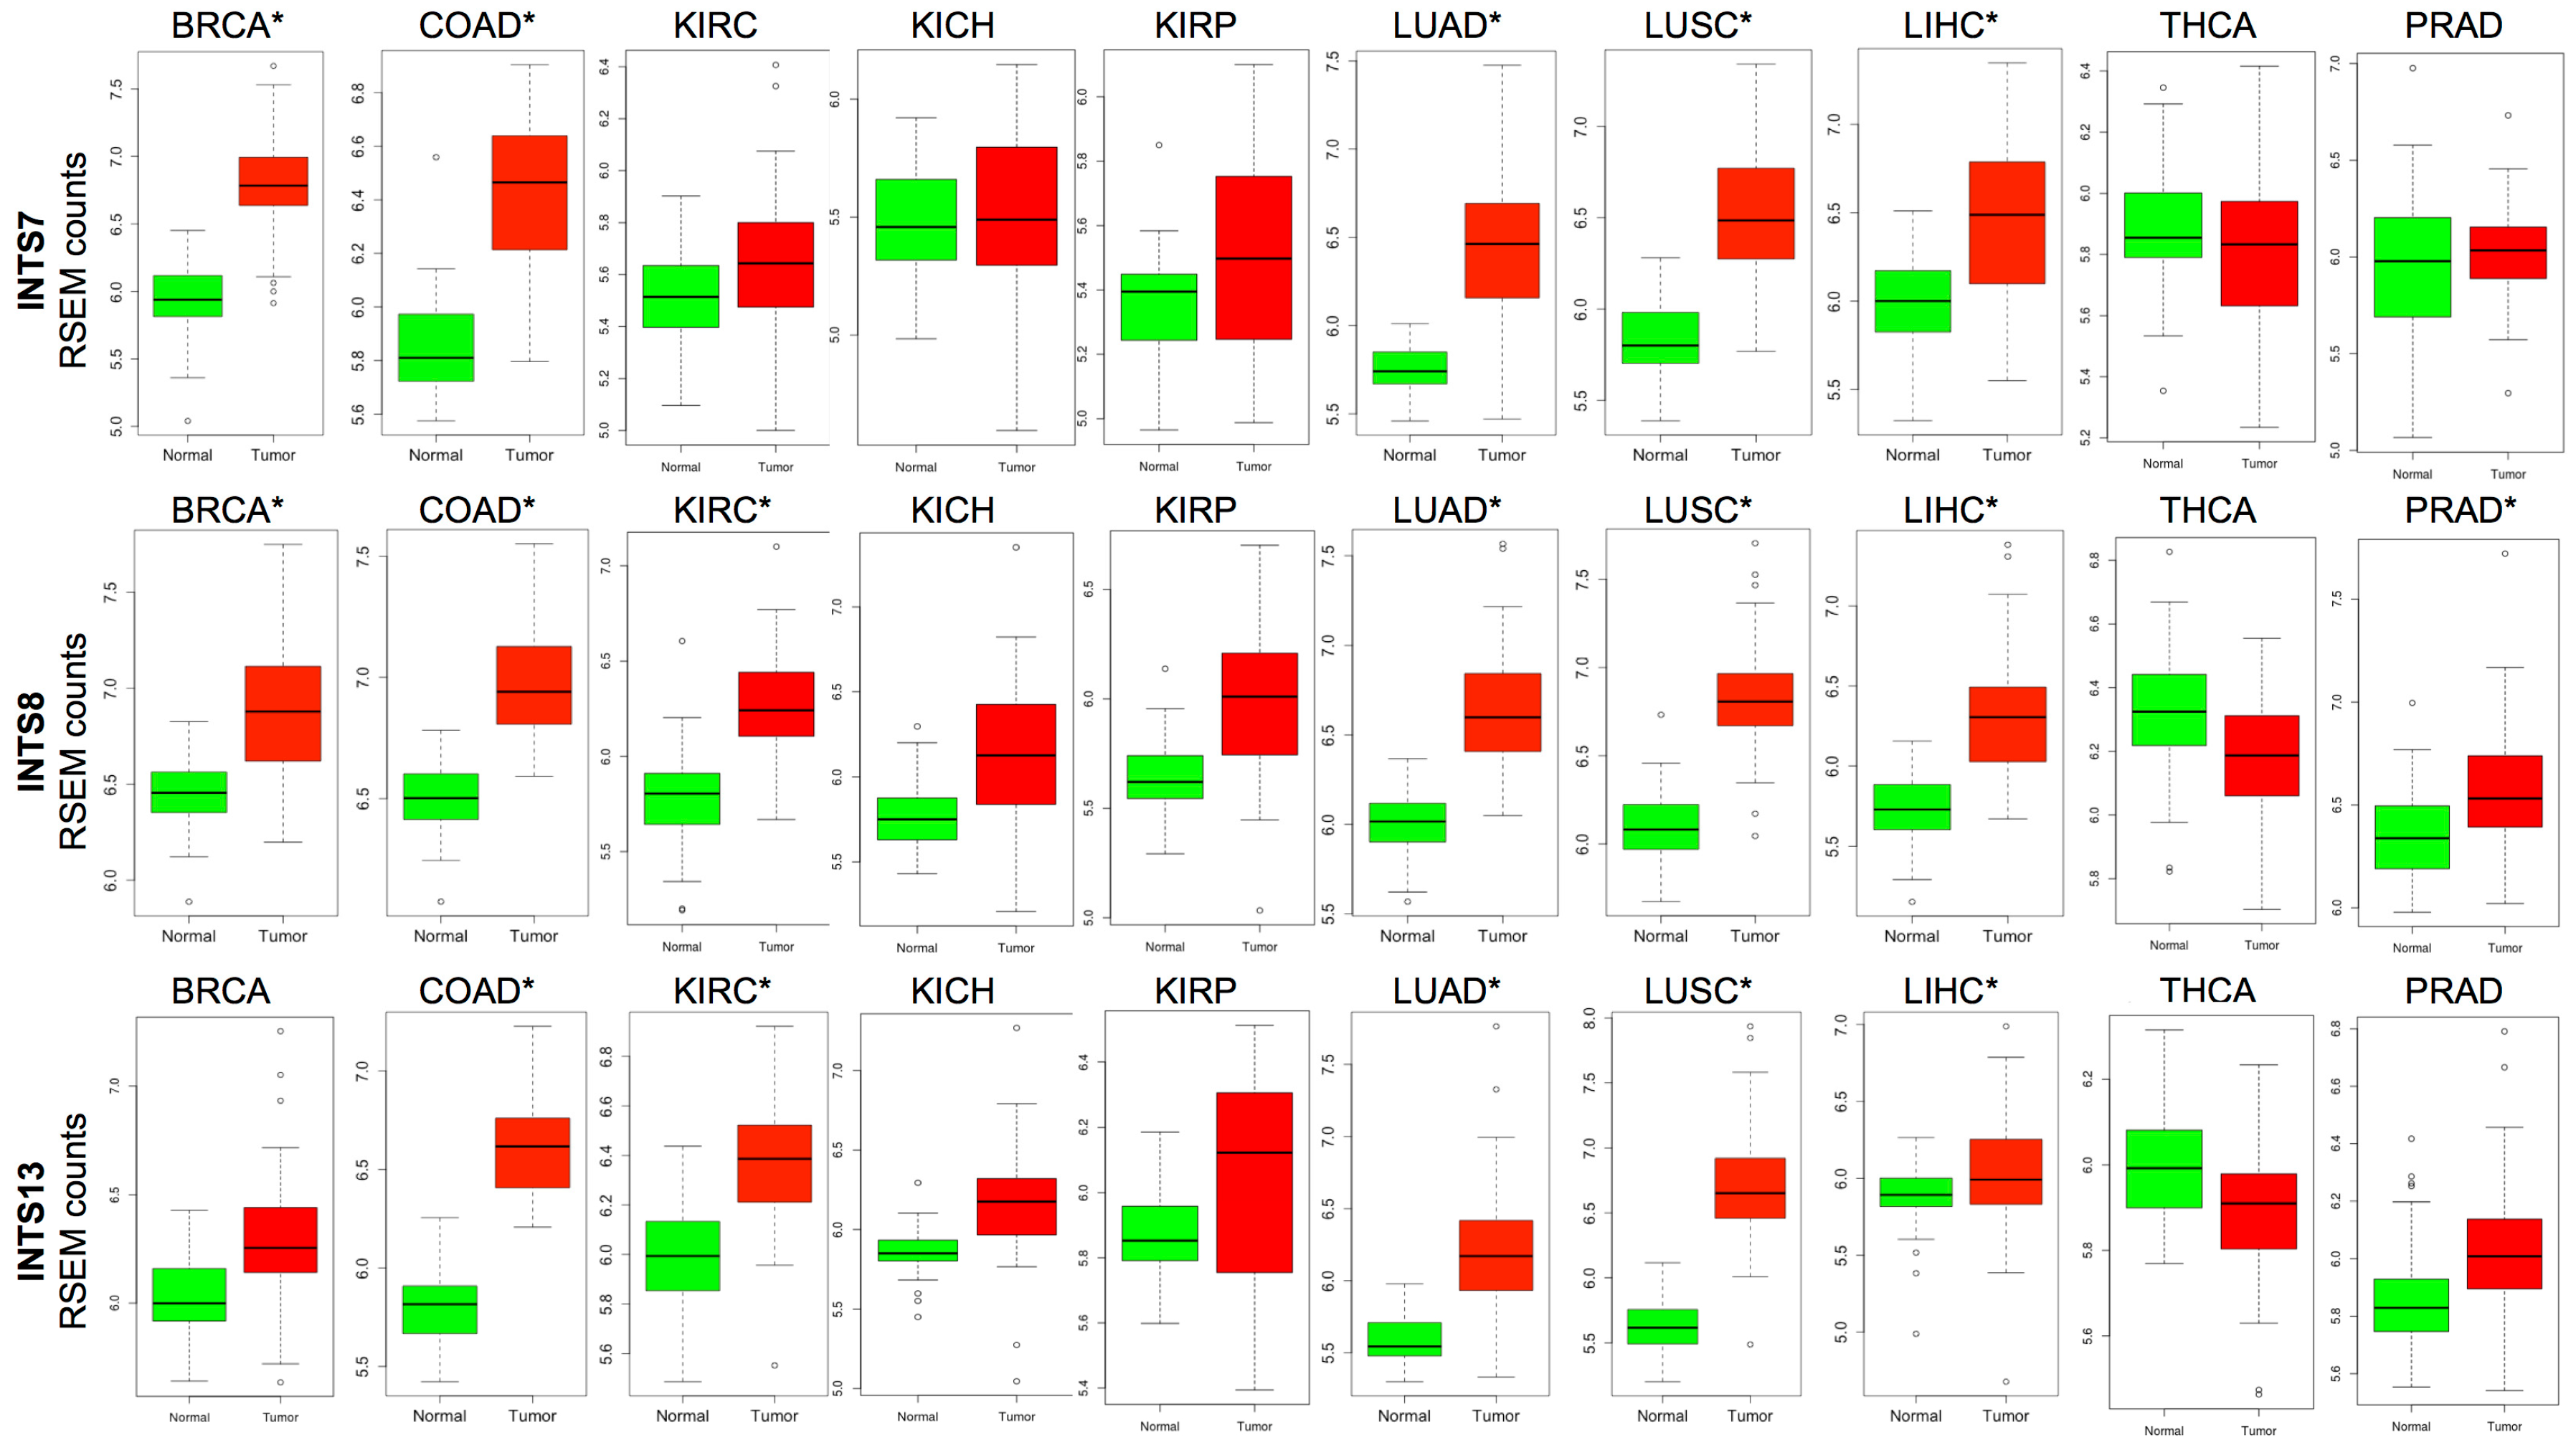
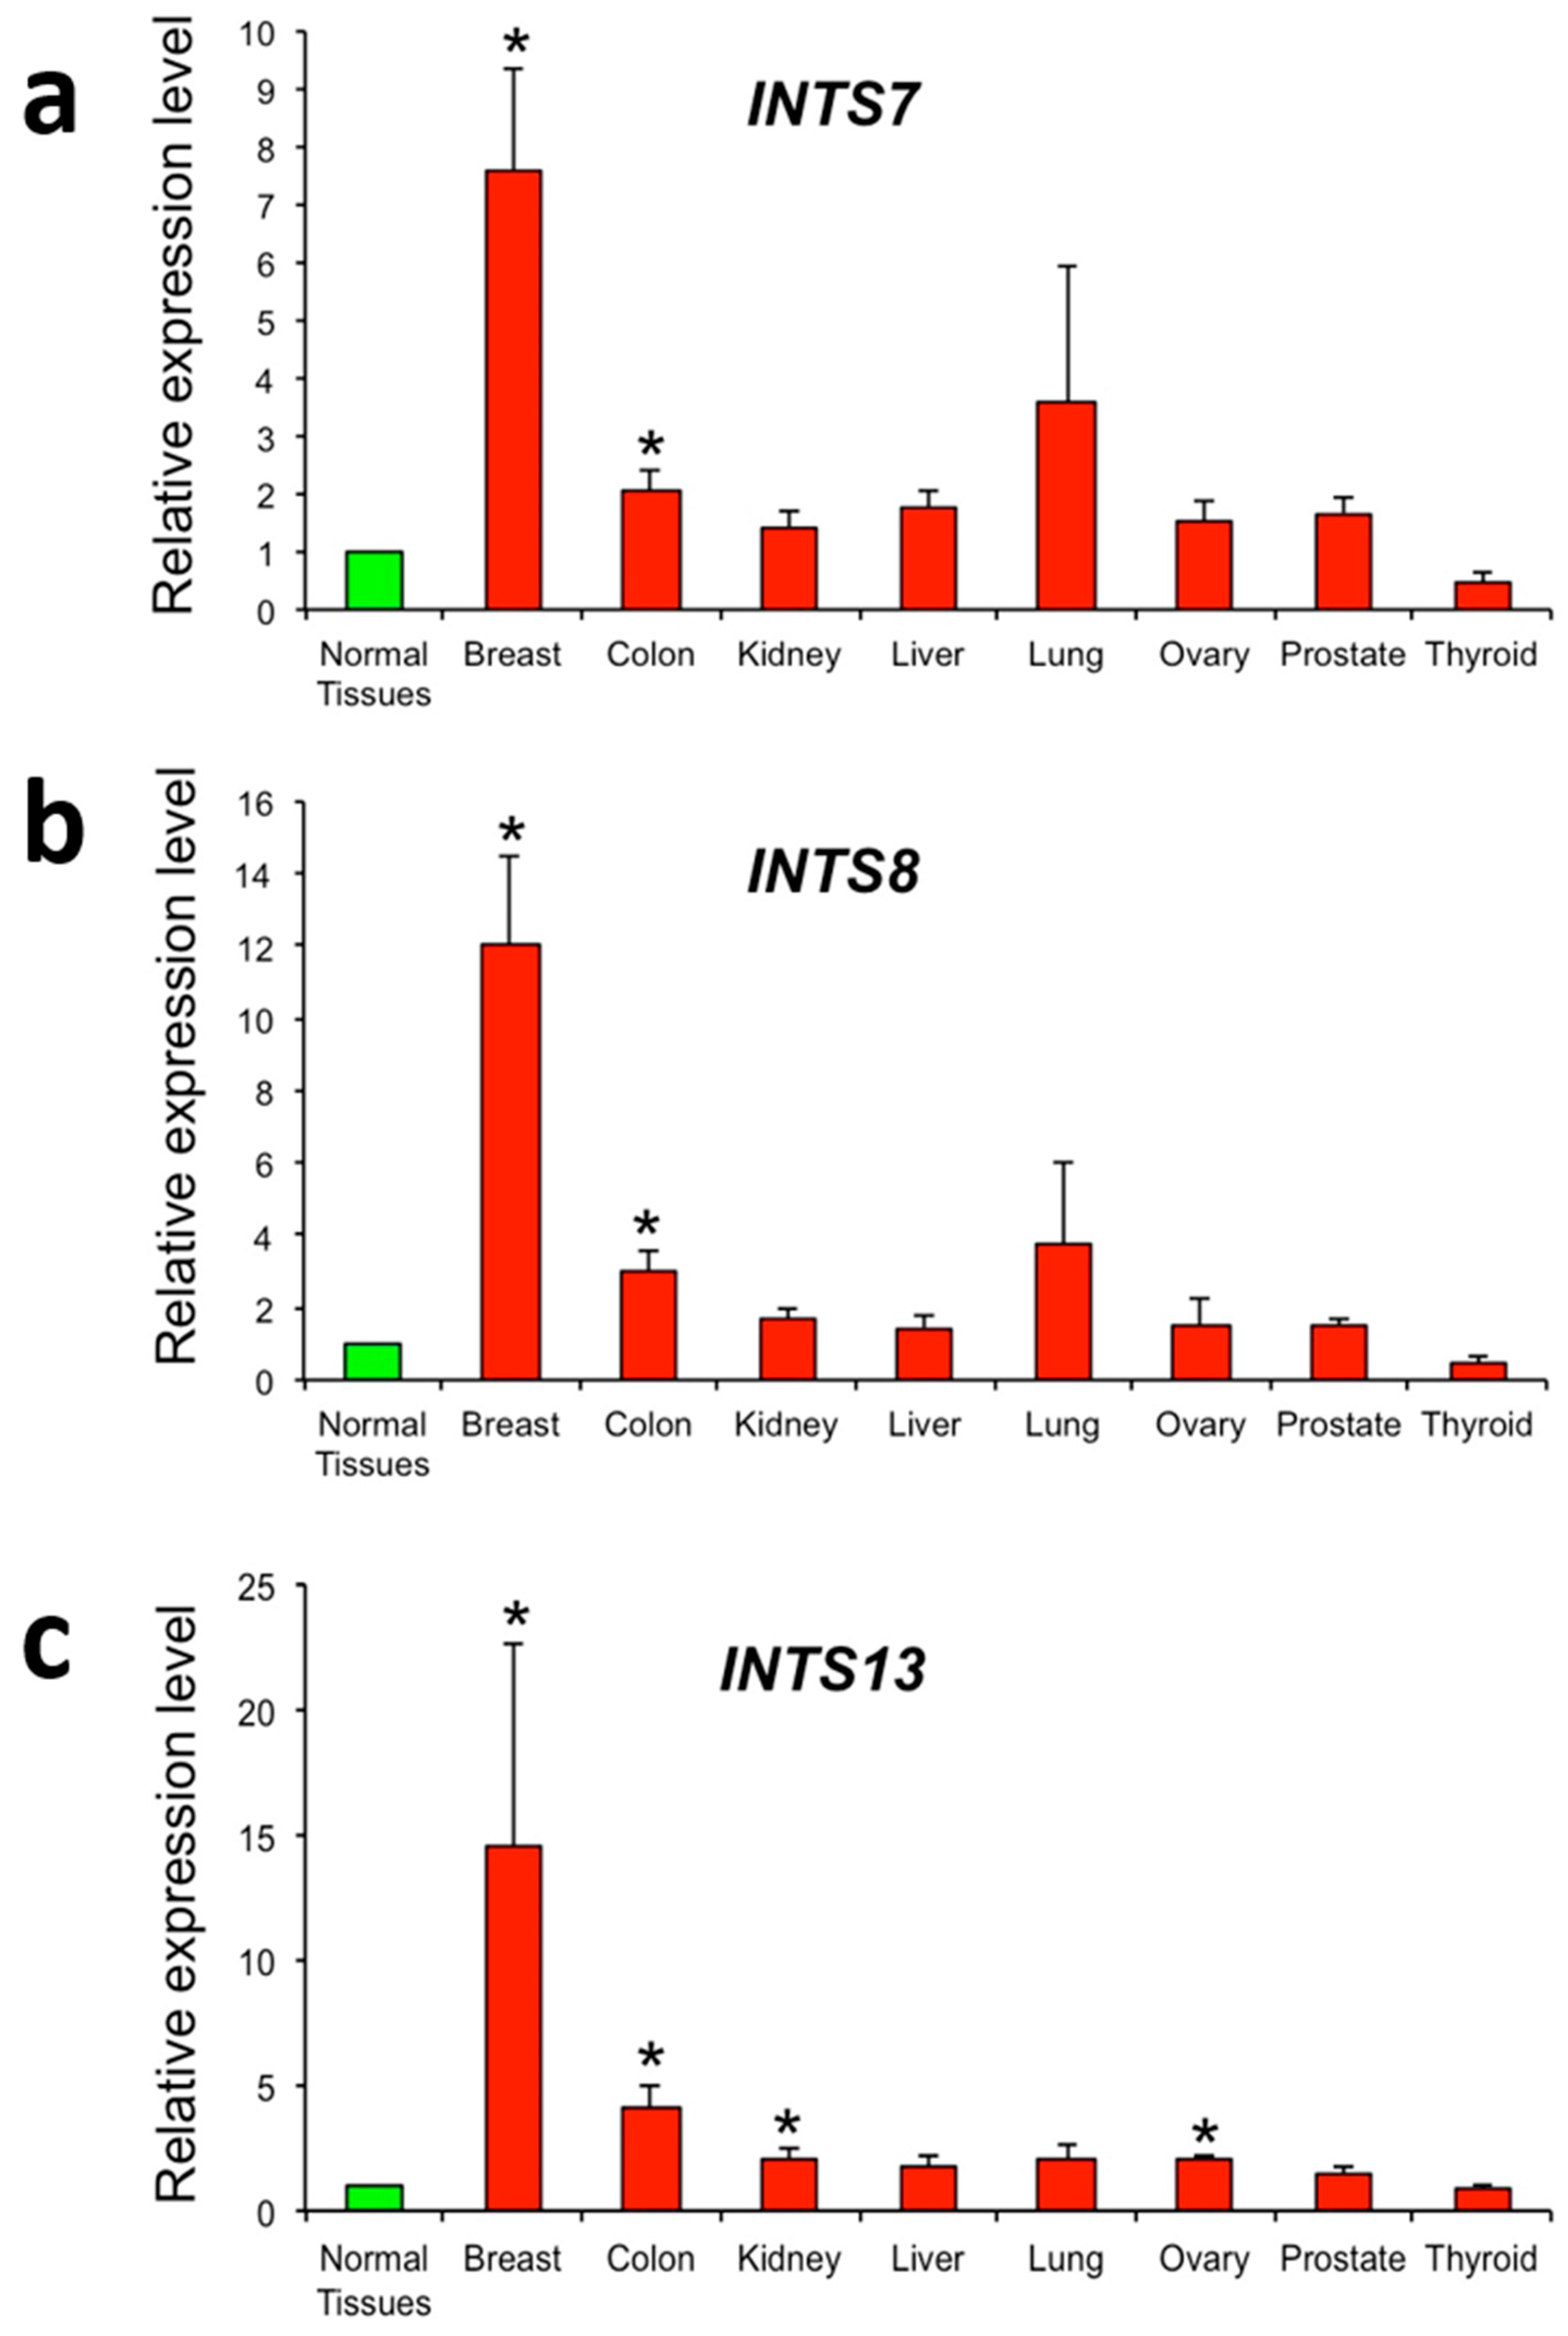
2.3. The Expression of INTS7, INTS8 and INTS13 Is Increased in Human Primary Tumors
3. Discussion
4. Materials and Methods
4.1. TCGA Data Source Selection and Processing for Mutation Analysis
4.2. TCGA Data Source Selection and Processing for Expression Analysis
4.3. Real-Time RT-PCR Analysis
Supplementary Materials
Acknowledgments
Author Contributions
Conflicts of Interest
Abbreviations
| INT | Integrator complex |
| NABP | Nucleic acid binding proteins |
| TCGA | The Cancer Genome Atlas |
| FC | Fold change |
| FDR | False discovery rate |
References
- Baillat, D.; Hakimi, M.A.; Näär, A.M.; Shilatifard, A.; Cooch, N.; Shiekhattar, R. Integrator, a multiprotein mediator of small nuclear RNA processing, associates with the C-terminal repeat of RNA polymerase II. Cell 2005, 123, 265–276. [Google Scholar] [CrossRef] [PubMed]
- Baillat, D.; Wagner, E.J. Integrator: Surprisingly diverse functions in gene expression. Trends Biochem. Sci 2015, 40, 257–264. [Google Scholar] [CrossRef] [PubMed]
- Rienzo, M.; Casamassimi, A. Integrator complex and transcription regulation: Recent findings and pathophysiology. Biochim. Biophys. Acta 2016, 1859, 1269–1280. [Google Scholar] [CrossRef] [PubMed]
- Dominski, Z.; Yang, X.C.; Purdy, M.; Wagner, E.J.; Marzluff, W.F. A CPSF-73 homologue is required for cell cycle progression but not cell growth and interacts with a protein having features of CPSF-100. Mol. Cell. Biol. 2005, 25, 1489–1500. [Google Scholar] [CrossRef] [PubMed]
- Chen, J.; Wagner, E.J. snRNA 3′ end formation: The dawn of the Integrator complex. Biochem. Soc. Trans. 2010, 38, 1082–1087. [Google Scholar] [CrossRef] [PubMed]
- Ezzeddine, N.; Chen, J.; Waltenspiel, B.; Burch, B.; Albrecht, T.; Zhuo, M.; Warren, W.D.; Marzluff, W.F.; Wagner, E.J. A subset of Drosophila integrator proteins is essential for efficient U7 snRNA and spliceosomal snRNA 3′-end formation. Mol. Cell. Biol. 2011, 31, 328–341. [Google Scholar] [CrossRef] [PubMed]
- Albrecht, T.R.; Wagner, E.J. snRNA 3′ end formation requires heterodimeric association of integrator subunits. Mol. Cell. Biol. 2012, 32, 1112–1123. [Google Scholar] [CrossRef] [PubMed]
- O’Reilly, D.; Kuznetsova, O.V.; Laitem, C.; Zaborowska, J.; Dienstbier, M.; Murphy, S. Human snRNA genes use polyadenylation factors to promote efficient transcription termination. Nucleic Acids Res. 2014, 42, 264–275. [Google Scholar] [CrossRef] [PubMed]
- Gardini, A.; Baillat, D.; Cesaroni, M.; Hu, D.; Marinis, J.M.; Wagner, E.J.; Lazar, M.A.; Shilatifard, A.; Shiekhattar, R. Integrator regulates transcriptional initiation and pause release following activation. Mol. Cell 2014, 56, 128–139. [Google Scholar] [CrossRef] [PubMed]
- Stadelmayer, B.; Micas, G.; Gamot, A.; Martin, P.; Malirat, N.; Koval, S.; Raffel, R.; Sobhian, B.; Severac, D.; Rialle, S.; et al. Integrator complex regulates NELF-mediated RNA polymerase II pause/release and processivity at coding genes. Nat. Commun. 2014, 5, 5531. [Google Scholar] [CrossRef] [PubMed]
- Skaar, J.R.; Ferris, A.L.; Wu, X.; Saraf, A.; Khanna, K.K.; Florens, L.; Washburn, M.P.; Hughes, S.H.; Pagano, M. The Integrator complex controls the termination of transcription at diverse classes of gene targets. Cell Res. 2015, 25, 288–305. [Google Scholar] [CrossRef] [PubMed]
- Lai, F.; Gardini, A.; Zhang, A.; Shiekhattar, R. Integrator mediates the biogenesis of enhancer RNAs. Nature 2015, 525, 399–403. [Google Scholar] [CrossRef] [PubMed]
- Huang, J.; Gong, Z.; Ghosal, G.; Chen, J. SOSS complexes participate in the maintenance of genomic stability. Mol. Cell 2009, 35, 384–393. [Google Scholar] [CrossRef] [PubMed]
- Li, Y.; Bolderson, E.; Kumar, R.; Muniandy, P.A.; Xue, Y.; Richard, D.J.; Seidman, M.; Pandita, T.K.; Khanna, K.K.; Wang, W. hSSB1 and hSSB2 form similar multiprotein complexes that participate in DNA damage response. J. Biol. Chem. 2009, 284, 23525–23531. [Google Scholar] [CrossRef] [PubMed]
- Skaar, J.R.; Richard, D.J.; Saraf, A.; Toschi, A.; Bolderson, E.; Florens, L.; Washburn, M.P.; Khanna, K.K.; Pagano, M. INTS3 controls the hSSB1-mediated DNA damage response. J. Cell Biol. 2009, 187, 25–32. [Google Scholar] [CrossRef] [PubMed]
- Zhang, F.; Wu, J.; Yu, X. Integrator3, a partner of single-stranded DNA-binding protein 1, participates in the DNA damage response. J. Biol. Chem. 2009, 284, 30408–30415. [Google Scholar] [CrossRef] [PubMed]
- Wieland, I.; Arden, K.C.; Michels, D.; Klein-Hitpass, L.; Bohm, M.; Viars, C.S.; Weidle, U.H. Isolation of DICE1: A gene frequently affected by LOH and downregulated in lung carcinomas. Oncogene 1999, 18, 4530–4537. [Google Scholar] [CrossRef] [PubMed]
- Wieland, I.; Röpke, A.; Stumm, M.; Sell, C.; Weidle, U.H.; Wieacker, P.F. Molecular characterization of the DICE1 (DDX26) tumor suppressor gene in lung carcinoma cells. Oncol. Res. 2001, 12, 491–500. [Google Scholar] [CrossRef] [PubMed]
- Li, W.J.; Hu, N.; Su, H.; Wang, C.; Goldstein, A.M.; Wang, Y.; Emmert-Buck, M.R.; Roth, M.J.; Guo, W.J.; Taylor, P.R. Allelic loss on chromosome 13q14 and mutation in deleted in cancer 1 gene in esophageal squamous cell carcinoma. Oncogene 2003, 22, 314–318. [Google Scholar] [CrossRef] [PubMed]
- Röpke, A.; Buhtz, P.; Böhm, M.; Seger, J.; Wieland, I.; Allhoff, EP.; Wieacker, P.F. Promoter CpG hypermethylation and downregulation of DICE1 expression in prostate cancer. Oncogene 2005, 24, 6667–6675. [Google Scholar] [CrossRef] [PubMed]
- Li, J.; Zhai, X.; Wang, H.; Qian, X.; Miao, H.; Zhu, X. Bioinformatics analysis of gene expression profiles in childhood B-precursor acute lymphoblastic leukemia. Hematology 2015, 20, 377–383. [Google Scholar] [CrossRef] [PubMed]
- Ellinghaus, E.; Stanulla, M.; Richter, G.; Ellinghaus, D.; te Kronnie, G.; Cario, G.; Cazzaniga, G.; Horstmann, M.; Panzer Grümayer, R.; Cavé, H.; et al. Identification of germline susceptibility loci in ETV6-RUNX1-rearranged childhood acute lymphoblastic leukemia. Leukemia 2012, 26, 902–909. [Google Scholar] [CrossRef] [PubMed]
- Peng, H.; Ishida, M.; Li, L.; Saito, A.; Kamiya, A.; Hamilton, J.P.; Fu, R.; Olaru, A.V.; An, F.; Popescu, I.; et al. Pseudogene INTS6P1 regulates its cognate gene INTS6 through competitive binding of miR-17–5p in hepatocellular carcinoma. Oncotarget 2015, 6, 5666–5677. [Google Scholar] [CrossRef] [PubMed]
- Zhang, F.; Ma, T.; Yu, X. A core hSSB1-INTS complex participates in the DNA damage response. J. Cell Sci. 2013, 126, 4850–4855. [Google Scholar] [CrossRef] [PubMed]
- Inagaki, Y.; Yasui, K.; Endo, M.; Nakajima, T.; Zen, K.; Tsuji, K.; Minami, M.; Tanaka, S.; Taniwaki, M.; Itoh, Y.; et al. CREB3L4, INTS3, and SNAPAP are targets for the 1q21 amplicon frequently detected in hepatocellular carcinoma. Cancer Genet. Cytogenet. 2008, 180, 30–36. [Google Scholar] [CrossRef] [PubMed]
- Cheng, L.; Zhang, Q.; Yang, S.; Yang, Y.; Zhang, W.; Gao, H.; Deng, X.; Zhang, Q. A 4-gene panel as a marker at chromosome 8q in Asian gastric cancer patients. Genomics 2013, 102, 323–330. [Google Scholar] [CrossRef] [PubMed]
- Simpson, H.M.; Khan, R.Z.; Song, C.; Sharma, D.; Sadashivaiah, K.; Furusawa, A.; Liu, X.; Nagaraj, S.; Sengamalay, N.; Sadzewicz, L.; et al. Concurrent mutations in ATM and genes associated with common γ chain signaling in peripheral T cell lymphoma. PLoS ONE 2015, 10, e0141906. [Google Scholar] [CrossRef] [PubMed]
- Jung, H.M.; Choi, S.J.; Kim, J.K. Expression profiles of SV40-immortalization-associated genes upregulated in various human cancers. J. Cell. Biochem. 2009, 106, 703–713. [Google Scholar] [CrossRef] [PubMed]
- Lim, B.; Kim, C.; Kim, J.H.; Kwon, W.S.; Lee, W.S.; Kim, J.M.; Park, J.Y.; Kim, H.S.; Park, K.H.; Kim, T.S.; et al. Genetic alterations and their clinical implications in gastric cancer peritoneal carcinomatosis revealed by whole-exome sequencing of malignant ascites. Oncotarget 2016, 7, 8055–8066. [Google Scholar] [PubMed]
- Guerrero-Preston, R.; Valle, B.L.; Jedlicka, A.; Turaga, N.; Folawiyo, O.; Pirini, F.; Lawson, F.; Vergura, A.; Noordhuis, M.G.; Dziedzic, A.; et al. Molecular triage of premalignant lesions in liquid-based cervical cytology and circulating cell free DNA from urine, using methylated viral and host genes. Cancer Prev. Res. 2016, 9, 915–924. [Google Scholar] [CrossRef] [PubMed]
- Cancer Genome Atlas Research Network; Weinstein, J.N.; Collisson, E.A.; Mills, G.B.; Shaw, K.R.; Ozenberger, B.A.; Ellrott, K.; Shmulevich, I.; Sander, C.; Stuart, J.M. The Cancer Genome Atlas Pan-Cancer analysis project. Nat. Genet. 2013, 45, 1113–1120. [Google Scholar] [PubMed]
- Mularoni, L.; Sabarinathan, R.; Deu-Pons, J.; Gonzalez-Perez, A.; López-Bigas, N. OncodriveFML: A general framework to identify coding and non-coding regions with cancer driver mutations. Genome Biol. 2016, 17, 128. [Google Scholar] [CrossRef] [PubMed]
- Lawrence, M.S.; Stojanov, P.; Polak, P.; Kryukov, G.V.; Cibulskis, K.; Sivachenko, A.; Carter, S.L.; Stewart, C.; Mermel, C.H.; Roberts, S.A.; et al. Mutational heterogeneity in cancer and the search for new cancer-associated genes. Nature 2013, 499, 214–218. [Google Scholar] [CrossRef] [PubMed]
- Costa, V.; Esposito, R.; Ziviello, C.; Sepe, R.; Bim, L.V.; Cacciola, N.A.; Decaussin-Petrucci, M.; Pallante, P.; Fusco, A.; Ciccodicola, A. New somatic mutations and WNK1-B4GALNT3 gene fusion in papillary thyroid carcinoma. Oncotarget 2015, 6, 11242–11251. [Google Scholar] [CrossRef] [PubMed]
- Vogelstein, B.; Papadopoulos, N.; Velculescu, V.E.; Zhou, S.; Diaz, L.A., Jr.; Kinzler, K.W. Cancer genome landscapes. Science 2013, 339, 1546–1558. [Google Scholar] [CrossRef] [PubMed]
- Garraway, L.A.; Lander, E.S. Lessons from the cancer genome. Cell 2013, 153, 17–37. [Google Scholar] [CrossRef] [PubMed]
- Marx, V. Cancer genomes: Discerning drivers from passengers. Nat. Methods 2014, 11, 375–379. [Google Scholar] [CrossRef] [PubMed]
- Cancer Genome Atlas Research Network; Kandoth, C.; Schultz, N.; Cherniack, A.D.; Akbani, R.; Liu, Y.; Shen, H.; Robertson, A.G.; Pashtan, I.; Shen, R.; et al. Integrated genomic characterization of endometrial carcinoma. Nature 2013, 497, 67–73. [Google Scholar] [PubMed]
- Poole, W.; Leinonen, K.; Shmulevich, I.; Knijnenburg, T.A.; Bernard, B. Multiscale mutation clustering algorithm identifies pan-cancer mutational clusters associated with pathway-level changes in gene expression. PLoS Comput. Biol. 2017, 13, e1005347. [Google Scholar] [CrossRef] [PubMed]
- Tokheim, C.J.; Papadopoulos, N.; Kinzler, K.W.; Vogelstein, B.; Karchin, R. Evaluating the evaluation of cancer driver genes. Proc. Natl. Acad. Sci. USA 2016, 113, 14330–14335. [Google Scholar] [CrossRef] [PubMed]
- Castro-Giner, F.; Ratcliffe, P.; Tomlinson, I. The mini-driver model of polygenic cancer evolution. Nat. Rev. Cancer 2015, 15, 680–685. [Google Scholar] [CrossRef] [PubMed]
- Nussinov, R.; Tsai, CJ. “Latent drivers” expand the cancer mutational landscape. Curr. Opin. Struct. Biol. 2015, 32, 25–32. [Google Scholar] [CrossRef] [PubMed]
- Cotta-Ramusino, C.; McDonald, E.R., 3rd; Hurov, K.; Sowa, M.E.; Harper, J.W.; Elledge, S.J. A DNA damage response screen identifies RHINO, a 9-1-1 and TopBP1 interacting protein required for ATR signaling. Science 2011, 332, 1313–1317. [Google Scholar] [CrossRef] [PubMed]
- Leiserson, M.D.; Vandin, F.; Wu, H.T.; Dobson, J.R.; Eldridge, J.V.; Thomas, J.L.; Papoutsaki, A.; Kim, Y.; Niu, B.; McLellan, M.; et al. Pan-cancer network analysis identifies combinations of rare somatic mutations across pathways and protein complexes. Nat. Genet. 2015, 47, 106–114. [Google Scholar] [CrossRef] [PubMed]
- Cho, A.; Shim, J.E.; Kim, E.; Supek, F.; Lehner, B.; Lee, I. MUFFINN: Cancer gene discovery via network analysis of somatic mutation data. Genome Biol. 2016, 17, 129. [Google Scholar] [CrossRef] [PubMed]
- Angelini, C.; Costa, V. Understanding gene regulatory mechanisms by integrating ChIP-seq and RNA-seq data: Statistical solutions to biological problems. Front. Cell Dev. Biol. 2014, 2, 51. [Google Scholar] [CrossRef] [PubMed]
- TCGA. Available online: https://tcga-data.nci.nih.gov/tcga/ (accessed on 6 June 2016).
- HGNC. Available online: http://www.genenames.org/cgi-bin/genefamilies/set/1366 (accessed on 28 April 2017).
- OncodriveFML. Available online: https://bitbucket.org/bbglab/oncodrivefml (accessed on 28 April 2017).
- Primer3Plus. Available online: http://primer3plus.com/cgi-bin/dev/primer3plus.cgi (accessed on 28 April 2017).
- UCSC-Genome Browser. Available online: https://genome.ucsc.edu (accessed on 28 April 2017).
- De Brasi, D.; Esposito, T.; Rossi, M.; Parenti, G.; Sperandeo, M.P.; Zuppaldi, A.; Bardaro, T.; Ambruzzi, M.A.; Zelante, L.; Ciccodicola, A.; et al. Smith-Lemli-Opitz syndrome: Evidence of T93M as a common mutation of D7-sterol reductase in Italy and report of three novel mutations. Eur. J. Hum. Genet. 1999, 7, 937–940. [Google Scholar] [CrossRef] [PubMed]
- Costa, V.; Angelini, C.; D’Apice, L.; Mutarelli, M.; Casamassimi, A.; Sommese, L.; Gallo, M.A.; Aprile, M.; Esposito, R.; Leone, L.; et al. Massive-scale RNA-Seq analysis of non ribosomal transcriptome in human trisomy 21. PLoS ONE 2011, 6, e18493. [Google Scholar] [CrossRef] [PubMed]


| Abbreviation | Cancer Type | Mutation Analysis n | Expression Analysis n (Paired) |
|---|---|---|---|
| ACC | Adrenocortical carcinoma | 92 | - |
| BLCA | Bladder cancer | 412 | 19 |
| BRCA | Breast cancer | 1098 | 57 |
| CESC | Cervical squamous cell carcinoma and endocervical adenocarcinoma | 308 | 3 |
| CHOL | Cholangiocarcinoma | 51 | 9 |
| COAD | Colon adenocarcinoma | 463 | 26 |
| DLBC | Lymphoid neoplasm diffuse large B-cell lymphoma | 58 | - |
| ESCA | Esophageal carcinoma | 185 | 13 |
| GBM | Glioblastoma | 617 | 5 |
| HNSC | Head and neck squamous cell carcinoma | 528 | 43 |
| KICH | Kidney chromophobe carcinoma | 113 | 25 |
| KIRC | Kidney renal clear cell carcinoma | 537 | 72 |
| KIRP | Kidney renal papillary cell carcinoma | 291 | 32 |
| LAML | Acute myeloid leukemia | 200 | - |
| LIHC | Liver hepatocarcinoma | 377 | 50 |
| LUAD | Lung adenocarcinoma | 585 | 58 |
| LUSC | Lung squamous cell carcinoma | 504 | 51 |
| OV | Ovarian cancer | 608 | - |
| PAAD | Pancreas adenocarcinoma | 185 | 51 |
| PCPG | Pheochromocytoma and paraganglioma | 179 | 4 |
| PRAD | Prostate adenocarcinoma | 500 | 3 |
| READ | Rectum adenocarcinoma | 172 | 52 |
| SARC | Sarcoma | 261 | 2 |
| SKCM | Skin cutaneous melanoma | 470 | - |
| STAD | Stomach adenocarcinoma | 478 | - |
| TGCT | Testicular germ cell tumors | 150 | - |
| THCA | Thyroid cancer | 507 | 57 |
| THYM | Thymoma | 124 | 2 |
| UCEC | Uterine corpus endometrial carcinoma | 560 | 7 |
| UCS | Uterine carcinosarcoma | 57 | - |
| UVM | Uveal melanoma | 80 | - |
© 2017 by the authors. Licensee MDPI, Basel, Switzerland. This article is an open access article distributed under the terms and conditions of the Creative Commons Attribution (CC BY) license (http://creativecommons.org/licenses/by/4.0/).
Share and Cite
Federico, A.; Rienzo, M.; Abbondanza, C.; Costa, V.; Ciccodicola, A.; Casamassimi, A. Pan-Cancer Mutational and Transcriptional Analysis of the Integrator Complex. Int. J. Mol. Sci. 2017, 18, 936. https://doi.org/10.3390/ijms18050936
Federico A, Rienzo M, Abbondanza C, Costa V, Ciccodicola A, Casamassimi A. Pan-Cancer Mutational and Transcriptional Analysis of the Integrator Complex. International Journal of Molecular Sciences. 2017; 18(5):936. https://doi.org/10.3390/ijms18050936
Chicago/Turabian StyleFederico, Antonio, Monica Rienzo, Ciro Abbondanza, Valerio Costa, Alfredo Ciccodicola, and Amelia Casamassimi. 2017. "Pan-Cancer Mutational and Transcriptional Analysis of the Integrator Complex" International Journal of Molecular Sciences 18, no. 5: 936. https://doi.org/10.3390/ijms18050936
APA StyleFederico, A., Rienzo, M., Abbondanza, C., Costa, V., Ciccodicola, A., & Casamassimi, A. (2017). Pan-Cancer Mutational and Transcriptional Analysis of the Integrator Complex. International Journal of Molecular Sciences, 18(5), 936. https://doi.org/10.3390/ijms18050936