Identification, Expression, and Functional Analysis of the Fructokinase Gene Family in Cassava

 ,
,
Abstract
:
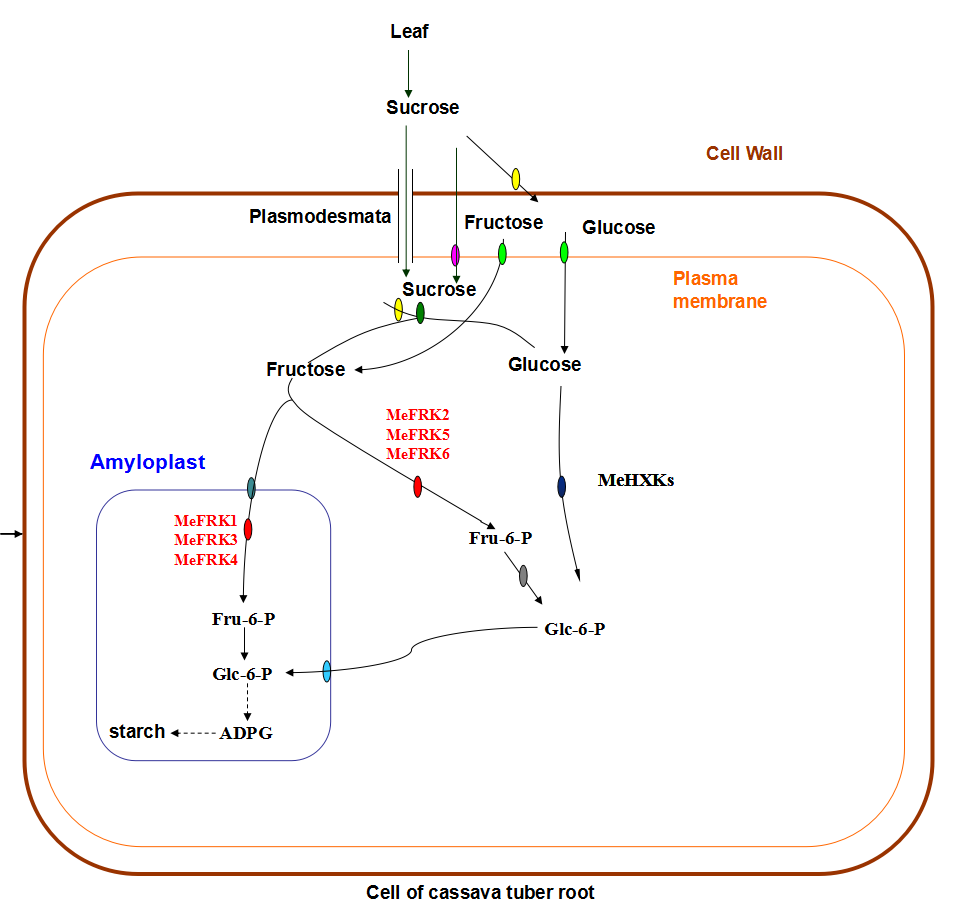
1. Introduction
2. Results
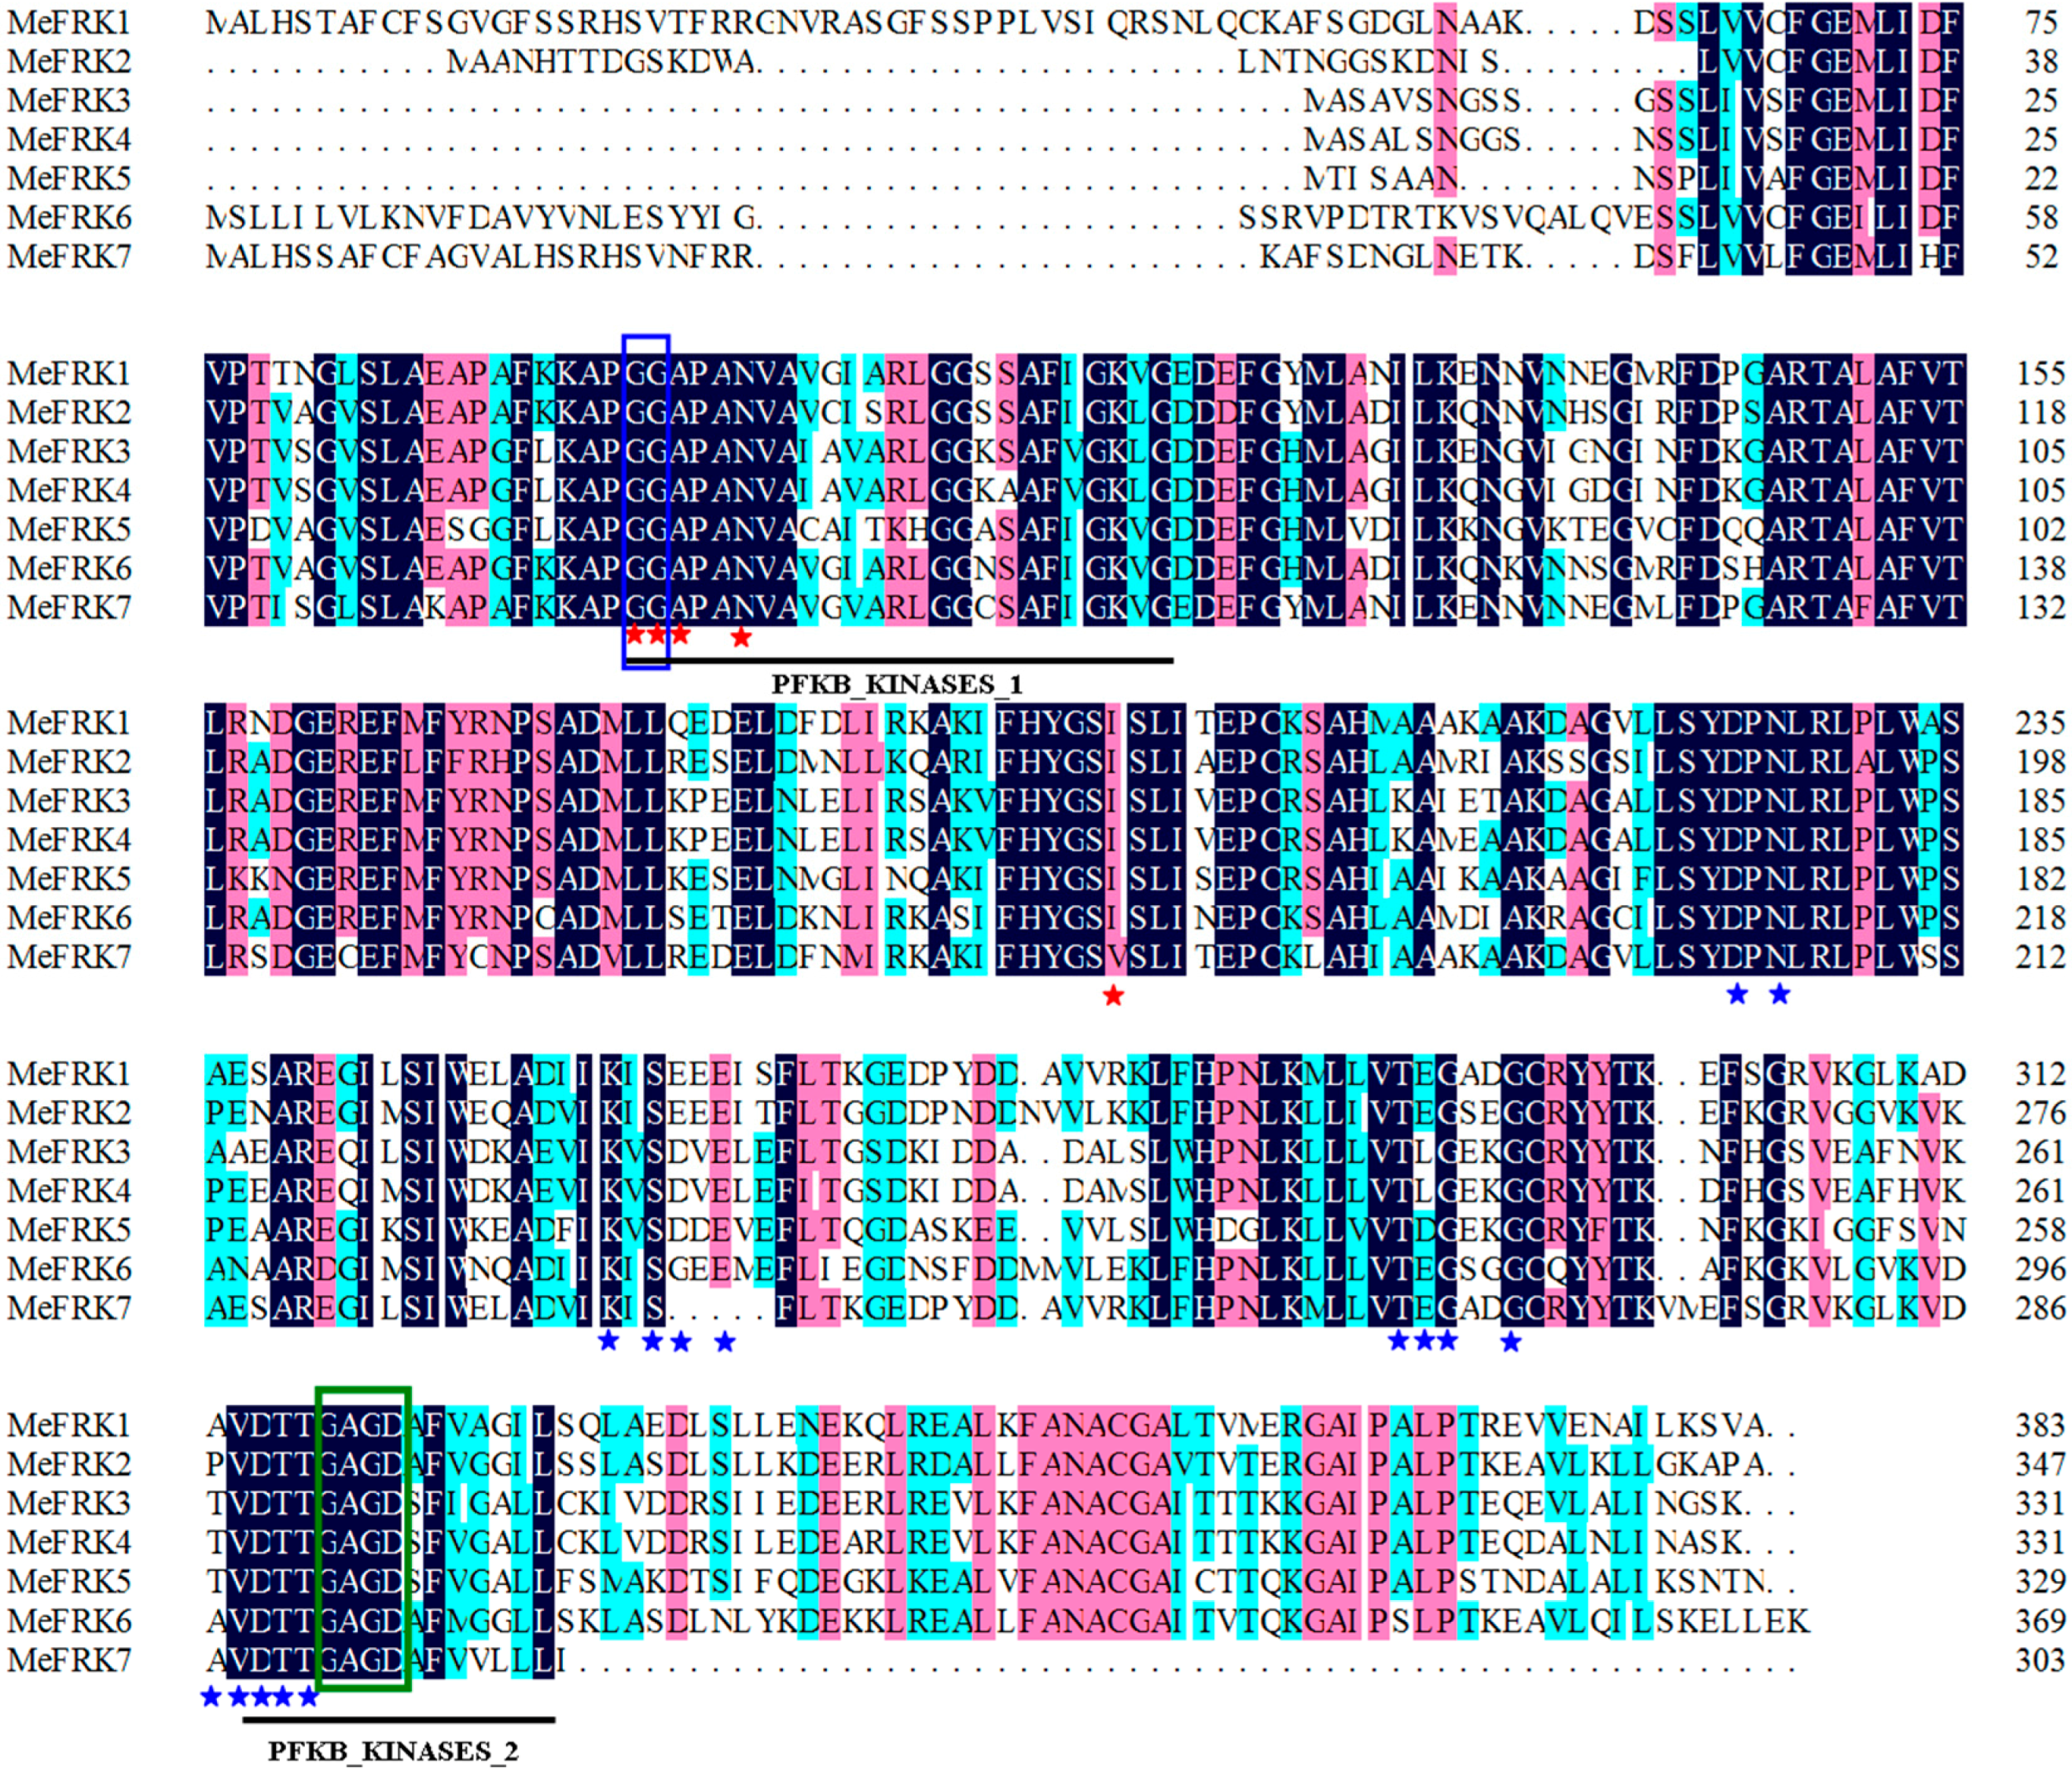
2.1. Cloning and Sequence Analysis of the Fructokinase Gene Family from Cassava
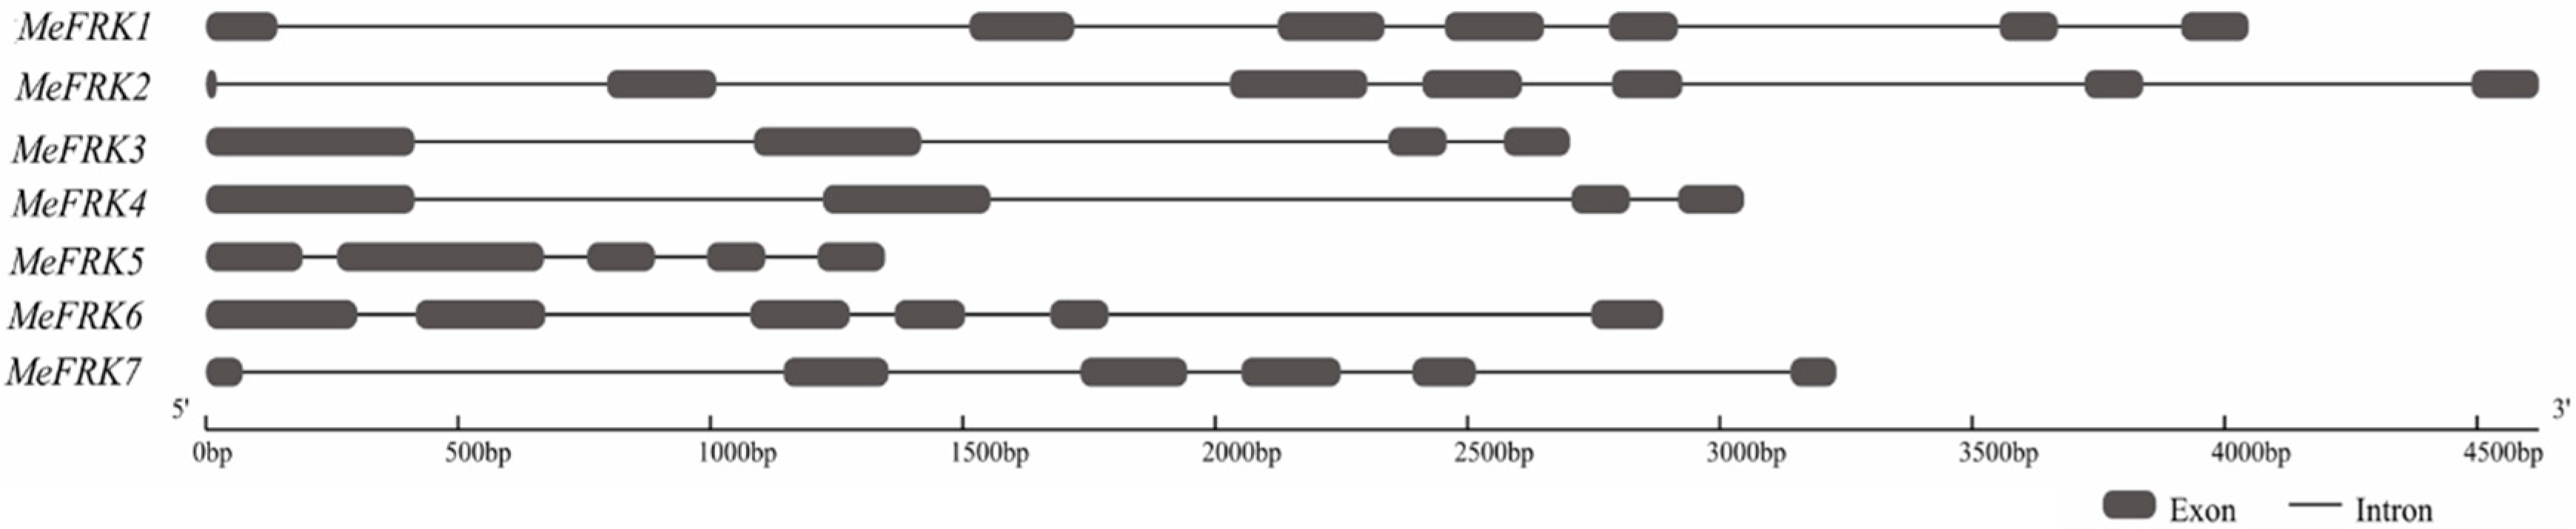
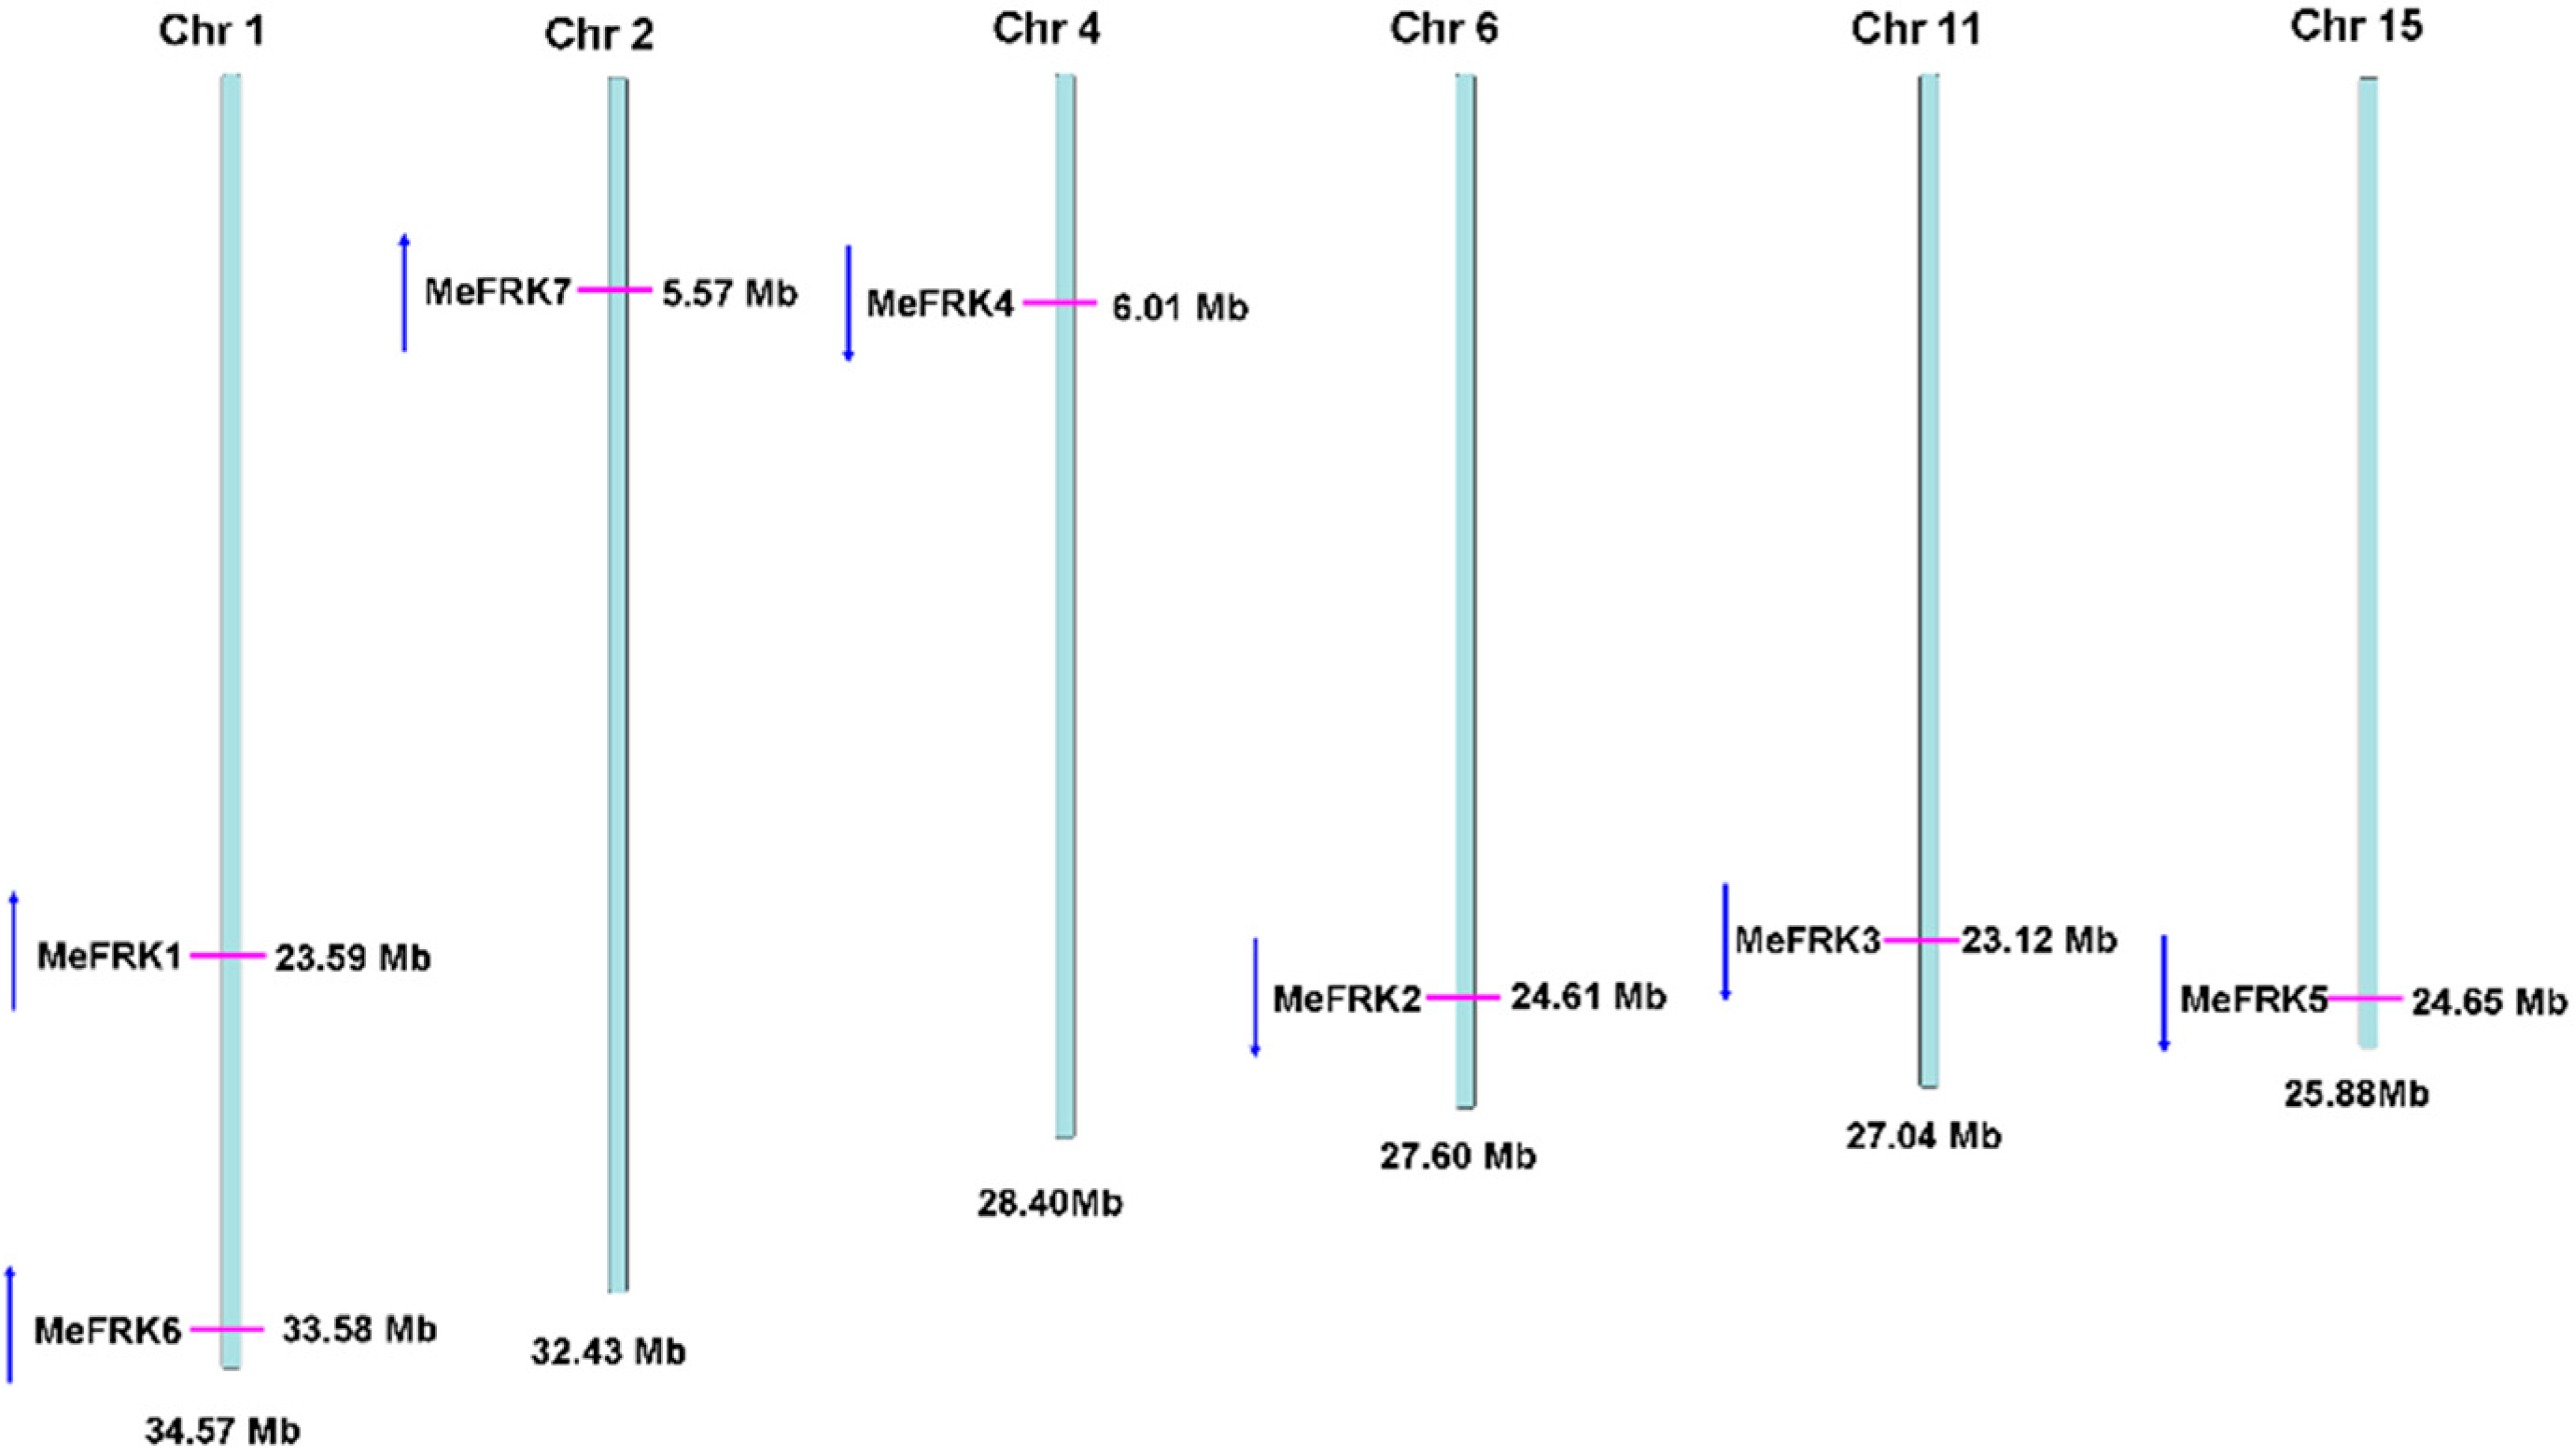
2.2. Structure Analysis and Chromosomal Distribution of the MeFRK Family Genes
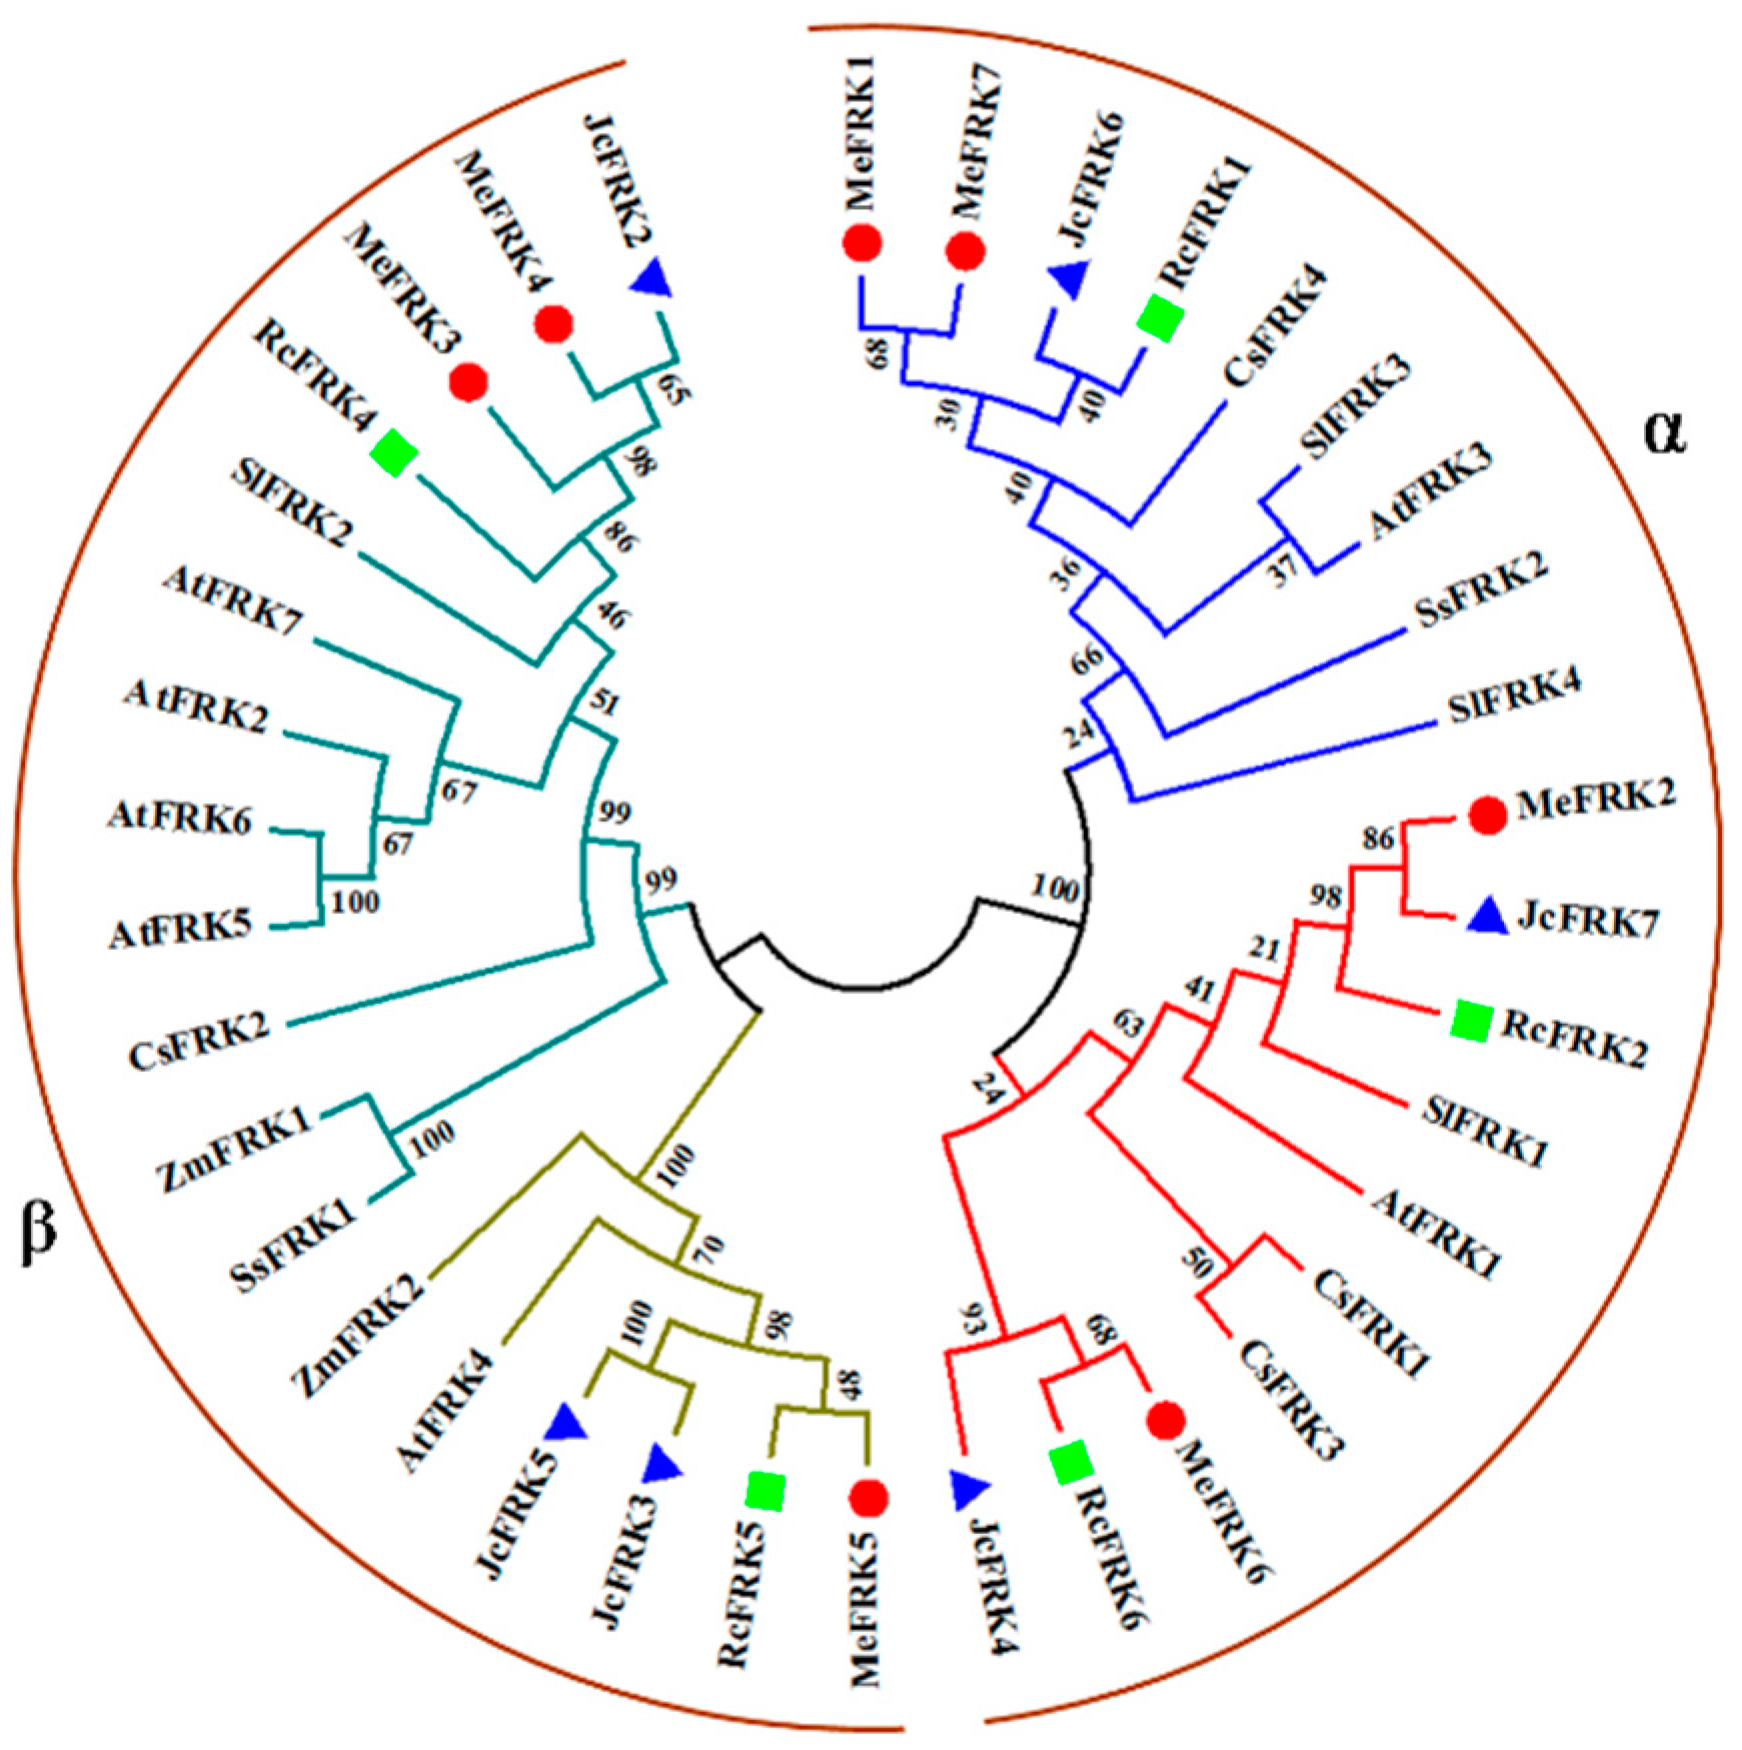
2.3. Phylogenetic Analysis of MeFRK Genes
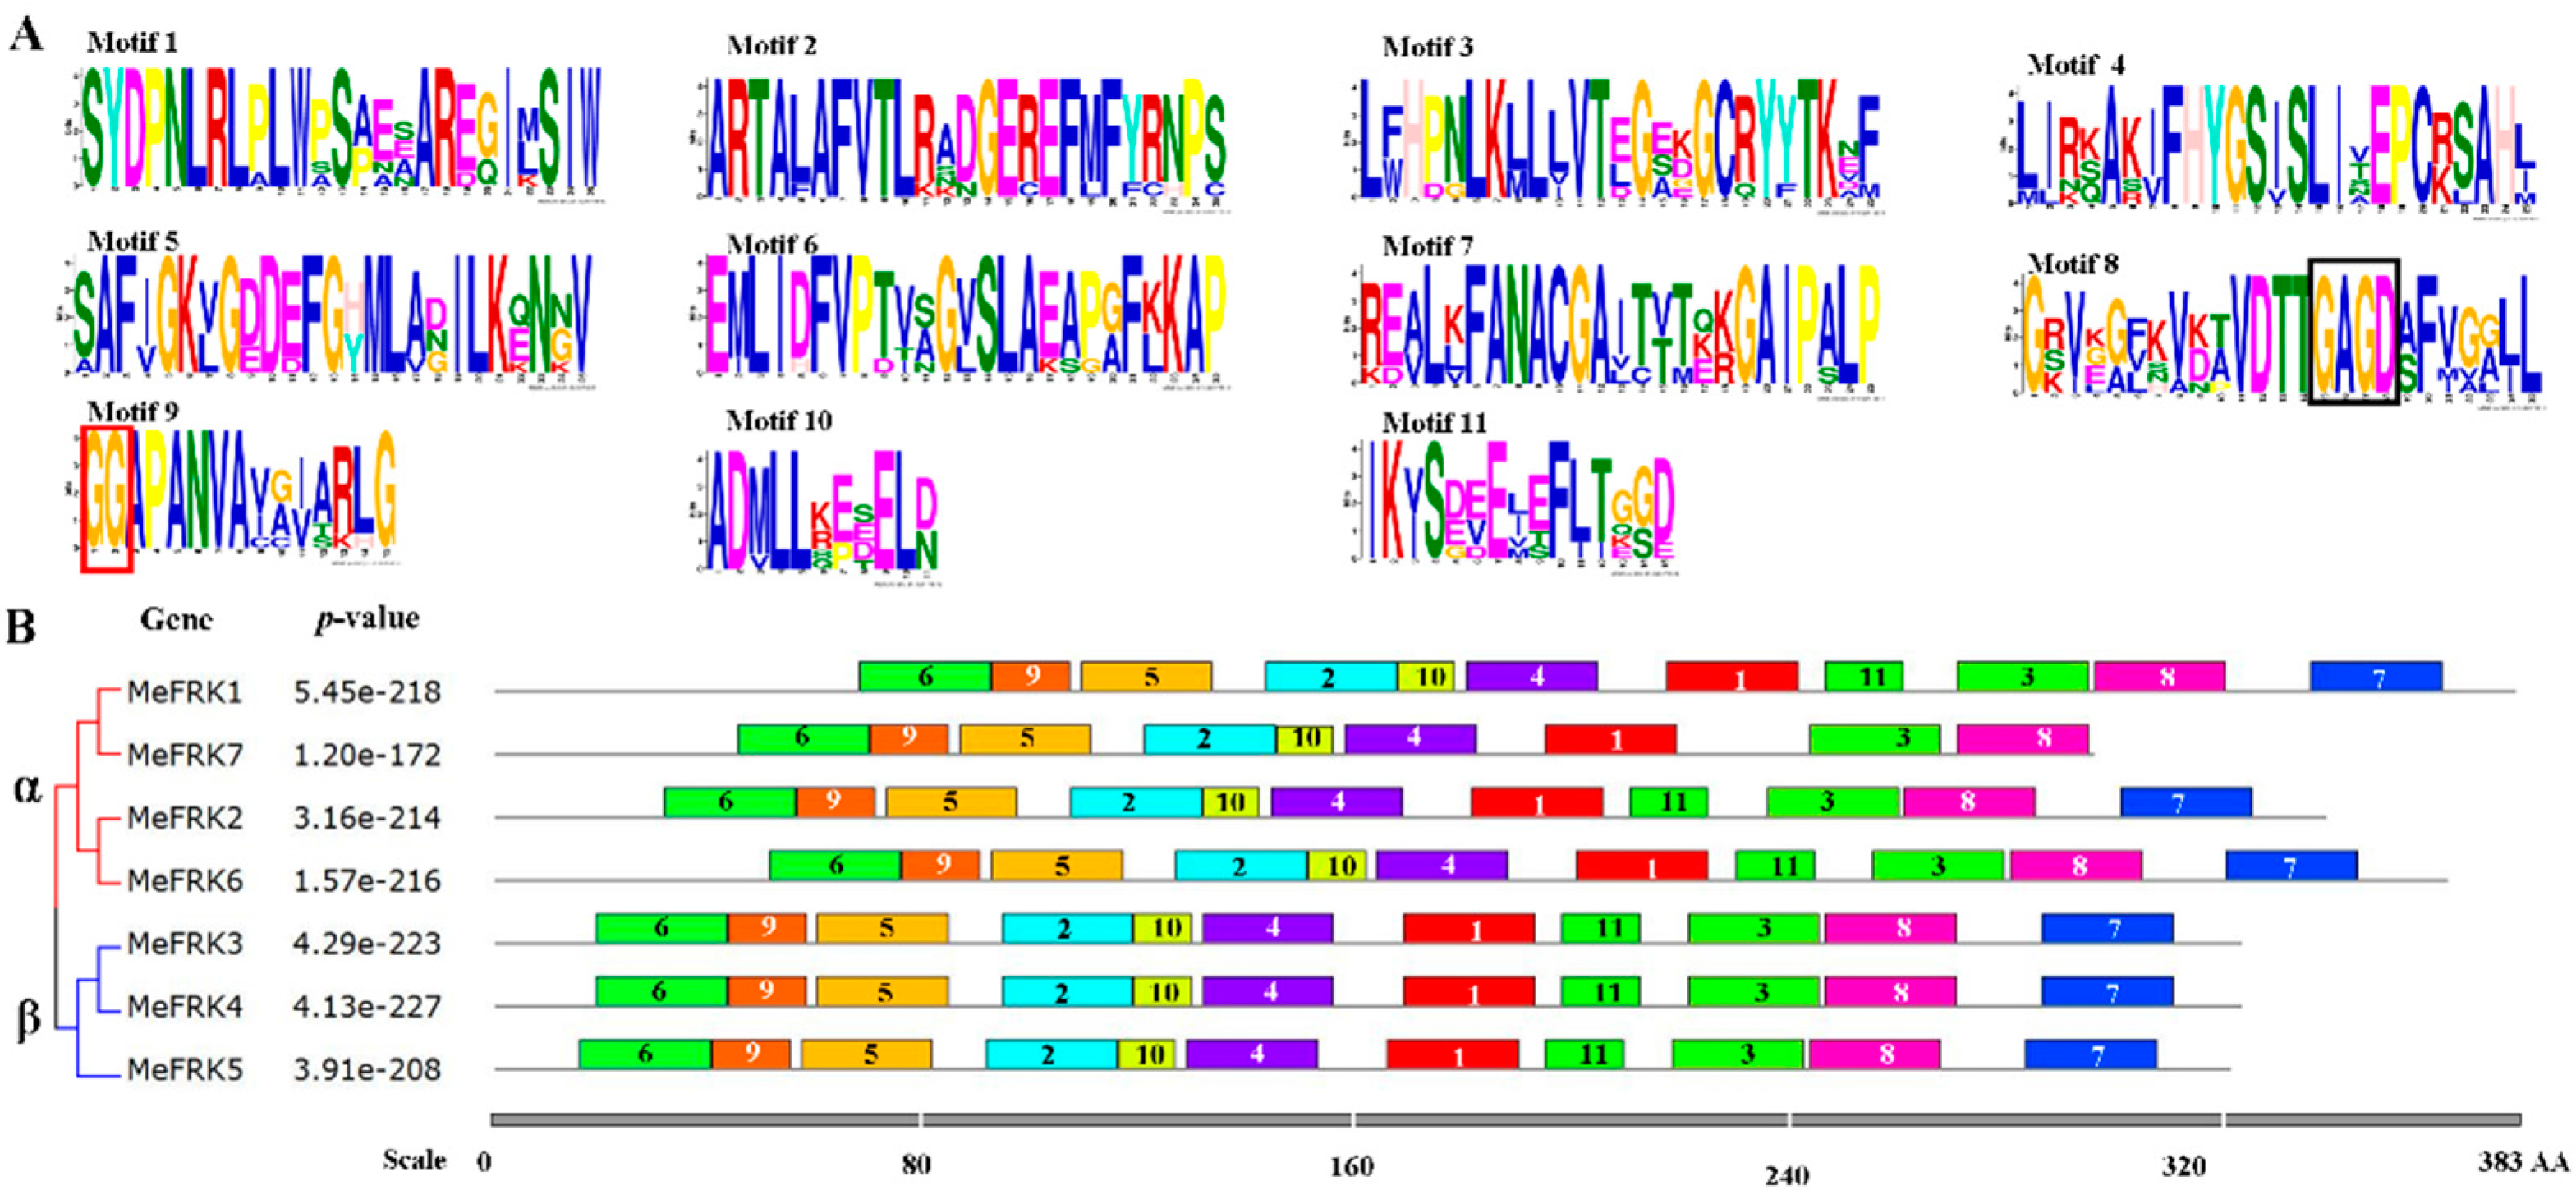
2.4. Motif Distribution in MeFRK Proteins
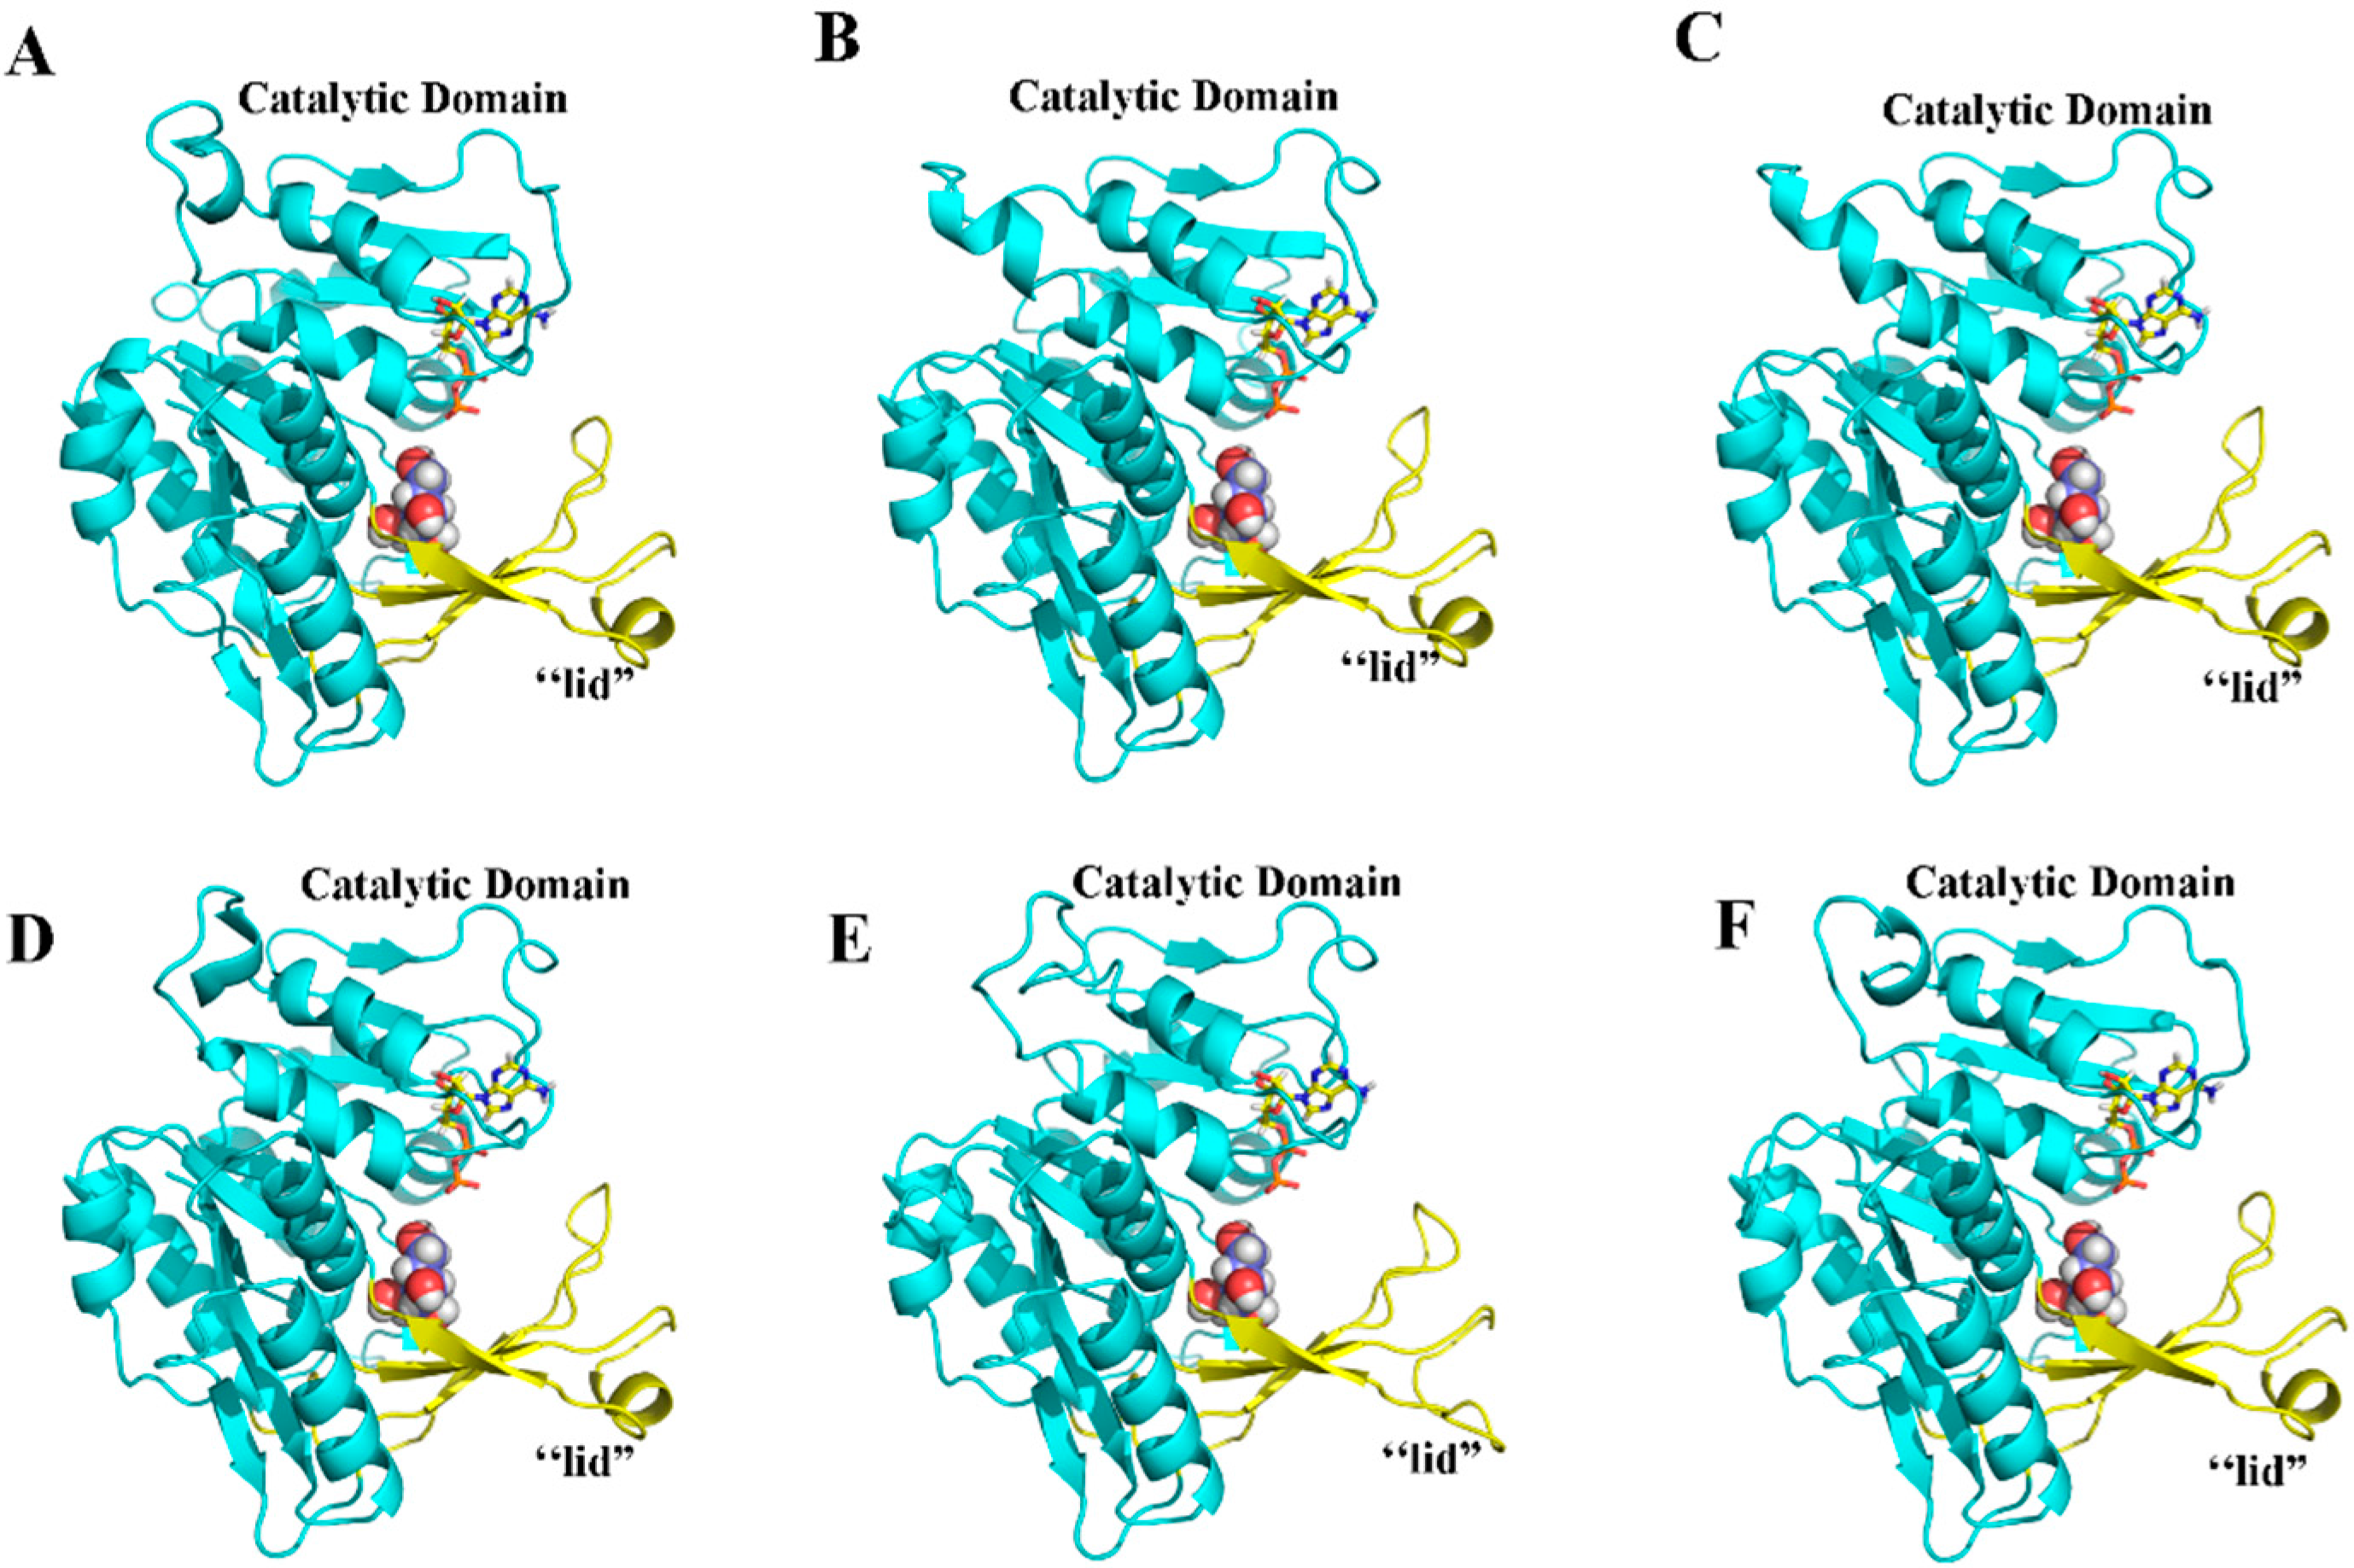
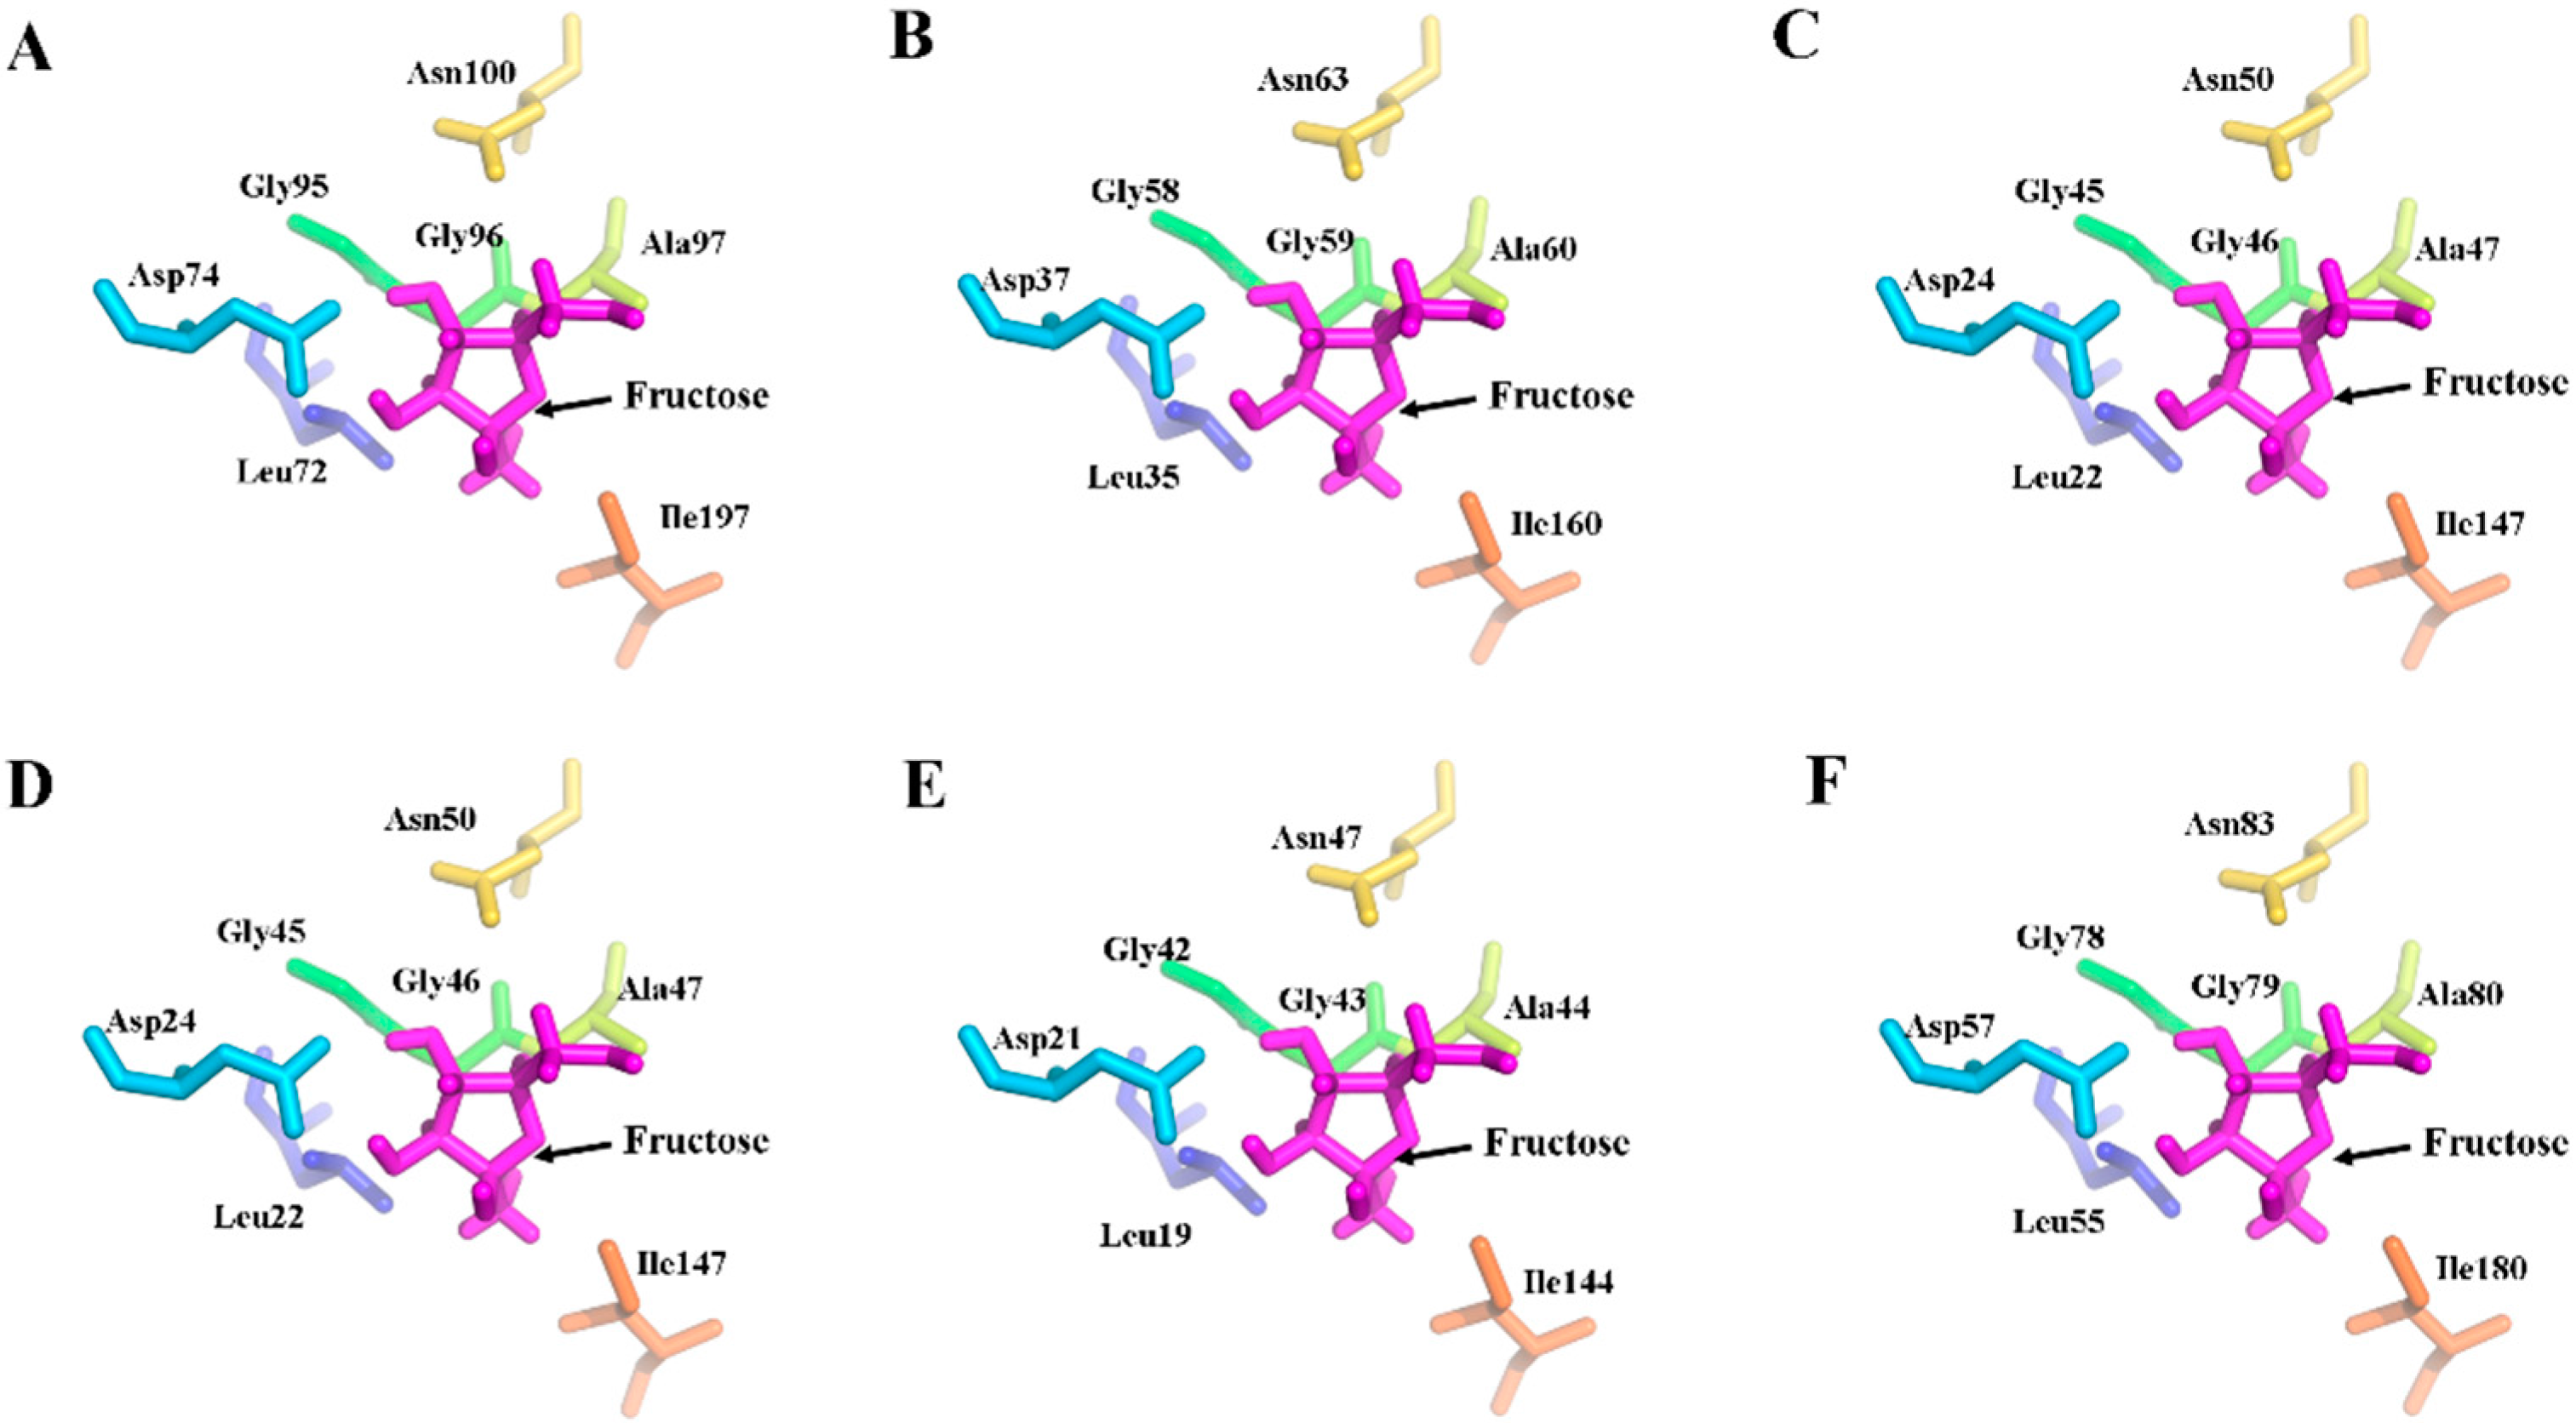
2.5. Three-Dimensional Structure of MeFRK Proteins
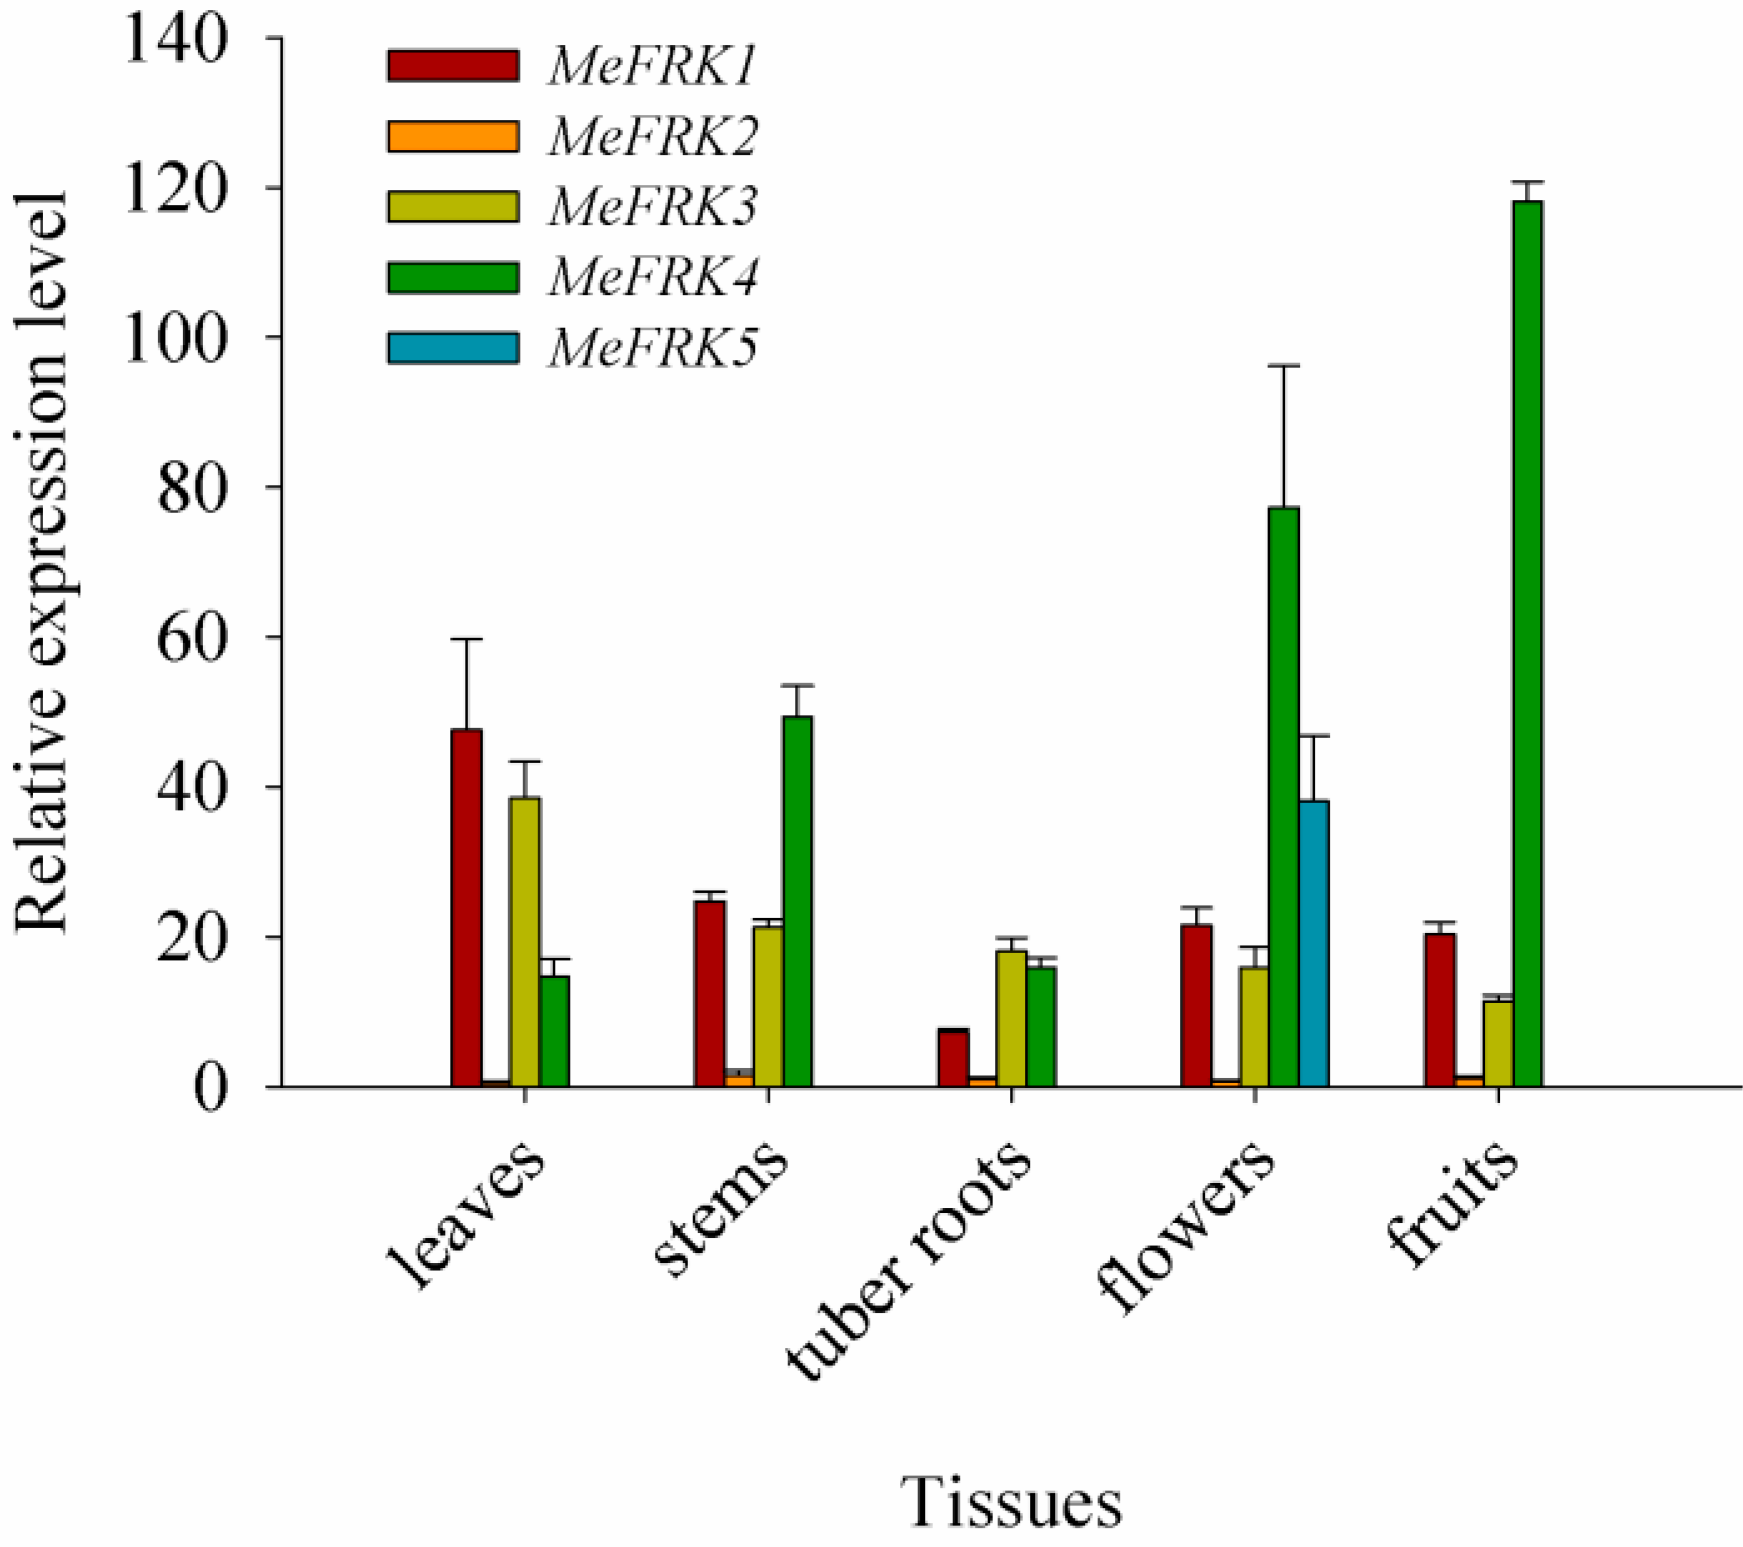
2.6. The Expression Patterns of MeFRK Genes in Different Tissues of Cassava
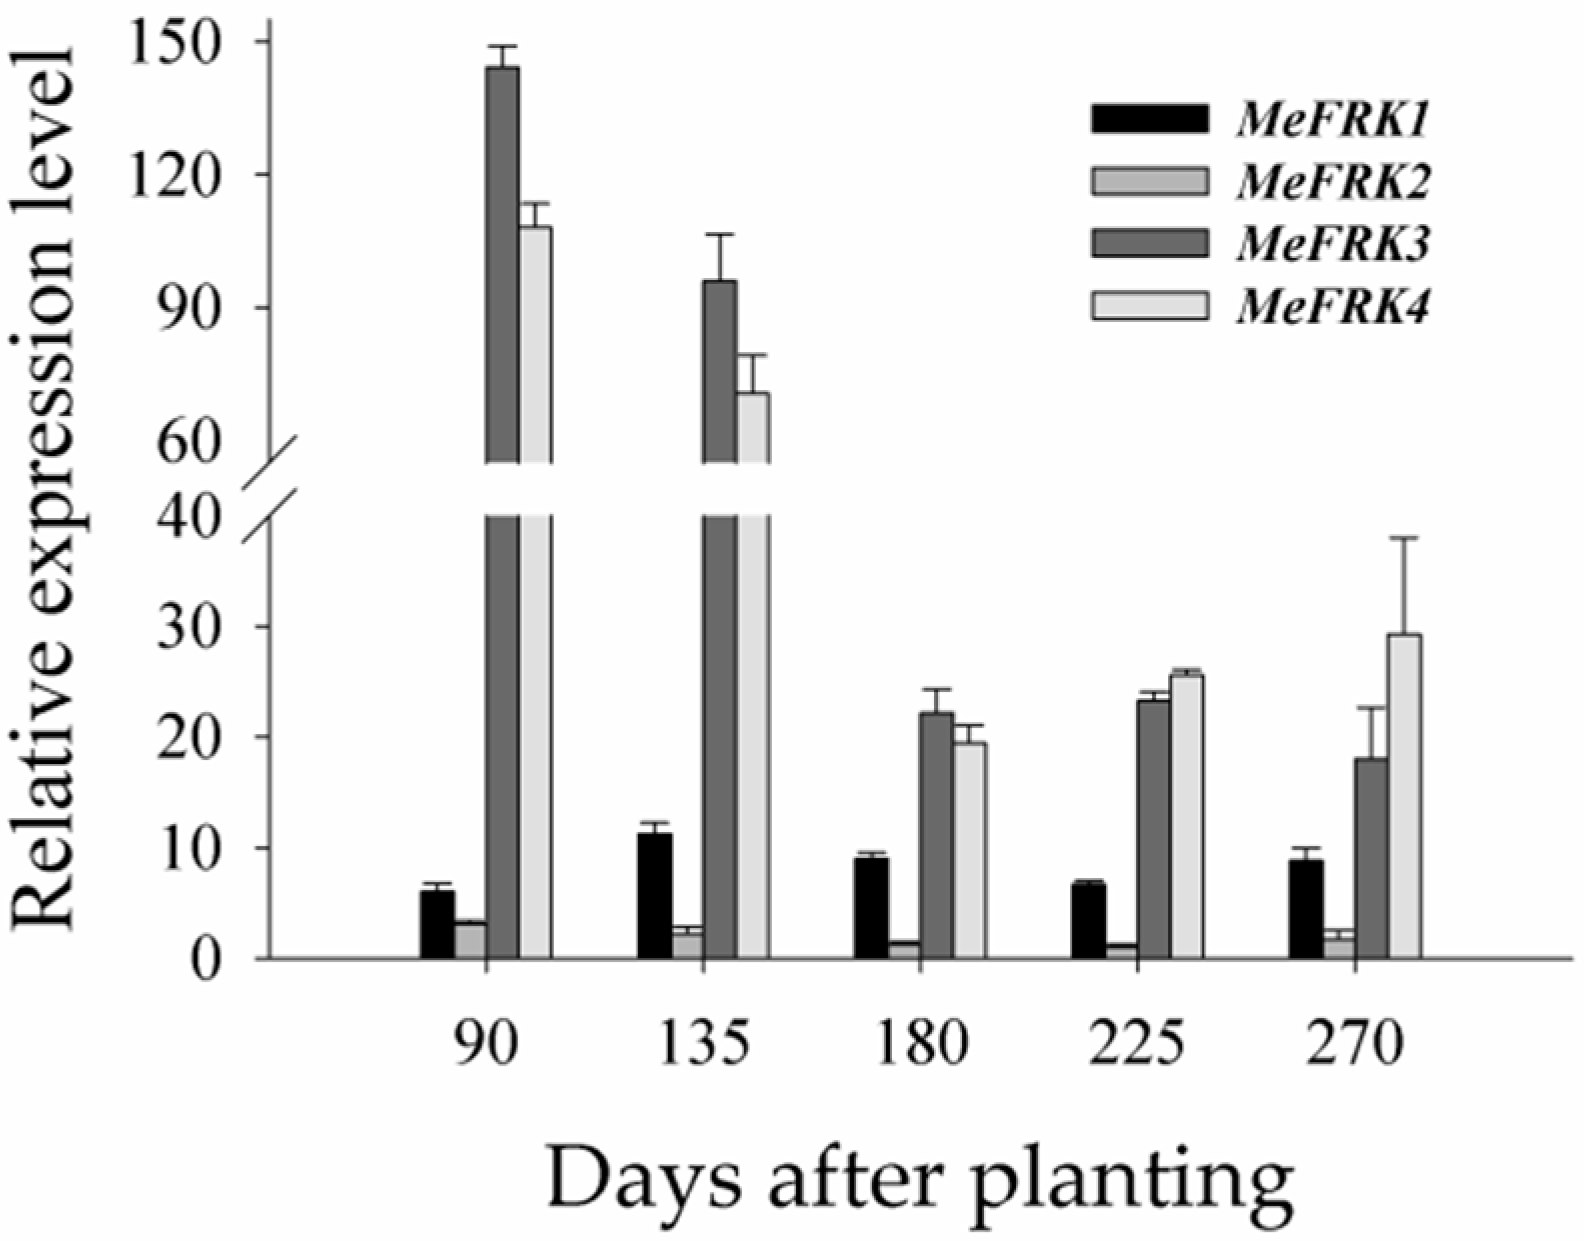
2.7. The Differential Expression of MeFRKs during Cassava Tuber Root Development
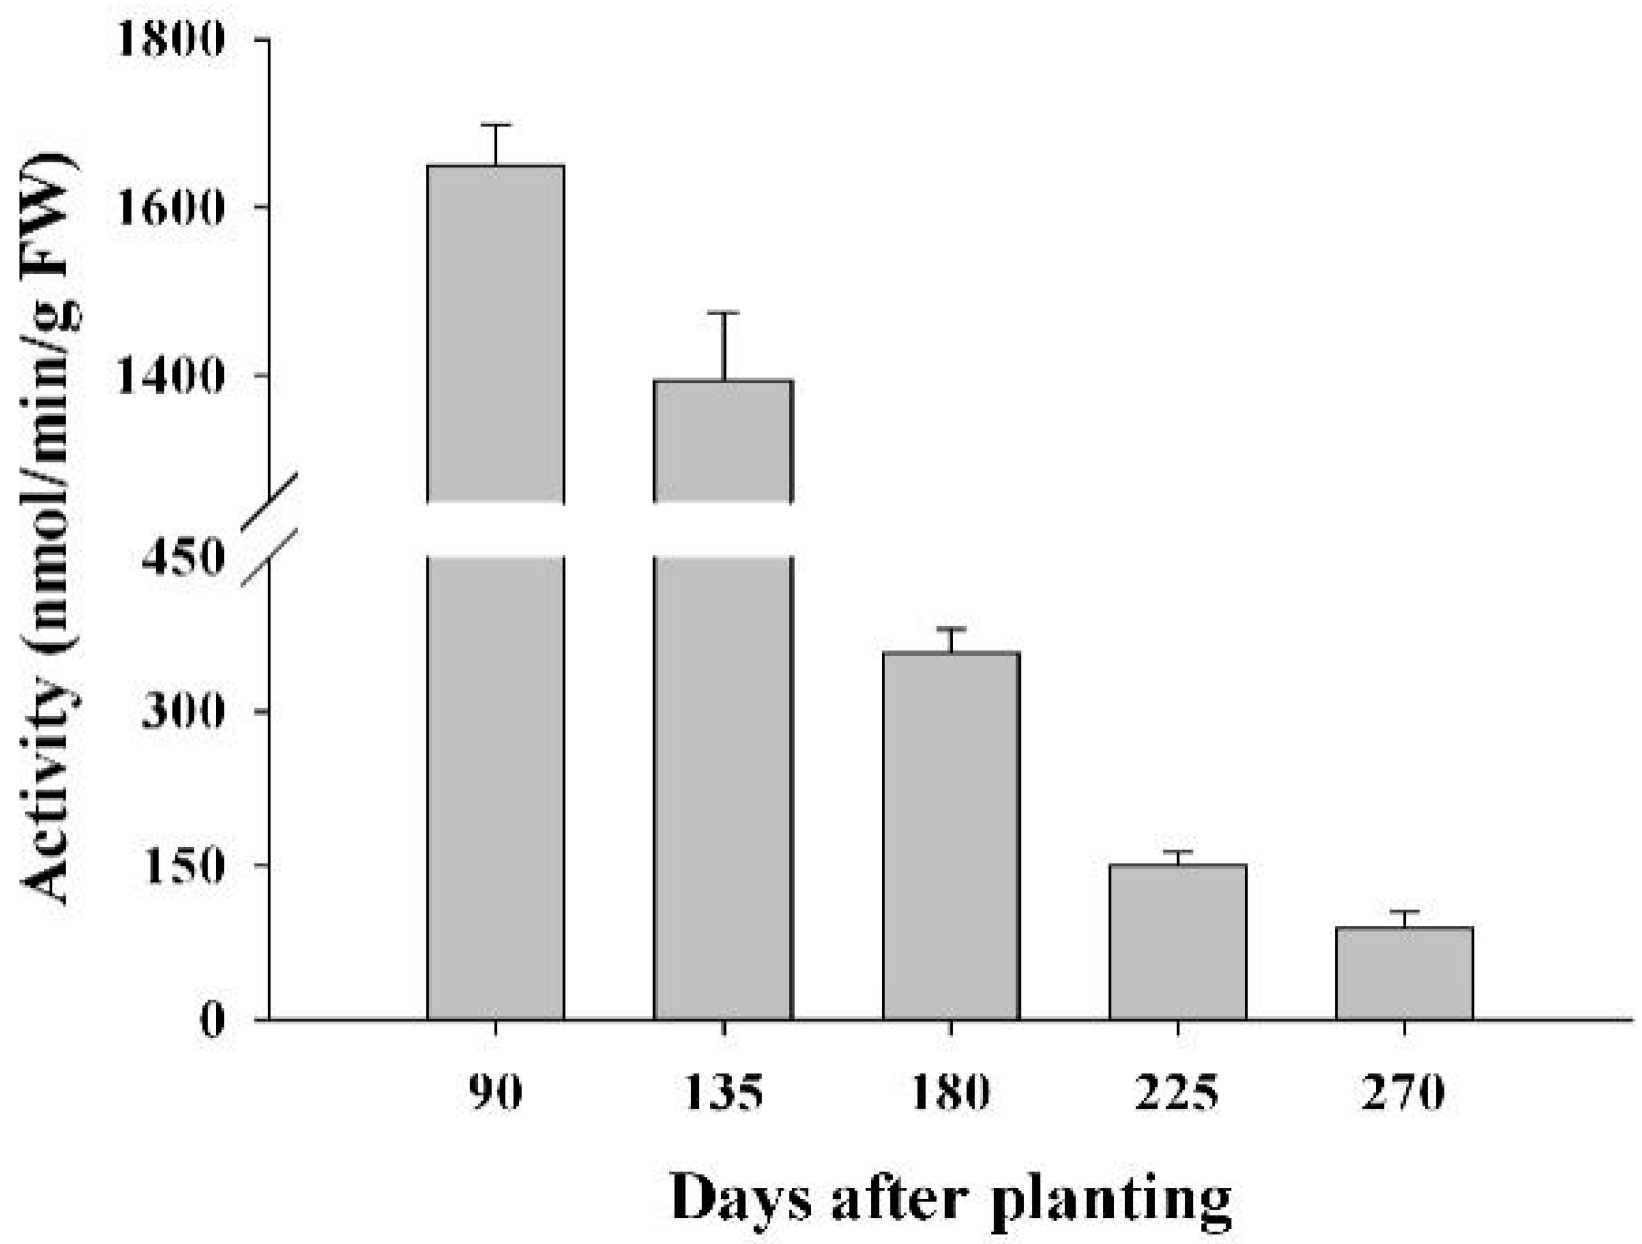
2.8. The Activity of FRKs in Cassava Tubers during Tuber Root Development
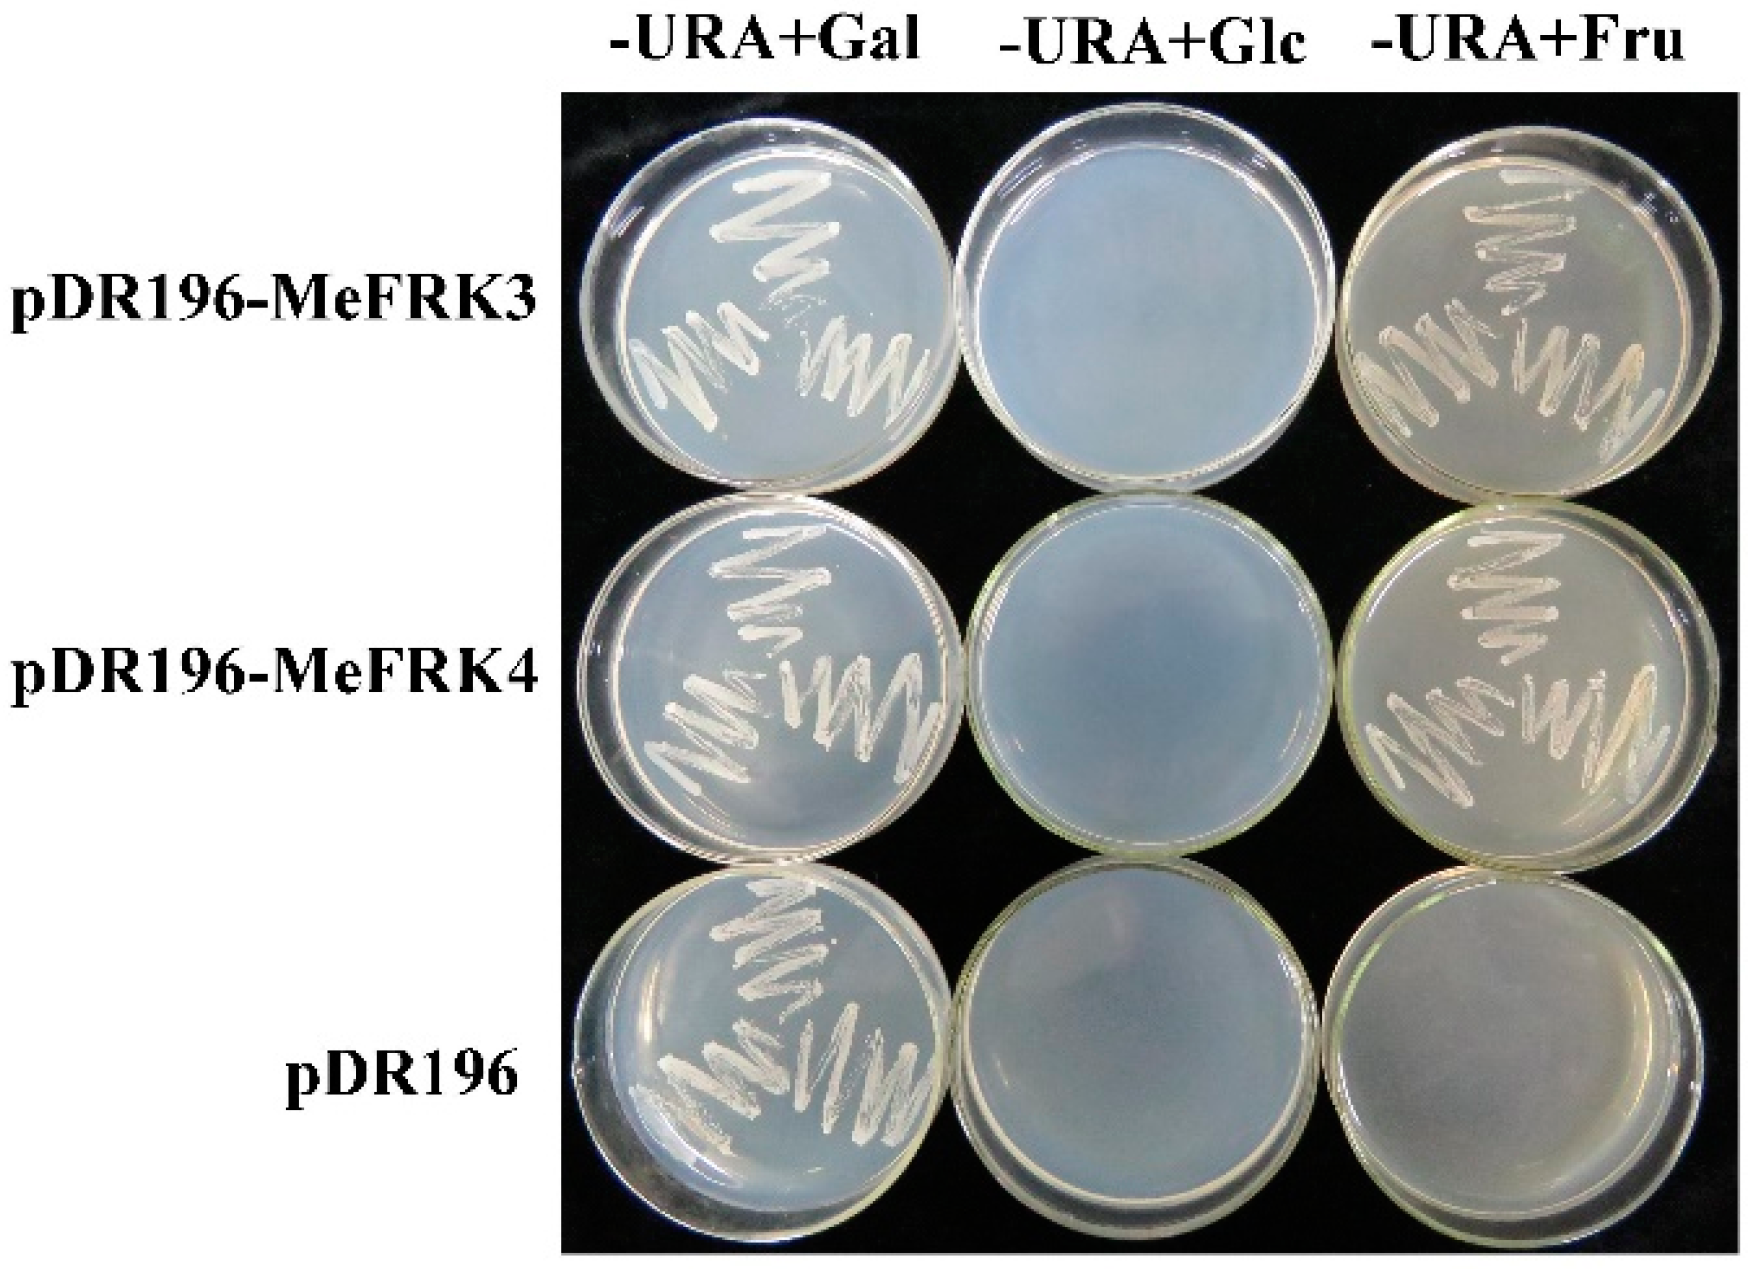
2.9. Yeast Complementation of MeFRK3 and MeFRK4
3. Discussion
3.1. Identification and Characterization of MeFRK Genes
3.2. Differential Expression and Enzymatic Activity of MeFRKs
4. Materials and Methods
4.1. Plant Materials
4.2. RNA Extraction and cDNA Synthesis
4.3. Cloning of MeFRK cDNAs
4.4. Sequence Feature Analyses and Phylogeny Construction
4.5. Exon–Intron Structure Analysis and Chromosomal Mapping
4.6. Prediction of Three-Dimensional Structure of the MeFRK Proteins
4.7. Quantitative Real-Time PCR (qPCR) Analyses
4.8. Activity Analysis of the Fructokinases
4.9. Yeast Complementation Assay for MeFRK3 and MeFRK4
Acknowledgments
Author Contributions
Conflicts of Interest
References
- Ruan, Y.L. Sucrose metabolism: Gateway to diverse carbon use and sugar signaling. Annu. Rev. Plant Biol. 2014, 65, 33–67. [Google Scholar] [CrossRef] [PubMed]
- Chen, L.Q.; Qu, X.Q.; Hou, B.H.; Sosso, D.; Osorio, S.; Fernie, A.R.; Frommer, W.B. Sucrose efflux mediated by sweet proteins as a key step for phloem transport. Science 2012, 335, 207–211. [Google Scholar] [CrossRef] [PubMed]
- Winter, H.; Huber, S.C. Regulation of sucrose metabolism in higher plants: Localization and regulation of activity of key enzymes. Crit. Rev. Biochem. Mol. 2000, 35, 253–289. [Google Scholar] [CrossRef] [PubMed]
- Ni, D.A. Role of vacuolar invertase in regulating arabidopsis stomatal opening. Acta Physiol. Plant 2012, 34, 2449–2452. [Google Scholar] [CrossRef]
- Fotopoulos, V. Plant invertases: Structure, function and regulation of a diverse enzyme family. J. Biol. Res. 2005, 4, 127–137. [Google Scholar]
- Koch, K. Sucrose metabolism: Regulatory mechanisms and pivotal roles in sugar sensing and plant development. Curr. Opin. Plant Biol. 2004, 7, 235–246. [Google Scholar] [CrossRef] [PubMed]
- Halford, N.; Curtis, T.; Muttucumaru, N.; Postles, J.; Mottram, D. Sugars in crop plants. Ann. Appl. Biol. 2011, 158, 1–25. [Google Scholar] [CrossRef]
- Cho, Y.H.; Yoo, S.D. Signaling role of fructose mediated by FINS1/FBP in Arabidopsis thaliana. PLoS Genet. 2011, 7, 1001263. [Google Scholar] [CrossRef] [PubMed]
- Granot, D.; Kelly, G.; Stein, O.; David-Schwartz, R. Substantial roles of hexokinase and fructokinase in the effects of sugars on plant physiology and development. J. Exp. Bot. 2013, 65, 809–819. [Google Scholar] [CrossRef] [PubMed]
- Granot, D.; David-Schwartz, R.; Kelly, G. Hexose kinases and their role in sugar-sensing and plant development. Front. Plant Sci. 2013, 4, 1–17. [Google Scholar] [CrossRef] [PubMed]
- Riggs, J.W.; Cavales, P.C.; Chapiro, S.M.; Callis, J. Identification and biochemical characterization of the fructokinase gene family in Arabidopsis thaliana. BMC Plant Biol. 2017, 17, 83. [Google Scholar] [CrossRef] [PubMed]
- Pego, J.V.; Smeekens, S. Plant fructokinases: A sweet family get-together. Trends Plant Sci. 2000, 5, 531–536. [Google Scholar] [CrossRef]
- Stein, O.; Damari-Weissler, H.; Secchi, F.; Rachamilevitch, S.; German, M.A.; Yeselson, Y.; Amir, R.; Schaffer, A.; Holbrook, N.M.; Aloni, R. The tomato plastidic fructokinase SlFRK3 plays a role in xylem development. New Phytol. 2016, 209, 1484–1495. [Google Scholar] [CrossRef] [PubMed]
- Jiang, H.; Dian, W.; Liu, F.; Ping, W. Isolation and characterization of two fructokinase cDNA clones from rice. Phytochemistry 2003, 62, 47–52. [Google Scholar] [CrossRef]
- Qin, Q.P.; Zhang, J.W.; Xie, M.; Jin, Y.F.; Chen, K.S.; Asghar, S. Isolation and expression analysis of fructokinase genes from citrus. Acta Physiol. Plant 2004, 46, 1408–1414. [Google Scholar]
- Zhang, S.; Nichols, S.E.; Dong, J.G. Cloning and characterization of two fructokinases from maize. Plant Sci. 2003, 165, 1051–1058. [Google Scholar] [CrossRef]
- Roach, M.; Gerber, L.; Sandquist, D.; Gorzsás, A.; Hedenström, M.; Kumar, M.; Steinhauser, M.C.; Feil, R.; Daniel, G.; Stitt, M.; et al. Fructokinase is required for carbon partitioning to cellulose in aspen wood. Plant J. 2012, 70, 967–977. [Google Scholar] [CrossRef] [PubMed]
- Odanaka, S.; Bennett, A.B.; Kanayama, Y. Distinct physiological roles of fructokinase isozymes revealed by gene-specific suppression of Frk1 and Frk2 expression in tomato. Plant Physiol. 2002, 129, 1119–1126. [Google Scholar] [CrossRef] [PubMed]
- David-Schwartz, R.; Weintraub, L.; Vidavski, R.; Zemach, H.; Murakhovsky, L.; Swartzberg, D.; Granot, D. The SlFRK4 promoter is active only during late stages of pollen and anther development. Plant Sci. 2013, 199, 61–70. [Google Scholar] [CrossRef] [PubMed]
- Guglielminetti, L.; Morita, A.; Yamaguchi, J.; Loreti, E.; Perata, P.; Alpi, A. Differential expression of two fructokinases in Oryza sativa seedlings grown under aerobic and anaerobic conditions. J. Plant Res. 2006, 119, 351–356. [Google Scholar] [CrossRef] [PubMed]
- Christian, Z.R.; Sigrid, S.; Mühling, K.H. Proteomic changes in maize roots after short-term adjustment to saline growth conditions. Proteomics 2010, 10, 4441–4449. [Google Scholar]
- Davies, H.V.; Shepherd, L.V.; Burrell, M.M.; Carrari, F.; Urbanczyk-Wochniak, E.; Leisse, A.; Hancock, R.D.; Taylor, M.; Viola, R.; Ross, H. Modulation of fructokinase activity of potato (Solanum tuberosum) results in substantial shifts in tuber metabolism. Plant Cell Physiol. 2005, 46, 1103–1115. [Google Scholar] [CrossRef] [PubMed]
- Comparot-Moss, S.; Denyer, K. The evolution of the starch biosynthetic pathway in cereals and other grasses. J. Exp. Bot. 2009, 60, 2481–2492. [Google Scholar] [CrossRef] [PubMed]
- Yang, M.; Dong, J.; Zhao, W.; Gao, X. Characterization of proteins involved in early stage of wheat grain development by iTRAQ. J. Proteom. 2016, 136, 157–166. [Google Scholar] [CrossRef] [PubMed]
- Agrawal, L.; Chakraborty, S.; Jaiswal, D.K.; Gupta, S.; Datta, A.; Chakraborty, N. Comparative proteomics of tuber induction, development and maturation reveal the complexity of tuberization process in potato (Solanum tuberosum l.). J. Proteome Res. 2008, 7, 3803–3817. [Google Scholar] [CrossRef] [PubMed]
- Santa Brígida, A.B.; dos Reis, S.P.; Costa, C.d.N.M.; Cardoso, C.M.Y.; Lima, A.M.; de Souza, C.R.B. Molecular cloning and characterization of a cassava translationally controlled tumor protein gene potentially related to salt stress response. Mol. Biol. Rep. 2014, 41, 1787–1797. [Google Scholar] [CrossRef] [PubMed]
- Oyelakin, O.O.; Opabode, J.T.; Raji, A.A.; Ingelbrecht, I.L. A cassava vein mosaic virus promoter cassette induces high and stable gene expression in clonally propagated transgenic cassava (Manihot esculenta crantz). S. Afr. J. Bot. 2015, 97, 184–190. [Google Scholar] [CrossRef]
- Ihemere, U.; Arias-Garzon, D.; Lawrence, S.; Sayre, R. Genetic modification of cassava for enhanced starch production. Plant Biotechnol. J. 2006, 4, 453–465. [Google Scholar] [CrossRef] [PubMed]
- Wang, X.; Chang, L.; Tong, Z.; Wang, D.; Yin, Q.; Wang, D.; Jin, X.; Yang, Q.; Wang, L.; Sun, Y. Proteomics profiling reveals carbohydrate metabolic enzymes and 14-3-3 proteins play important roles for starch accumulation during cassava root tuberization. Sci. Rep. 2016, 6, 19643. [Google Scholar] [CrossRef] [PubMed]
- Sheffield, J.; Taylor, N.C.; Chen, S. The cassava (Manihot esculenta crantz) root proteome: Protein identification and differential expression. Proteomics 2006, 6, 1588–1598. [Google Scholar] [CrossRef] [PubMed]
- Granot, D. Role of tomato hexose kinases. Funct. Plant Biol. 2007, 34, 564–570. [Google Scholar] [CrossRef]
- Chua, T.K.; Seetharaman, J.; Kasprzak, J.M.; Ng, C.; Patel, B.K.; Love, C.; Bujnicki, J.M.; Sivaraman, J. Crystal structure of a fructokinase homolog from Halothermothrix orenii. J. Struct. Biol. 2010, 171, 397–401. [Google Scholar] [CrossRef] [PubMed]
- German, M.A.; Dai, N.; Chmelnitsky, I.; Sobolev, I.; Salts, Y.; Barg, R.; Schaffer, A.A.; Granot, D. LeFRK4, a novel tomato (Lycopersicon esculentum mill.) fructokinase specifically expressed in stamens. Plant Sci. 2002, 163, 607–613. [Google Scholar]
- Li, N.N.; Qian, W.J.; Wang, L.; Cao, H.L.; Hao, X.Y.; Yang, Y.J.; Wang, X.C. Isolation and expression features of hexose kinase genes under various abiotic stresses in the tea plant (Camellia sinensis). J. Plant Physiol. 2017, 209, 95–104. [Google Scholar] [CrossRef] [PubMed]
- Chen, Y.; Zhang, Q.; Hu, W.; Zhang, X.; Wang, L.; Hua, X.; Yu, Q.; Ming, R.; Zhang, J. Evolution and expression of the fructokinase gene family in saccharum. BMC Genom. 2017, 18, 197. [Google Scholar] [CrossRef] [PubMed]
- Zou, M.; Cheng, L.; Zhang, S.; Chen, Q.; Sun, X.; Ma, P.; Hu, M.; Peng, M.; Ma, Z.; Chen, X. Epigenetic map and genetic map basis of complex traits in cassava population. Sci. Rep. 2017, 7, 41232. [Google Scholar] [CrossRef] [PubMed]
- Ross, H.A.; Davies, H.V.; Burch, L.R.; Viola, R.; Mcrae, D. Developmental changes in carbohydrate content and sucrose degrading enzymes in tuberising stolons of potato (Solanum tuberosum). Physiol. Plant 1994, 90, 748–756. [Google Scholar] [CrossRef]
- Gasteiger, E.; Gattiker, A.; Hoogland, C.; Ivanyi, I.; Appel, R.D.; Bairoch, A. Expasy: The proteomics server for in-depth protein knowledge and analysis. Nucleic Acids Res. 2003, 31, 3784–3788. [Google Scholar] [CrossRef] [PubMed]
- Kumar, S.; Stecher, G.; Tamura, K. Mega7: Molecular evolutionary genetics analysis version 7.0 for bigger datasets. Mol. Bio. Evol. 2016, 33, 1870–1874. [Google Scholar] [CrossRef] [PubMed]
- Bailey, T.L.; Boden, M.; Buske, F.A.; Frith, M.; Grant, C.E.; Clementi, L.; Ren, J.; Li, W.W.; Noble, W.S. Meme suite: Tools for motif discovery and searching. Nucleic Acids Res. 2009, 37, 202–208. [Google Scholar] [CrossRef] [PubMed]
- Guo, A.Y.; Zhu, Q.H.; Chen, X.; Luo, J.C. gsds: A gene structure display server. Hereditas 2007, 29, 1023–1026. [Google Scholar] [CrossRef] [PubMed]
- Yao, Y.; Geng, M.T.; Wu, X.H.; Liu, J.; Li, R.M.; Hu, X.W.; Guo, J.C. Genome-wide identification, expression, and activity analysis of alkaline/neutral invertase gene family from cassava (Manihot esculenta crantz). Plant Mol. Biol. Rep. 2015, 33, 304–315. [Google Scholar] [CrossRef]
- Livak, K.J.; Schmittgen, T.D. Analysis of relative gene expression data using real-time quantitative PCR and the 2−ΔΔCt method. Methods 2001, 25, 402–408. [Google Scholar] [CrossRef] [PubMed]
- Winde, J.H.; Crauwels, M.; Hohmann, S.; Thevelein, J.M.; Winderickx, J. Differential requirement of the yeast sugar kinases for sugar sensing in establishing the catabolite-repressed state. Eur. J. Biochem. 1996, 241, 633–643. [Google Scholar] [CrossRef] [PubMed]


| Gene | Gene ID | Accession Numbers | Subcellular Localization | Size | pI | % Similarity (a.a.) to | ||||||
|---|---|---|---|---|---|---|---|---|---|---|---|---|
| a.a | kDa | MeFRK2 | MeFRK3 | MeFRK4 | MeFRK5 | MeFRK6 | MeFRK7 | |||||
| MeFRK1 | Manes.01G116600 | AJK93565 | Plastid | 383 | 41.2 | 5.32 | 63.38 | 56.66 | 56.66 | 52.74 | 63.05 | 68.57 |
| MeFRK2 | Manes.06G141400 | AJK93566 | Cytoplasm | 347 | 37.2 | 5.70 | — | 62.53 | 63.40 | 59.37 | 67.57 | 52.34 |
| MeFRK3 | Manes.11G121800 | AJK93567 | Plastid | 331 | 35.3 | 4.99 | — | 93.05 | 66.57 | 58.38 | 50.14 | |
| MeFRK4 | Manes.04G043700 | AJK93568 | Plastid | 331 | 35.4 | 4.99 | — | 66.87 | 57.84 | 50.14 | ||
| MeFRK5 | Manes.15G189700 | KR338981 | Cytoplasm | 329 | 35.0 | 5.73 | — | 56.76 | 46.69 | |||
| MeFRK6 | Manes.01G263700 | AJK93569 | Cytoplasm | 370 | 40.1 | 6.07 | — | 52.96 | ||||
| MeFRK7 * | Manes.02G075300 | — | Plastid | 303 | 32.9 | 6.62 | — | |||||
| Gene | Forward Primer (5′ to 3′) | Reverse Primer (5′ to 3′) |
|---|---|---|
| MeFRK1 | TACCCATTAATTCTAACGCCAC | CATAAAACTAGGATTGCAGACATCT |
| MeFRK2 | CTCTCTCATCTCTGATTCGTGCT | GGTTGTGAACTAAGAAGGATTGAA |
| MeFRK3 | CTTCTTCTCTCATTCTCCTCTACAAA | TGCTACCCAAACAAAAAGAGAATAT |
| MeFRK4 | GACTTCATTGTCTCTTCTTCTCTTCC | AATTTGTCTATTTTGAGGCGTTG |
| MeFRK5 | AAAAAATGACAATCTCAGCAGC | AATTAGTTGGTGTTGGACTTGAT |
| MeFRK6 | TTCTCATCTGATGTTGCCTGAC | CATTGTGAAATCTATCCTGCTCA |
| MeFRK7 | TTCAACTGCATGGCTCTTCACTCTA | GAACAAGGAAATGGGAATACTGAAC |
| Gene | Forward Primer (5′ to 3′) | Reverse Primer (5′ to 3′) |
|---|---|---|
| MeFRK1 | TTGCCTCCTCTTGTTTCCATTC | TTGCTGCATTTAACCCATCACC |
| MeFRK2 | CAGGGTTGGTGGTGTGAAAGTG | ACCGCTCCTCATCCTTCAATAG |
| MeFRK3 | CTTCTTCTCTCATTCTCCTCTACAA | TTCAAGAAACCAGGTGCCTC |
| MeFRK4 | CCGAATCCTATTATCACGCG | GGAGACAGTGGGGACGAAGT |
| MeFRK5 | CTCAGCAGCAAACAATAGCCCAT | TAGCACAGGCAACATTGGCAGGT |
| MeFRK6 | GAATGTTTTCGATGCTGTTTATGTT | GCCAGGTGCTTCTGCAAGTG |
© 2017 by the authors. Licensee MDPI, Basel, Switzerland. This article is an open access article distributed under the terms and conditions of the Creative Commons Attribution (CC BY) license (http://creativecommons.org/licenses/by/4.0/).
Share and Cite
Yao, Y.; Geng, M.-T.; Wu, X.-H.; Sun, C.; Wang, Y.-L.; Chen, X.; Shang, L.; Lu, X.-H.; Li, Z.; Li, R.-M.; et al. Identification, Expression, and Functional Analysis of the Fructokinase Gene Family in Cassava. Int. J. Mol. Sci. 2017, 18, 2398. https://doi.org/10.3390/ijms18112398
Yao Y, Geng M-T, Wu X-H, Sun C, Wang Y-L, Chen X, Shang L, Lu X-H, Li Z, Li R-M, et al. Identification, Expression, and Functional Analysis of the Fructokinase Gene Family in Cassava. International Journal of Molecular Sciences. 2017; 18(11):2398. https://doi.org/10.3390/ijms18112398
Chicago/Turabian StyleYao, Yuan, Meng-Ting Geng, Xiao-Hui Wu, Chong Sun, Yun-Lin Wang, Xia Chen, Lu Shang, Xiao-Hua Lu, Zhan Li, Rui-Mei Li, and et al. 2017. "Identification, Expression, and Functional Analysis of the Fructokinase Gene Family in Cassava" International Journal of Molecular Sciences 18, no. 11: 2398. https://doi.org/10.3390/ijms18112398
APA StyleYao, Y., Geng, M.-T., Wu, X.-H., Sun, C., Wang, Y.-L., Chen, X., Shang, L., Lu, X.-H., Li, Z., Li, R.-M., Fu, S.-P., Duan, R.-J., Liu, J., Hu, X.-W., & Guo, J.-C. (2017). Identification, Expression, and Functional Analysis of the Fructokinase Gene Family in Cassava. International Journal of Molecular Sciences, 18(11), 2398. https://doi.org/10.3390/ijms18112398