1. Introduction
Integrin inside-out activation is mainly regulated by the intracellular protein talin. Integrin is fully activated when outside-in signaling is activated in response to the extracellular matrix (ECM) such as fibronectin, laminin, and collagen [
1]. These stimulate numerous biological processes such as cell adhesion, survival, proliferation, and metastasis [
2]. Overexpression of talin1 increased cell adhesion, migration, and invasion of human prostate cancer cells. Loss of talin1 resulted in a significant inhibition of prostate cancer cell migration and invasion in vitro, and reduced metastatic tumor lesions in vivo [
3]. In contrast, mice lacking the entire talin2 coding sequence were viable and fertile only with a mild dystrophic phenotype [
4].
Talin is a critical focal adhesion (FA) regulator that links integrin and the actin cytoskeleton and induces FA formation. Talin contains the binding sites for integrin β3 [
5], actin, vinculin, and focal adhesion kinase (FAK), as well as specifically multiple vinculin-binding sites that are pivotal for FA localization of vinculin [
6]. In response to integrin-talin interaction, FAK is activated via autophosphorylation on the tyrosine 397 residues [
7]. Consequently, it leads to activation of its kinase function and downstream signaling pathways such as phosphoinositide 3-kinase (PI3K)/protein kinase B (AKT) and mitogen-activating protein kinase (MAPK)/extracellular signal-regulated kinase (ERK) pathways and paxillin resulting in cytoskeletal and morphological changes [
7,
8]. Overexpression of talin1 in prostate cancer cells resulted in activation of AKT and MAPK under collagen and fibronectin attachment conditions [
3].
Several recent studies have indicated that talin1 may have potential as a novel prognostic marker and therapeutic target. High expression of talin1 was significantly associated with poor distant metastasis-free survival and low five-year overall survival in patients with nasopharyngeal carcinoma, especially in advanced stages [
9]. The clinical research of hepatocellular carcinoma revealed that talin1 was significantly upregulated according to tumor progression [
10]. In addition, talin1-lacking platelets failed to activate integrin and platelet aggregation, resulting in a severe hemostatic defect and resistance to thrombosis [
11].
Angiogenesis is a complex process regulated by numerous receptors, growth factors, ECM-cell and cell-cell interactions. Endothelial cells need to migrate, invade the ECM, and form capillary structures during angiogenesis. Therefore, the integrin-mediated interaction with ECM is critical in the regulation of angiogenesis [
12]. In particular, αVβ3 integrin has been reported as an important regulator of angiogenesis [
13,
14] and endothelial functions such as spreading and migration in human umbilical vein endothelial cells (HUVECs) [
15]. Reduction of talin inhibited the conformational rearrangement of integrin, suggesting that talin is required for activation of αVβ3 integrin [
16]. Disruption of talin in endothelial cells impaired organization into vessels, leading to embryonic death at gastrulation [
17]. Moreover, knockdown of talin using small interference RNA (siRNA) altered HUVECs into arborized or elongated shapes that showed a significantly shorter trajectory and reduced velocity, suggesting that talin is required to maintain the normal morphology and migration [
18].
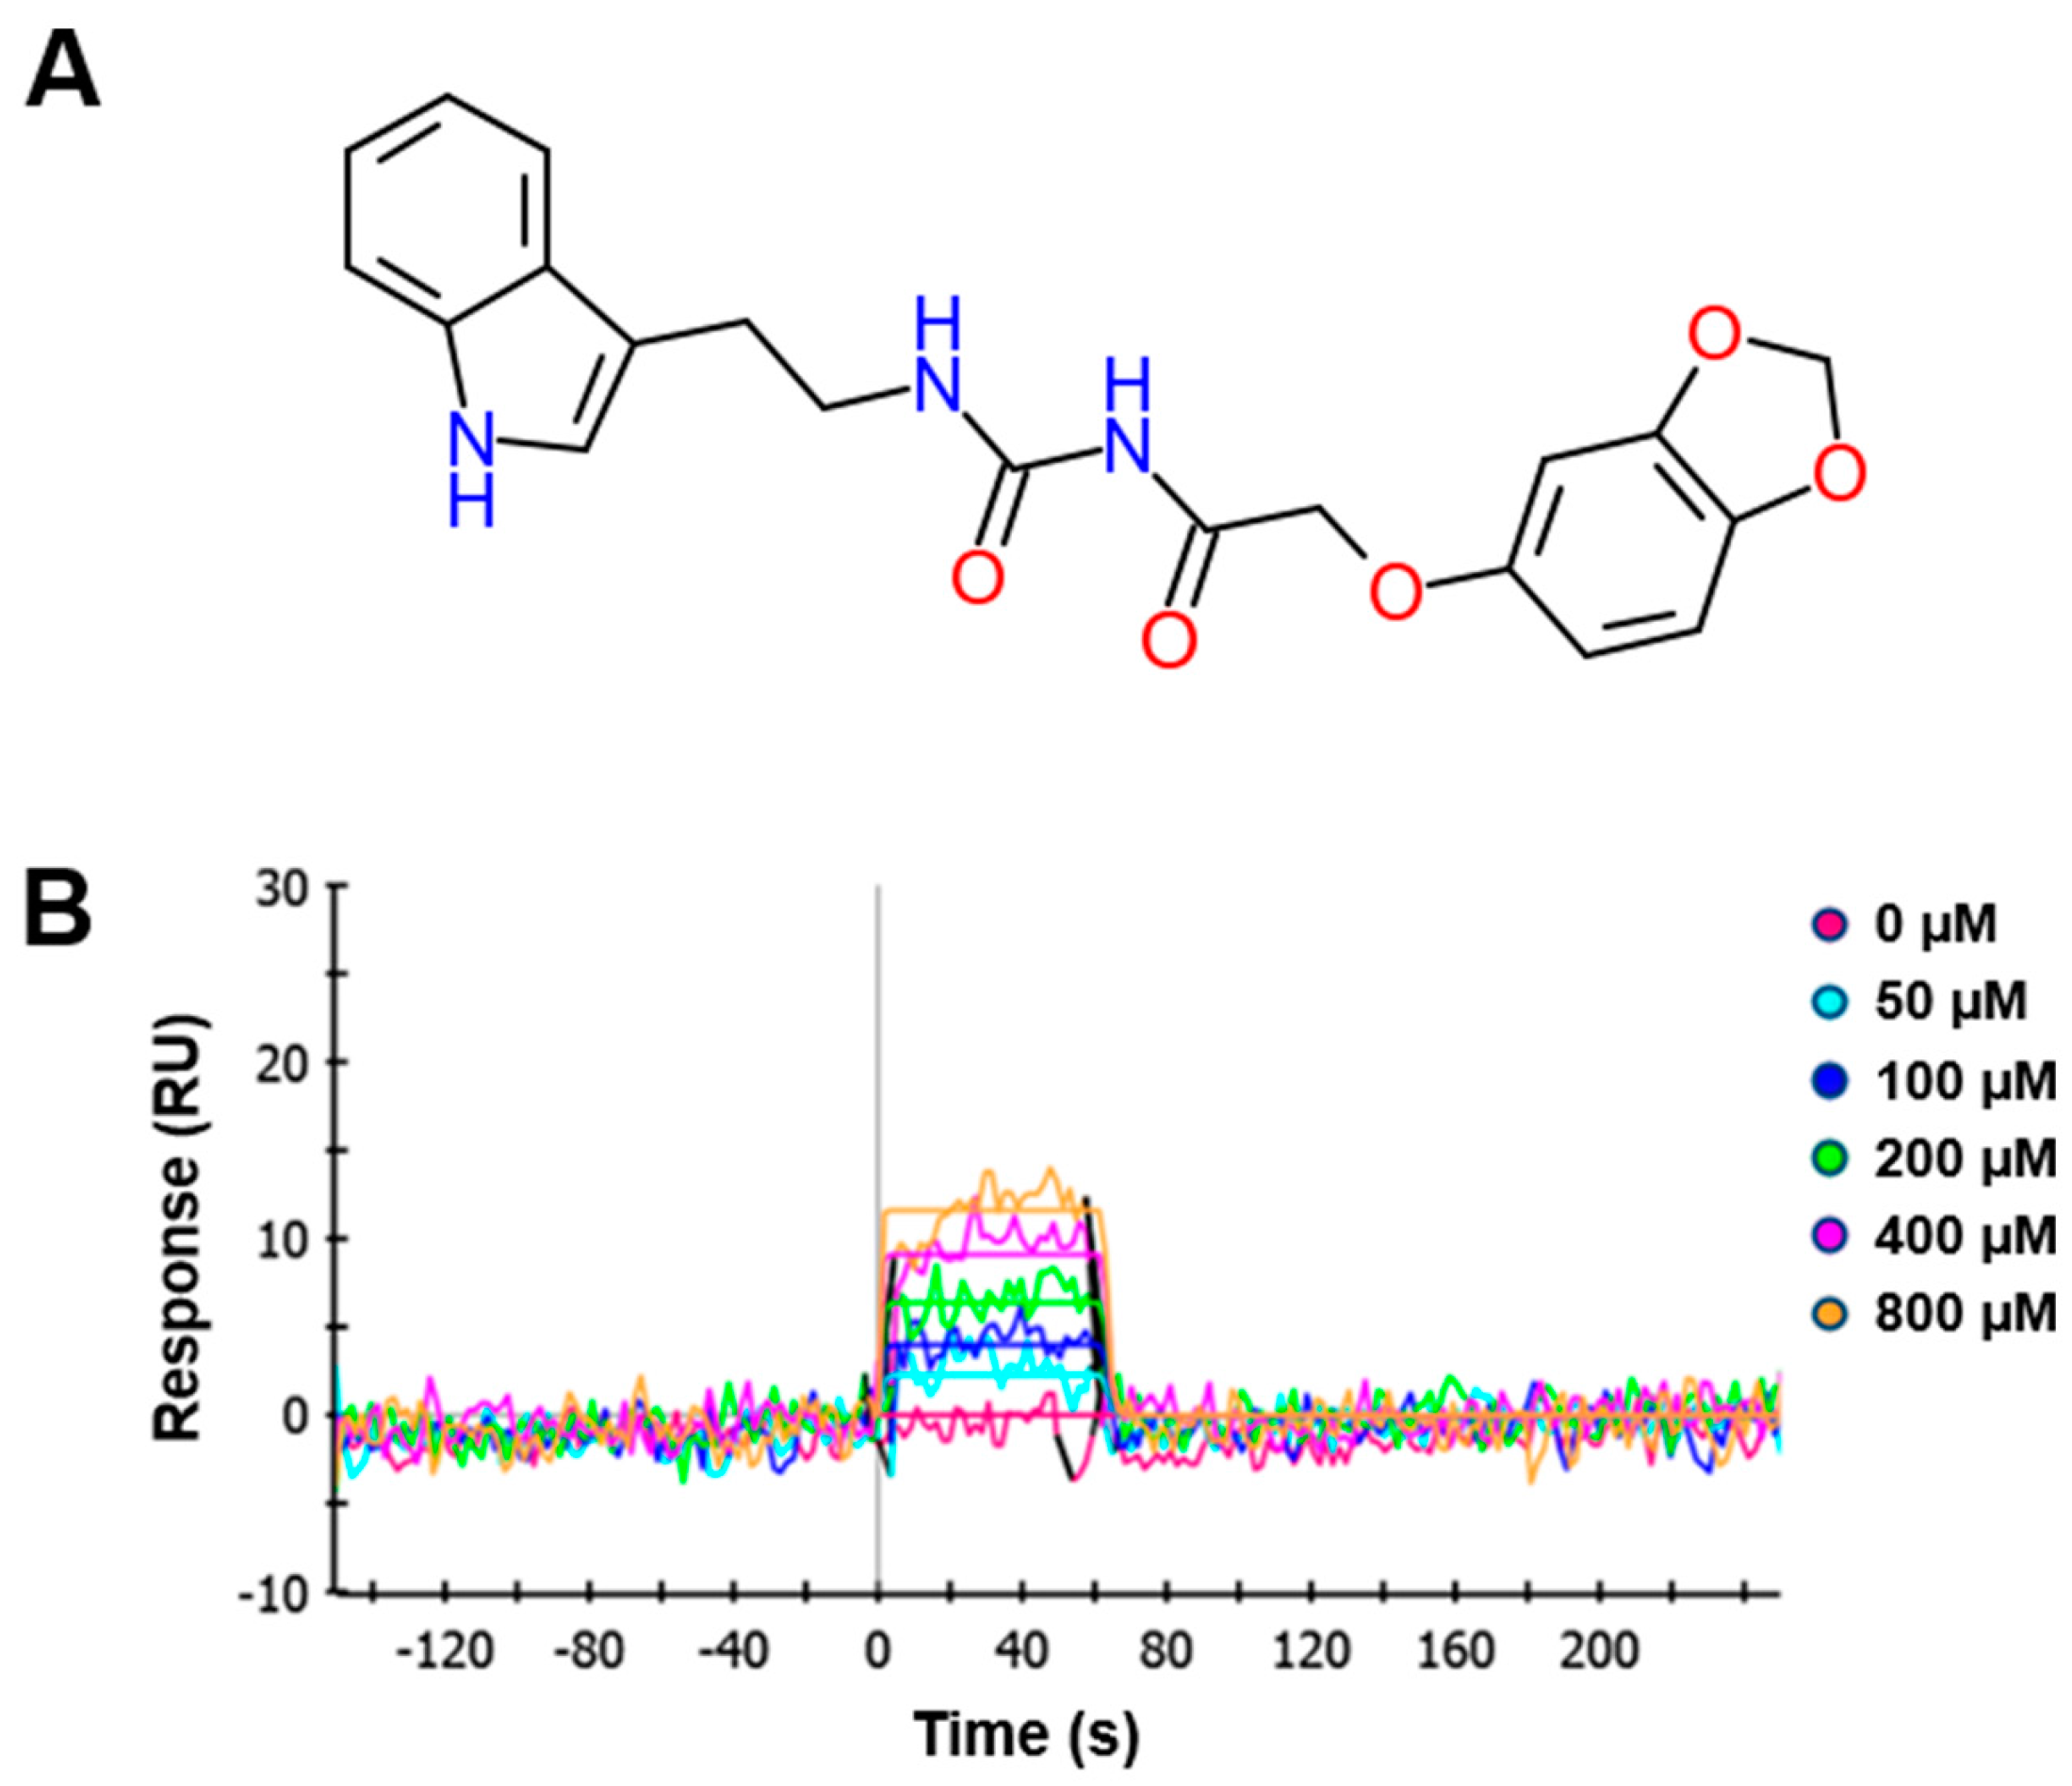
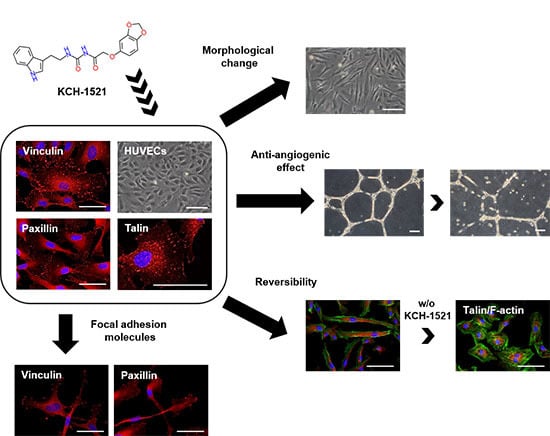
In the present study, we synthesized a novel talin modulator, N-((2-(1H-indol-3-yl)ethyl)carbamoyl)-2-(benzo[d][1,3]dioxol-5-yloxy)acetamide, referred to as KCH-1521, that is an N-acylurea derivative, and explored its effects and related mechanisms on HUVECs.
3. Discussion
The novelties of the present study were that (1) we successfully synthesized a new talin modulator, KCH-1521; (2) we described the first small molecule, KCH-1521 that binds to talin and down-regulated subsequent FA-related molecules; and (3) we showed the in vitro anti-angiogenic effects of KCH-1521 in HUVECs.
Synthesized KCH-1521 at the concentration of 100 μM was dissolved in 1% (
v/
v) DMSO that was used as the vehicle control in our study. We found that there was no significance in absorbance units between the untreated condition (0 μM) and 1% (
v/
v) DMSO (indicated as 100 μM in
Figure 2A). This is supported by the recent study showing that treatment with 1% (
v/
v) DMSO for 24 h showed no significant increases in the number of pyknotic nuclei and apoptotic cells compared to the untreated control. Also, there was no significance in the decrease in cell viability between 0% and 1% (
v/
v) DMSO [
19]. Moreover, Sumida et al. [
20] revealed that no cytotoxic effects of DMSO were observed up to the 2% (
v/
v) by lactate dehydrogenase (LDH) activity tests in both human and rat hepatocytes after 24 h of treatment. Therefore, we considered that there was no significant cytotoxicity of 1% (
v/
v) DMSO on HUVECs when used as the vehicle control in this study.
Integrin signaling has been implicated in various cell physiological processes [
2]. In platelets, integrin mediates platelet adhesion and aggregation, therefore, integrin modulation has become an attractive strategy for antiplatelet effects [
21]. Also, endothelial cell integrin regulates numerous cell functions including angiogenic sprouting [
22]. Recently, small molecules regulating integrin signaling such as FAK inhibitors have been developed and extensively studied in various cancer cells, demonstrating both in vitro and in vivo anti-tumor effects [
23,
24]. However, small molecules that modulate other FA molecules especially talin have not yet been reported.
In vertebrates, there are two isoforms of talin, and endothelial cells express talin1 and little or no talin2. HUVECs transfected with talin1 siRNA were elongated and showed a loss of actin stress fibers and actin accumulation in the lamellae compared to those transfected with control RNA [
18]. In accordance with a previous report, HUVECs used in our study were positive for talin1 and talin2 (
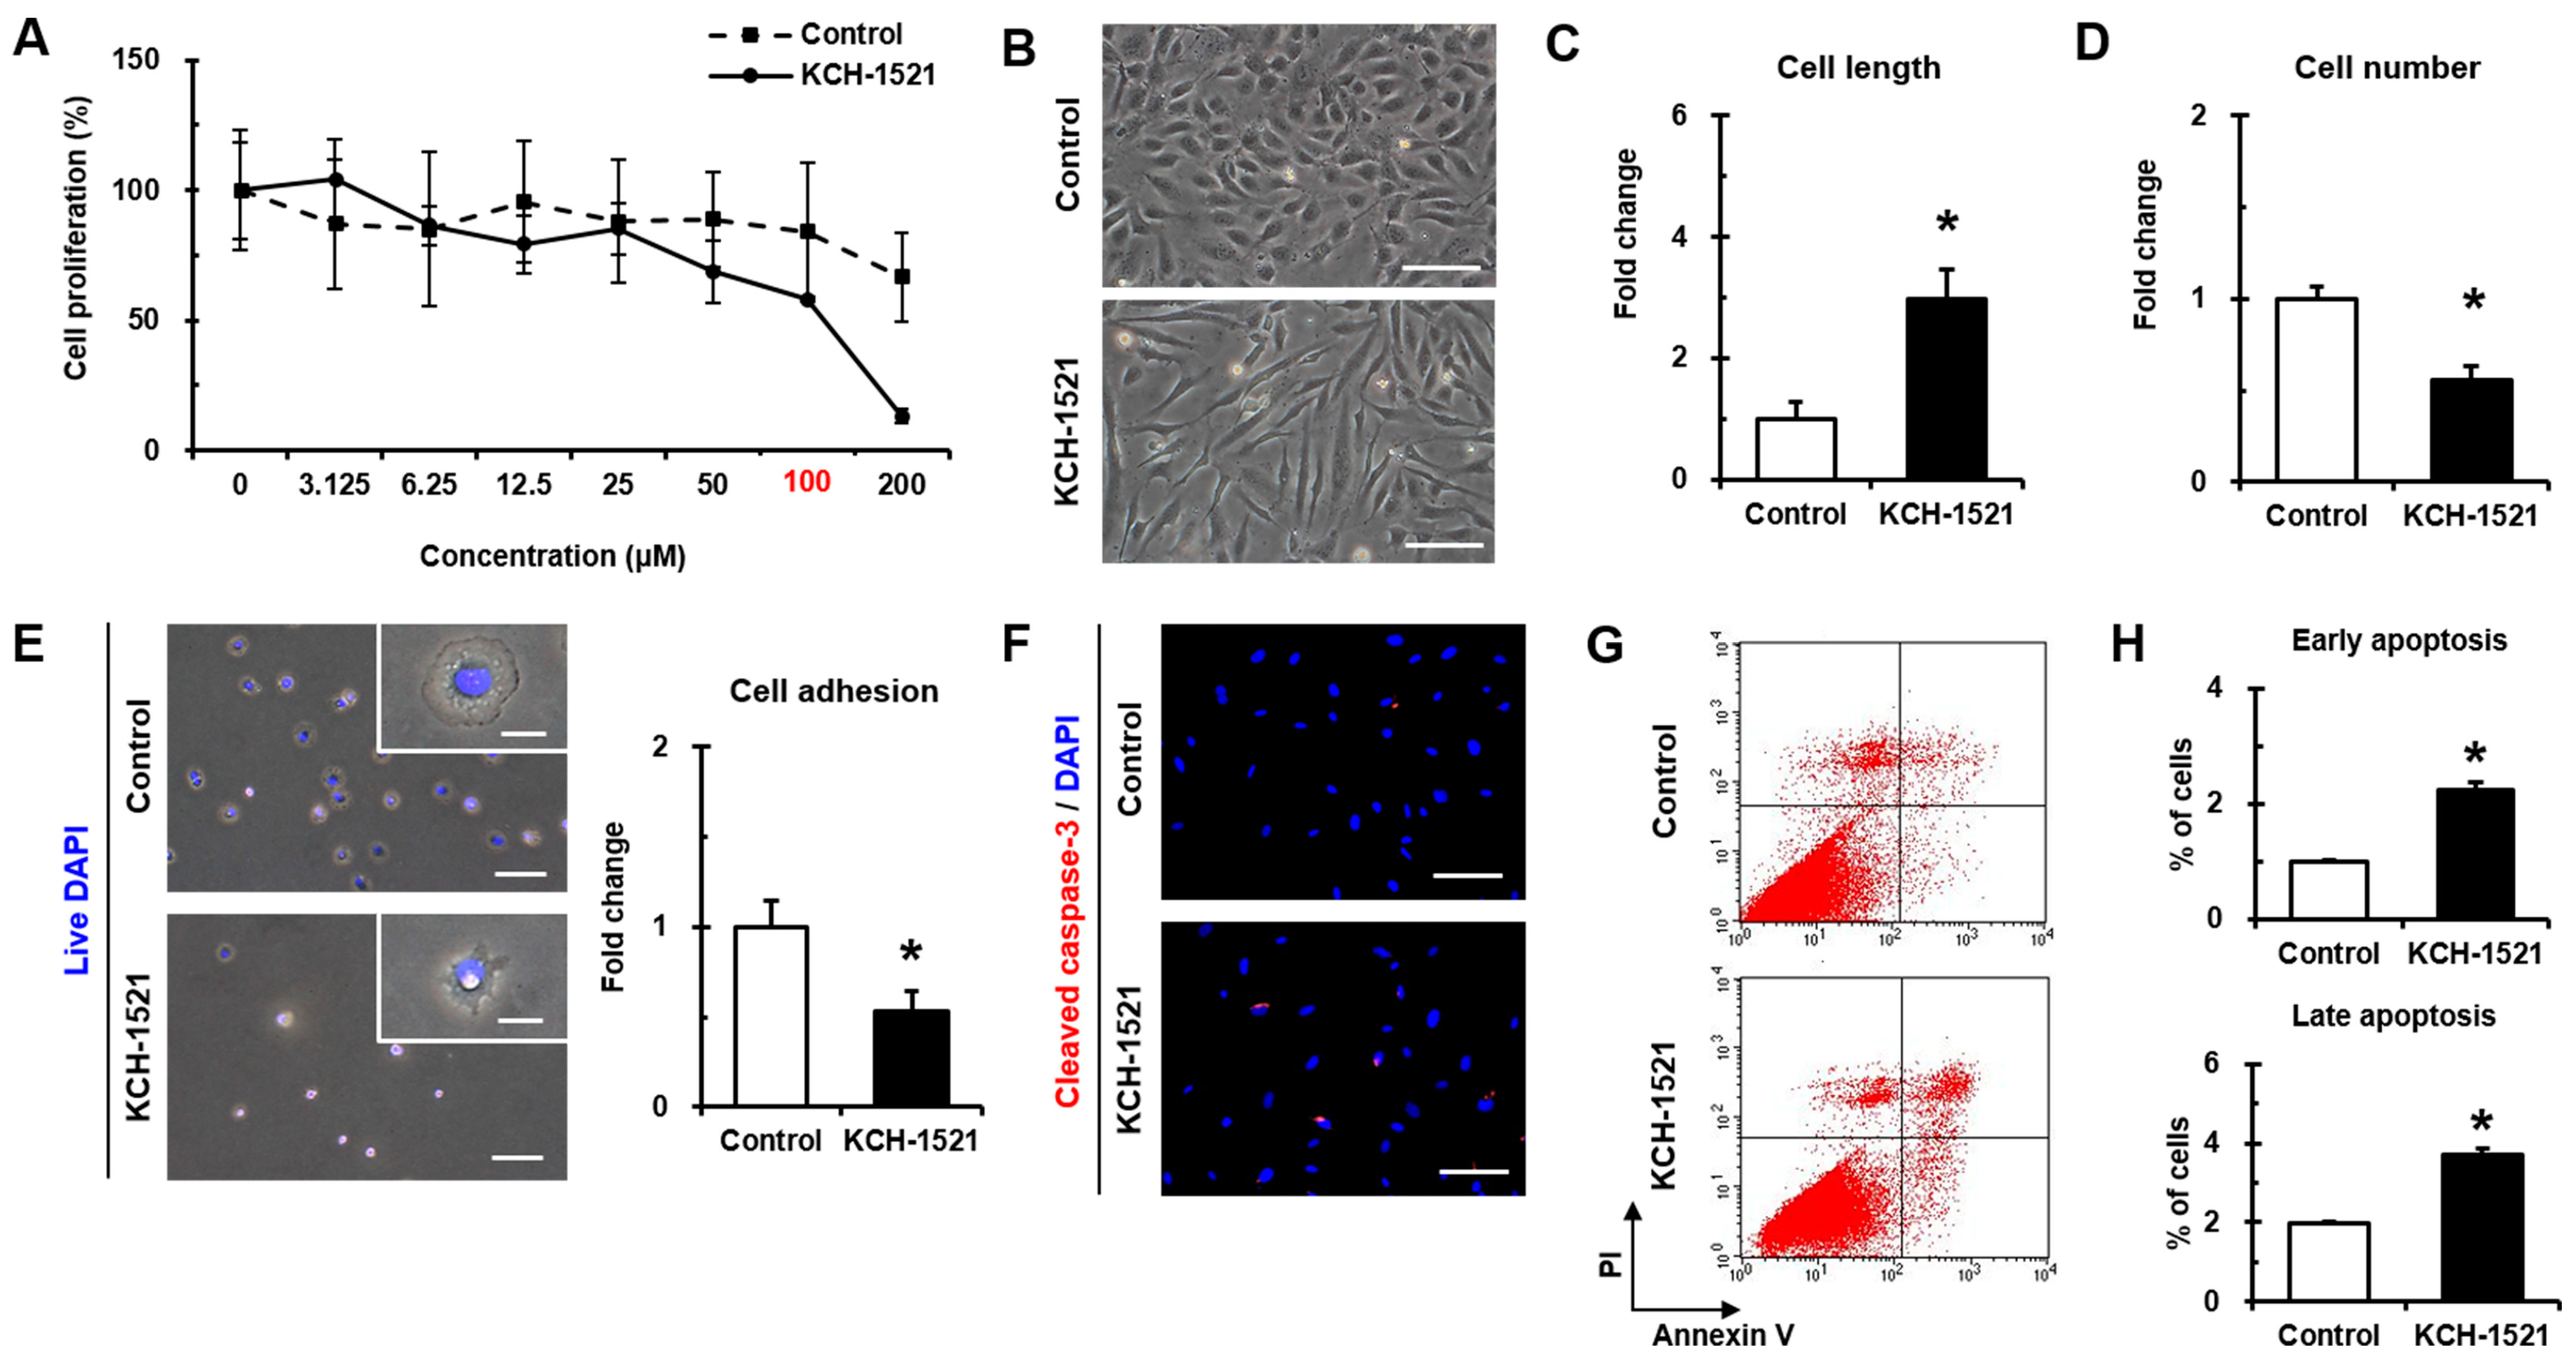
Supplementary Figure S1A) and talin modulation by KCH-1521 induced morphological changes in the form of elongation in shape and increases in the cell length of HUVECs (
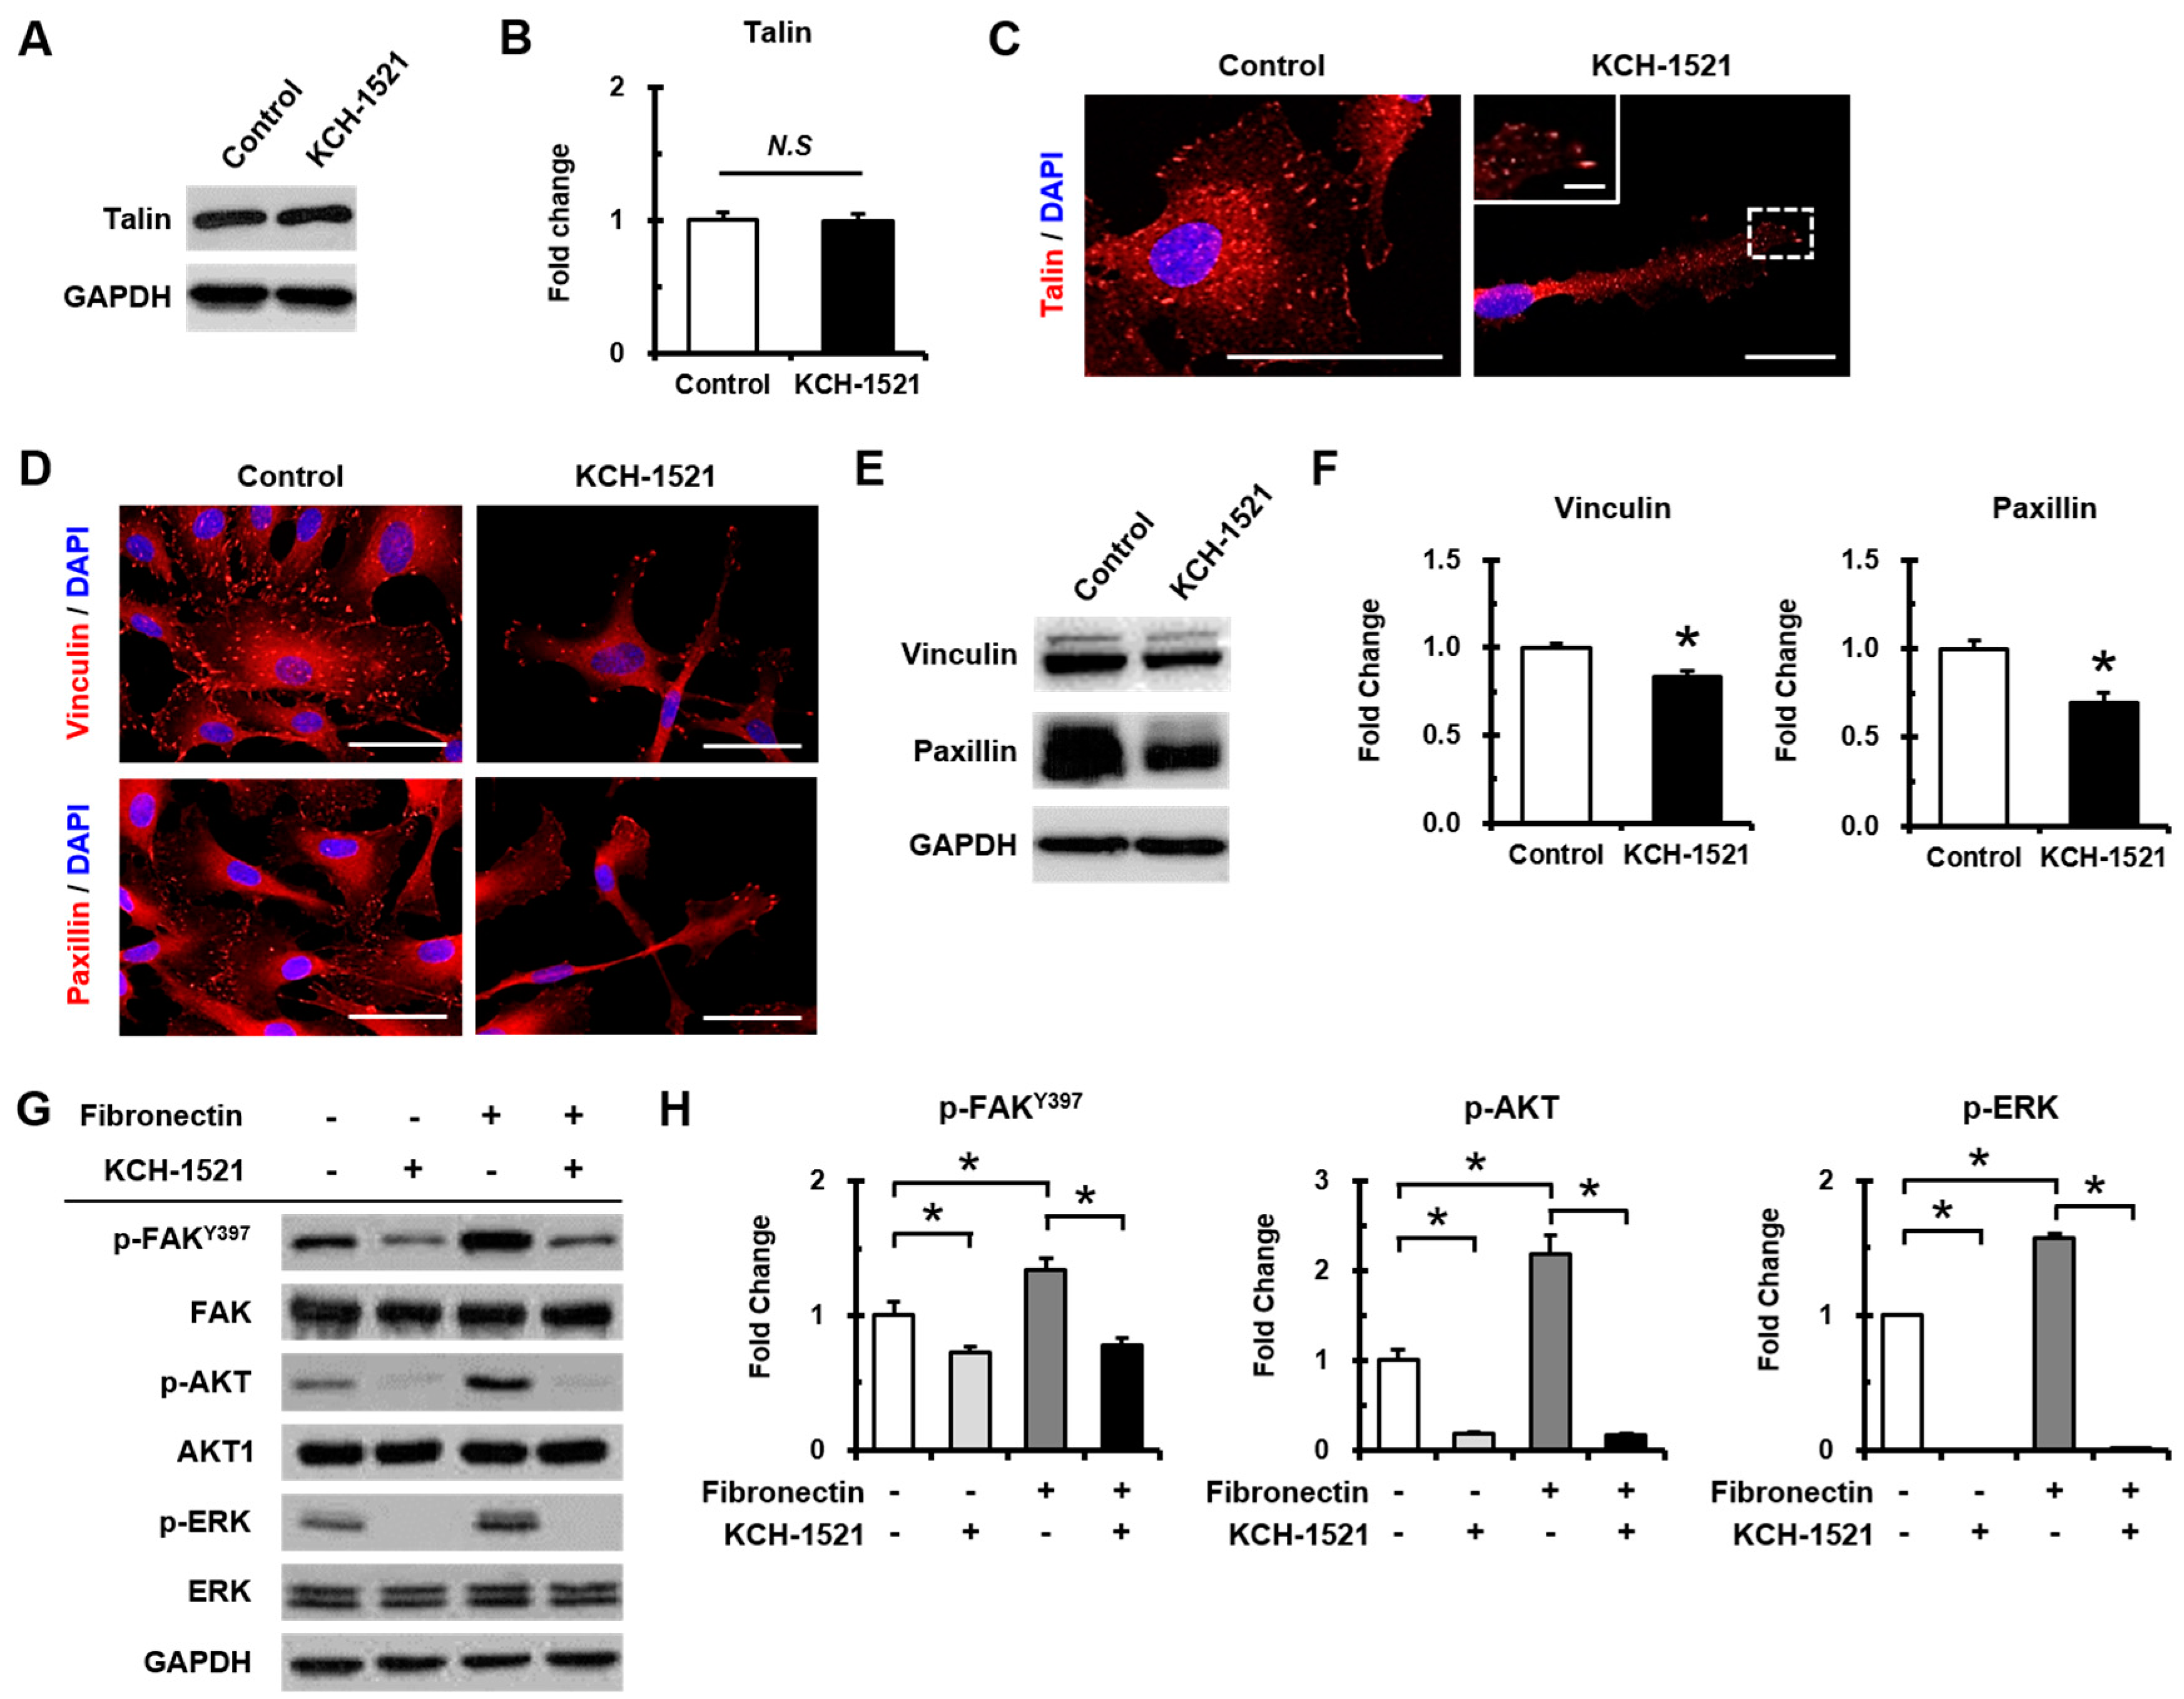
Figure 2B,C). Although there was no significant difference in the amount of talin protein between the control and KCH-1521 treatment (
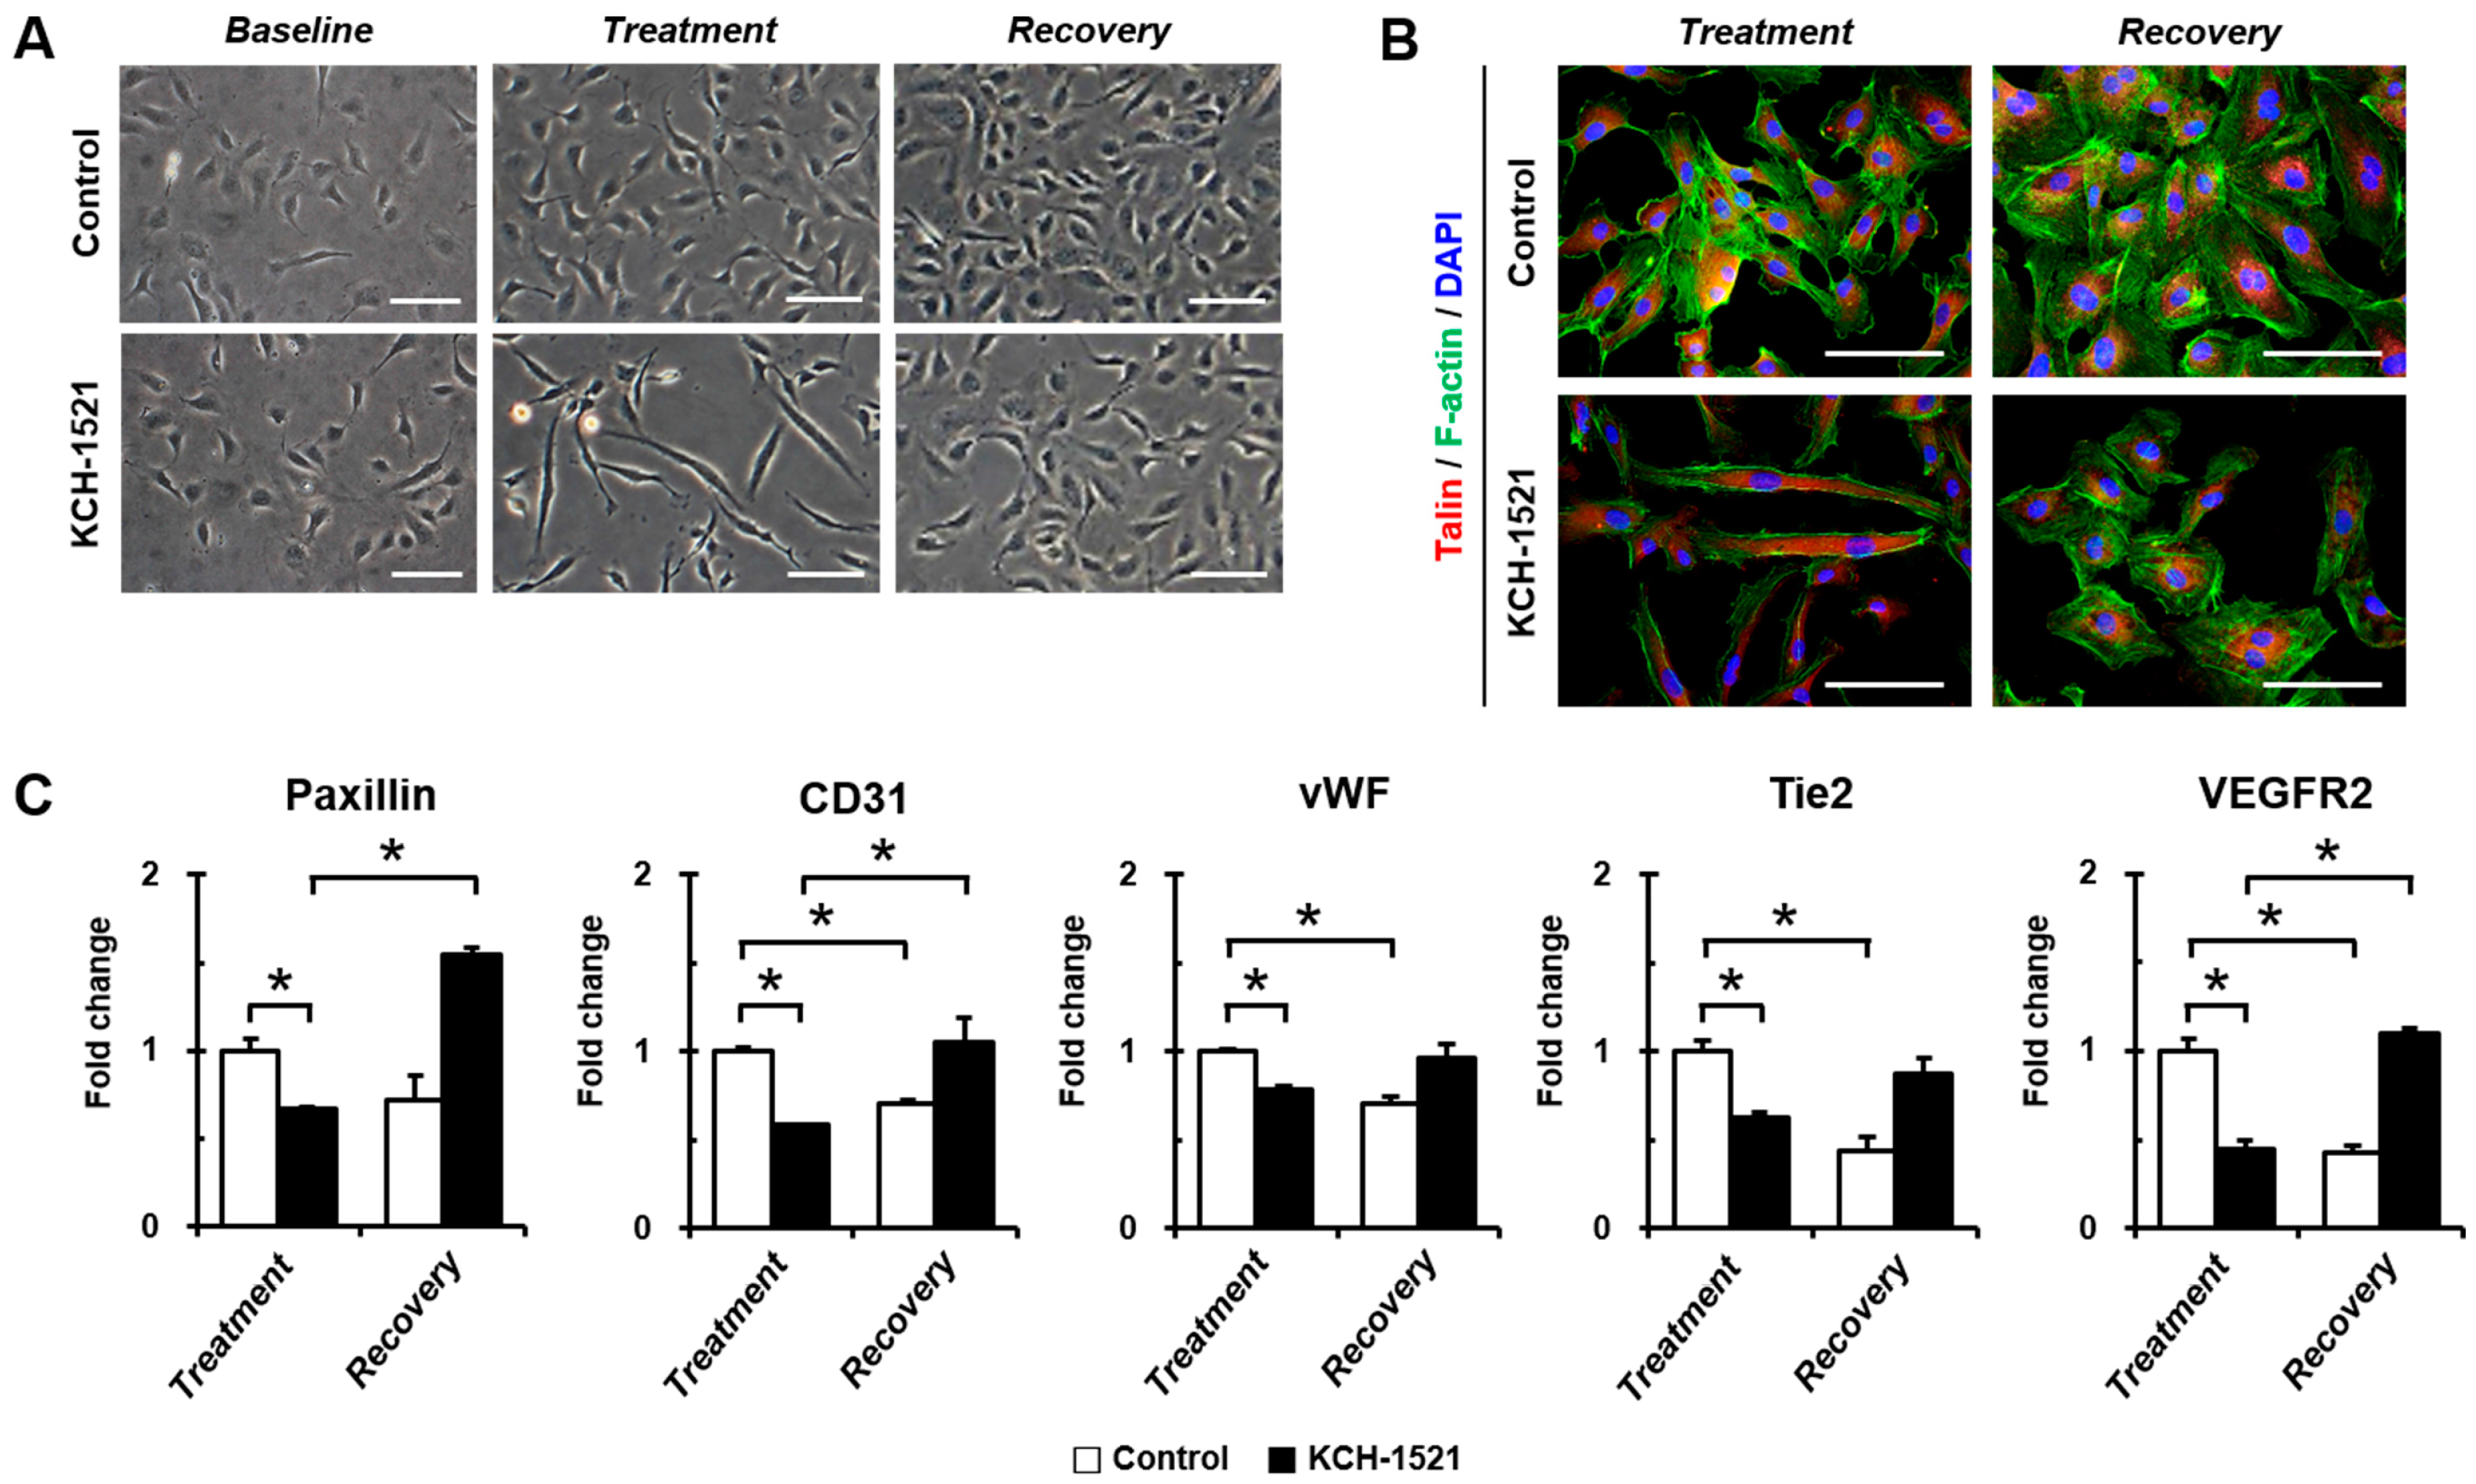
Figure 5A,B), KCH-1521 led to less spanned expression of talin (
Figure 5C) and talin-binding F-actin (
Figure 4B), which were considered to be involved in changes of cell morphology. These findings indicate that modulation of talin by KCH-1521 may have similar effects to those of talin knockdown using siRNA as reported by Kopp et al. [
18].
Talin-mediated integrin activation triggers recruiting of multiple FA molecules and the inducing of intracellular signaling cascades [
25]. FAK is a downstream molecule of integrin and is essential for focal adhesion-dependent signals [
26]. FAK-AKT signaling, in which AKT is one of the key downstream molecules of the PI3K pathway, is involved in cell survival and apoptosis [
8,
25,
27]. In this study, treatment with KCH-1521 resulted in significant decreases in phosphorylation of FAK and AKT (
Figure 5G,H) and increases in apoptosis by cleaved caspase-3 (
Figure 2F) and Annexin V/PI staining (
Figure 2G,H) compared to the control. Furthermore, FAK-ERK signaling of the intracellular MAPK pathway was associated with cell proliferation [
8,
26]. In HUVECs, we also noted the reduced phosphorylation of ERK (
Figure 5G,H) and dose-dependent decrease in proliferation by KCH-1521 (
Figure 2A). Consequently, KCH-1521 led to reduced proliferation and increased apoptosis via suppression of the intercellular signaling pathways of integrin in HUVECs.
Many previous studies on angiogenesis using small molecules have been focused on receptor tyrosine kinases such as VEGFR, FGF receptor (FGFR), or EGF receptor (EGFR) [
28,
29]. In addition, integrin-targeting approaches utilizing antibodies [
30], peptides [
31], or sequence mutation [
32] have generally been investigated in preclinical and clinical studies. In this study, for the first time we developed a talin-binding small molecule, KCH-1521, that modulates downstream signaling molecules (
Figure 5) and suggested in vitro anti-angiogenic effects of KCH-1521 on HUVECs (
Figure 3). Our results corroborate previous studies that talin interacts with integrin β3, and that the integrin αVβ3 subunit plays an essential role in angiogenesis, especially in endothelial cells [
13,
14,
33]. Furthermore, Monkley et al. [
17] showed that talin1 inactivation in mouse embryos resulted in severe hemorrhage, poor organization into vessels, and defects on in vivo angiogenesis. Based on these findings, we speculate that talin modulation through KCH-1521 could play a critical role in endothelial cells during in vivo neoangiogenesis.
Interestingly, we observed that
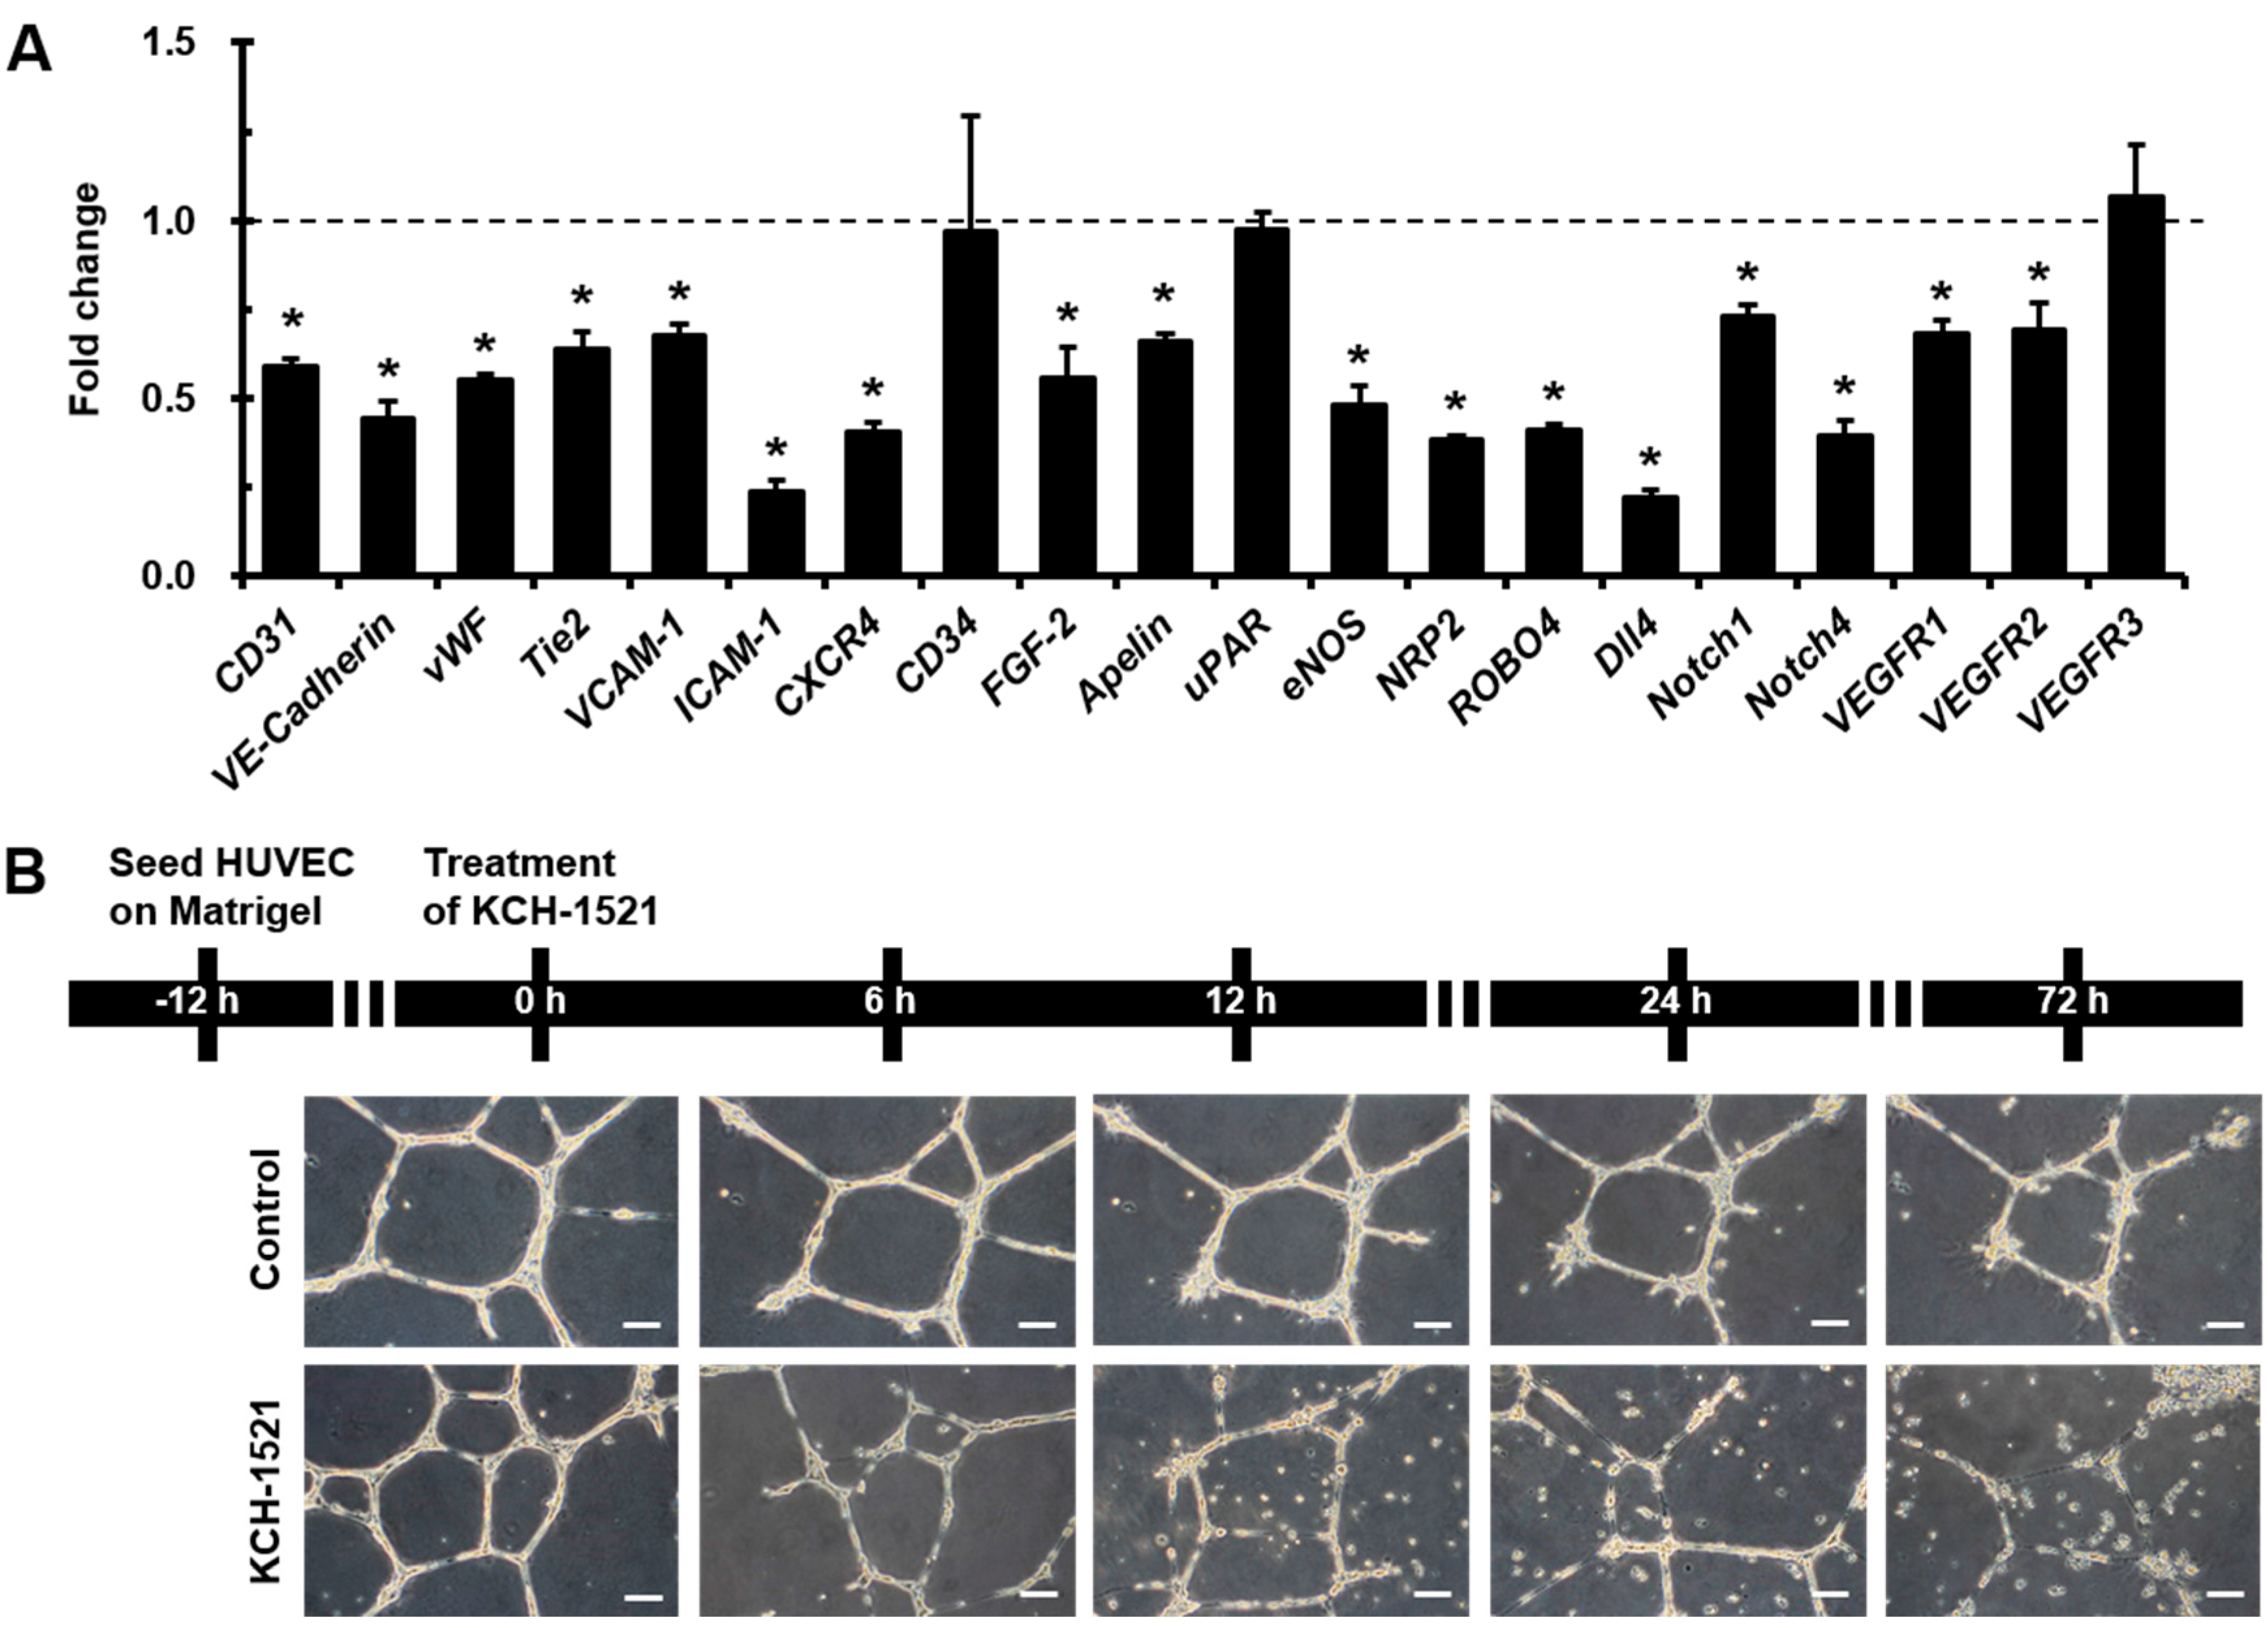
Dll4 was the most decreased gene among the various angiogenic genes, and simultaneously
Notch1 and
Notch4 gene expression also reduced by treating HUVECs with KCH-1521 (
Figure 3A). Notch1 and Notch4 are expressed in endothelial cells and Dll4-Notch signaling is important for vascular development [
34]. In addition, Dll4 is highly expressed in the tumor vasculature and is a negative regulator of tumor angiogenesis [
35]. These finding suggest that talin-modulating KCH-1521 may have therapeutic potential to suppress tumor angiogenesis. Moreover, we also found significant decreases in the expression of cell adhesion molecules such as
VCAM-1 and
ICAM-1 (
Figure 3A). These molecules are expressed in endothelial cells in response to inflammatory cytokines and facilitate leukocyte adhesion and infiltration in inflamed tissues [
36]. Taken together, these results indicate that not only angiogenesis, but inflammatory responses could be affected by KCH-1521, indicating promising therapeutic potentials to treat various inflammatory disorders.
Nonetheless, there are a few limitations in the present study. First, we suggested in vitro cellular characterization of KCH-1521 by various methods, however, we did not perform in vivo evaluations of the pharmacokinetic or pharmacodynamics of KCH-1521. Second, we did not examine the direct effects of KCH-1521 on the integrin β3-talin interaction in the present study. Lastly, we investigated the effects of talin modulation by KCH-1521 using HUVECs, however, additional analyses using other subtypes of endothelial cells or several cell types that express talin1 and talin2 are required to verify our results.
To the best of our knowledge, this study is the first to demonstrate that talin modulation by novel KCH-1521 decreased the in vitro angiogenesis in HUVECs. Reduced expression of FA molecules and the downstream signaling molecules of talin induced increased apoptosis and decreased cell proliferation and in vitro angiogenesis. Further in vivo studies and optimization of KCH-1521 may lead to talin-targeted anti-angiogenic drugs for the treatment of vascular diseases and cancer.
4. Materials and Methods
4.1. Synthesis of N-((2-(1H-Indol-3-yl)ethyl)carbamoyl)-2-(benzo[d][1,3]dioxol-5-yloxy)acetamide (KCH-1521)
A mixture of 2-chloroacetamide (0.9 g, 10.69 mmol), sesamol (1.4 g, 10.69 mM), NaI (2.4 g, 16.03 mmol), and K2CO3 (4.43 g, 32.07 mmol) in N,N-dimethylformamide (DMF; 21 mL) was refluxed for 24 h. The resulting mixture was filtered with ethyl acetate (EtOAc; 30 mL). The organic mixture was washed with water (10 mL × 3) and dried over anhydrous MgSO4. Volatiles were removed under reduced pressure. The remaining residue was separated with SiO2 chromatography (EtOAc:n-hexane = 1:1) to give 2-(benzo[d][1,3]dioxol-5-yloxy)acetamide as a brown solid (0.87 g, 42%): proton nuclear magnetic resonance (1H-NMR; 500 MHz, DMSO (D8418, Sigma-Aldrich, St. Louis, MO, USA)-d6) δ 7.47 (1H, s), 7.37 (1H, s), 6.81 (1H, d, J = 10.0 Hz), 6.65 (1H, d, J = 5.0 Hz), 6.38 (1H, dd, J = 2.5 Hz, 8.5 Hz), 5.96 (2H, s), 4.32 (2H, s); carbon-13 NMR (13C-NMR; 500 MHz, DMSO-d6) δ 170.0, 153.1, 147.8, 141.5, 107.9, 106.0, 101.1, 98.1, 67.6; IR (ATR-IR) 3409, 3130, 1685, 1188 cm−1; low resolution mass spectroscopy (LRMS) [M + Na]+ 218.
A solution of the above acetamide (60 mg, 0.34 mmol) and oxalyl chloride (0.04 mL, 0.51 mmol) in dichloroethane (DCE; 1.7 mL) was stirred at 85 °C for 5 h. The resulting mixture was concentrated under reduced pressure. The remaining residue was dissolved in dichloromethane (DCM) and treated with tryptamine (55 mg, 0.34 mmol). After stirring for 3 h, distilled water was added. The mixture was extracted with DCM and dried over MgSO4. Volatiles were removed under reduced pressure. The remaining residue was separated with SiO2 chromatography (EtOAc:n-hexane = 1:2) to give the title compound, N-((2-(1H-indol-3-yl)ethyl)carbamoyl)-2-(benzo[d][1,3]dioxol-5-yloxy)acetamide as a yellow solid (65 mg, 50% in 2 steps): 1H-NMR (500 MHz, DMSO-d6) δ 10.81 (1H, s), 10.26 (1H, s), 7.56 (1H, d, J = 7.5 Hz), 7.33 (1H, d, J = 8.0 Hz), 7.15 (1H, s), 7.06 (1H, t, J = 7.5 Hz), 6.96 (1H, t, J = 7.0 Hz), 6.80 (1H, d, J = 8.5 Hz), 6.64 (1H, d, J = 2.5 Hz), 6.33 (1H, dd, J = 2.5 Hz, 11.0 Hz), 5.96 (2H, s), 4.61 (2H, s), 3.46 (2H, q, J = 7.4 Hz), 2.88 (2H, t, J = 7.0 Hz); 13C-NMR (500 MHz, DMSO-d6); 169.63, 152.73, 152.30, 147.59, 141.34, 135.98, 126.79, 122.46, 120.66, 118.00, 117.93, 111.06, 107.64, 105.47, 100.82, 97.74, 66.67, 24.88; IR (ATR-IR) 3362, 1682, 1488, 1185 cm−1; LRMS [M + Na]+ 404.
4.2. Surface Plasmon Resonance (SPR)
SPR response curves were measured using a series of concentrations of the tested compound. A ProteOn XPR36 system (Bio-Rad Laboratories, Hercules, CA, USA) equipped with a sensor chip was used for real-time binding studies. Phosphate-buffered saline (PBS; 17-517Q, Lonza, Walkersville, MD, USA) with 0.005% Tween 20 (P2287, Sigma-Aldrich) was used as the assay running buffer and for sample preparation. Bacterially expressed talin was immobilized onto channels of the HTE chip (Bio-Rad Laboratories), leaving one channel as a reference. A 210 μL sample of talin (2.5 µg/mL, His-tagged) was injected into the flow cells (30 μL/min) to allow saturation of the HTE chip by talin. To perform binding kinetics analysis, 100 μL aliquots of serially diluted compounds ranging from 50 to 800 μM with 4% DMSO in 1× tris-buffered saline (TBS; WH400028806, 3M, Maplewood, MN, USA) + 0.1% Tween 20 (TBST) were injected and allowed to flow through the channels of the HTE chip for 1 min at 100 μL/min. Relationships between the RU were obtained, and the concentrations of the tested compounds were plotted. To obtain dissociation curves, the analyte injection was stopped, and PBST (100 μL/min) was flowed over the chip for 200 s to dissociate the bound analytes. The ProteOn XPR36 control software ProteOn Manager v.3.1.0.6 (Bio-Rad Laboratories) was used to record changes in RUs, plot the binding curves, and analyze the curves. The RUs were normalized by subtracting the RUs of the empty channel. The kinetic and equilibrium constants were obtained based on a global fit, using the Langmuir 1:1 bimolecular kinetic model.
4.3. Cell Sources
HUVECs (PCS-100-010, ATCC) and NHDFs (CC-2509, Lonza) as a control for talin abundance were purchased and maintained in endothelial cell growth medium (EGM-2MV; CC-3202) or fibroblast growth medium (FBM-2; CC-3132, both from Lonza). Both culture media contained 100 U/mL penicillin/streptomycin (P/S; #15140, Gibco, Grand Island, NY, USA). All cells were incubated at 37 °C in a humidified incubator with 5% CO2 and used at passage 7 to 10. Culture media were changed every two days. In experiments using KCH-1521, HUVECs were incubated with either KCH-1521 at a concentration of 100 μM or the equivalent amount of DMSO (1% (v/v)) as a vehicle control in culture medium. The cell length in the long axis and cell numbers were measured by phase-contrast images using the ImageJ (ver. 1.49) program (National Institute of Health, Bethesda, MD, USA).
4.4. WST-1 Proliferation Assay
HUVECs were plated at a density of 8 × 10³ cells/well in 96-well plates to analyze cell proliferation with the tetrazolium salt WST-1 (05015944001, Roche Applied Science, Mannheim, Germany). Briefly, the cells were treated with eight different concentrations of KCH-1521 (0, 3.125, 6.25, 12.5, 25, 50, 100, and 200 μM) or the equivalent amount of DMSO in each concentration for 24 h, and incubated at a concentration of 10 μM of WST-1 reagent for 2 h until color development was sufficient for photometric detection. The reaction product was quantified by measuring the absorbance at 440 nm using a microplate reader (M2e, Molecular Devices, Sunnyvale, CA, USA), and the reference wavelength was 600 nm. Data were analyzed using quantification of absorbance analysis of the SoftMax Pro software (Molecular Devices).
4.5. Cell Adhesion Assay
For detection of live cells, nuclei of HUVECs were stained with NucBlue® Live (live DAPI; R37605, Life Technologies, Eugene, OR, USA) for 20 mins according to the manufacturer’s instructions. The cells were seeded in fibronectin (F0895, Sigma-Aldrich)-coated six-well plates at a density of 5 × 10⁴ cells/well with either DMSO or KCH-1521-containing culture medium. After 10 mins of attachment, the unattached cells were washed twice with 1× PBS and fixed with 2% paraformaldehyde (PFA; P6148, Sigma-Aldrich). All images were taken immediately using an upright fluorescence microscope (DMI 3000B, Leica Microsystems, Wetzlar, Germany) and the live adherent cells were counted in five different fields per well.
4.6. Immunofluorescence Staining
HUVECs were fixed with 2% PFA after treatment for 24 h with DMSO or KCH-1521, and blocked with 5% normal goat serum (NGS; #16210, Gibco) in 1× PBS + 0.1% Tween 20 (PBST) for 1 h. The cells were incubated for 1 h at room temperature (RT) with the following primary antibodies: talin (T3287), vinculin (V9131, both from Sigma-Aldrich), and paxillin (610051, BD Biosciences, San Jose, CA, USA). After washing, the cells were incubated for 1 h at RT with Alexa Fluor 594-conjugated anti-mouse IgG (A11005) and Alexa Fluor 488-conjugated Phalloidin (A12379, both from Molecular Probes, Eugene, OR, USA). Nuclei were stained with 4′,6-diamidino-2-phenylindole (DAPI; D9542, Sigma-Aldrich). Negative controls for immunofluorescence staining were used to evaluate the specificity of primary antibodies and to exclude the possibility of non-specific staining of secondary antibodies by omitting the incubation of primary antibodies [
37]. All immunofluorescent images were obtained using the TE-FM Epi-fluorescence system attached to an inverted microscope (BX61, Olympus, Tokyo, Japan).
4.7. Apoptosis Assay
After 24 h of treatment with DMSO or KCH-1521, the cells were fixed with 2% PFA and blocked with 5% NGS. Briefly, the cells were incubated with cleaved caspase-3 (#9661, Cell Signaling Technology, Danvers, MA, USA) and Alexa Fluor 594-conjugated anti-rabbit IgG (A11012, Molecular Probes). Nuclei were stained with DAPI, and immunofluorescence images were obtained using the TE-FM Epi-fluorescence system attached to an inverted microscope.
Annexin V and PI staining was performed using the FITC Annexin V apoptosis detection kit I (556547) according to the manufacturer’s instructions, and then 3 × 10⁴ cells were analyzed using a flow cytometer (FACS Calibur) and Cell Quest Pro software (all from BD). Annexin V-negative and PI-negative cells were identified as viable, Annexin V-positive and PI-negative cells as early apoptotic, Annexin V-positive and PI-positive cells as late apoptotic, and Annexin V-negative and PI-positive cells as necrotic cells.
4.8. In Vitro Tube Forming Assay
HUVECs were plated on Matrigel (356230, BD)-filled 12-well plates at a density of 3 × 10³ cells/well and incubated in culture medium. After 12 h, the culture medium was changed to EGM-2MV containing either DMSO or KCH-1521. After 6, 12, 24, and 72 h of treatment, in vitro tube formation was observed. All phase-contrast images were acquired using an upright fluorescence microscope (DMI 3000B, Leica Microsystems).
4.9. Real-Time Polymerase Chain Reaction (PCR)
After 24 h of treatment with DMSO or KCH-1521, total RNA was extracted from cells using TRI Reagent (TR118, MRC, Cincinnati, OH, USA), and the concentration of total RNA was measured using a Nanodrop 1000 spectrophotometer (Thermo scientific, Waltham, MA, USA). Synthesized cDNA was then analyzed by real-time PCR using iQ
TM SYBR Green Supermix and the My iQ™ 2 real-time PCR detection system (both from Bio-Rad Laboratories) using anti-human primers. The primer sequences used for real-time PCR are listed in
Supplementary Table S1. To avoid genomic DNA amplification, intron-spanning primers were designed using Probe Finder software (
https://www.roche-applied-science.com). Relative gene expression levels were normalized to glyceraldehyde 3-phosphate dehydrogenase (
GAPDH) as a reference gene and presented as relative expression to the control using the ddCt method.
To perform semi-quantitative PCR, cDNA was synthesized from the extracted RNA. Initially, cDNA was analyzed using the real-time PCR as mentioned above. After amplification, the PCR reaction products were loaded onto 10% agarose gels for electrophoresis. The intensity of each band was quantified using a gel imaging system (GelDoc XR, Bio-Rad Laboratories).
4.10. Western Blot
HUVECs were treated for 24 h with DMSO or KCH-1521 after 24 h of incubation. Cell lysates were prepared using ice-cold 1× cell lysis buffer (#9803S, Cell Signaling Technology) with 1 mM phenylmethylsulfonyl fluoride (PMSF) for 1 h at 4 °C. Protein concentrations of samples were determined via Bradford protein assay (#500-0006, Bio-Rad Laboratories). Equal amounts of protein were separated by 10% sodium dodecyl sulfate (SDS)-polyacrylamide gel electrophoresis (SDS-PAGE) and transferred to a polyvinylidene difluoride (PVDF; 10600023, GE Healthcare, Chicago, IL, USA) membrane. The membranes were blocked with 5% skim milk in TBST for 1 h at RT and incubated overnight at 4 °C with the following primary antibodies: talin (#4021, Cell Signaling Technology), vinculin, and paxillin. After washing with TBST, the membranes were stained with the appropriate horseradish peroxidase (HRP)-conjugated secondary antibodies: anti-rabbit (sc-2030) or anti-mouse (sc-2005, both from Santa Cruz Biotechnology, Santa Cruz, CA, USA). The bands were visualized using ECL plus (32132, Thermo Scientific) reagent and exposed to radiography films (EA8EC, AGFA). The protein levels were normalized to GAPDH (G8795, Sigma-Aldrich), and the intensity of bands was analyzed using Quantity One software (Bio-Rad Laboratories).
HUVECs were incubated on fibronectin-coated dishes for 6 h and treated with KCH-1521 for 4 h. Briefly, equal amounts of protein were subjected to SDS-PAGE and transferred as mentioned above. The membranes were blocked and incubated overnight at 4 °C with the following primary antibodies: AKT1 (sc-1618, Santa Cruz), FAK (#13009), phospho-FAK (Tyr397) (#8556), phospho-AKT (Ser473) (#9271), p44/42 MAPK (ERK1/2) (#9102), and phospho-p44/42 MAPK (ERK1/2; #9106, all from Cell Signaling Technology). After washing, the membranes were stained with the appropriate HRP-conjugated secondary antibodies: anti-goat (HAF109, R&D Systems, Minneapolis, MN, USA), anti-rabbit, or anti-mouse. The protein levels were normalized to GAPDH, and the band intensity was analyzed.
4.11. Statistical Analysis
All values are presented as mean ± standard deviation (SD). Comparison among values for the analysis of differences between groups was performed by Student’s t-test. Analysis of variance (ANOVA) followed by Student-Newman Keuls test was used to compare the values for all groups. All experiments were repeated at least three times, and * p < 0.05 was considered to be statistically significant.


