
Identification of Reference Genes for RT-qPCR Data Normalization in Cannabis sativa Stem Tissues


 ,
,  and
and 
Abstract
:1. Introduction
2. Results and Discussion
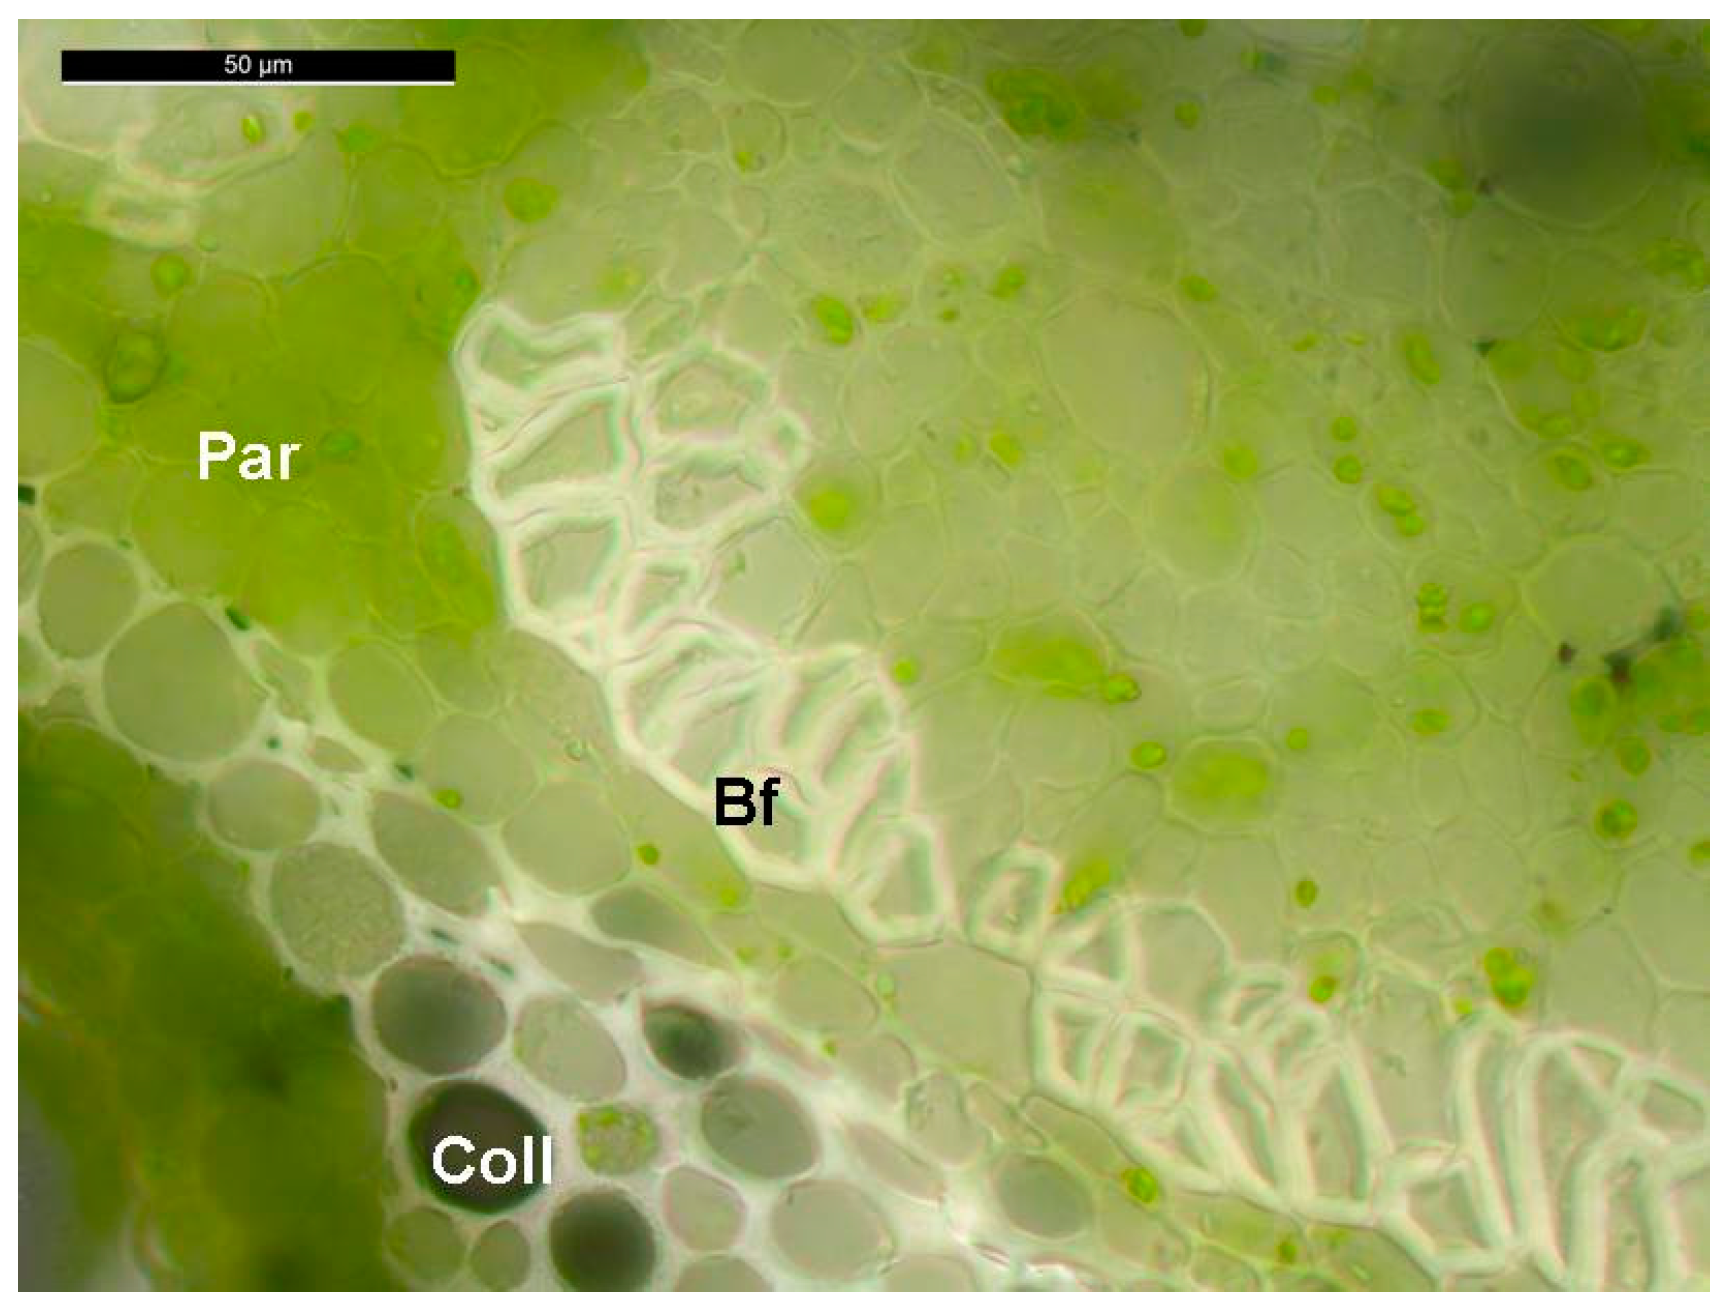
2.1. Stability of Candidate Reference Genes in C. sativa Stem Tissues
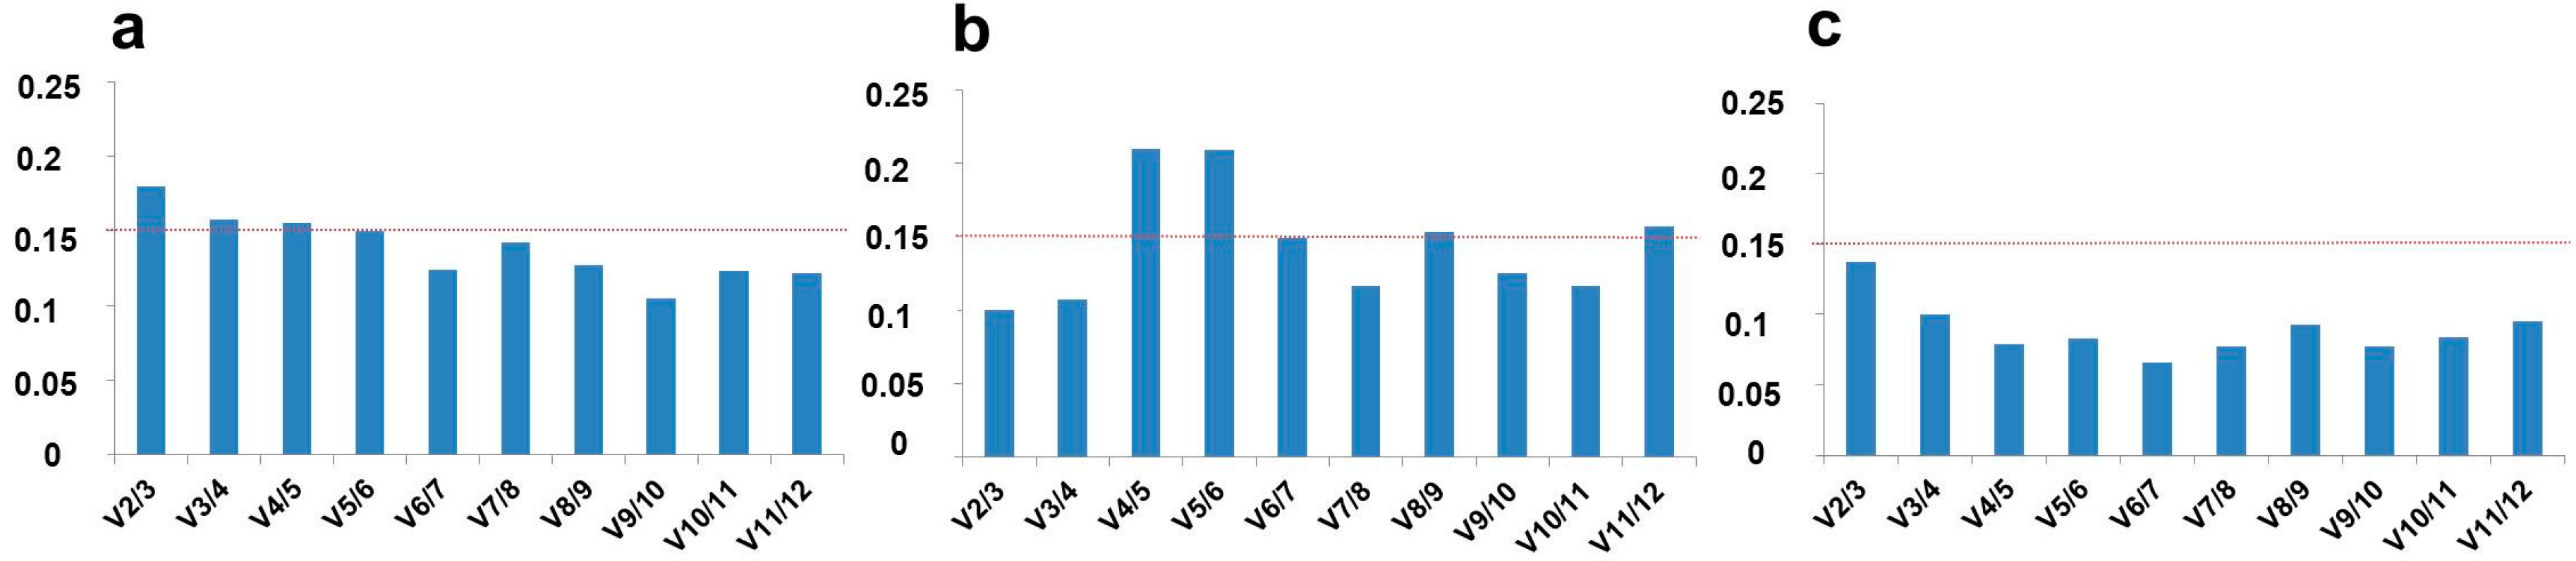
2.2. Optimal Number of Reference Genes in C. sativa Stem Tissues
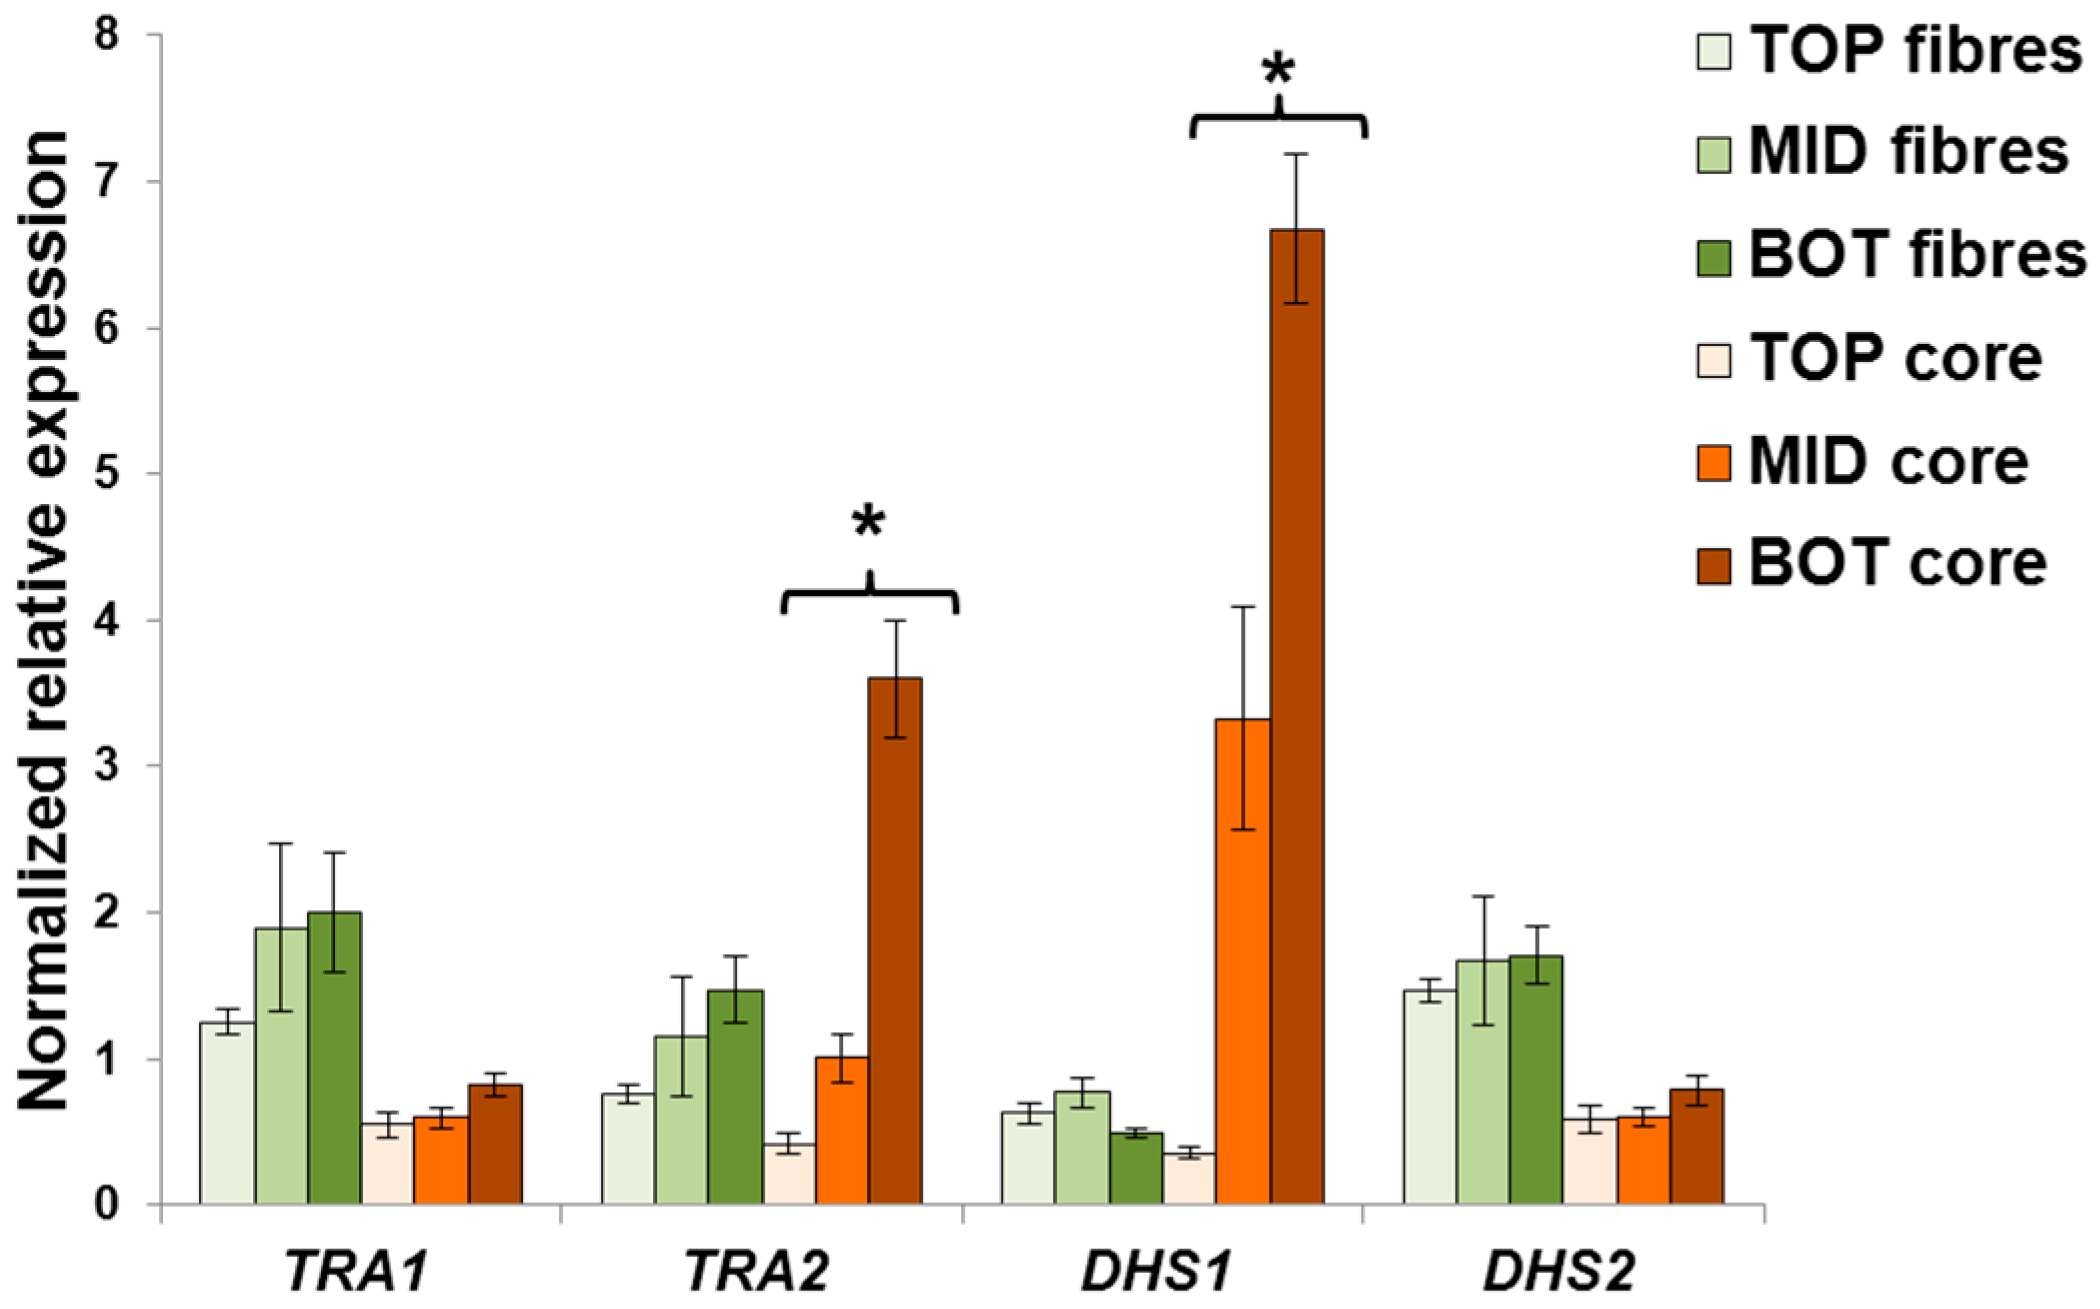
2.3. Validation of the Reference Genes in Hemp Stem Tissues
3. Materials and Methods
3.1. Plant Material and Growth Conditions
3.2. Gene Identification and Primer Design
3.3. RNA Extraction, cDNA Synthesis and RT-qPCR
4. Conclusions
Supplementary Materials
Acknowledgments
Author Contributions
Conflicts of Interest
Abbreviations
| RT-qPCR | Real-Time PCR |
| G-layer | Gelatinous layer |
References
- Wu, Z.-J.; Tian, C.; Jiang, Q.; Li, X.-H.; Zhuang, J. Selection of suitable reference genes for qRT-PCR normalization during leaf development and hormonal stimuli in tea plant (Camellia sinensis). Sci. Rep. 2016, 6, 19748. [Google Scholar] [CrossRef] [PubMed]
- Wang, M.; Lu, S. Validation of suitable reference genes for quantitative gene expression analysis in Panax ginseng. Front. Plant Sci. 2015, 6, 1259. [Google Scholar] [CrossRef] [PubMed]
- Peng, Y.-L.; Wang, Y.-S.; Gu, J.-D. Identification of suitable reference genes in mangrove Aegiceras corniculatum under abiotic stresses. Ecotoxicol. Lond. Engl. 2015, 24, 1714–1721. [Google Scholar] [CrossRef] [PubMed]
- Schliep, M.; Pernice, M.; Sinutok, S.; Bryant, C.V.; York, P.H.; Rasheed, M.A.; Ralph, P.J. Evaluation of reference genes for RT-qPCR studies in the seagrass Zostera muelleri exposed to light limitation. Sci. Rep. 2015, 5, 17051. [Google Scholar] [CrossRef] [PubMed]
- Vandesompele, J.; de Preter, K.; Pattyn, F.; Poppe, B.; van Roy, N.; de Paepe, A.; Speleman, F. Accurate normalization of real-time quantitative RT-PCR data by geometric averaging of multiple internal control genes. Genome Biol. 2002, 3, RESEARCH0034. [Google Scholar] [CrossRef] [PubMed]
- Andersen, C.L.; Jensen, J.L.; Ørntoft, T.F. Normalization of real-time quantitative reverse transcription-PCR data: A model-based variance estimation approach to identify genes suited for normalization, applied to bladder and colon cancer data sets. Cancer Res. 2004, 64, 5245–5250. [Google Scholar] [CrossRef] [PubMed]
- Pfaffl, M.W.; Tichopad, A.; Prgomet, C.; Neuvians, T.P. Determination of stable housekeeping genes, differentially regulated target genes and sample integrity: BestKeeper—Excel-based tool using pair-wise correlations. Biotechnol. Lett. 2004, 26, 509–515. [Google Scholar] [CrossRef] [PubMed]
- Xie, F.; Xiao, P.; Chen, D.; Xu, L.; Zhang, B. miRDeepFinder: A miRNA analysis tool for deep sequencing of plant small RNAs. Plant Mol. Biol. 2012, 80, 75–84. [Google Scholar] [CrossRef] [PubMed]
- Guerriero, G.; Legay, S.; Hausman, J.-F. Alfalfa cellulose synthase gene expression under abiotic stress: A hitchhiker’s guide to RT-qPCR normalization. PLoS ONE 2014, 9, e103808. [Google Scholar] [CrossRef] [PubMed]
- Hellemans, J.; Mortier, G.; de Paepe, A.; Speleman, F.; Vandesompele, J. qBase relative quantification framework and software for management and automated analysis of real-time quantitative PCR data. Genome Biol. 2007, 8, R19. [Google Scholar] [CrossRef] [PubMed]
- Guerriero, G.; Sergeant, K.; Hausman, J.-F. Integrated -omics: A powerful approach to understanding the heterogeneous lignification of fibre crops. Int. J. Mol. Sci. 2013, 14, 10958–10978. [Google Scholar] [CrossRef] [PubMed]
- Guerriero, G.; Sergeant, K.; Hausman, J.-F. Wood biosynthesis and typologies: A molecular rhapsody. Tree Physiol. 2014, 34, 839–855. [Google Scholar] [CrossRef] [PubMed]
- Mellerowicz, E.J.; Gorshkova, T.A. Tensional stress generation in gelatinous fibres: A review and possible mechanism based on cell-wall structure and composition. J. Exp. Bot. 2012, 63, 551–565. [Google Scholar] [CrossRef] [PubMed]
- Gorshkova, T.A.; Sal’nikov, V.V.; Chemikosova, S.B.; Ageeva, M.V.; Pavlencheva, N.V.; van Dam, J.E.G. The snap point: A transition point in Linum usitatissimum bast fiber development. Ind. Crops Prod. 2003, 18, 213–221. [Google Scholar] [CrossRef]
- Huis, R.; Hawkins, S.; Neutelings, G. Selection of reference genes for quantitative gene expression normalization in flax (Linum usitatissimum L.). BMC Plant Biol. 2010, 10, 71. [Google Scholar] [CrossRef] [PubMed]
- Niu, X.; Qi, J.; Chen, M.; Zhang, G.; Tao, A.; Fang, P.; Xu, J.; Onyedinma, S.A.; Su, J. Reference genes selection for transcript normalization in kenaf (Hibiscus cannabinus L.) under salinity and drought stress. PeerJ 2015, 3, e1347. [Google Scholar] [CrossRef] [PubMed]
- Niu, X.; Qi, J.; Zhang, G.; Xu, J.; Tao, A.; Fang, P.; Su, J. Selection of reliable reference genes for quantitative real-time PCR gene expression analysis in Jute (Corchorus capsularis) under stress treatments. Front. Plant Sci. 2015, 6, 848. [Google Scholar] [CrossRef] [PubMed]
- Guerriero, G.; Hausman, J.-F.; Strauss, J.; Ertan, H.; Siddiqui, K.S. Lignocellulosic biomass: Biosynthesis, degradation, and industrial utilization. Eng. Life Sci. 2016, 16, 1–16. [Google Scholar] [CrossRef]
- Silver, N.; Best, S.; Jiang, J.; Thein, S.L. Selection of housekeeping genes for gene expression studies in human reticulocytes using real-time PCR. BMC Mol. Biol. 2006, 7, 33. [Google Scholar] [CrossRef] [PubMed]
- Herrmann, K.M. The shikimate pathway as an entry to aromatic secondary metabolism. Plant Physiol. 1995, 107, 7–12. [Google Scholar] [CrossRef] [PubMed]
- Vanholme, R.; Storme, V.; Vanholme, B.; Sundin, L.; Christensen, J.H.; Goeminne, G.; Halpin, C.; Rohde, A.; Morreel, K.; Boerjan, W. A systems biology view of responses to lignin biosynthesis perturbations in Arabidopsis. Plant Cell 2012, 24, 3506–3529. [Google Scholar] [CrossRef] [PubMed]
- Tohge, T.; Watanabe, M.; Hoefgen, R.; Fernie, A.R. Shikimate and phenylalanine biosynthesis in the green lineage. Plant Metab. Chemodivers. 2013, 4, 62. [Google Scholar] [CrossRef] [PubMed]
- Chakraborty, A.; Sarkar, D.; Satya, P.; Karmakar, P.G.; Singh, N.K. Pathways associated with lignin biosynthesis in lignomaniac jute fibres. Mol. Genet. Genom. 2015, 290, 1523–1542. [Google Scholar] [CrossRef] [PubMed]
- Keith, B.; Dong, X.N.; Ausubel, F.M.; Fink, G.R. Differential induction of 3-deoxy-d-arabino-heptulosonate 7-phosphate synthase genes in Arabidopsis thaliana by wounding and pathogenic attack. Proc. Natl. Acad. Sci. USA 1991, 88, 8821–8825. [Google Scholar] [CrossRef] [PubMed]
- Moura, J.C.; Bonine, C.A.; de Oliveira Fernandes Viana, J.; Dornelas, M.C.; Mazzafera, P. Abiotic and biotic stresses and changes in the lignin content and composition in plants. J. Integr. Plant Biol. 2010, 52, 360–376. [Google Scholar] [CrossRef] [PubMed]
- Dieuaide-Noubhani, M.; Raffard, G.; Canioni, P.; Pradet, A.; Raymond, P. Quantification of compartmented metabolic fluxes in maize root tips using isotope distribution from 13C- or 14C-labeled glucose. J. Biol. Chem. 1995, 270, 13147–13159. [Google Scholar] [CrossRef] [PubMed]
- Caillau, M.; Paul Quick, W. New insights into plant transaldolase. Plant J. Cell Mol. Biol. 2005, 43, 1–16. [Google Scholar] [CrossRef] [PubMed]
- Guerriero, G.; Mangeot-Peter, L.; Hausman, J.-F.; Legay, S. Extraction of high quality RNA from Cannabis sativa bast fibres: A vademecum for molecular biologists. Fibers 2016, 4, 23. [Google Scholar] [CrossRef]
- Natsume, S.; Takagi, H.; Shiraishi, A.; Murata, J.; Toyonaga, H.; Patzak, J.; Takagi, M.; Yaegashi, H.; Uemura, A.; Mitsuoka, C.; et al. The draft genome of hop (Humulus lupulus), an essence for brewing. Plant Cell Physiol. 2015, 56, 428–441. [Google Scholar] [CrossRef] [PubMed]
- Van Bakel, H.; Stout, J.M.; Cote, A.G.; Tallon, C.M.; Sharpe, A.G.; Hughes, T.R.; Page, J.E. The draft genome and transcriptome of Cannabis sativa. Genome Biol. 2011, 12, R102. [Google Scholar] [CrossRef] [PubMed]
- Behr, M.; Legay, S.; Hausman, J.-F.; Guerriero, G. Analysis of cell wall-related genes in organs of Medicago sativa L. under different abiotic stresses. Int. J. Mol. Sci. 2015, 16, 16104–16124. [Google Scholar] [CrossRef] [PubMed]
- Esposito, S.; Guerriero, G.; Vona, V.; di Martino Rigano, V.; Carfagna, S.; Rigano, C. Glutamate synthase activities and protein changes in relation to nitrogen nutrition in barley: The dependence on different plastidic glucose-6P dehydrogenase isoforms. J. Exp. Bot. 2005, 56, 55–64. [Google Scholar] [CrossRef] [PubMed]
- Cardi, M.; Castiglia, D.; Ferrara, M.; Guerriero, G.; Chiurazzi, M.; Esposito, S. The effects of salt stress cause a diversion of basal metabolism in barley roots: Possible different roles for glucose-6-phosphate dehydrogenase isoforms. Plant Physiol. Biochem. 2015, 86, 44–54. [Google Scholar] [CrossRef] [PubMed]
- Castiglia, D.; Cardi, M.; Landi, S.; Cafasso, D.; Esposito, S. Expression and characterization of a cytosolic glucose 6 phosphate dehydrogenase isoform from barley (Hordeum vulgare) roots. Protein Expr. Purif. 2015, 112, 8–14. [Google Scholar] [CrossRef] [PubMed]
- Landi, S.; Nurcato, R.; de Lillo, A.; Lentini, M.; Grillo, S.; Esposito, S. Glucose-6-phosphate dehydrogenase plays a central role in the response of tomato (Solanum lycopersicum) plants to short and long-term drought. Plant Physiol. Biochem. 2016, 105, 79–89. [Google Scholar] [CrossRef] [PubMed]

| Name | Sequence (5′→3′) | Amplicon Length (bp) | Amplicon Tm (°C) | PCR Efficiency (%) | Regression Coefficient (R2) |
|---|---|---|---|---|---|
| ActinFwd | TTGCTGGTCGTGATCTTACTG | 148 | 83 | 90.8 | 0.993 |
| ActinRev | GTCTCCATCTCCTGCTCAAAG | ||||
| eTIF4EFwd | AGTGGGAAGATCCTGAATGTGC | 150 | 81 | 95.1 | 0.997 |
| eTIF4ERev | TTGCGACCACACCACAAATC | ||||
| EF2Fwd | ACGCAACAGCTATCAGGAAC | 113 | 80.3 | 92.3 | 0.998 |
| EF2Rev | TGCAAAGACACGACCAAAGG | ||||
| GAPDHFwd | AATCGCAACCCAAACTCTGC | 123 | 81.1 | 99.4 | 0.995 |
| GAPDHRev | AGTGGCCGTTGCTTTAATGG | ||||
| CycloFwd | ACAACATGTCGAACCCCAAG | 106 | 81.4 | 93.8 | 0.998 |
| CycloRev | TCAGCGGTTTTTGGCGTAAC | ||||
| RANFwd | TTTGGAGACTTCAGCACTGG | 129 | 81.8 | 97.8 | 0.998 |
| RANRev | GCAGGGTTACCATTTCCTTG | ||||
| F-boxFwd | TATCGGCGGAGAGATTTGAG | 77 | 78.4 | 99.5 | 0.975 |
| F-boxRev | TAAGCCCTTCCCTTGATTCC | ||||
| ClathrinFwd | TGTCAGTTTTGTGCCACCAG | 139 | 80.3 | 98.3 | 0.998 |
| ClathrinRev | TCCATGCGTGTTCTACCAAG | ||||
| Histone3Fwd | TGAAGAAGCCTCATCGGTTC | 127 | 82.9 | 96.1 | 0.998 |
| Histone3Rev | TCTTGAGCGATTTCCCTGAC | ||||
| TIP41Fwd | TGAACAGTGGGGAGAAAAGC | 144 | 80.3 | 100.2 | 0.989 |
| TIP41Rev | GCTTCCTGTTTCCATCCAAG | ||||
| TubulinFwd | ATAACTGTACTGGGCTTCAAGG | 110 | 84 | 97.5 | 0.999 |
| TubulinRev | CCTGTGGAGATGGGTAAACTG | ||||
| CDPKFwd | GGTGGCTTTGCTTCTCTTTG | 86 | 78.7 | 97 | 0.986 |
| CDPKRev | GTCAAACCCCTTTTCACACC | ||||
| TA1Fwd | TTCGAGAAGTTCCCTCCAAC | 118 | 81.5 | 92.8 | 0.999 |
| TA1Rev | AGCCATATCCACAGCATTCC | ||||
| TA2Fwd | CTAGCAACCCAGCGATTTTC | 126 | 81.3 | 97 | 0.998 |
| TA2Rev | ACCACAAGCTCCCAATATGC | ||||
| DHS1Fwd | TGAGACTTTCCCTCCGATTG | 144 | 84.6 | 96.8 | 0.998 |
| DHS1Rev | TCAGCACAATCTCCACCTTG | ||||
| DHS2Fwd | TATCAAGGCTGTTCGTGGAG | 129 | 81.8 | 103 | 0.997 |
| DHS2Rev | AGGTGCTTTGATGGTGTTCC |
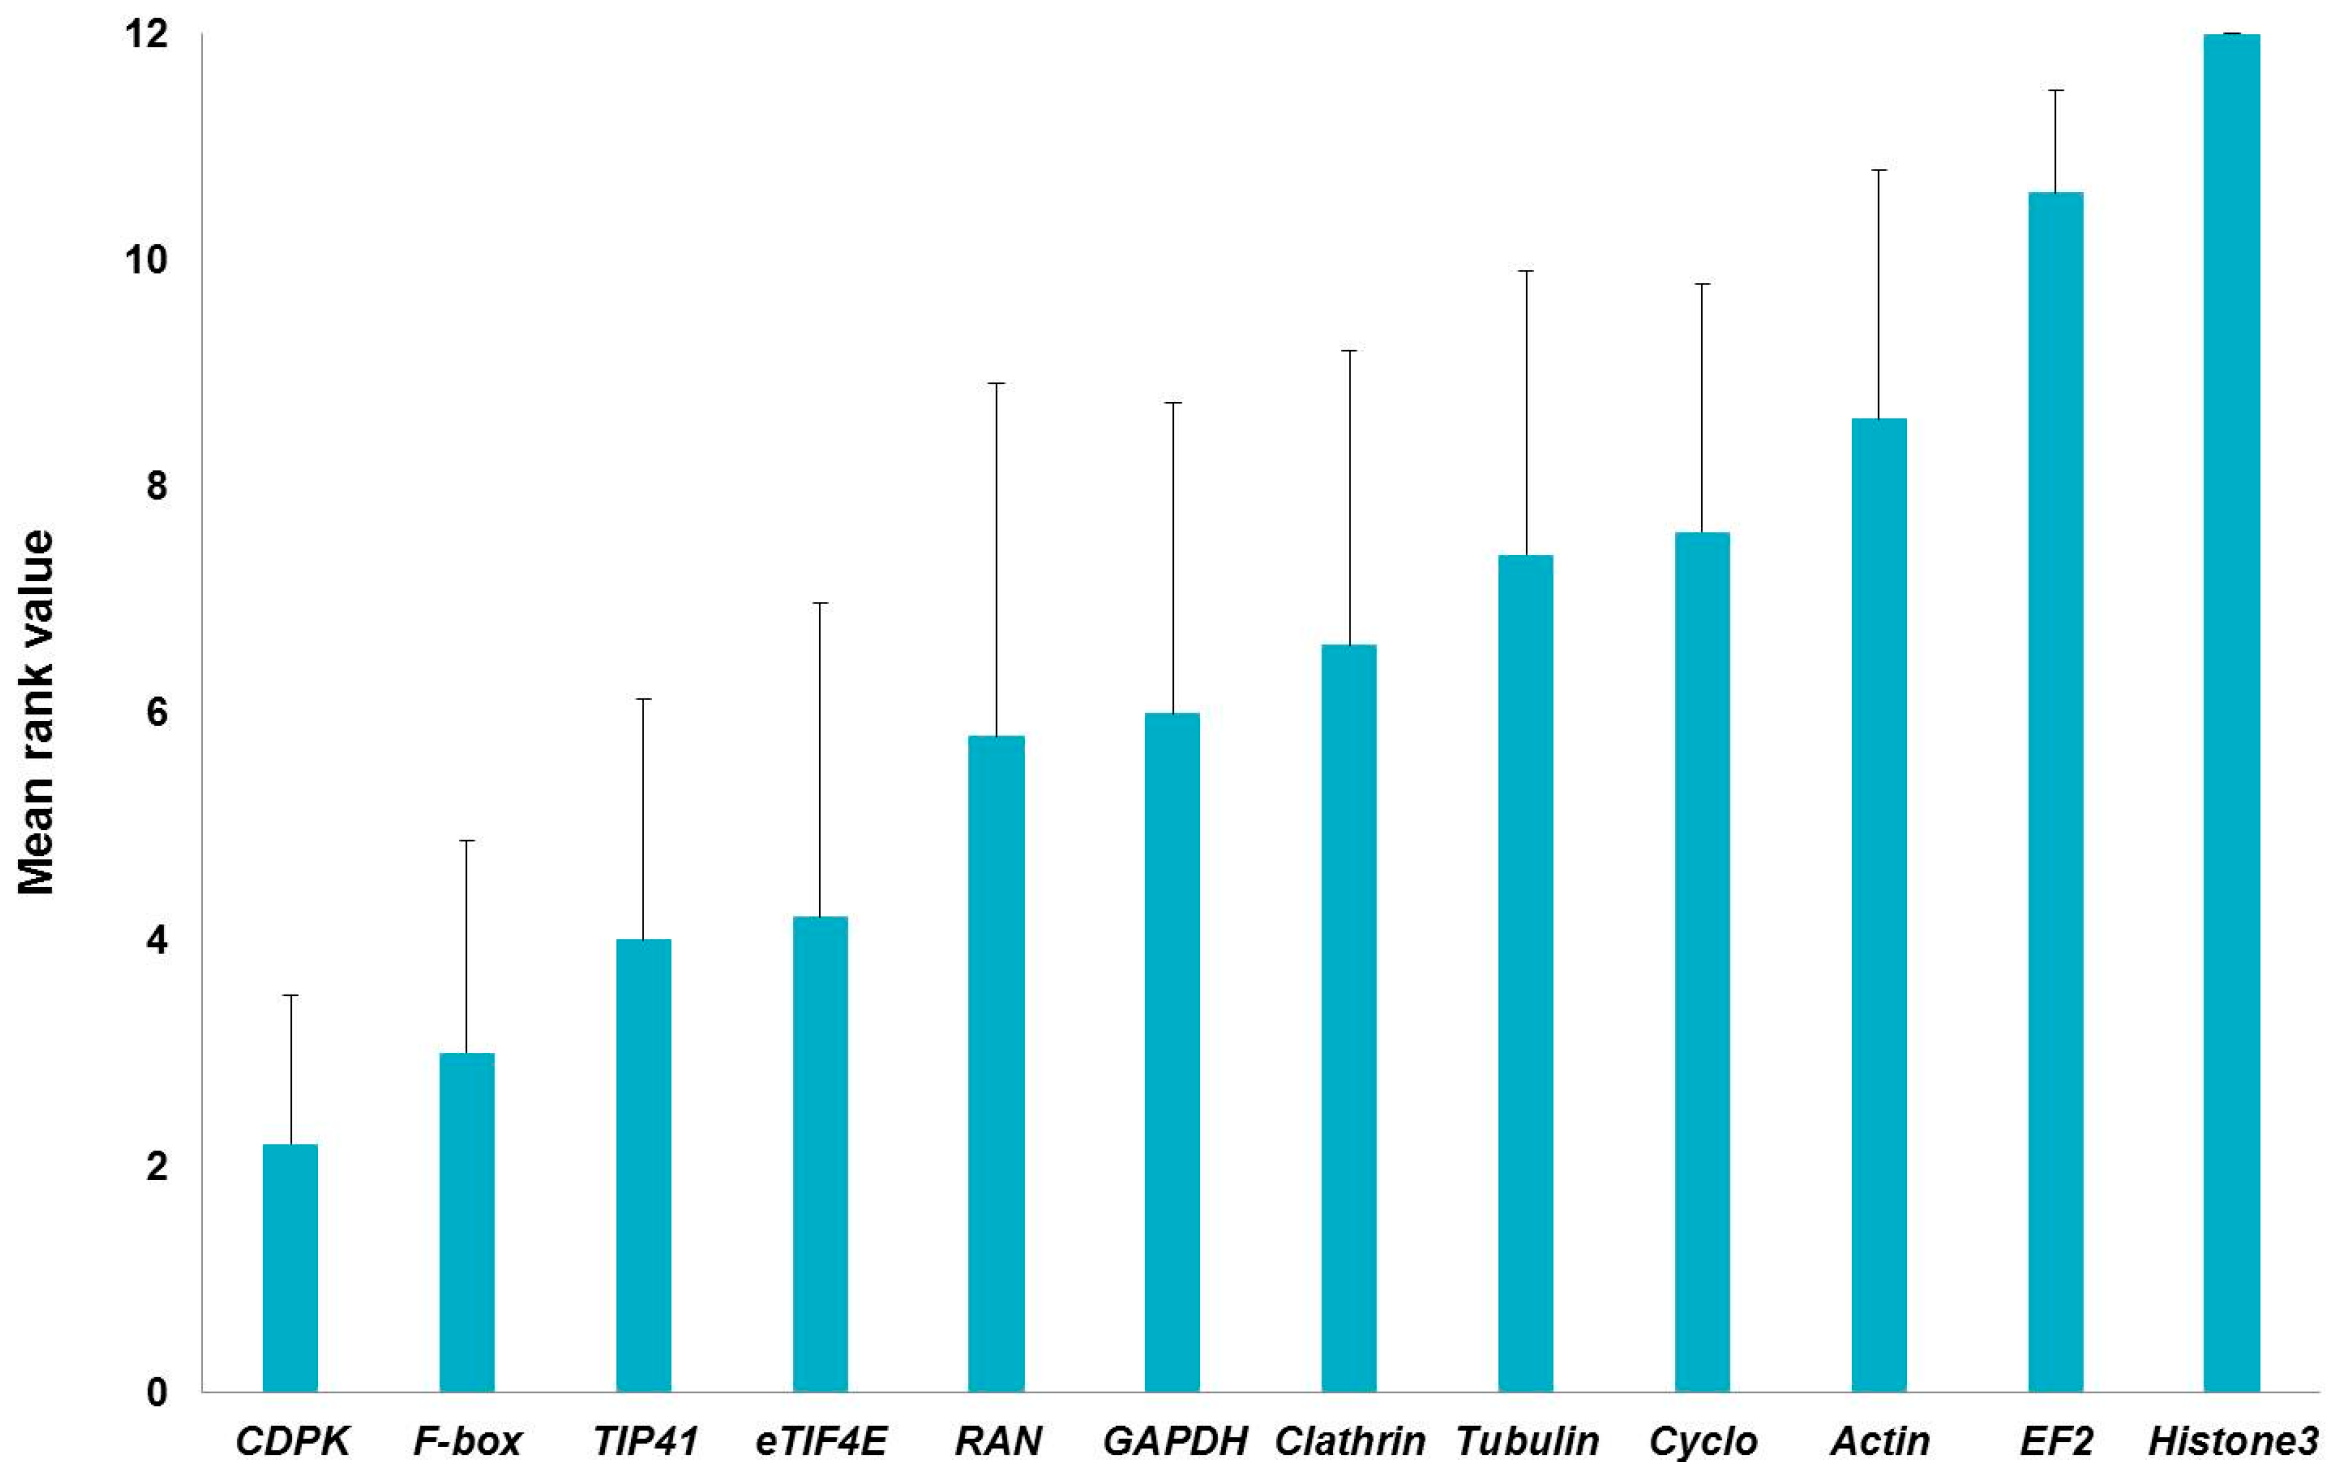
| GeNormPLUS | NormFinder | BestKeeper | Comparative delta-Ct | RefFinder | |||||
|---|---|---|---|---|---|---|---|---|---|
| Gene | Stability Coeff. | Gene | Stability Coeff. | Gene | Stability Coeff. | Gene | Stability Coeff. | Gene | Stability Coeff. |
| Histone3 | 1.22 | Histone3 | 0.812 | Histone3 | 1.58 | Histone3 | 1.678 | Histone3 | 12 |
| EF2 | 1.135 | EF2 | 0.743 | RAN | 1.085 | EF2 | 1.549 | EF2 | 10.462 |
| Actin | 1.061 | Tubulin | 0.579 | Tubulin | 1.059 | Actin | 1.343 | Actin | 8.409 |
| Cyclo | 1.028 | Cyclo | 0.523 | EF2 | 0.926 | GAPDH | 1.335 | Cyclo | 6.701 |
| GAPDH | 0.959 | Actin | 0.518 | Clathrin | 0.926 | Clathrin | 1.33 | Clathrin | 6.447 |
| eTIF4E | 0.857 | Clathrin | 0.504 | eTIF4E | 0.888 | Cyclo | 1.319 | Tubulin | 5.948 |
| TIP41 | 0.798 | TIP41 | 0.502 | F-box | 0.885 | RAN | 1.302 | GAPDH | 5.635 |
| Tubulin | 0.703 | GAPDH | 0.462 | Actin | 0.87 | Tubulin | 1.299 | RAN | 4.461 |
| CDPK | 0.599 | RAN | 0.453 | Cyclo | 0.718 | TIP41 | 1.241 | eTIF4E | 3.742 |
| RAN | 0.503 | Fbox | 0.452 | CDPK | 0.699 | F-box | 1.234 | TIP41 | 2.913 |
| Clathrin | 0.47 | CDPK | 0.272 | GAPDH | 0.681 | eTIF4E | 1.155 | F-box | 2.913 |
| F-box | 0.45 | eTIF4E | 0.257 | TIP41 | 0.601 | CDPK | 1.091 | CDPK | 1.861 |
© 2016 by the authors; licensee MDPI, Basel, Switzerland. This article is an open access article distributed under the terms and conditions of the Creative Commons Attribution (CC-BY) license (http://creativecommons.org/licenses/by/4.0/).
Share and Cite
Mangeot-Peter, L.; Legay, S.; Hausman, J.-F.; Esposito, S.; Guerriero, G. Identification of Reference Genes for RT-qPCR Data Normalization in Cannabis sativa Stem Tissues. Int. J. Mol. Sci. 2016, 17, 1556. https://doi.org/10.3390/ijms17091556
Mangeot-Peter L, Legay S, Hausman J-F, Esposito S, Guerriero G. Identification of Reference Genes for RT-qPCR Data Normalization in Cannabis sativa Stem Tissues. International Journal of Molecular Sciences. 2016; 17(9):1556. https://doi.org/10.3390/ijms17091556
Chicago/Turabian StyleMangeot-Peter, Lauralie, Sylvain Legay, Jean-Francois Hausman, Sergio Esposito, and Gea Guerriero. 2016. "Identification of Reference Genes for RT-qPCR Data Normalization in Cannabis sativa Stem Tissues" International Journal of Molecular Sciences 17, no. 9: 1556. https://doi.org/10.3390/ijms17091556
APA StyleMangeot-Peter, L., Legay, S., Hausman, J.-F., Esposito, S., & Guerriero, G. (2016). Identification of Reference Genes for RT-qPCR Data Normalization in Cannabis sativa Stem Tissues. International Journal of Molecular Sciences, 17(9), 1556. https://doi.org/10.3390/ijms17091556