
A Protocol to Enhance INS1E and MIN6 Functionality—The Use of Theophylline


Abstract
:
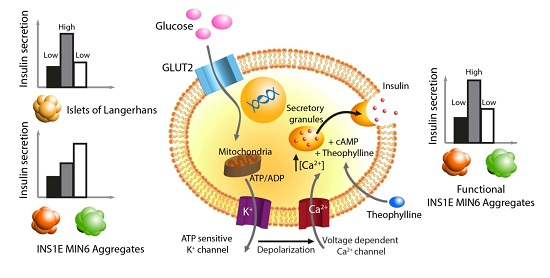
1. Introduction
2. Results
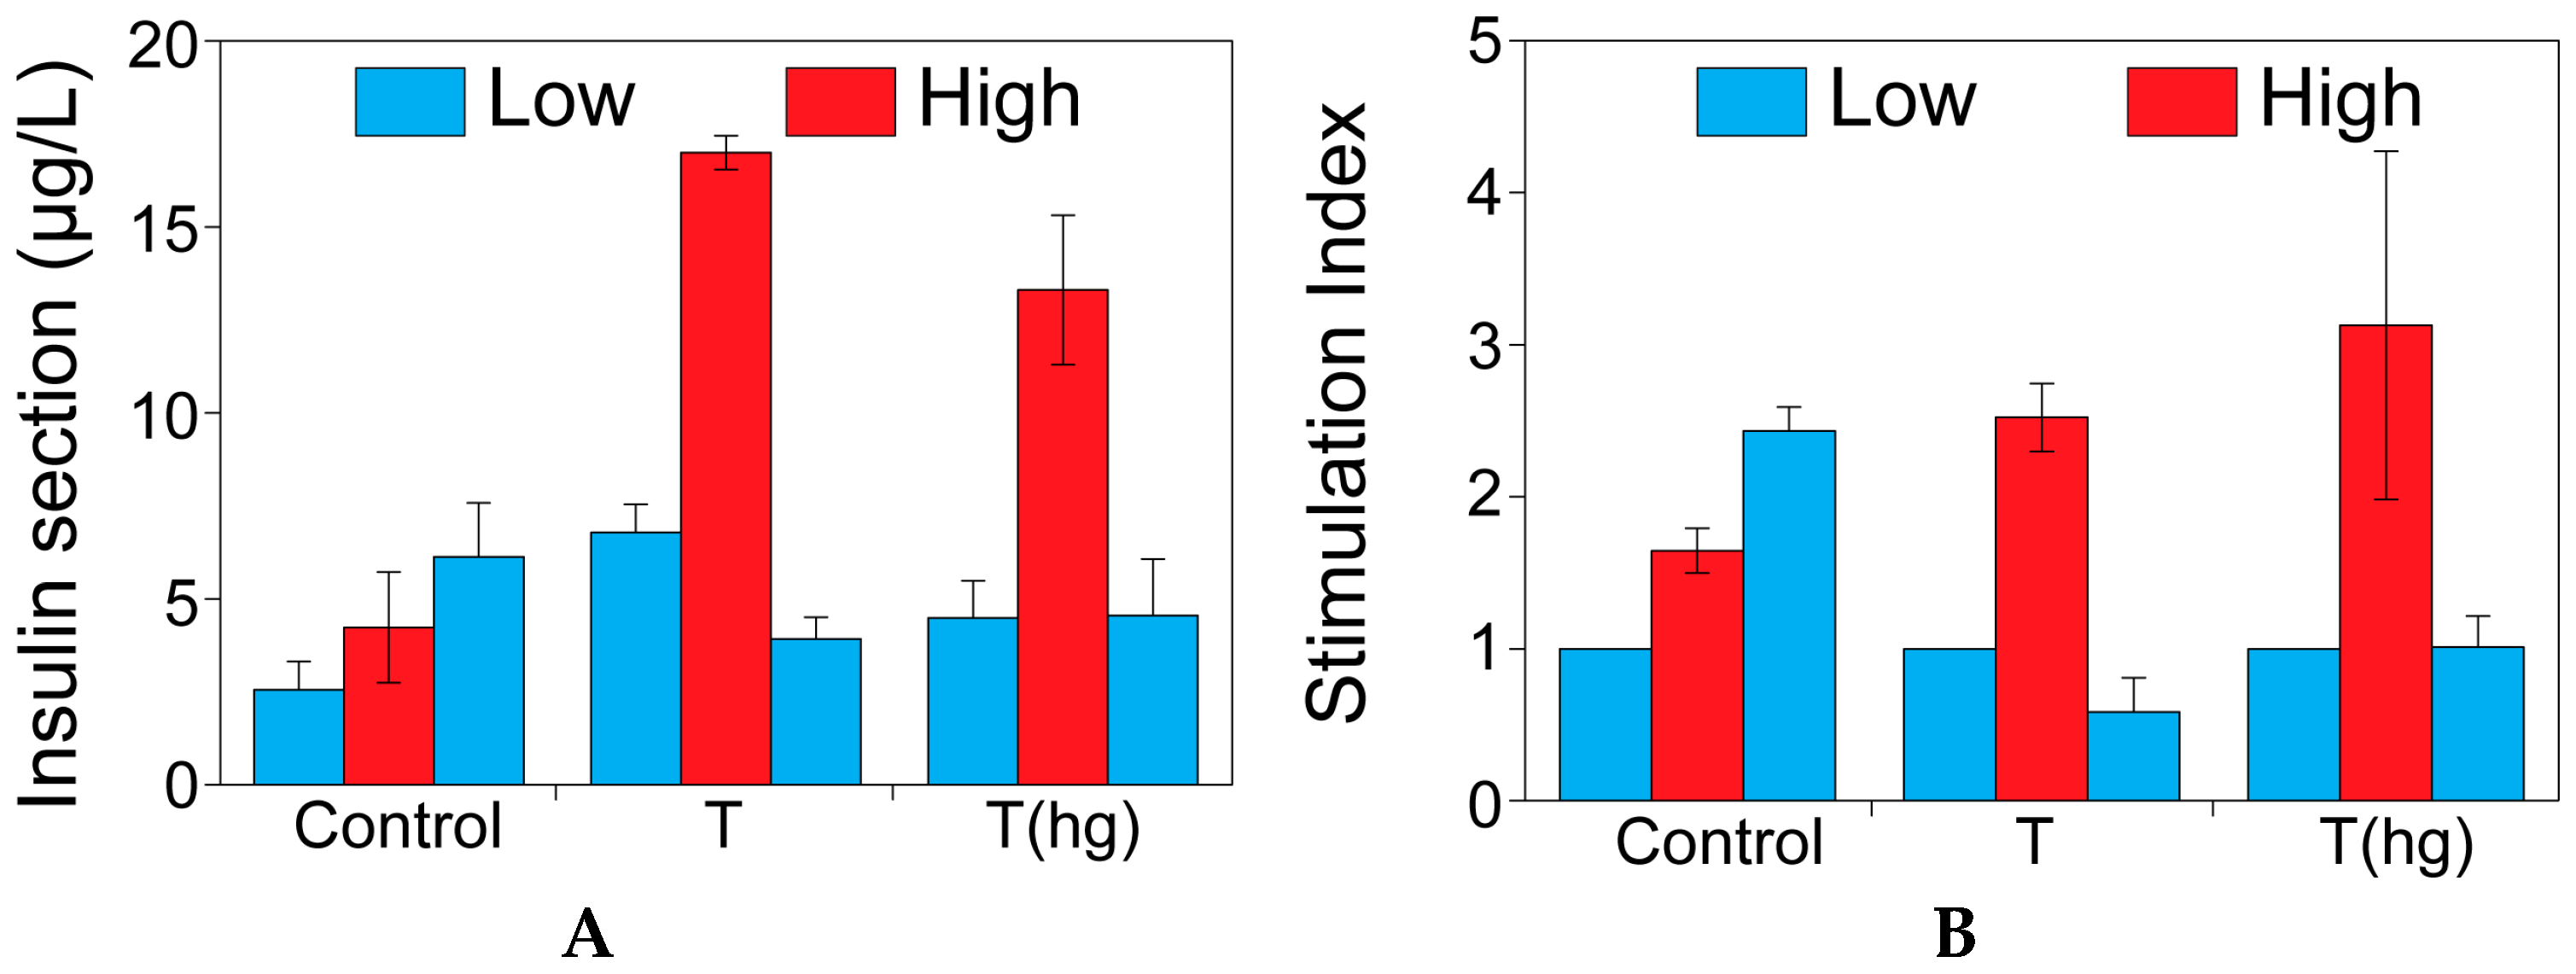
2.1. The Effect of Theophylline on Insulin Secretion
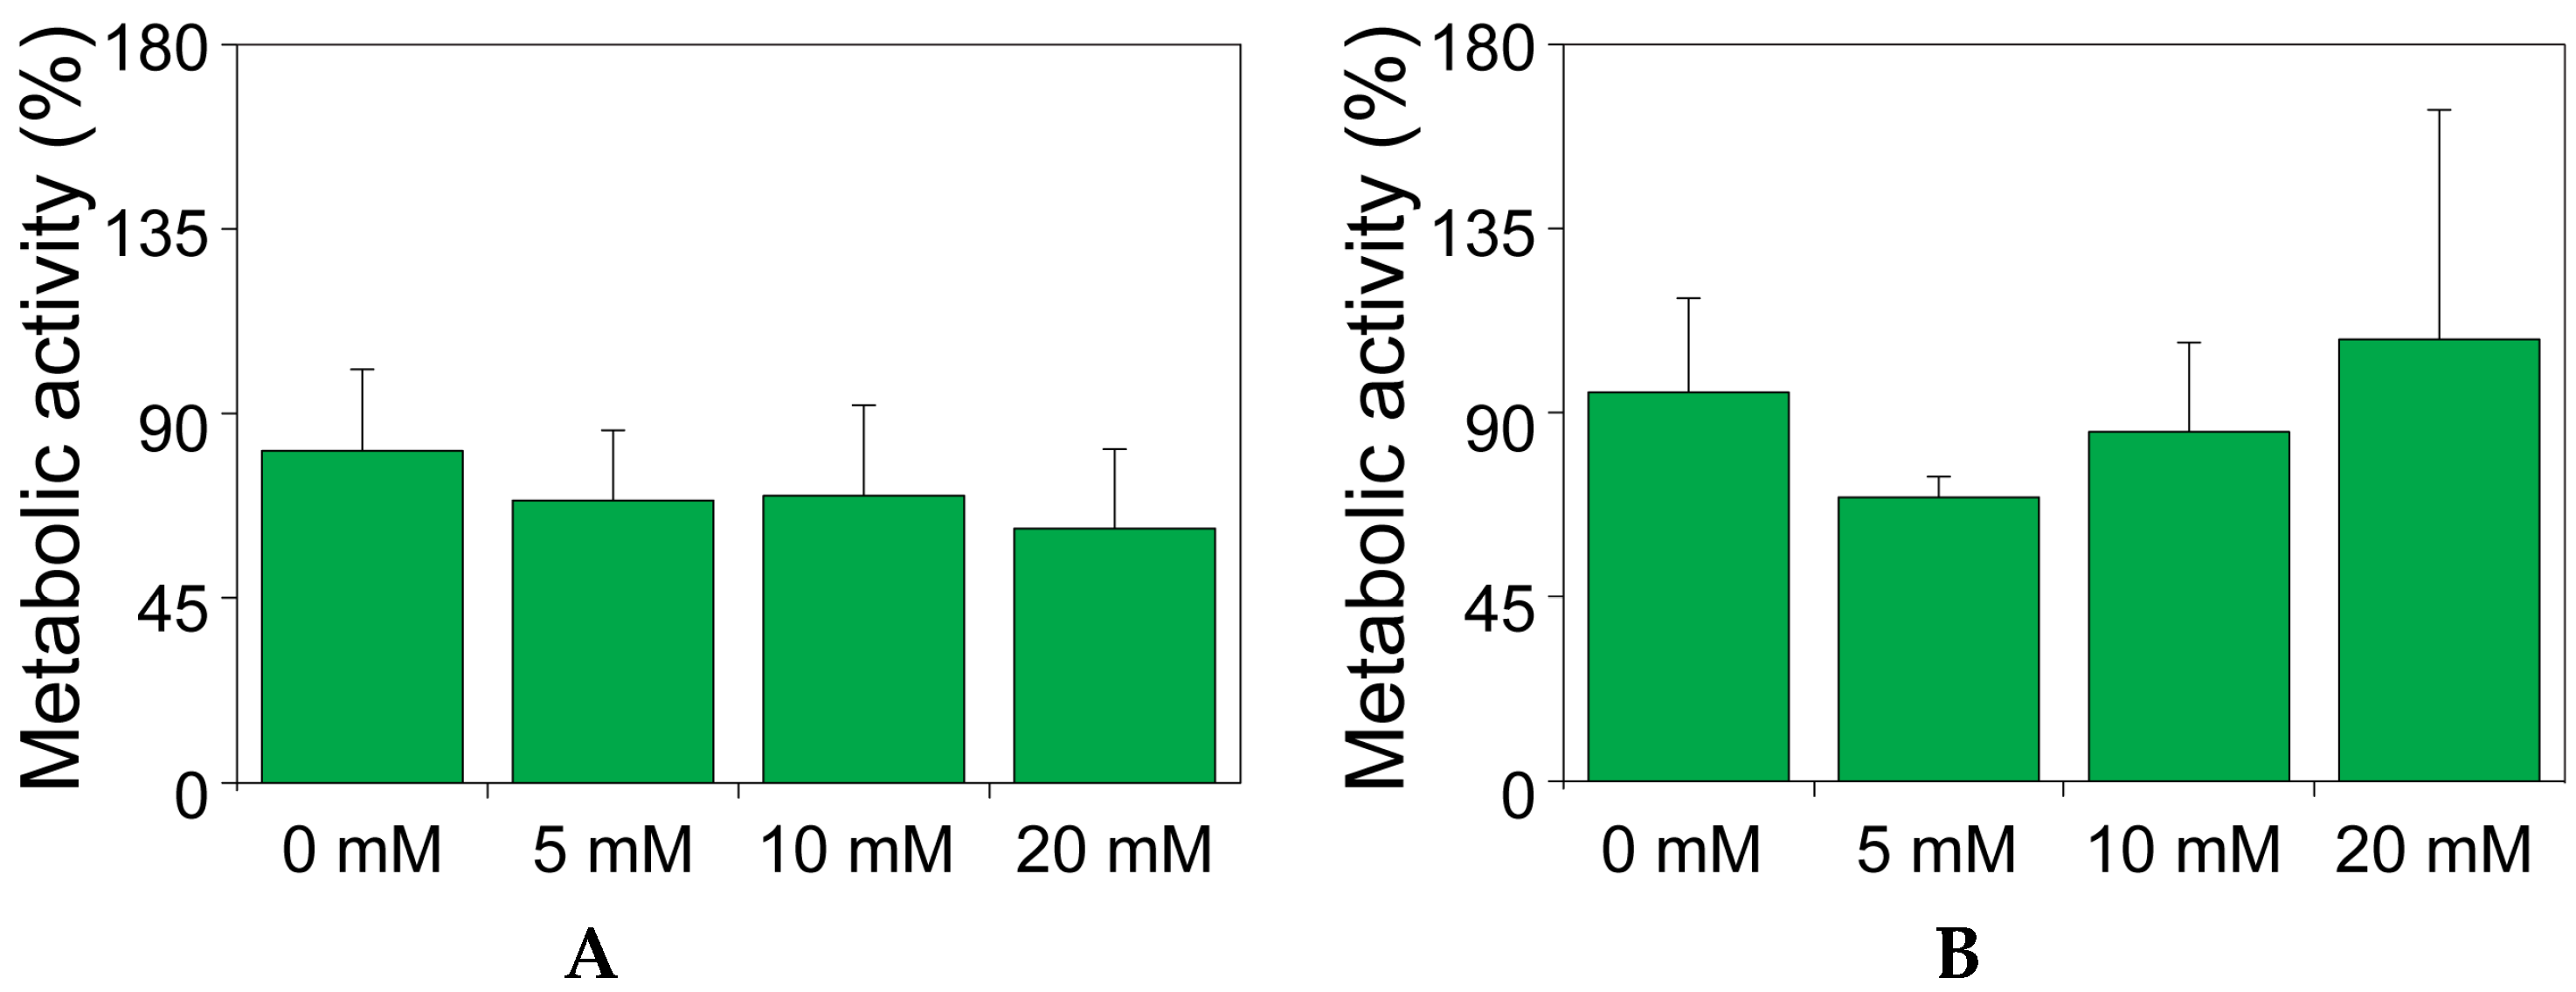
2.2. The Effect of Theophylline on the Metabolic Activity of MIN6 and INS1E Cells
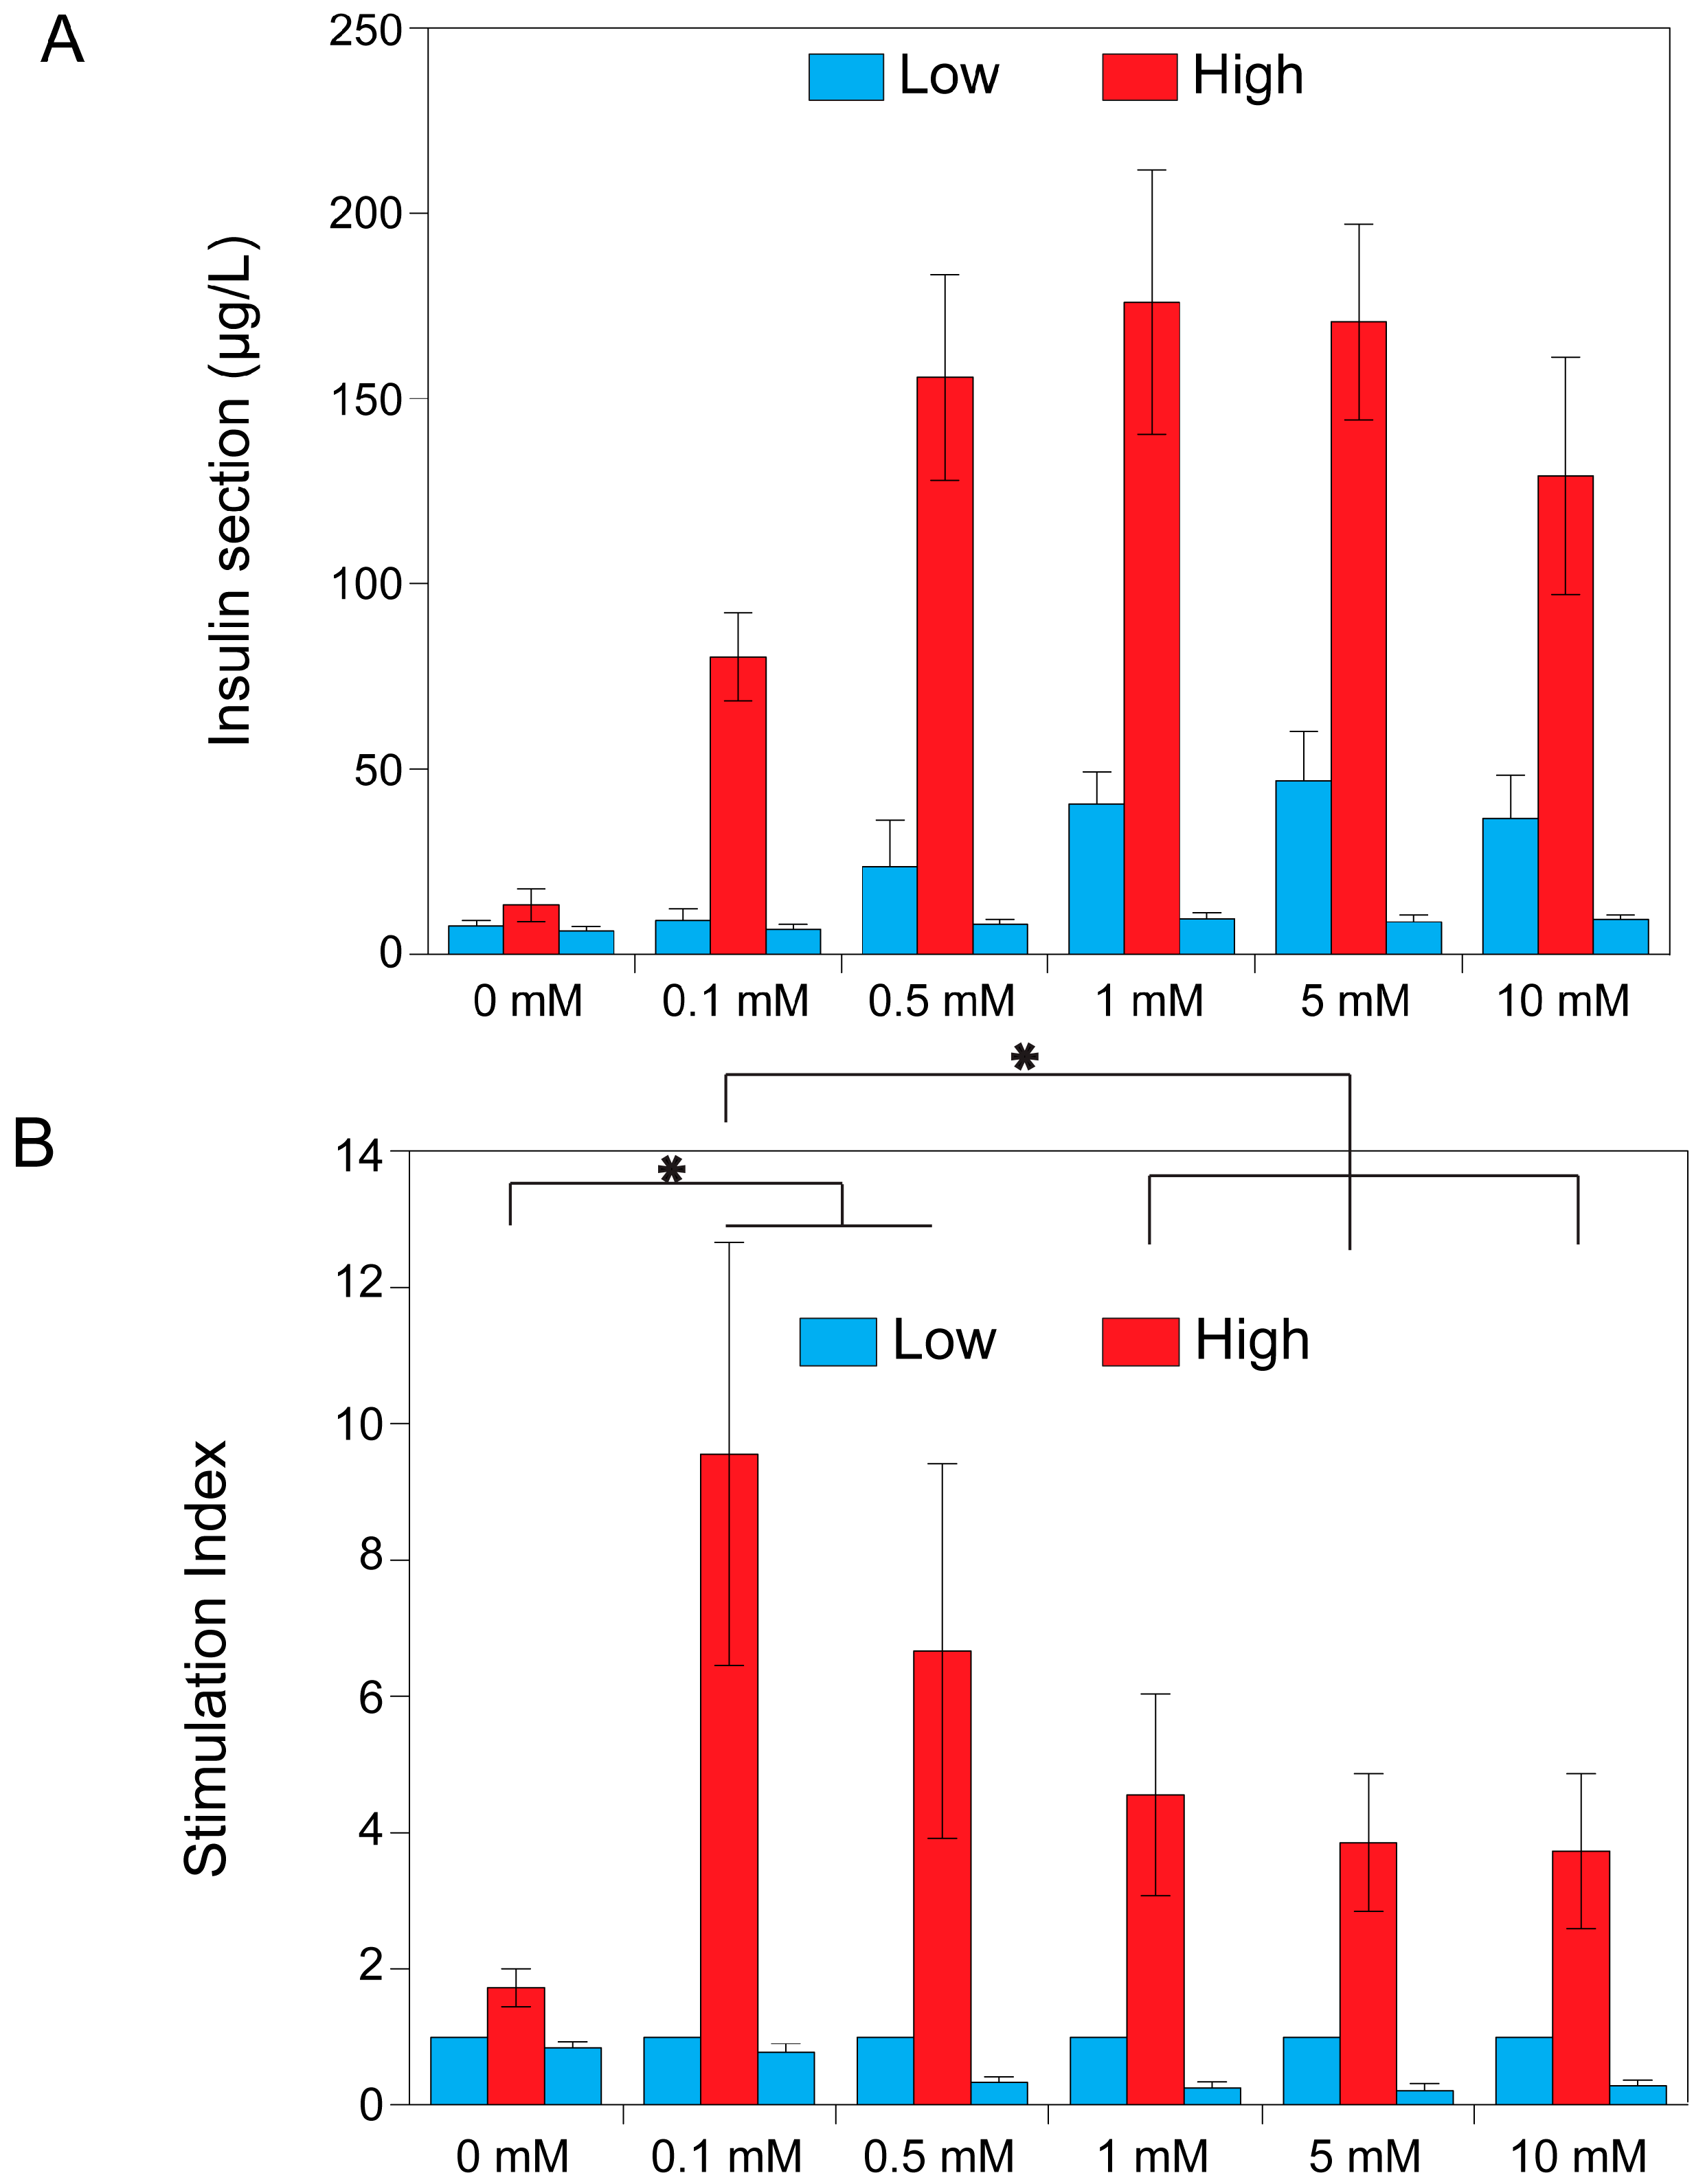
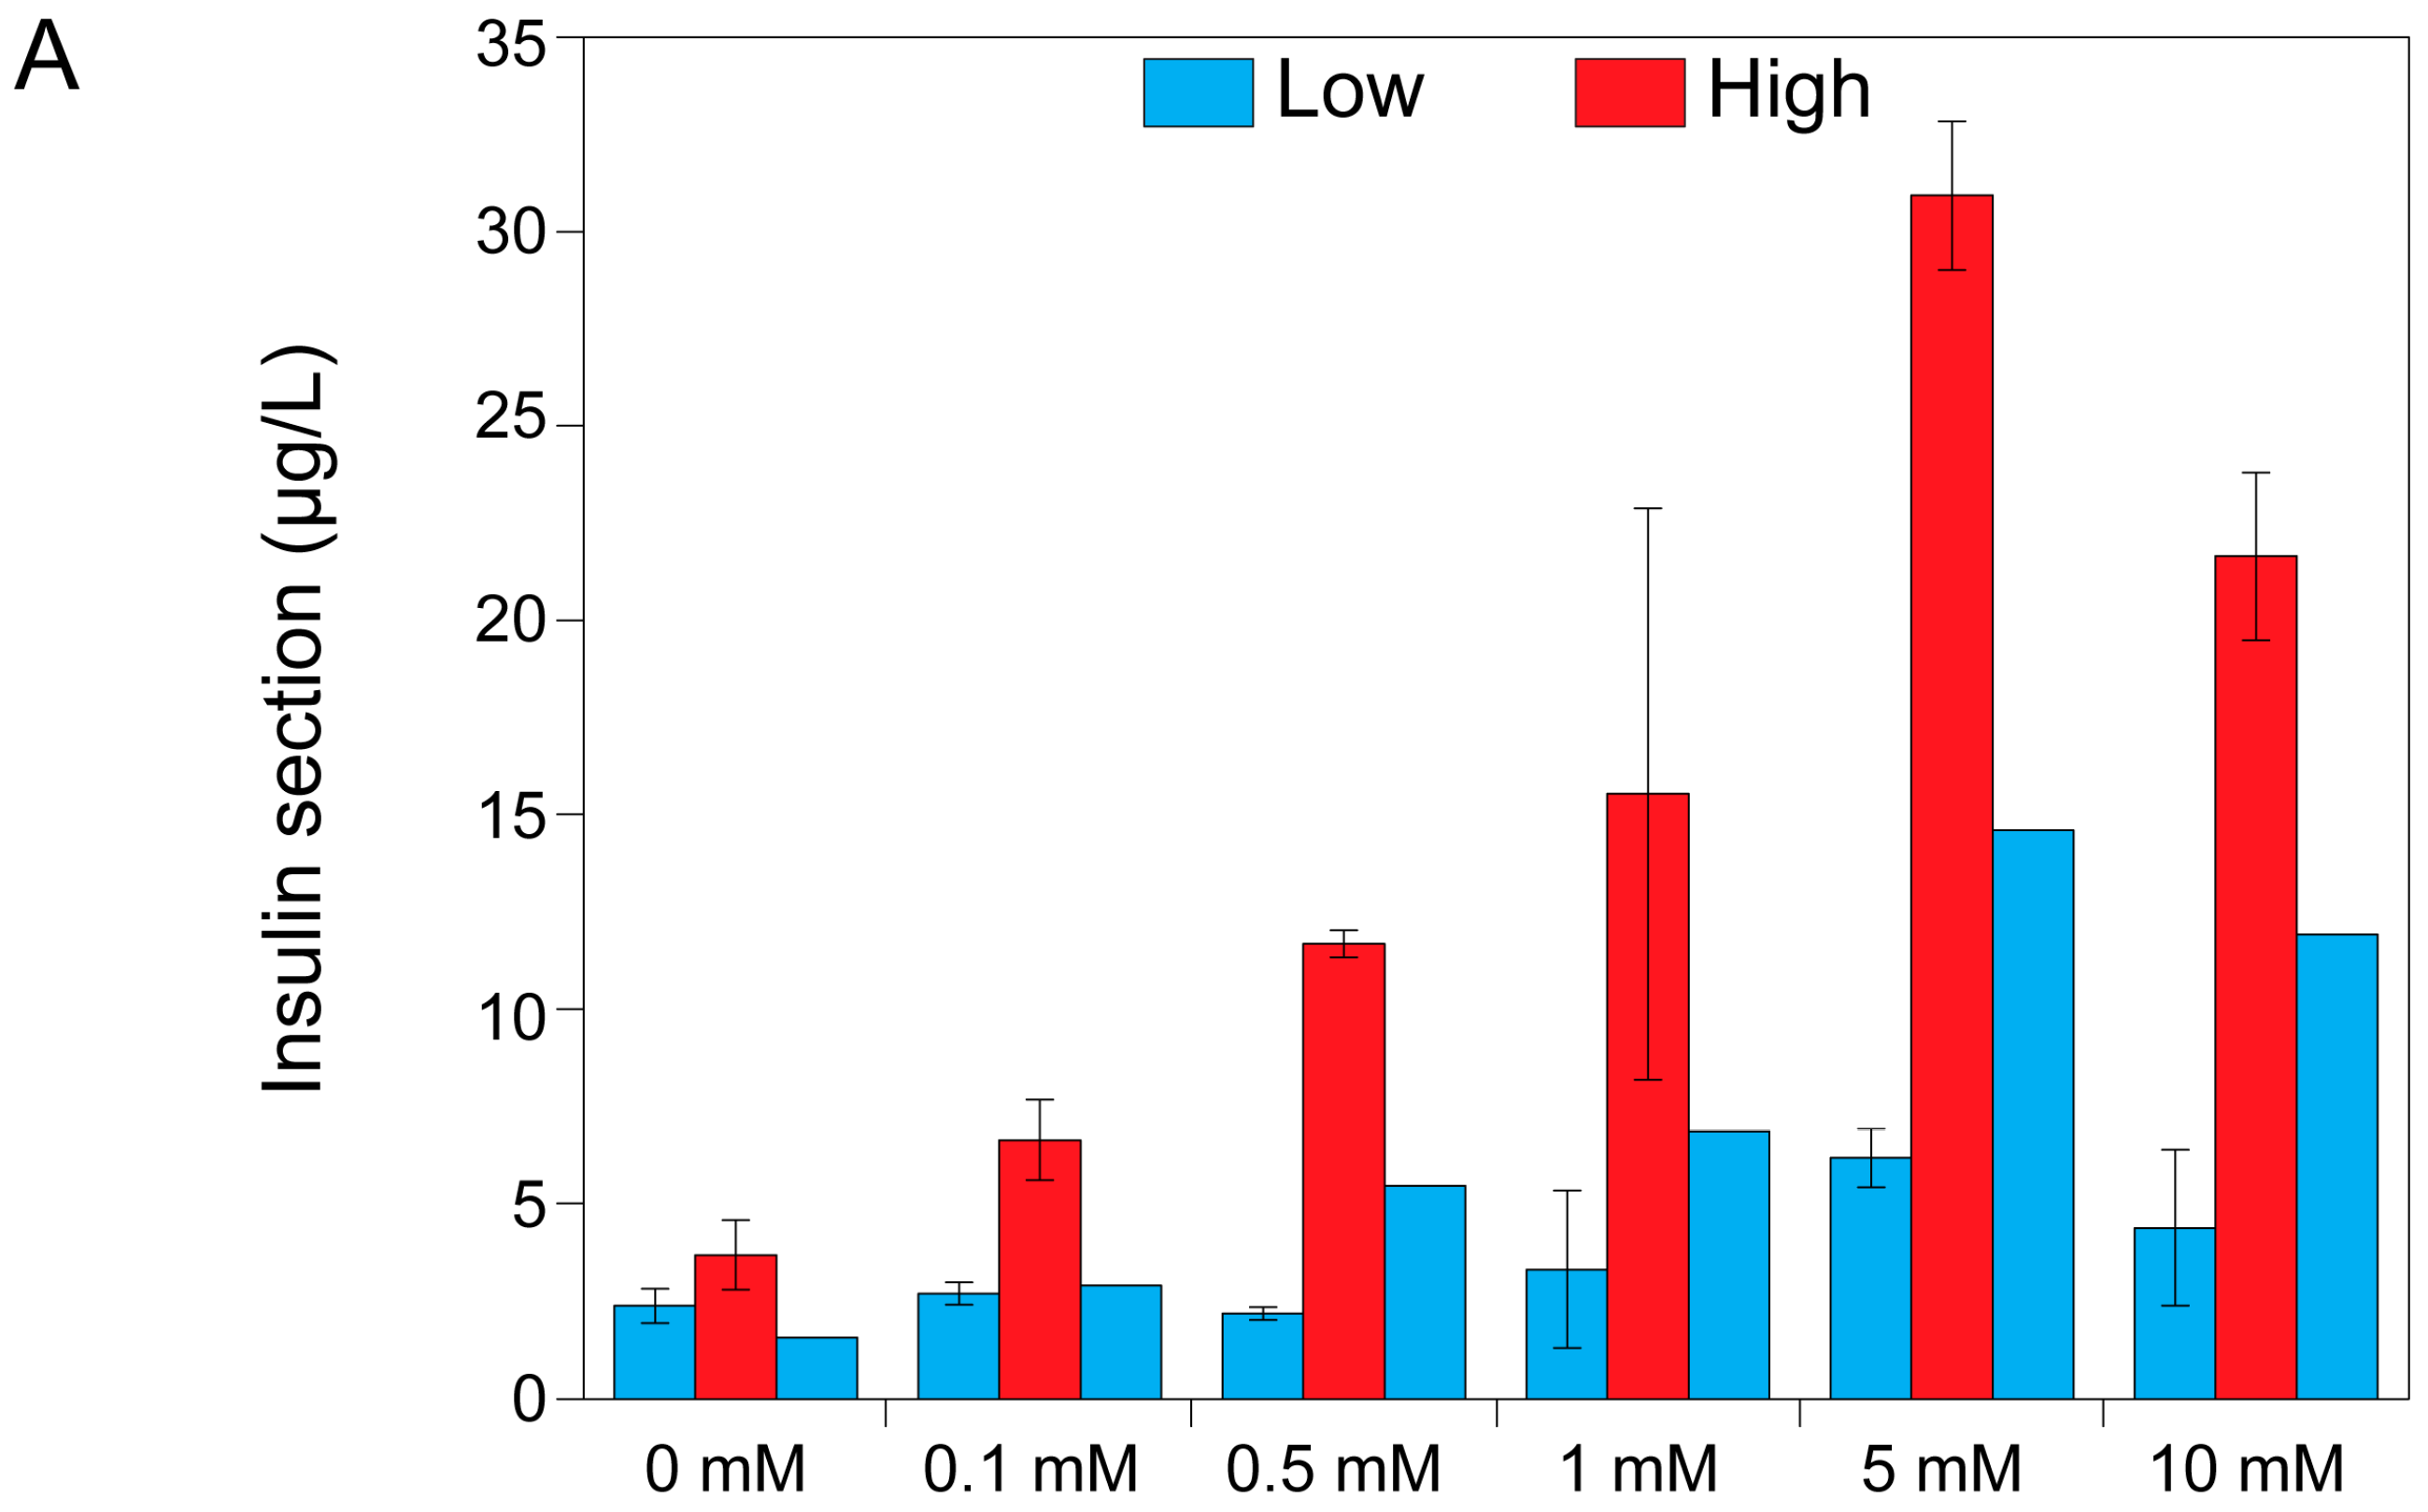
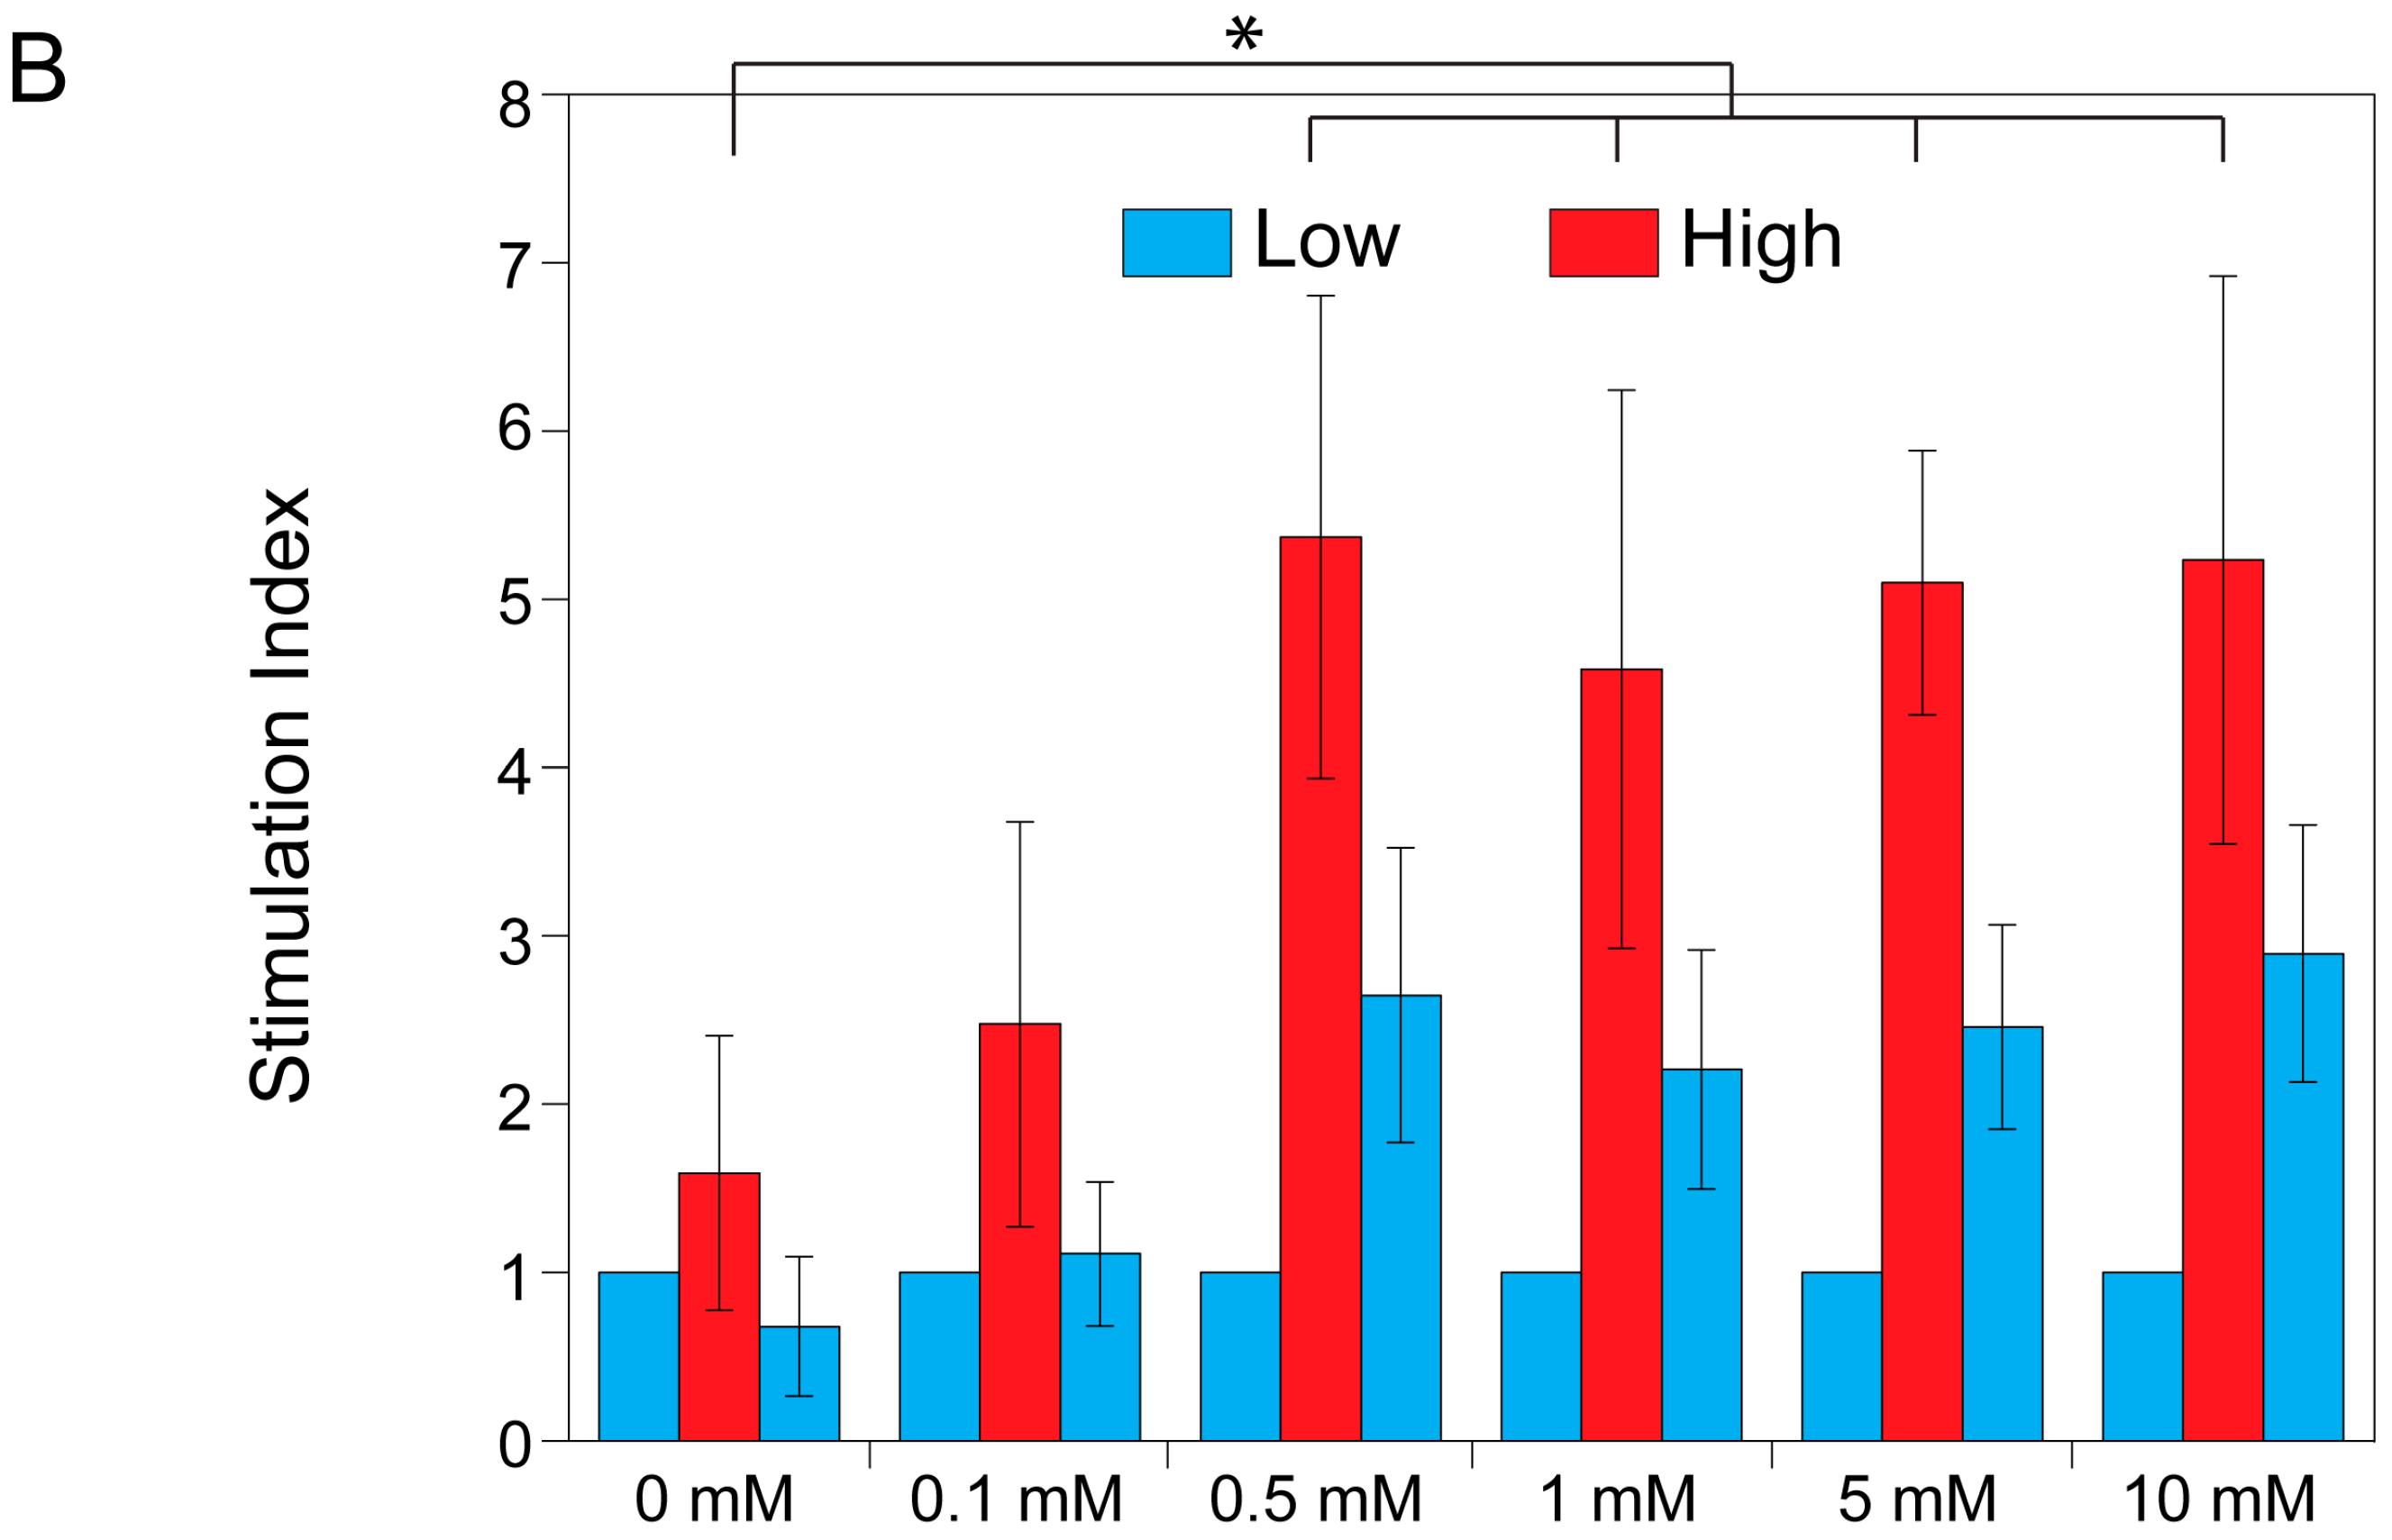
2.3. Theophylline Concentration-Dependent Insulin Secretion of MIN6 and INS1E Pseudo-Islets
3. Discussion
4. Materials and Methods
4.1. Cell Culture
4.2. Agarose Microwell Fabrication and Controlled Pseudo-Islet Formation
4.3. Glucose Induced Insulin Secretion Test
4.4. The Effect of Theophylline on Insulin Secretion
4.5. The Effect of Theophylline on the Metabolic Activity of MIN6 and INS1E Cells
4.6. Theophylline Concentration-Dependent Insulin Secretion of MIN6 and INS1E Pseudo-Islets
4.7. Statistical Analysis
Acknowledgments
Author Contributions
Conflicts of Interest
References
- Skelin, M.; Rupnik, M.; Cencic, A. Pancreatic β cell lines and their applications in diabetes mellitus research. ALTEX 2010, 27, 105–113. [Google Scholar] [PubMed]
- Hauge-Evans, A.C.; Squires, P.E.; Persaud, S.J.; Jones, P.M. Pancreatic β-cell-to-β-cell interactions are required for integrated responses to nutrient stimuli: Enhanced Ca2+ and insulin secretory responses of MIN6 pseudoislets. Diabetes 1999, 48, 1402–1408. [Google Scholar] [CrossRef] [PubMed]
- Chowdhury, A.; Satagopam, V.P.; Manukyan, L.; Artemenko, K.A.; Fung, Y.M.E.; Schneider, R.; Bergquist, J.; Bergsten, P. Signaling in insulin-secreting MIN6 pseudoislets and monolayer cells. J. Proteome Res. 2013, 12, 5954–5962. [Google Scholar] [CrossRef] [PubMed]
- Weber, L.M.; Anseth, K.S. Hydrogel encapsulation environments functionalized with extracellular matrix interactions increase islet insulin secretion. Matrix Biol. 2008, 27, 667–673. [Google Scholar] [CrossRef] [PubMed]
- Poy, M.N.; Eliasson, L.; Krutzfeldt, J.; Kuwajima, S.; Ma, X.; MacDonald, P.E.; Pfeffer, S.; Tuschl, T.; Rajewsky, N.; Rorsman, P.; et al. A pancreatic islet-specific microRNA regulates insulin secretion. Nature 2004, 432, 226–230. [Google Scholar] [CrossRef] [PubMed]
- Vetterli, L.; Brun, T.; Giovannoni, L.; Bosco, D.; Maechler, P. Resveratrol potentiates glucose-stimulated insulin secretion in INS-1E β-cells and human islets through a SIRT1-dependent mechanism. J. Biol. Chem. 2011, 286, 6049–6060. [Google Scholar] [CrossRef] [PubMed]
- Benhamou, P.Y.; Oberholzer, J.; Toso, C.; Kessler, L.; Penfornis, A.; Bayle, F.; Thivolet, C.; Martin, X.; Ris, F.; Badet, L.; et al. Human islet transplantation network for the treatment of type I diabetes: First data from the Swiss-French GRAGIL consortium (1999–2000). Diabetologia 2001, 44, 859–864. [Google Scholar] [PubMed]
- Weinhaus, A.J.; Poronnik, P.; Cook, D.I.; Tuch, B.E. Insulin secretagogues, but not glucose, stimulate an increase in [Ca2+]i in the fetal rat β-cell. Diabetes 1995, 44, 118–124. [Google Scholar] [CrossRef] [PubMed]
- Korbutt, G.S.; Elliott, J.F.; Ao, Z.; Smith, D.K.; Warnock, G.L.; Rajotte, R.V. Large scale isolation, growth, and function of porcine neonatal islet cells. J. Clin. Investig. 1996, 97, 2119–2129. [Google Scholar] [CrossRef] [PubMed]
- Otonkoski, T.; Ustinov, J.; Rasilainen, S.; Kallio, E.; Korsgren, O.; Häyry, P. Differentiation and maturation of porcine fetal islet cells in vitro and after transplantation. Transplantation 1999, 68, 1674–1683. [Google Scholar] [CrossRef] [PubMed]
- Korsgren, O.; Andersson, A.; Sandler, S. In vitro screening of putative compounds inducing fetal porcine pancreatic β-cell differentiation: Implications for cell transplantation in insulin-dependent diabetes mellitus. Upsala J. Med. Sci. 1993, 98, 39–52. [Google Scholar] [CrossRef] [PubMed]
- Charles, M.A.; Lawecki, J.; Pictet, R.; Grodsky, G.M. Insulin secretion. Interrelationships of glucose, cyclic adenosine, 3:5 monophosphate, and calcium. J. Biol. Chem. 1975, 250, 6134–6140. [Google Scholar] [PubMed]
- Hvidberg, A.; Rosenfalck, A.; Christensen, N.J.; Hilsted, J. Long-term administration of theophylline and glucose recovery after hypoglycaemia in patients with type I diabetes mellitus. Diabet. Med. 1998, 15, 608–614. [Google Scholar] [CrossRef]
- Murray, H.E.; Paget, M.B.; Downing, R. Preservation of glucose responsiveness in human islets maintained in a rotational cell culture system. Mol. Cell. Endocrinol. 2005, 238, 39–49. [Google Scholar] [CrossRef] [PubMed]
- Hoffman, L.; Mandel, T.E.; Carter, W.M.; Koulmanda, M.; Martin, F.I.R. Insulin secretion by fetal human pancreas in organ culture. Diabetologia 1982, 23, 426–430. [Google Scholar] [CrossRef] [PubMed]
- Brisson, G.R.; Malaisse-Lagae, F.; Malaisse, W.J. The stimulus-secretion coupling of glucose-induced insulin release. VII. A proposed site of action for adenosine-3′,5′-cyclic monophosphate. J. Clin. Investig. 1972, 51, 232–241. [Google Scholar] [CrossRef] [PubMed]
- Tuch, B.E.; Osgerby, K.J.; Turtle, J.R. The role of calcium in insulin release from the human fetal pancreas. Cell Calcium 1990, 11, 1–9. [Google Scholar] [CrossRef]
- Kelly, C.; McClenaghan, N.H.; Flatt, P.R. Role of islet structure and cellular interactions in the control of insulin secretion. Islets 2011, 3, 41–47. [Google Scholar] [CrossRef] [PubMed]
- Luther, M.J.; Hauge-Evans, A.; Souza, K.L.A.; Jörns, A.; Lenzen, S.; Persaud, S.J.; Jones, P.M. MIN6 β-cell-β-cell interactions influence insulin secretory responses to nutrients and non-nutrients. Biochem. Biophys. Res. Commun. 2006, 343, 99–104. [Google Scholar] [CrossRef] [PubMed]
- Hilderink, J.; Spijker, S.; Carlotti, F.; Lange, L.; Engelse, M.; van Blitterswijk, C.; de Koning, E.; Karperien, M.; van Apeldoorn, A. Controlled aggregation of primary human pancreatic islet cells leads to glucose-responsive pseudoislets comparable to native islets. J. Cell. Mol. Med. 2015, 17, 12555. [Google Scholar] [CrossRef] [PubMed]
- Pipeleers, D.; In’t Veld, P.; Maes, E.; van de Winkel, M. Glucose-induced insulin release depends on functional cooperation between islet cells. Proc. Natl. Acad. Sci. USA 1982, 79, 7322–7325. [Google Scholar] [CrossRef] [PubMed]
- Nyitray, C.E.; Chavez, M.G.; Desai, T.A. Compliant 3D microenvironment improves β-cell cluster insulin expression through mechanosensing and β-catenin signaling. Tissue Eng. Part A 2014, 20, 1888–1895. [Google Scholar] [CrossRef] [PubMed]
- Malaisse, W.J. Insulin secretion: Multifactorial regulation for a single process of release. Diabetologia 1973, 9, 167–173. [Google Scholar] [CrossRef] [PubMed]
- Arden, C.; Harbottle, A.; Baltrusch, S.; Tiedge, M.; Agius, L. Glucokinase is an integral component of the insulin granules in glucose-responsive insulin secretory cells and does not translocate during glucose stimulation. Diabetes 2004, 53, 2346–2352. [Google Scholar] [CrossRef] [PubMed]
- Ravassard, P.; Hazhouz, Y.; Pechberty, S.; Bricout-Neveu, E.; Armanet, M.; Czemichow, P.; Scharfmann, R. A genetically engineered human pancreatic β cell line exhibiting glucose-inducible insulin secretion. J. Clin. Investig. 2011, 121, 3589–3597. [Google Scholar] [CrossRef] [PubMed]
- Rivron, N.C.; Vrij, E.J.; Rouwkema, J.; Gac, S.L.; van Berg, A.D.; Truckenmüller, R.K.; van Blitterswijk, C.A. Tissue deformation spatially modulates VEGF signaling and angiogenesis. Proc. Natl. Acad. Sci. USA 2012, 109, 6886–6891. [Google Scholar] [CrossRef] [PubMed]


© 2016 by the authors; licensee MDPI, Basel, Switzerland. This article is an open access article distributed under the terms and conditions of the Creative Commons Attribution (CC-BY) license (http://creativecommons.org/licenses/by/4.0/).
Share and Cite
Groot Nibbelink, M.; Marchioli, G.; Moroni, L.; Karperien, M.; Van Apeldoorn, A. A Protocol to Enhance INS1E and MIN6 Functionality—The Use of Theophylline. Int. J. Mol. Sci. 2016, 17, 1532. https://doi.org/10.3390/ijms17091532
Groot Nibbelink M, Marchioli G, Moroni L, Karperien M, Van Apeldoorn A. A Protocol to Enhance INS1E and MIN6 Functionality—The Use of Theophylline. International Journal of Molecular Sciences. 2016; 17(9):1532. https://doi.org/10.3390/ijms17091532
Chicago/Turabian StyleGroot Nibbelink, Milou, Giulia Marchioli, Lorenzo Moroni, Marcel Karperien, and Aart Van Apeldoorn. 2016. "A Protocol to Enhance INS1E and MIN6 Functionality—The Use of Theophylline" International Journal of Molecular Sciences 17, no. 9: 1532. https://doi.org/10.3390/ijms17091532
APA StyleGroot Nibbelink, M., Marchioli, G., Moroni, L., Karperien, M., & Van Apeldoorn, A. (2016). A Protocol to Enhance INS1E and MIN6 Functionality—The Use of Theophylline. International Journal of Molecular Sciences, 17(9), 1532. https://doi.org/10.3390/ijms17091532