
Screening and Validation of Housekeeping Genes of the Root and Cotyledon of Cunninghamia lanceolata under Abiotic Stresses by Using Quantitative Real-Time PCR


Abstract
:
1. Introduction
2. Results
2.1. Quality Control
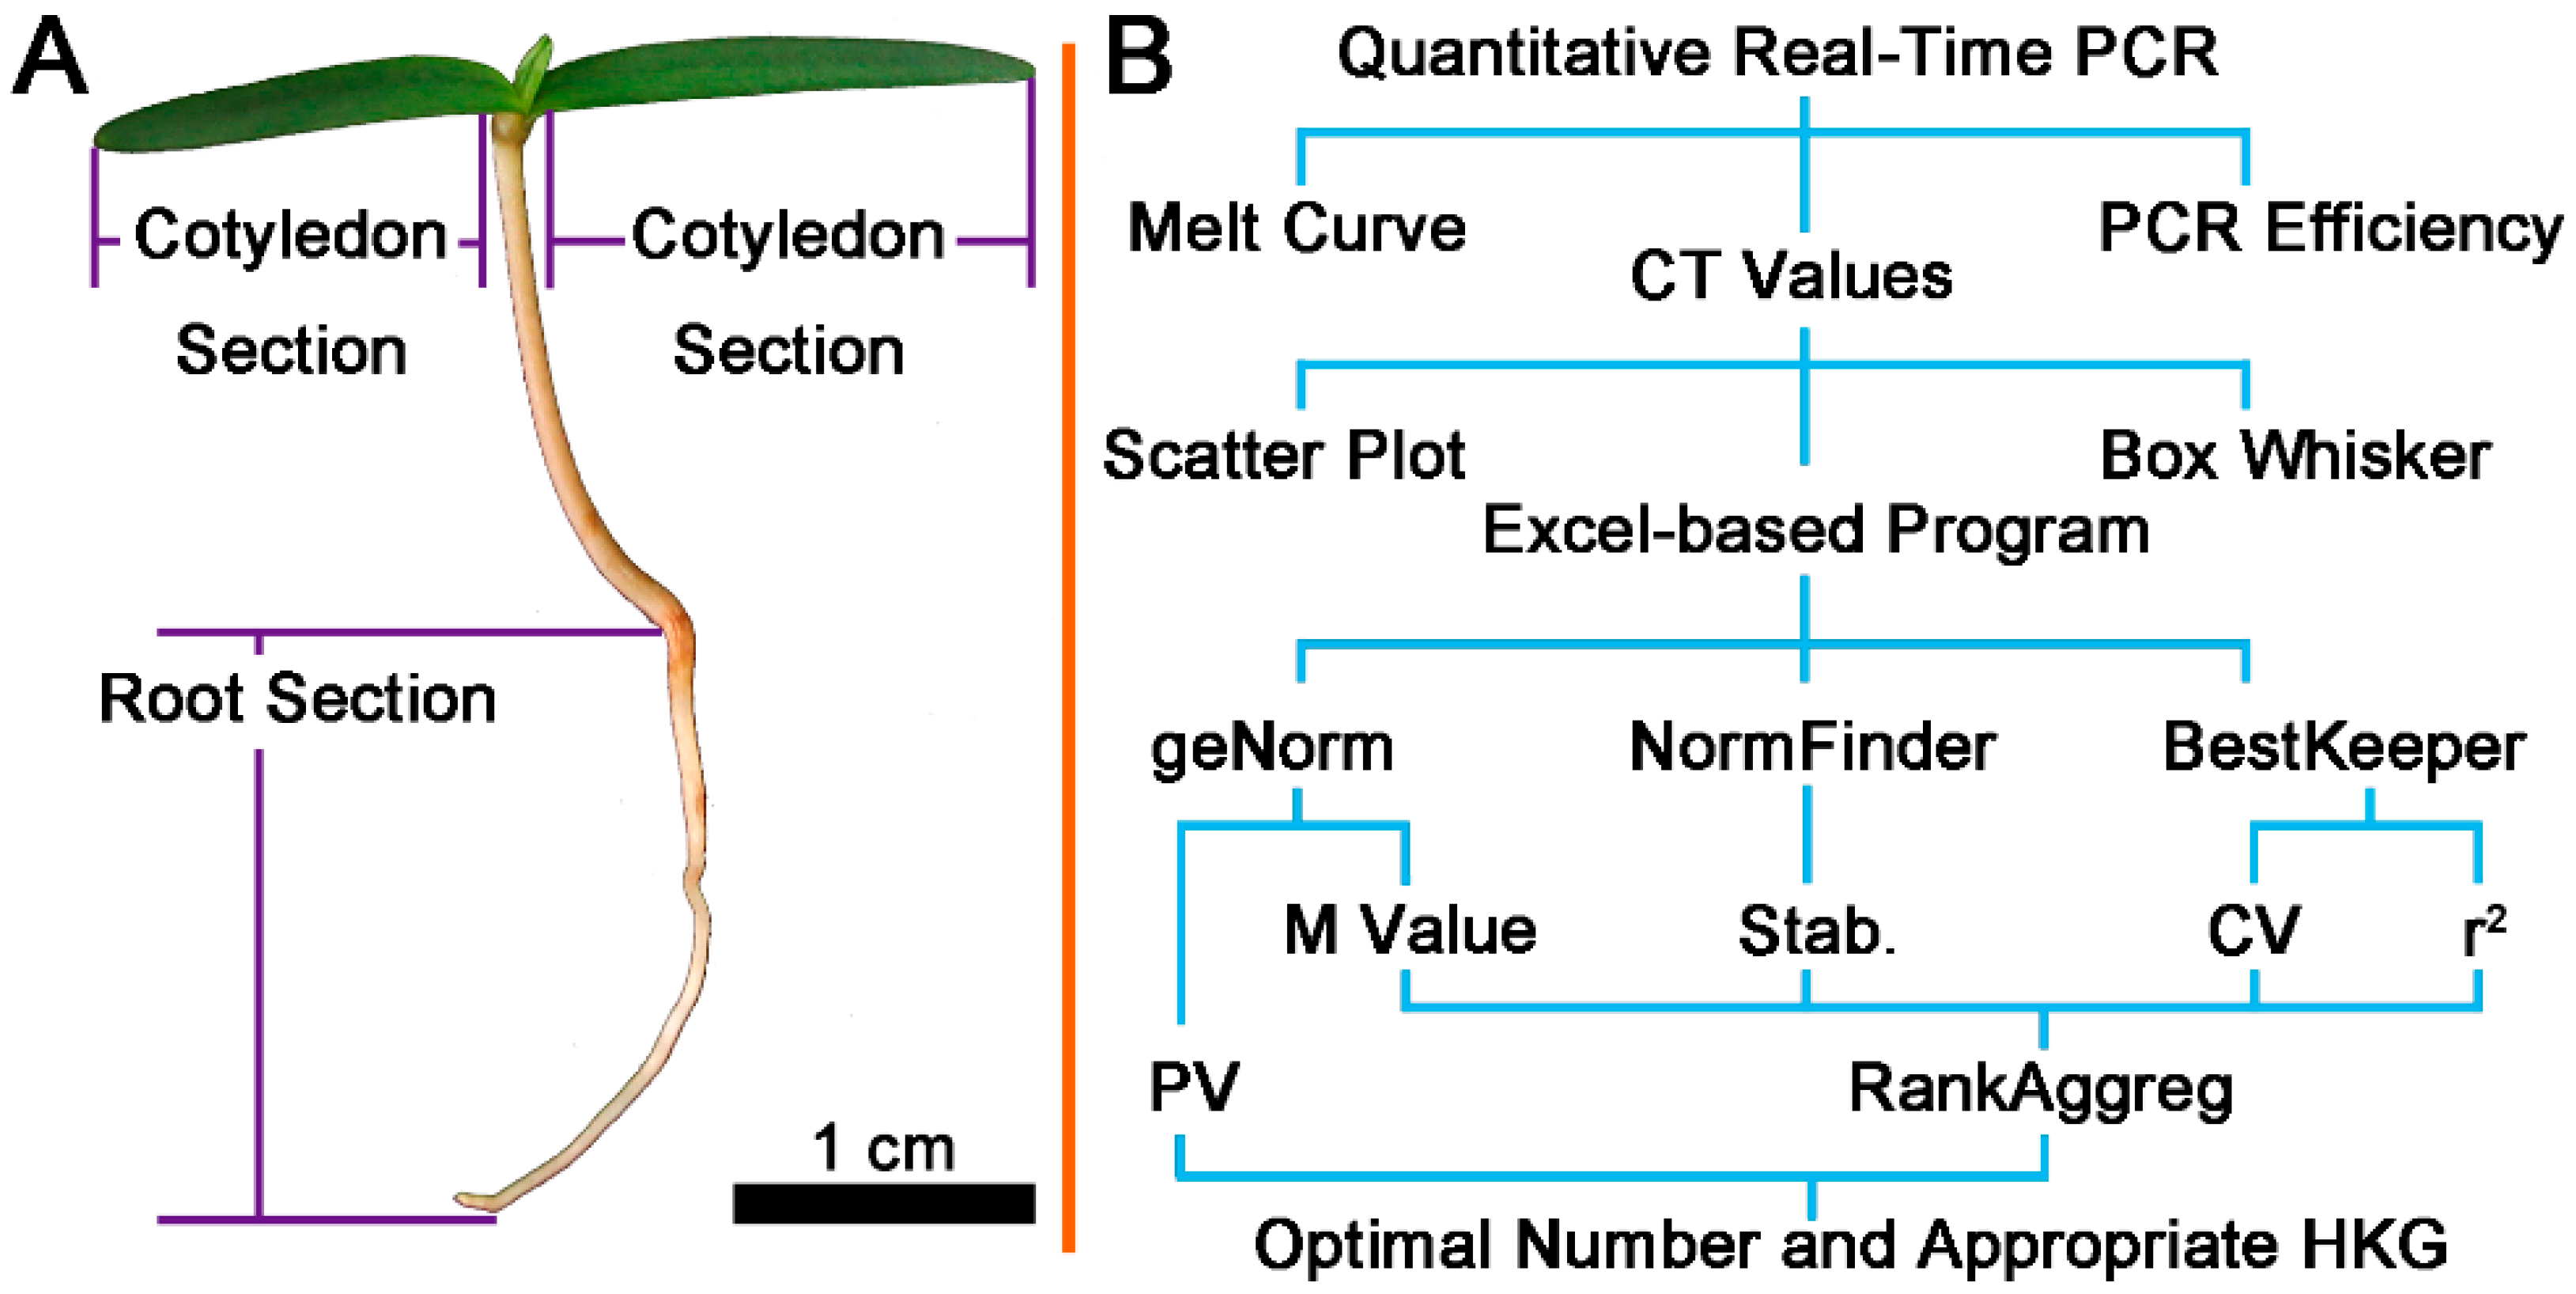
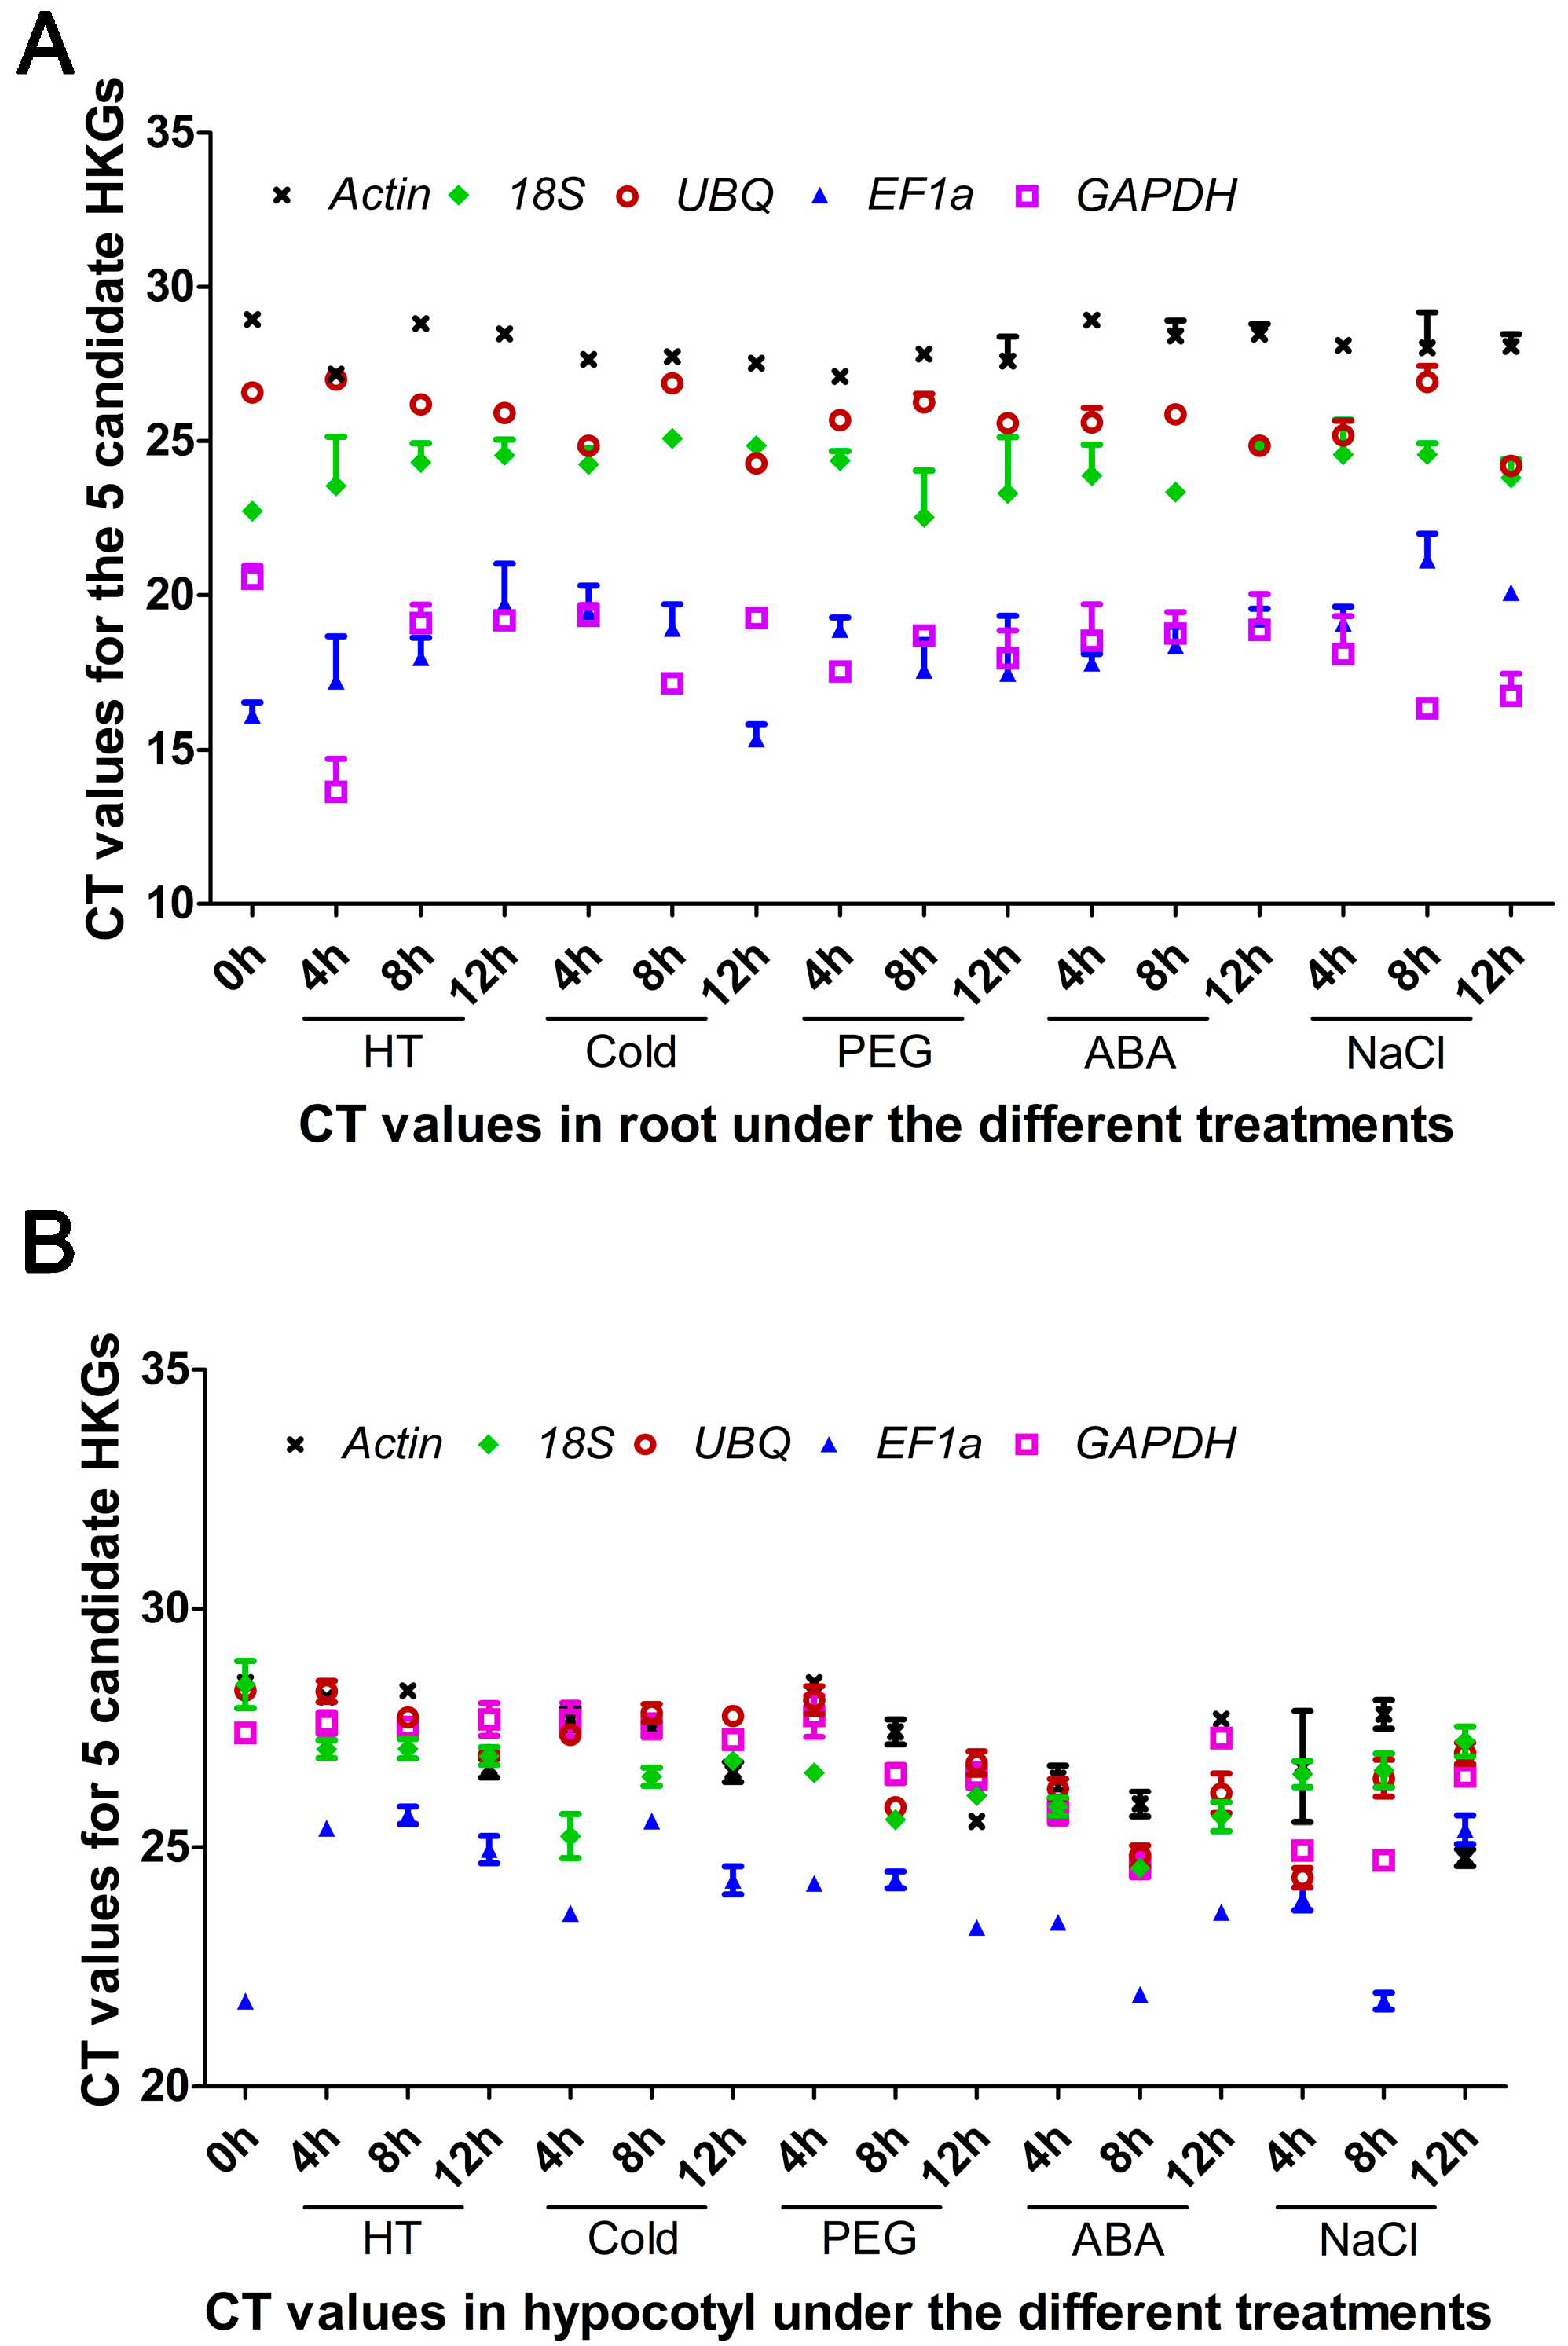
2.2. Transcriptional Patterns
2.3. Statistical Analysis
2.3.1. NormFinder
2.3.2. BestKeeper
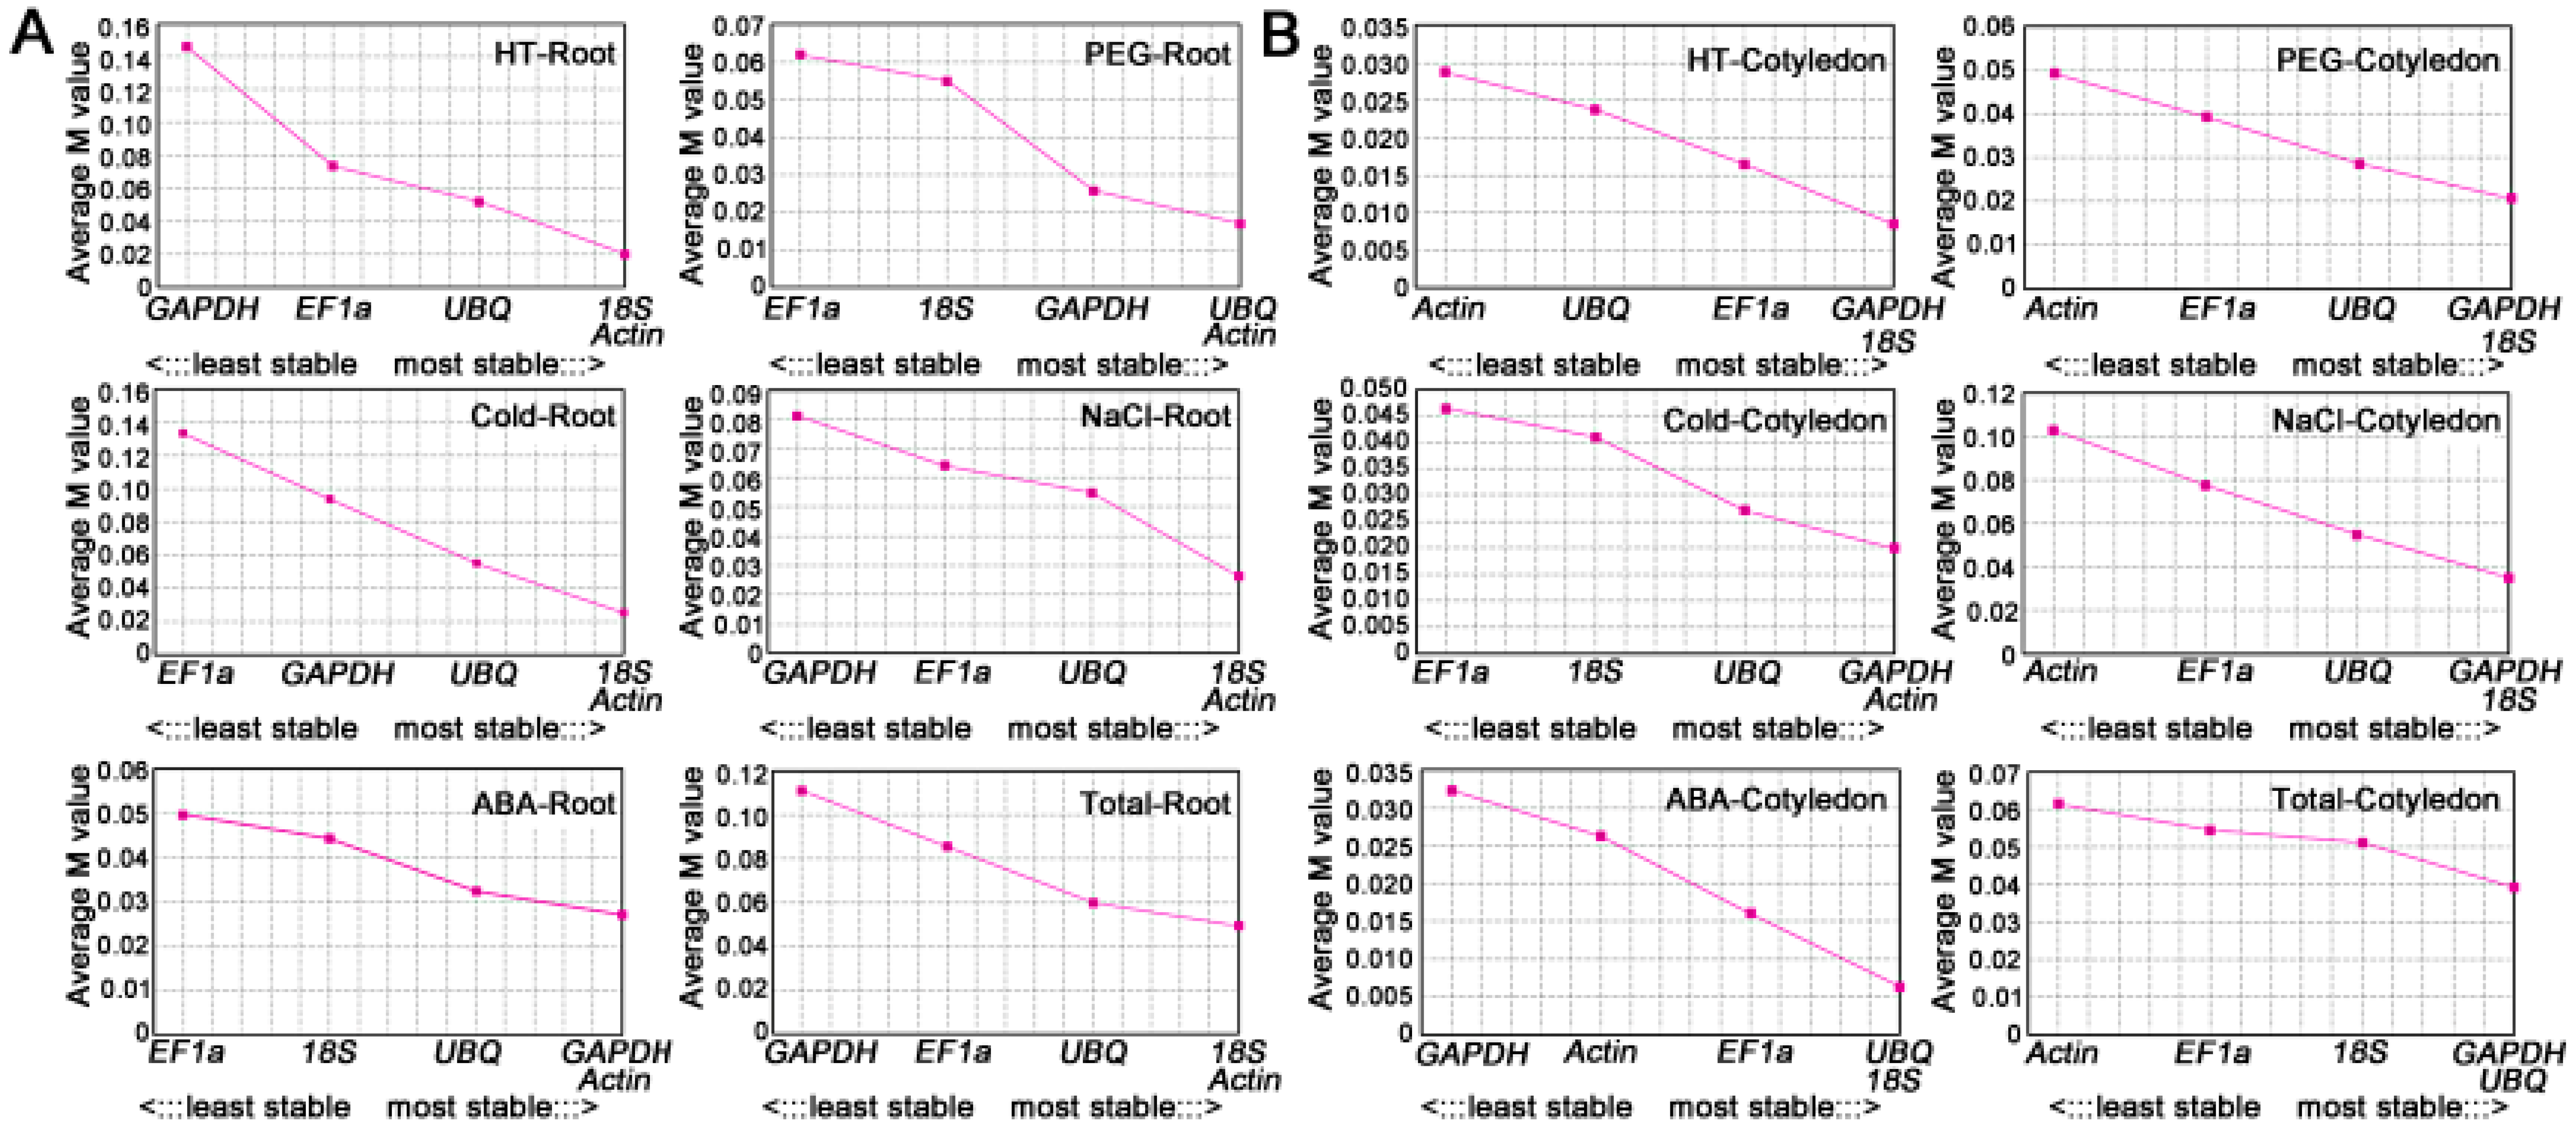
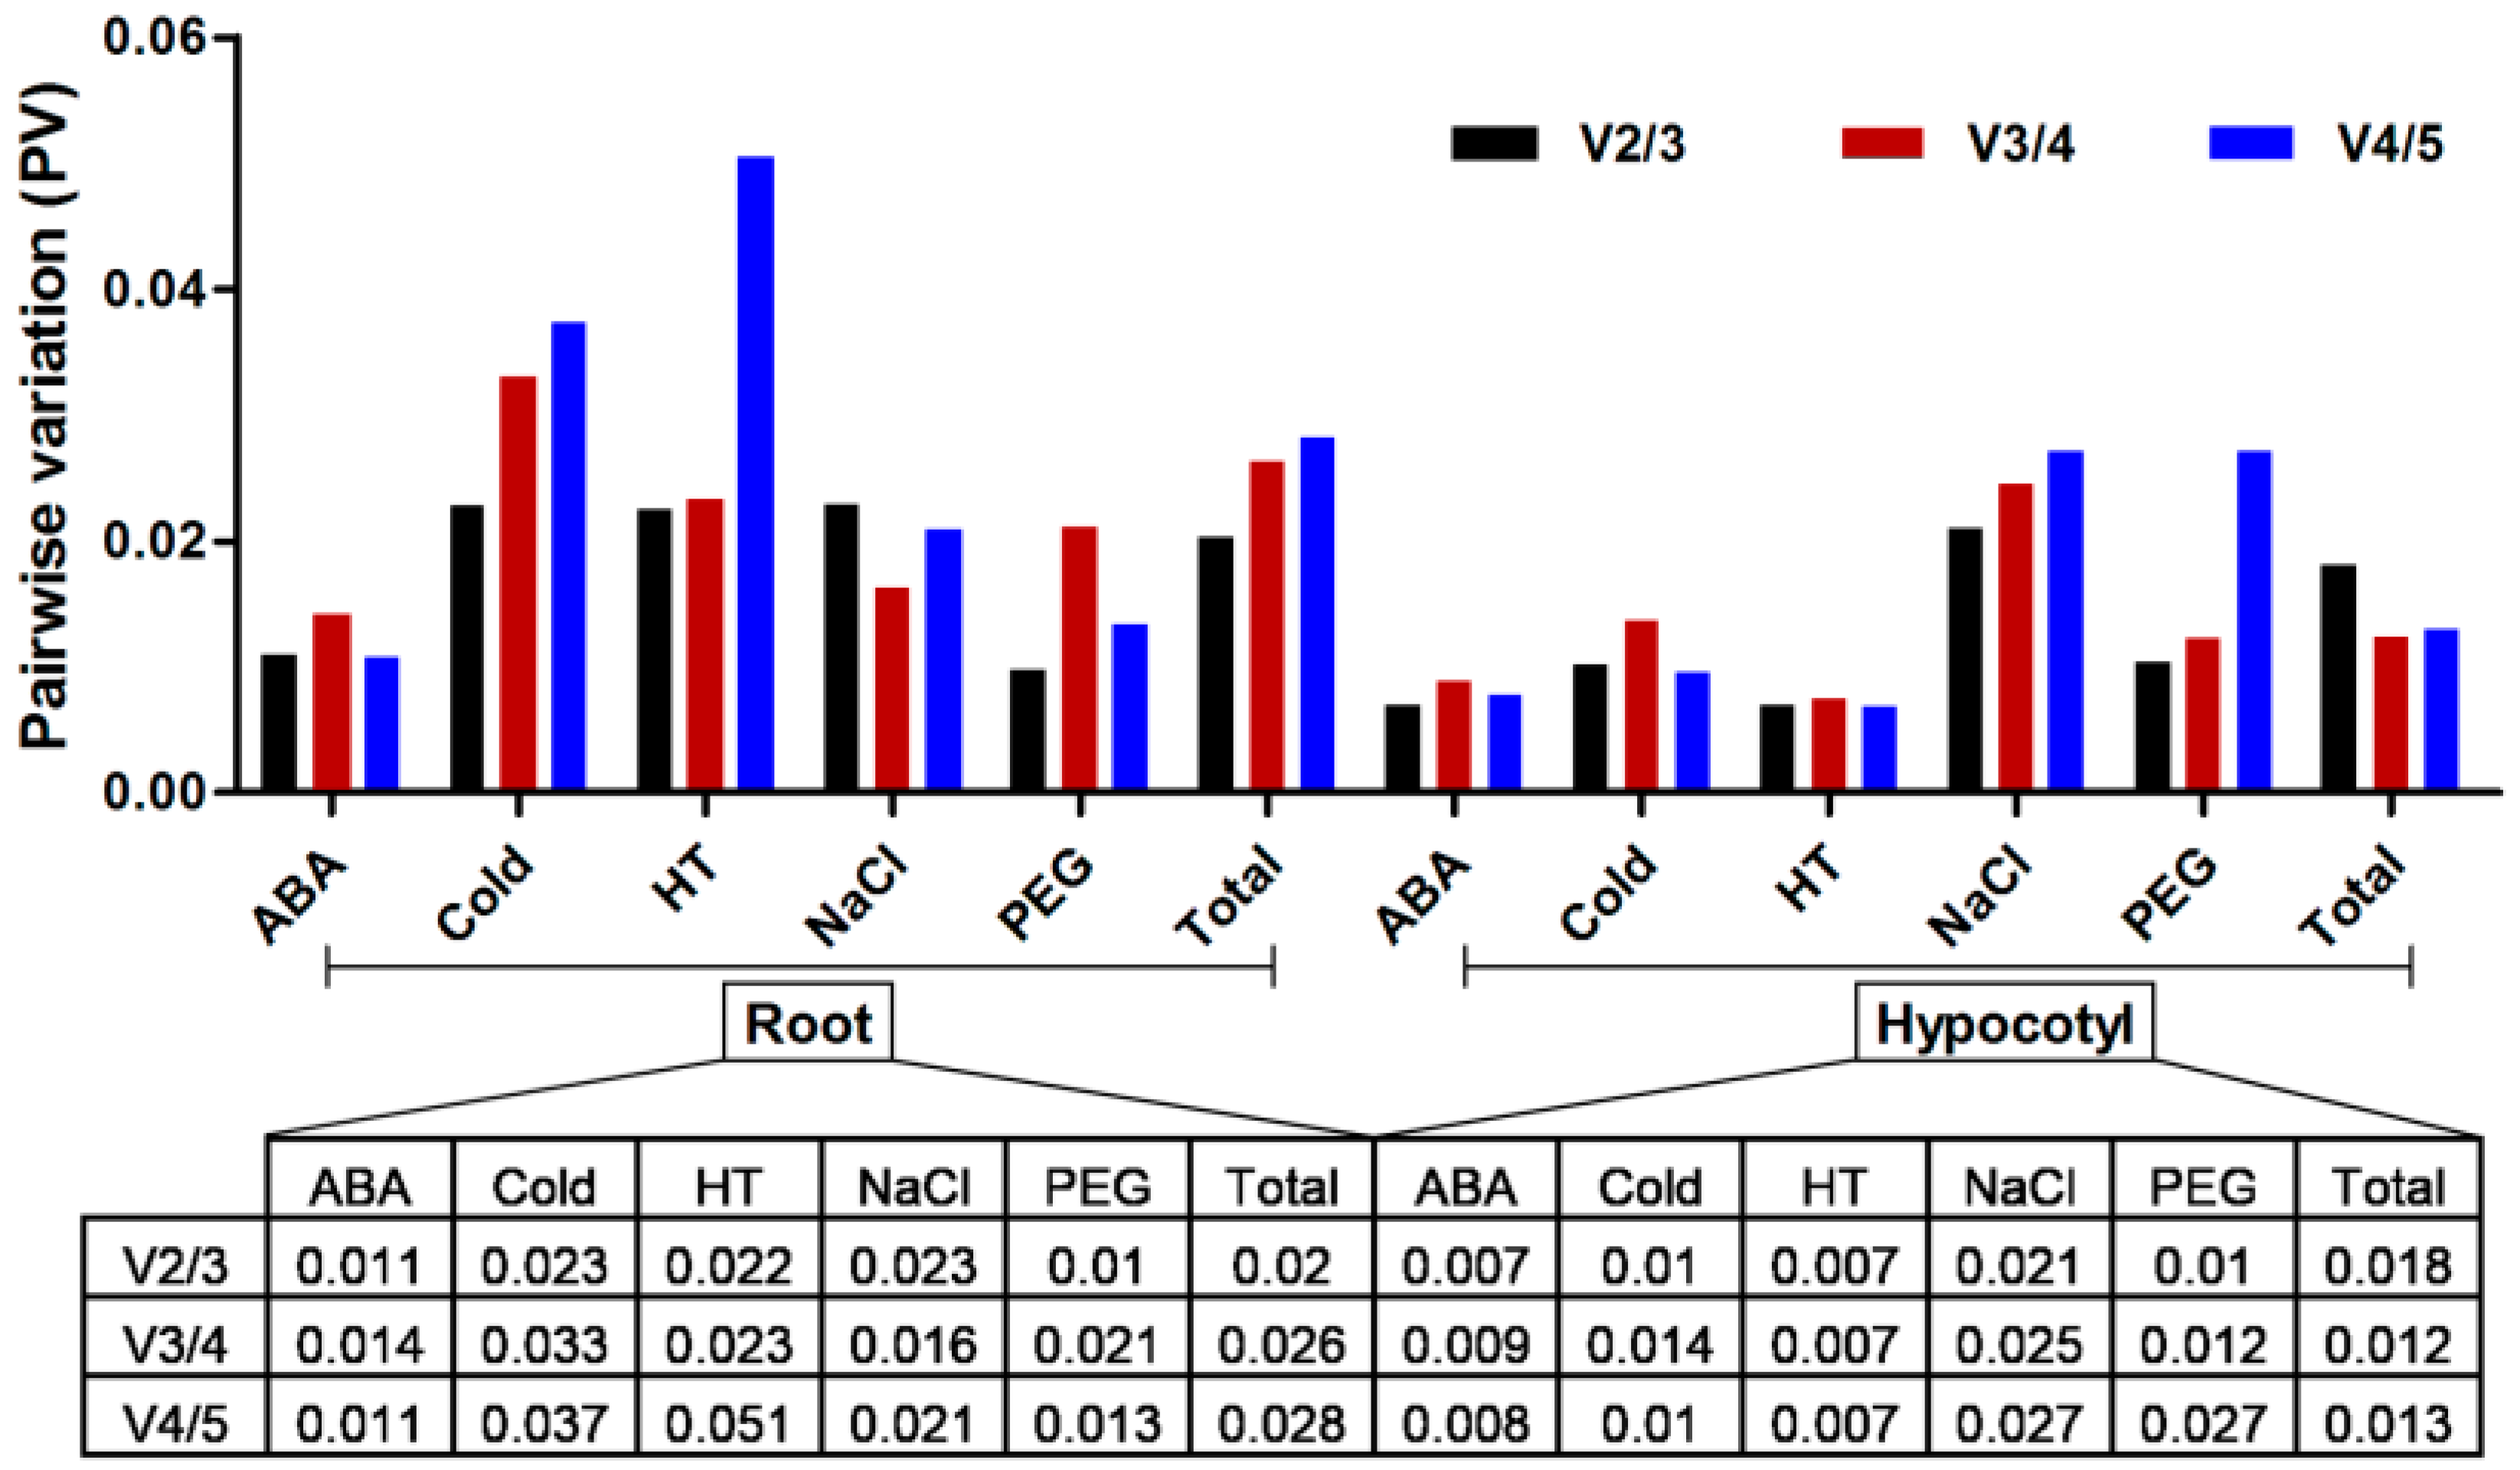
2.3.3. geNorm
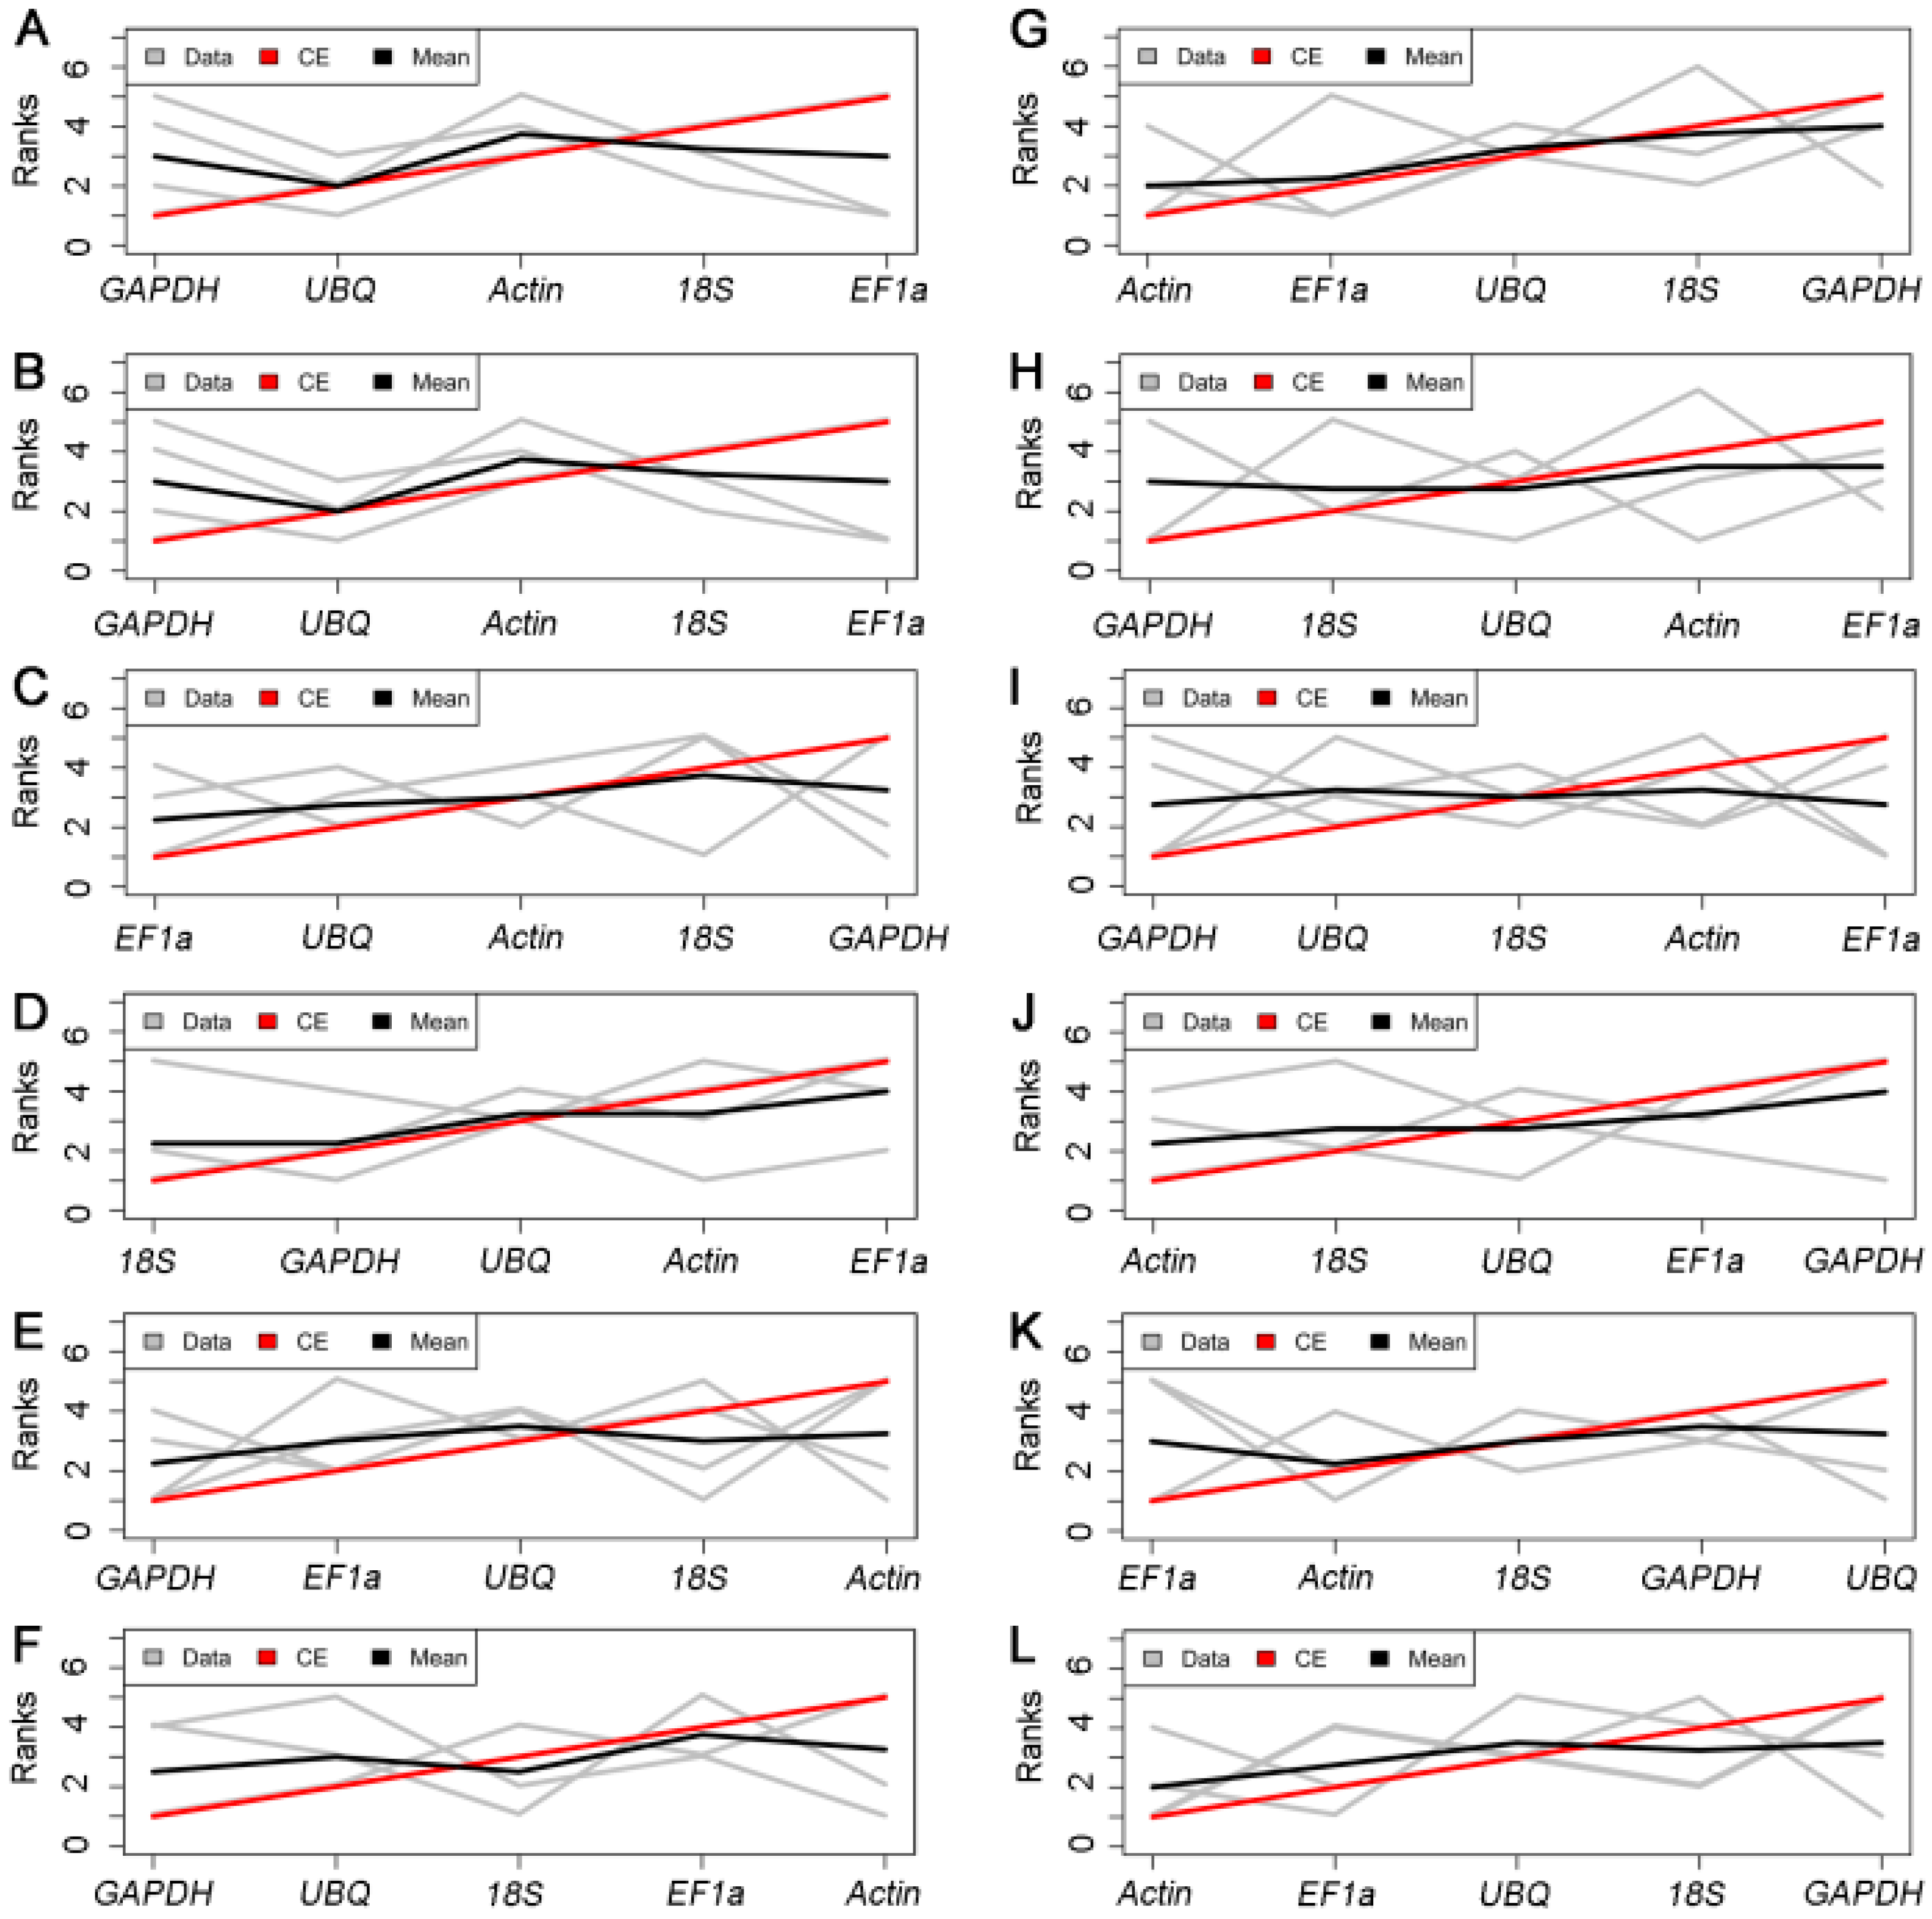
2.3.4. RankAggreg
3. Discussion
4. Materials and Methods
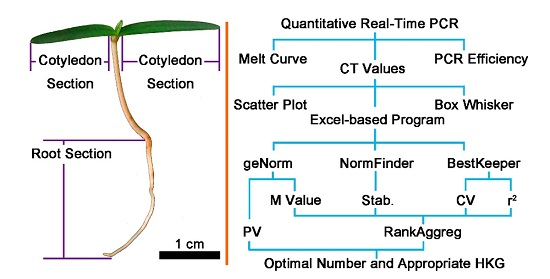
4.1. Sampling
4.2. Total RNAs Extraction
4.3. cDNA Synthesis
4.4. Primer Design
4.5. Quantitative Real-Time PCR (qRT-PCR)
4.6. Bioinformatics and Statistical Analysis of Data
5. Conclusions
Supplementary Materials
Acknowledgments
Author Contributions
Conflicts of Interest
References
- Pan, Y.D.; Birdsey, R.A.; Phillips, O.L.; Jackson, R.B. The structure, distribution, and biomass of the world’s forests. Annu. Rev. Ecol. Evol. Syst. 2013, 44, 593–622. [Google Scholar] [CrossRef]
- McKinley, D.C.; Ryan, M.G.; Birdsey, R.A.; Giardina, C.P.; Harmon, M.E.; Heath, L.S.; Houghton, R.A.; Jackson, R.B.; Morrison, J.F.; Murray, B.C.; et al. A synthesis of current knowledge on forests and carbon storage in the united states. Ecol. Appl. 2011, 21, 1902–1924. [Google Scholar] [CrossRef] [PubMed]
- Pan, Y.D.; Birdsey, R.A.; Fang, J.Y.; Houghton, R.; Kauppi, P.E.; Kurz, W.A.; Phillips, O.L.; Shvidenko, A.; Lewis, S.L.; Canadell, J.G.; et al. A large and persistent carbon sink in the world’s forests. Science 2011, 333, 988–993. [Google Scholar] [CrossRef] [PubMed]
- Huang, H.H.; Xu, L.L.; Tong, Z.K.; Lin, E.P.; Liu, Q.P.; Cheng, L.J.; Zhu, M.Y. De novo characterization of the chinese fir (Cunninghamia lanceolata) transcriptome and analysis of candidate genes involved in cellulose and lignin biosynthesis. BMC Genom. 2012, 13. [Google Scholar] [CrossRef] [PubMed]
- Qiu, Z.; Li, X.; Zhao, Y.; Zhang, M.; Wan, Y.; Cao, D. Genome-wide analysis reveals dynamic changes in expression of microRNAs during vascular cambium development in Chinese fir, Cunninghamia lanceolata. J. Exp. Bot. 2015, 66, 3041–3054. [Google Scholar] [CrossRef] [PubMed]
- Shi, J.S.; Zhen, Y.; Zheng, R.H. Proteome profiling of early seed development in Cunninghamia lanceolata (lamb.) hook. J. Exp. Bot. 2010, 61, 2367–2381. [Google Scholar] [CrossRef] [PubMed]
- Gao, Y.; Bian, L.M.; Shi, J.S.; Xu, J.; Xi, M.L.; Wang, G.F. Expression of a conifer COBRA-like gene CLCOBL1 from Chinese fir (Cunninghamia lanceolata) alters the leaf architecture in tobacco. Plant Physiol. Biochem. 2013, 70, 483–491. [Google Scholar] [CrossRef] [PubMed]
- Li, X.; Su, Q.; Zheng, R.H.; Liu, G.X.; Lu, Y.; Bian, L.M.; Chen, J.H.; Shi, J.S. CLRTL1 encodes a Chinese fir RNAse III-like protein involved in regulating shoot branching. Int. J. Mol. Sci. 2015, 16, 25691–25710. [Google Scholar] [CrossRef] [PubMed]
- Qiu, Z.B.; Wan, L.C.; Chen, T.; Wan, Y.L.; He, X.Q.; Lu, S.F.; Wang, Y.W.; Lin, J.X. The regulation of cambial activity in Chinese fir (Cunninghamia lanceolata) involves extensive transcriptome remodeling. New Phytol. 2013, 199, 708–719. [Google Scholar] [CrossRef] [PubMed]
- Wan, L.C.; Wang, F.; Guo, X.Q.; Lu, S.F.; Qiu, Z.B.; Zhao, Y.Y.; Zhang, H.Y.; Lin, J.X. Identification and characterization of small non-coding RNAs from Chinese fir by high throughput sequencing. BMC Plant Biol. 2012, 12. [Google Scholar] [CrossRef] [PubMed]
- Li, R.Q.; Zhu, H.M.; Ruan, J.; Qian, W.B.; Fang, X.D.; Shi, Z.B.; Li, Y.R.; Li, S.T.; Shan, G.; Kristiansen, K.; et al. De novo assembly of human genomes with massively parallel short read sequencing. Genome Res. 2010, 20, 265–272. [Google Scholar] [CrossRef] [PubMed]
- Ozsolak, F.; Milos, P.M. RNA sequencing: Advances, challenges and opportunities. Nat. Rev. Genet. 2011, 12, 87–98. [Google Scholar] [CrossRef] [PubMed]
- Nagarajan, N.; Pop, M. Sequence assembly demystified. Nat. Rev. Genet. 2013, 14, 157–167. [Google Scholar] [CrossRef] [PubMed]
- Nolan, T.; Hands, R.E.; Bustin, S.A. Quantification of mRNA using real-time RT-PCR. Nat. Protoc. 2006, 1, 1559–1582. [Google Scholar] [CrossRef] [PubMed]
- Kumar, K.; Muthamilarasan, M.; Prasad, M. Reference genes for quantitative real-time PCR analysis in the model plant foxtail millet (Setaria italica L.) subjected to abiotic stress conditions. Plant Cell Tissue Org. Cult. 2013, 115, 13–22. [Google Scholar] [CrossRef]
- Jain, M.; Nijhawan, A.; Tyagi, A.K.; Khurana, J.P. Validation of housekeeping genes as internal control for studying gene expression in rice by quantitative real-time PCR. Biochem. Biophys. Res. Commun. 2006, 345, 646–651. [Google Scholar] [CrossRef] [PubMed]
- Lambret-Frotte, J.; de Almeida, L.C.S.; de Moura, S.M.; Souza, F.L.F.; Linhares, F.S.; Alves-Ferreira, M. Validating internal control genes for the accurate normalization of qPCR expression analysis of the novel model plant Setaria viridis. PLoS ONE 2015, 10. [Google Scholar] [CrossRef] [PubMed]
- Ponchel, F.; Toomes, C.; Bransfield, K.; Leong, F.T.; Douglas, S.H.; Field, S.L.; Bell, S.M.; Combaret, V.; Puisieux, A.; Mighell, A.J.; et al. Real-time PCR based on SYBR-green I fluorescence: An alternative to the taqman assay for a relative quantification of gene rearrangements, gene amplifications and micro gene deletions. BMC Biotechnol. 2003, 3, 18. [Google Scholar] [CrossRef] [PubMed]
- Huis, R.; Hawkins, S.; Neutelings, G. Selection of reference genes for quantitative gene expression normalization in flax (Linum usitatissimum L.). BMC Plant Biol. 2010, 10. [Google Scholar] [CrossRef] [PubMed]
- Yang, C.X.; Pan, H.P.; Liu, Y.; Zhou, X.G. Stably expressed housekeeping genes across developmental stages in the two-spotted spider mite, tetranychus urticae. PLoS ONE 2015, 10. [Google Scholar] [CrossRef] [PubMed]
- Bustin, S.A.; Benes, V.; Nolan, T.; Pfaffl, M.W. Quantitative real-time RT-PCR—A perspective. J. Mol. Endocrinol. 2005, 34, 597–601. [Google Scholar] [CrossRef] [PubMed]
- Strube, C.; Buschbaum, S.; Wolken, S.; Schnieder, T. Evaluation of reference genes for quantitative real-time PCR to investigate protein disulfide isomerase transcription pattern in the bovine lungworm Dictyocaulus viviparus. Gene 2008, 425, 36–43. [Google Scholar] [CrossRef] [PubMed]
- Dheda, K.; Huggett, J.F.; Chang, J.S.; Kim, L.U.; Bustin, S.A.; Johnson, M.A.; Rook, G.A.W.; Zumla, A. The implications of using an inappropriate reference gene for real-time reverse transcription PCR data normalization. Anal. Biochem. 2005, 344, 141–143. [Google Scholar] [CrossRef] [PubMed]
- Guenin, S.; Mauriat, M.; Pelloux, J.; Van Wuytswinkel, O.; Bellini, C.; Gutierrez, L. Normalization of QRT-PCR data: The necessity of adopting a systematic, experimental conditions-specific, validation of references. J. Exp. Bot. 2009, 60, 487–493. [Google Scholar] [CrossRef] [PubMed]
- Guo, J.L.; Ling, H.; Wu, Q.B.; Xu, L.P.; Que, Y.X. The choice of reference genes for assessing gene expression in sugarcane under salinity and drought stresses. Sci. Rep. 2014, 4, 7042. [Google Scholar] [CrossRef] [PubMed]
- Pfaffl, M.W.; Prgomet, C.; Schmitz, S.; Meyer, H.H.D.; Bruckmaier, R.M. LPS effects on the mRNA expression of inflammatory factors in the mammary gland: Quantitative transcriptomics in various cell types using real-time RT-PCR. Tissue Antigens 2004, 64, 326–327. [Google Scholar]
- Podevin, N.; Krauss, A.; Henry, I.; Swennen, R.; Remy, S. Selection and validation of reference genes for quantitative RT-PCR expression studies of the non-model crop musa. Mol. Breed. 2012, 30, 1237–1252. [Google Scholar] [CrossRef] [PubMed]
- Andersen, C.L.; Jensen, J.L.; Orntoft, T.F. Normalization of real-time quantitative reverse transcription-PCR data: A model-based variance estimation approach to identify genes suited for normalization, applied to bladder and colon cancer data sets. Cancer Res. 2004, 64, 5245–5250. [Google Scholar] [CrossRef] [PubMed]
- Tang, X.L.; Wang, H.Y.; Shao, C.Y.; Shao, H.B. Reference gene selection for qPCR normalization of kosteletzkya virginica under salt stress. BioMed Res. Int. 2015, 2015. [Google Scholar] [CrossRef] [PubMed]
- Lu, Y.H.; Yuan, M.; Gao, X.W.; Kang, T.H.; Zhan, S.; Wan, H.; Li, J.H. Identification and validation of reference genes for gene expression analysis using quantitative PCR in spodoptera litura (Lepidoptera: Noctuidae). PLoS ONE 2013, 8. [Google Scholar] [CrossRef] [PubMed]
- Jian, B.; Liu, B.; Bi, Y.R.; Hou, W.S.; Wu, C.X.; Han, T.F. Validation of internal control for gene expression study in soybean by quantitative real-time PCR. BMC Mol. Biol. 2008, 9. [Google Scholar] [CrossRef] [PubMed]
- Zhu, X.Y.; Li, X.P.; Chen, W.X.; Chen, J.Y.; Lu, W.J.; Chen, L.; Fu, D.W. Evaluation of new reference genes in papaya for accurate transcript normalization under different experimental conditions. PLoS ONE 2012, 7. [Google Scholar] [CrossRef] [PubMed]
- Nicot, N.; Hausman, J.F.; Hoffmann, L.; Evers, D. Housekeeping gene selection for real-time RT-PCR normalization in potato during biotic and abiotic stress. J. Exp. Bot. 2005, 56, 2907–2914. [Google Scholar] [CrossRef] [PubMed]
- Exposito-Rodriguez, M.; Borges, A.A.; Borges-Perez, A.; Perez, J.A. Selection of internal control genes for quantitative real-time RT-PCR studies during tomato development process. BMC Plant Biol. 2008, 8. [Google Scholar] [CrossRef] [PubMed]
- Paolacci, A.R.; Tanzarella, O.A.; Porceddu, E.; Ciaffi, M. Identification and validation of reference genes for quantitative RT-PCR normalization in wheat. BMC Mol. Biol. 2009, 10. [Google Scholar] [CrossRef] [PubMed]
- de Oliveira, L.A.; Breton, M.C.; Bastolla, F.M.; Camargo, S.D.; Margis, R.; Frazzon, J.; Pasquali, G. Reference genes for the normalization of gene expression in eucalyptus species. Plant Cell Physiol. 2012, 53, 405–422. [Google Scholar] [CrossRef] [PubMed]
- Czechowski, T.; Stitt, M.; Altmann, T.; Udvardi, M.K.; Scheible, W.R. Genome-wide identification and testing of superior reference genes for transcript normalization in arabidopsis. Plant Physiol. 2005, 139, 5–17. [Google Scholar] [CrossRef] [PubMed]
- Wei, L.B.; Miao, H.M.; Zhao, R.H.; Han, X.H.; Zhang, T.D.; Zhang, H.Y. Identification and testing of reference genes for sesame gene expression analysis by quantitative real-time PCR. Planta 2013, 237, 873–889. [Google Scholar] [CrossRef] [PubMed]
- Wang, H.L.; Chen, J.H.; Tian, Q.Q.; Wang, S.; Xia, X.L.; Yin, W.L. Identification and validation of reference genes for Populus euphratica gene expression analysis during abiotic stresses by quantitative real-time PCR. Physiol. Plant. 2014, 152, 529–545. [Google Scholar] [CrossRef] [PubMed]
- Morse, A.M.; Peterson, D.G.; Islam-Faridi, M.N.; Smith, K.E.; Magbanua, Z.; Garcia, S.A.; Kubisiak, T.L.; Amerson, H.V.; Carlson, J.E.; Nelson, C.D.; et al. Evolution of genome size and complexity in pinus. PLoS ONE 2009, 4, e4332. [Google Scholar] [CrossRef] [PubMed]
- Kovach, A.; Wegrzyn, J.L.; Parra, G.; Holt, C.; Bruening, G.E.; Loopstra, C.A.; Hartigan, J.; Yandell, M.; Langley, C.H.; Korf, I.; et al. The Pinus taeda genome is characterized by diverse and highly diverged repetitive sequences. BMC Genom. 2010, 11. [Google Scholar] [CrossRef] [PubMed]
- Nystedt, B.; Street, N.R.; Wetterbom, A.; Zuccolo, A.; Lin, Y.C.; Scofield, D.G.; Vezzi, F.; Delhomme, N.; Giacomello, S.; Alexeyenko, A.; et al. The norway spruce genome sequence and conifer genome evolution. Nature 2013, 497, 579–584. [Google Scholar] [CrossRef] [PubMed]
- Javier de Vega-Bartol, J.; Santos, R.; Simões, M.; Miguel, C. Evaluation of reference genes for quantitative PCR analysis during somatic embryogenesis in conifers. BMC Proc. 2011, 5. [Google Scholar] [CrossRef]
- Vandesompele, J.; de Preter, K.; Pattyn, F.; Poppe, B.; Van Roy, N.; de Paepe, A.; Speleman, F. Accurate normalization of real-time quantitative RT-PCR data by geometric averaging of multiple internal control genes. Genome Biol. 2002, 3. [Google Scholar] [CrossRef]
- Pfaffl, M.W.; Tichopad, A.; Prgomet, C.; Neuvians, T.P. Determination of stable housekeeping genes, differentially regulated target genes and sample integrity: Bestkeeper-excel-based tool using pair-wise correlations. Biotechnol. Lett. 2004, 26, 509–515. [Google Scholar] [CrossRef] [PubMed]
- Pihur, V.; Datta, S. Rankaggreg, an R package for weighted rank aggregation. BMC Bioinform. 2009, 10, 62. [Google Scholar] [CrossRef] [PubMed]
- Bustin, S.A.; Benes, V.; Garson, J.A.; Hellemans, J.; Huggett, J.; Kubista, M.; Mueller, R.; Nolan, T.; Pfaffl, M.W.; Shipley, G.L.; et al. The MIQE guidelines: Minimum information for publication of quantitative real-time PCR experiments. Clin. Chem. 2009, 55, 611–622. [Google Scholar] [CrossRef] [PubMed]
- Hung, S.H.; Yu, C.W.; Lin, C.H. Hydrogen peroxide functions as a stress signal in plants. Bot. Bull. Acad. Sin. 2005, 46, 1–10. [Google Scholar]
- Wasternack, C.; Kombrink, E. Jasmonates: Structural requirements for lipid-derived signals active in plant stress responses and development. ACS Chem. Biol. 2010, 5, 63–77. [Google Scholar] [CrossRef] [PubMed]
- Mahajan, S.; Pandey, G.K.; Tuteja, N. Calcium- and salt-stress signaling in plants: Shedding light on SOS pathway. Arch. Biochem. Biophys. 2008, 471, 146–158. [Google Scholar] [CrossRef] [PubMed]
- Zhu, J.K. Salt and drought stress signal transduction in plants. Annu. Rev. Plant Biol. 2002, 53, 247–273. [Google Scholar] [CrossRef] [PubMed]
- Gutierrez, L.; Mauriat, M.; Pelloux, J.; Bellini, C.; van Wuytswinkel, O. Towards a systematic validation of references in real-time RT-PCR. Plant Cell 2008, 20, 1734–1735. [Google Scholar] [CrossRef] [PubMed]
- Narsai, R.; Ivanova, A.; Ng, S.; Whelan, J. Defining reference genes in Oryza sativa using organ, development, biotic and abiotic transcriptome datasets. BMC Plant Biol. 2010, 10. [Google Scholar] [CrossRef] [PubMed]
- Silveira, E.D.; Alves-Ferreira, M.; Guimaraes, L.A.; da Silva, F.R.; Carneiro, V.T. Selection of reference genes for quantitative real-time PCR expression studies in the apomictic and sexual grass Brachiaria brizantha. BMC Plant Biol. 2009, 9, 84. [Google Scholar] [CrossRef] [PubMed]
- Xu, H.; Cao, D.; Chen, Y.; Wei, D.; Wang, Y.; Stevenson, R.A.; Zhu, Y.; Lin, J. Gene expression and proteomic analysis of shoot apical meristem transition from dormancy to activation in Cunninghamia lanceolata (lamb.) hook. Sci. Rep. 2016, 6, 19938. [Google Scholar] [CrossRef] [PubMed]
- Wang, Z.; Chen, J.; Liu, W.; Luo, Z.; Wang, P.; Zhang, Y.; Zheng, R.; Shi, J. Transcriptome characteristics and six alternative expressed genes positively correlated with the phase transition of annual cambial activities in Chinese fir (Cunninghamia lanceolata (lamb.) hook). PLoS ONE 2013, 8, e71562. [Google Scholar] [CrossRef] [PubMed]
- Jacob, F.; Guertler, R.; Naim, S.; Nixdorf, S.; Fedier, A.; Hacker, N.F.; Heinzelmann-Schwarz, V. Careful selection of reference genes is required for reliable performance of RT-qPCR in human normal and cancer cell lines. PLoS ONE 2013, 8. [Google Scholar] [CrossRef] [PubMed]
- Sinha, D.K.; Smith, C.M. Selection of reference genes for expression analysis in Diuraphis noxia (hemiptera: Aphididae) fed on resistant and susceptible wheat plants. Sci. Rep. 2014, 4. [Google Scholar] [CrossRef] [PubMed]
- Yang, C.X.; Pan, H.P.; Liu, Y.; Zhou, X.G. Selection of reference genes for expression analysis using quantitative real-time PCR in the pea aphid, Acyrthosiphon pisum (harris) (hemiptera, aphidiae). PLoS ONE 2014, 9. [Google Scholar] [CrossRef] [PubMed]


| Rank Position | Cold-Root | HT-Root | NaCl-Root | ABA-Root | PEG-Root | Total-Root | ||||||
|---|---|---|---|---|---|---|---|---|---|---|---|---|
| Gene | Stab. | Gene | Stab. | Gene | Stab. | Gene | Stab. | Gene | Stab. | Gene | Stab. | |
| 1 | Actin | 0.009 | Actin | 0.007 | Actin | 0.009 | GAPDH | 0.009 | UBQ | 0.006 | Actin | 0.017 |
| 2 | 18S | 0.023 | 18S | 0.007 | 18S | 0.009 | Actin | 0.016 | Actin | 0.017 | 18S | 0.020 |
| 3 | UBQ | 0.038 | EF1a | 0.026 | UBQ | 0.043 | 18S | 0.027 | 18S | 0.042 | UBQ | 0.047 |
| 4 | GAPDH | 0.097 | UBQ | 0.087 | EF1a | 0.056 | EF1a | 0.035 | GAPDH | 0.042 | EF1a | 0.074 |
| 5 | EF1a | 0.126 | GAPDH | 0.174 | GAPDH | 0.070 | UBQ | 0.036 | EF1a | 0.043 | GAPDH | 0.095 |
| Best gene | Actin | Actin and 18S | Actin and 18S | GAPDH | UBQ | Actin | ||||||
| 0.009 | 0.007 | 0.009 | 0.009 | 0.006 | 0.017 | |||||||
| Rank Position | Cold-Cotyledon | HT-Cotyledon | NaCl-Cotyledon | ABA-Cotyledon | PEG-Cotyledon | Total-Cotyledon | ||||||
|---|---|---|---|---|---|---|---|---|---|---|---|---|
| Gene | Stab. | Gene | Stab. | Gene | Stab. | Gene | Stab. | Gene | Stab. | Gene | Stab. | |
| 1 | UBQ | 0.008 | EF1a | 0.006 | GAPDH | 0.012 | EF1a | 0.008 | GAPDH | 0.007 | GAPDH | 0.021 |
| 2 | GAPDH | 0.016 | 18S | 0.010 | 18S | 0.012 | UBQ | 0.012 | 18S | 0.019 | UBQ | 0.024 |
| 3 | Actin | 0.030 | UBQ | 0.013 | UBQ | 0.044 | Actin | 0.016 | EF1a | 0.024 | 18S | 0.029 |
| 4 | 18S | 0.030 | GAPDH | 0.019 | EF1a | 0.078 | 18S | 0.017 | UBQ | 0.031 | EF1a | 0.035 |
| 5 | EF1a | 0.031 | Actin | 0.023 | Actin | 0.092 | GAPDH | 0.026 | Actin | 0.040 | Actin | 0.043 |
| Best combination | UBQ | EF1a | GAPDH and 18S | EF1a | GAPDH | GAPDH | ||||||
| 0.008 | 0.006 | 0.012 | 0.008 | 0.007 | 0.021 | |||||||
| Rank Position | HT-Root | Cold-Root | PEG-Root | ABA-Root | NaCl-Root | Total-Root | ||||||
|---|---|---|---|---|---|---|---|---|---|---|---|---|
| CV | r2 | CV | r2 | CV | r2 | CV | r2 | CV | r2 | CV | r2 | |
| 1 | UBQ | EF1a | Actin | GAPDH | Actin | UBQ | GAPDH | Actin | Actin | GAPDH | Actin | UBQ |
| 2 | 18S | Actin | 18S | 18S | UBQ | GAPDH | Actin | GAPDH | 18S | EF1a | 18S | 18S |
| 3 | Actin | UBQ | UBQ | UBQ | GAPDH | 18S | UBQ | 18S | EF1a | Actin | UBQ | GAPDH |
| 4 | EF1a | 18S | GAPDH | Actin | 18S | Actin | 18S | UBQ | UBQ | 18S | EF1a | Actin |
| 5 | GAPDH | GAPDH | EF1a | EF1a | EF1a | EF1a | EF1a | EF1a | GAPDH | UBQ | GAPDH | EF1a |
| Rank Position | HT-Cotyledon | Cold-Cotyledon | PEG-Cotyledon | ABA-Cotyledon | NaCl-Cotyledon | Total-Cotyledon | ||||||
|---|---|---|---|---|---|---|---|---|---|---|---|---|
| CV | r2 | CV | r2 | CV | r2 | CV | r2 | CV | r2 | CV | r2 | |
| 1 | GAPDH | GAPDH | GAPDH | Actin | 18S | EF1a | 18S | 18S | 18S | EF1a | 18S | Actin |
| 2 | 18S | EF1a | UBQ | GAPDH | EF1a | 18S | UBQ | Actin | GAPDH | UBQ | Actin | 18S |
| 3 | EF1a | UBQ | Actin | 18S | GAPDH | UBQ | Actin | UBQ | UBQ | Actin | UBQ | EF1a |
| 4 | UBQ | 18S | 18S | UBQ | UBQ | Actin | EF1a | GAPDH | Actin | GAPDH | GAPDH | UBQ |
| 5 | Actin | Actin | EF1a | EF1a | Actin | GAPDH | GAPDH | EF1a | EF1a | 18S | EF1a | GAPDH |
| Different Tissue | Treatment | |||||
|---|---|---|---|---|---|---|
| Cold | HT | ABA | NaCl | PEG | Total | |
| Cotyledon | GAPDH | GAPDH | EF1a | 18S | GAPDH | GAPDH |
| UBQ | UBQ | UBQ | GAPDH | EF1a | UBQ | |
| Root | Actin | GAPDH | GAPDH | Actin | EF1a | Actin |
| EF1a | 18S | UBQ | 18S | Actin | EF1a | |
© 2016 by the authors; licensee MDPI, Basel, Switzerland. This article is an open access article distributed under the terms and conditions of the Creative Commons Attribution (CC-BY) license (http://creativecommons.org/licenses/by/4.0/).
Share and Cite
Bao, W.; Qu, Y.; Shan, X.; Wan, Y. Screening and Validation of Housekeeping Genes of the Root and Cotyledon of Cunninghamia lanceolata under Abiotic Stresses by Using Quantitative Real-Time PCR. Int. J. Mol. Sci. 2016, 17, 1198. https://doi.org/10.3390/ijms17081198
Bao W, Qu Y, Shan X, Wan Y. Screening and Validation of Housekeeping Genes of the Root and Cotyledon of Cunninghamia lanceolata under Abiotic Stresses by Using Quantitative Real-Time PCR. International Journal of Molecular Sciences. 2016; 17(8):1198. https://doi.org/10.3390/ijms17081198
Chicago/Turabian StyleBao, Wenlong, Yanli Qu, Xiaoyi Shan, and Yinglang Wan. 2016. "Screening and Validation of Housekeeping Genes of the Root and Cotyledon of Cunninghamia lanceolata under Abiotic Stresses by Using Quantitative Real-Time PCR" International Journal of Molecular Sciences 17, no. 8: 1198. https://doi.org/10.3390/ijms17081198
APA StyleBao, W., Qu, Y., Shan, X., & Wan, Y. (2016). Screening and Validation of Housekeeping Genes of the Root and Cotyledon of Cunninghamia lanceolata under Abiotic Stresses by Using Quantitative Real-Time PCR. International Journal of Molecular Sciences, 17(8), 1198. https://doi.org/10.3390/ijms17081198