Article

Genome-Wide Analysis of Codon Usage Bias in Epichloë festucae

State Key Laboratory of Grassland Agro-Ecosystems, College of Pastoral Agriculture Science and Technology, Lanzhou University, Lanzhou 730000, China
*
Author to whom correspondence should be addressed.
Int. J. Mol. Sci. 2016, 17(7), 1138; https://doi.org/10.3390/ijms17071138
Submission received: 4 April 2016 / Revised: 24 June 2016 / Accepted: 8 July 2016 / Published: 15 July 2016
(This article belongs to the Section Biochemistry)

Abstract

:
Analysis of codon usage data has both practical and theoretical applications in understanding the basics of molecular biology. Differences in codon usage patterns among genes reflect variations in local base compositional biases and the intensity of natural selection. Recently, there have been several reports related to codon usage in fungi, but little is known about codon usage bias in Epichloë endophytes. The present study aimed to assess codon usage patterns and biases in 4870 sequences from Epichloë festucae, which may be helpful in revealing the constraint factors such as mutation or selection pressure and improving the bioreactor on the cloning, expression, and characterization of some special genes. The GC content with 56.41% is higher than the AT content (43.59%) in E. festucae. The results of neutrality and effective number of codons plot analyses showed that both mutational bias and natural selection play roles in shaping codon usage in this species. We found that gene length is strongly correlated with codon usage and may contribute to the codon usage patterns observed in genes. Nucleotide composition and gene expression levels also shape codon usage bias in E. festucae. E. festucae exhibits codon usage bias based on the relative synonymous codon usage (RSCU) values of 61 sense codons, with 25 codons showing an RSCU larger than 1. In addition, we identified 27 optimal codons that end in a G or C.

Graphical Abstract

1. Introduction

The introduction the genetic code refers to the sequences of DNA and RNA nucleotides that determine amino acid sequences in proteins. The genetic code comprises 64 codons encoding 20 amino acids. Therefore, some amino acids are encoded by more than one codon. Different codons that encode the same amino acid are termed synonymous codons. Although their corresponding tRNAs may differ in speed due to their relative abundances, all codons are recognized by the ribosome. The most amino acids can be encoded by more than one codons. Synonymous codons do not appear randomly throughout the genome, however, a phenomenon that is referred to as codon usage bias [1,2]. Differences in codon usage can modulate the efficiency and accuracy of protein production while maintaining the same protein sequence.
Studies of codon usage have determined that several factors may influence codon usage patterns, including mutational bias and natural selection. Analysis of codon usage patterns sheds light on the molecular biology of gene regulation, gene expression, secondary protein structure, selective transcription, and the external environment. Among these, the major factors that are responsible for codon usage variation among different organisms are compositional constraints under mutational pressure and natural selection [3,4,5,6].
The codon biases of several model species have been analyzed, including Escherichia coli, Drosophila melanogaster, Saccharomyces cerevisiae, Arabidopsis thaliana, dengue virus, and humans [1,7,8,9,10,11,12,13,14]. However, little is known about codon usage bias in Epichloë endophytes, a group of clavicipitaceous fungi (Clavicipitaceae, Ascomycota) that live in systemic symbioses with cool-season grasses of the subfamily Pooideae [15,16]. This mutualistic symbiotic association confers on the host a number of bioprotective benefits by producing secondary fungal metabolites that alter host metabolism [17]. While Epichloë endophytes provide many benefits for their hosts, including both abiotic and biotic factors [18,19], as well as enhanced growth [20,21], the alkaloids produced by the symbiosis can cause health problems for grazing livestock [22]. E. festucae is a biotrophic fungus that systemically colonizes the aerial tissues of the cool-season grasses Festuca, Lolium, and Koeleria spp. to form a highly structured symbiotic hyphal network [23,24,25,26]. E. festucae has been adopted as the model experimental system for the study of the cellular mechanisms underlying endophyte–grass symbiotic interactions [24,26]. Recently, the genome sequences of two E. festucae strains were released [27]. In this study, we analyzed the codon usage bias of E. festucae and its relationship with other genome features. Our results lay the groundwork for analyses of genetic evolution in E. festucae.

2. Results and Discussion

Codon usage bias in genes is an important evolutionary parameter and has been increasingly documented in a wide range of organisms from prokaryotes to eukaryotes. Two theories—neutral evolution and natural selection—have been used to explain the origin of codon usage bias [3,28,29]. If a synonymous mutation occurs at the third codon position, it should result in a random codon choice, with GC and AT being substituted proportionally among the degenerate codons in a gene [30,31]. In contrast, if translational selection pressure influences codon usage, the bias should be significantly positively correlated with expression levels, with some translation-preferred codons appearing more frequently than others. Previous studies have demonstrated that genes within a species often share similar codon usage patterns, though a few species, such as Bacillus subtilis, appear to refute this [32].

2.1. Base Composition of E. festucae

The GC content for the total 4870 genes varies from 46.43% ± 5.80% (GC2) to 64.11% ±10.16% (GC3), with a mean value of 56.41% ± 4.6% being distributed mainly between 24.80% and 73.00% (Table 1), the GC12 being distributed mainly between 40.00% and 60.00% (Figure 1). The greatest differences of GC content are found in GC2 (46.43% ± 5.80%) and GC3 (64.11% ± 10.16%), where most synoymous mutations occur [33].

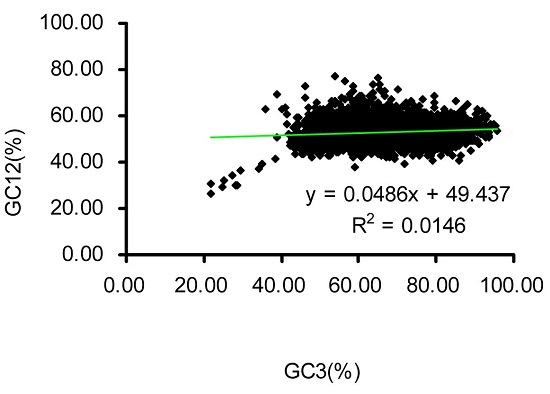
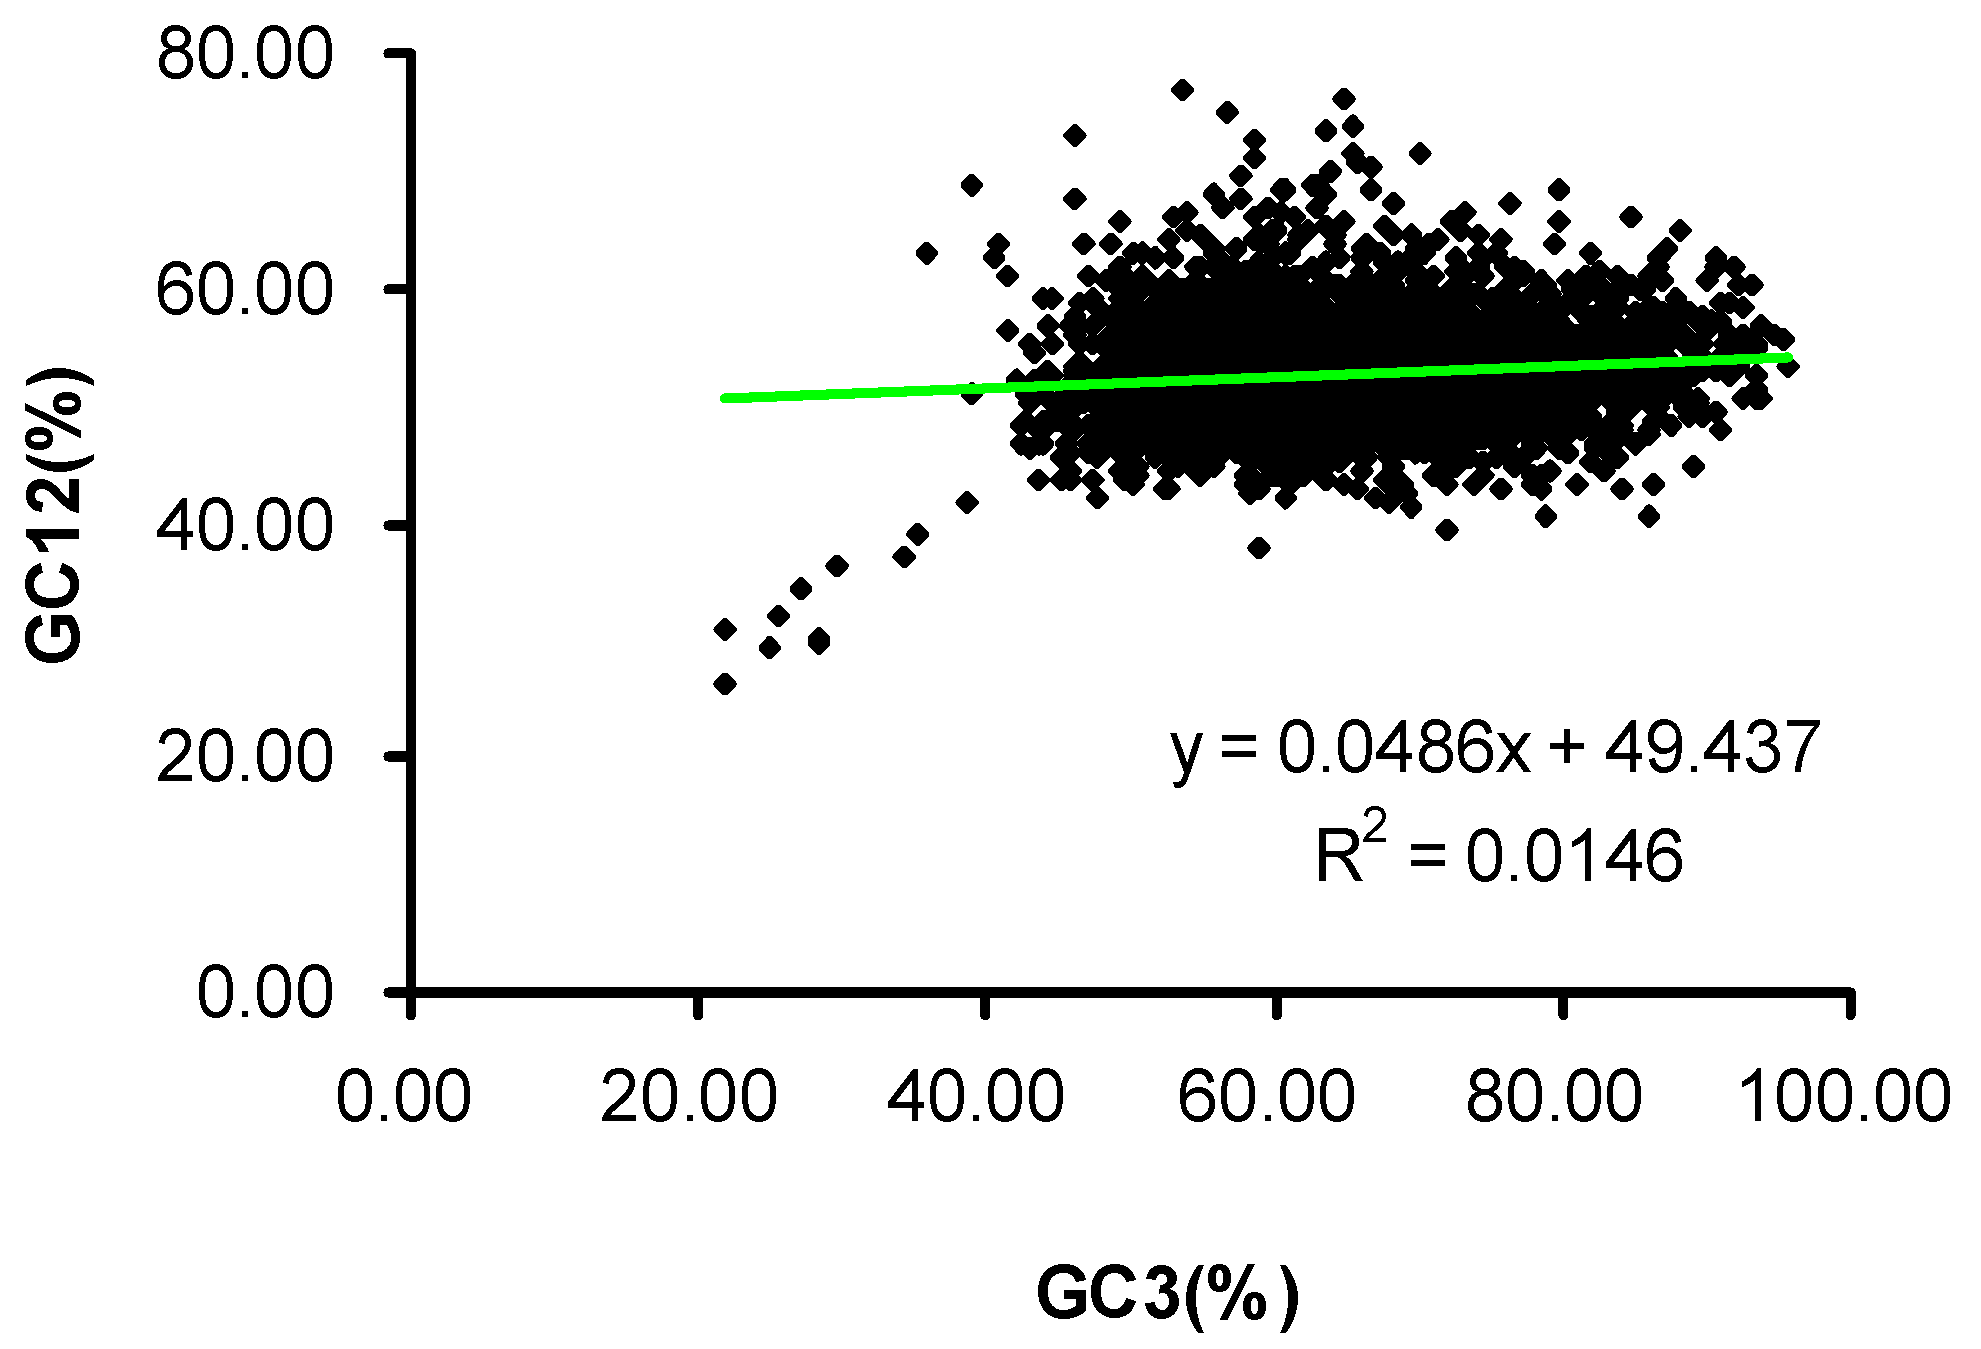
2.2. Neutrality Plot

A neutrality plot revealed the relationship between GC12 and GC3 (Figure 1), which may reflect the mutation-selection equilibrium that shapes codon usage in E. festucae. The neutrality plot shows that E. festucae genes exhibit a wide range of GC3 values, ranging from 21.82% to 91.67%. There was a significant positive correlation between GC12 and GC3 (r = 0.121, p < 0.01). The slope of the regression line for all coding sequences was 0.0486. The results reveal that the effect of mutation pressure is only 4.86%, it means the codon bias was affected a little by neutral evolution, while the influence from other factors, for example natural selection, is 95.14%. In the genome of E. festucae, there was a significant correlation (p < 0.01) and the regression coefficient was 0.121. This significantly positive correlation in neutrality plots indicated that the effect on the GC contents by the intra genomic GC mutation bias was similar at all three codon positions [33]. Accordingly, mutation pressure (nucleotide bias) only plays a minor role in shaping the codon bias, whereas natural selection probably dominates the codon bias. These results suggest that an effect of natural selection is present at all codon positions.

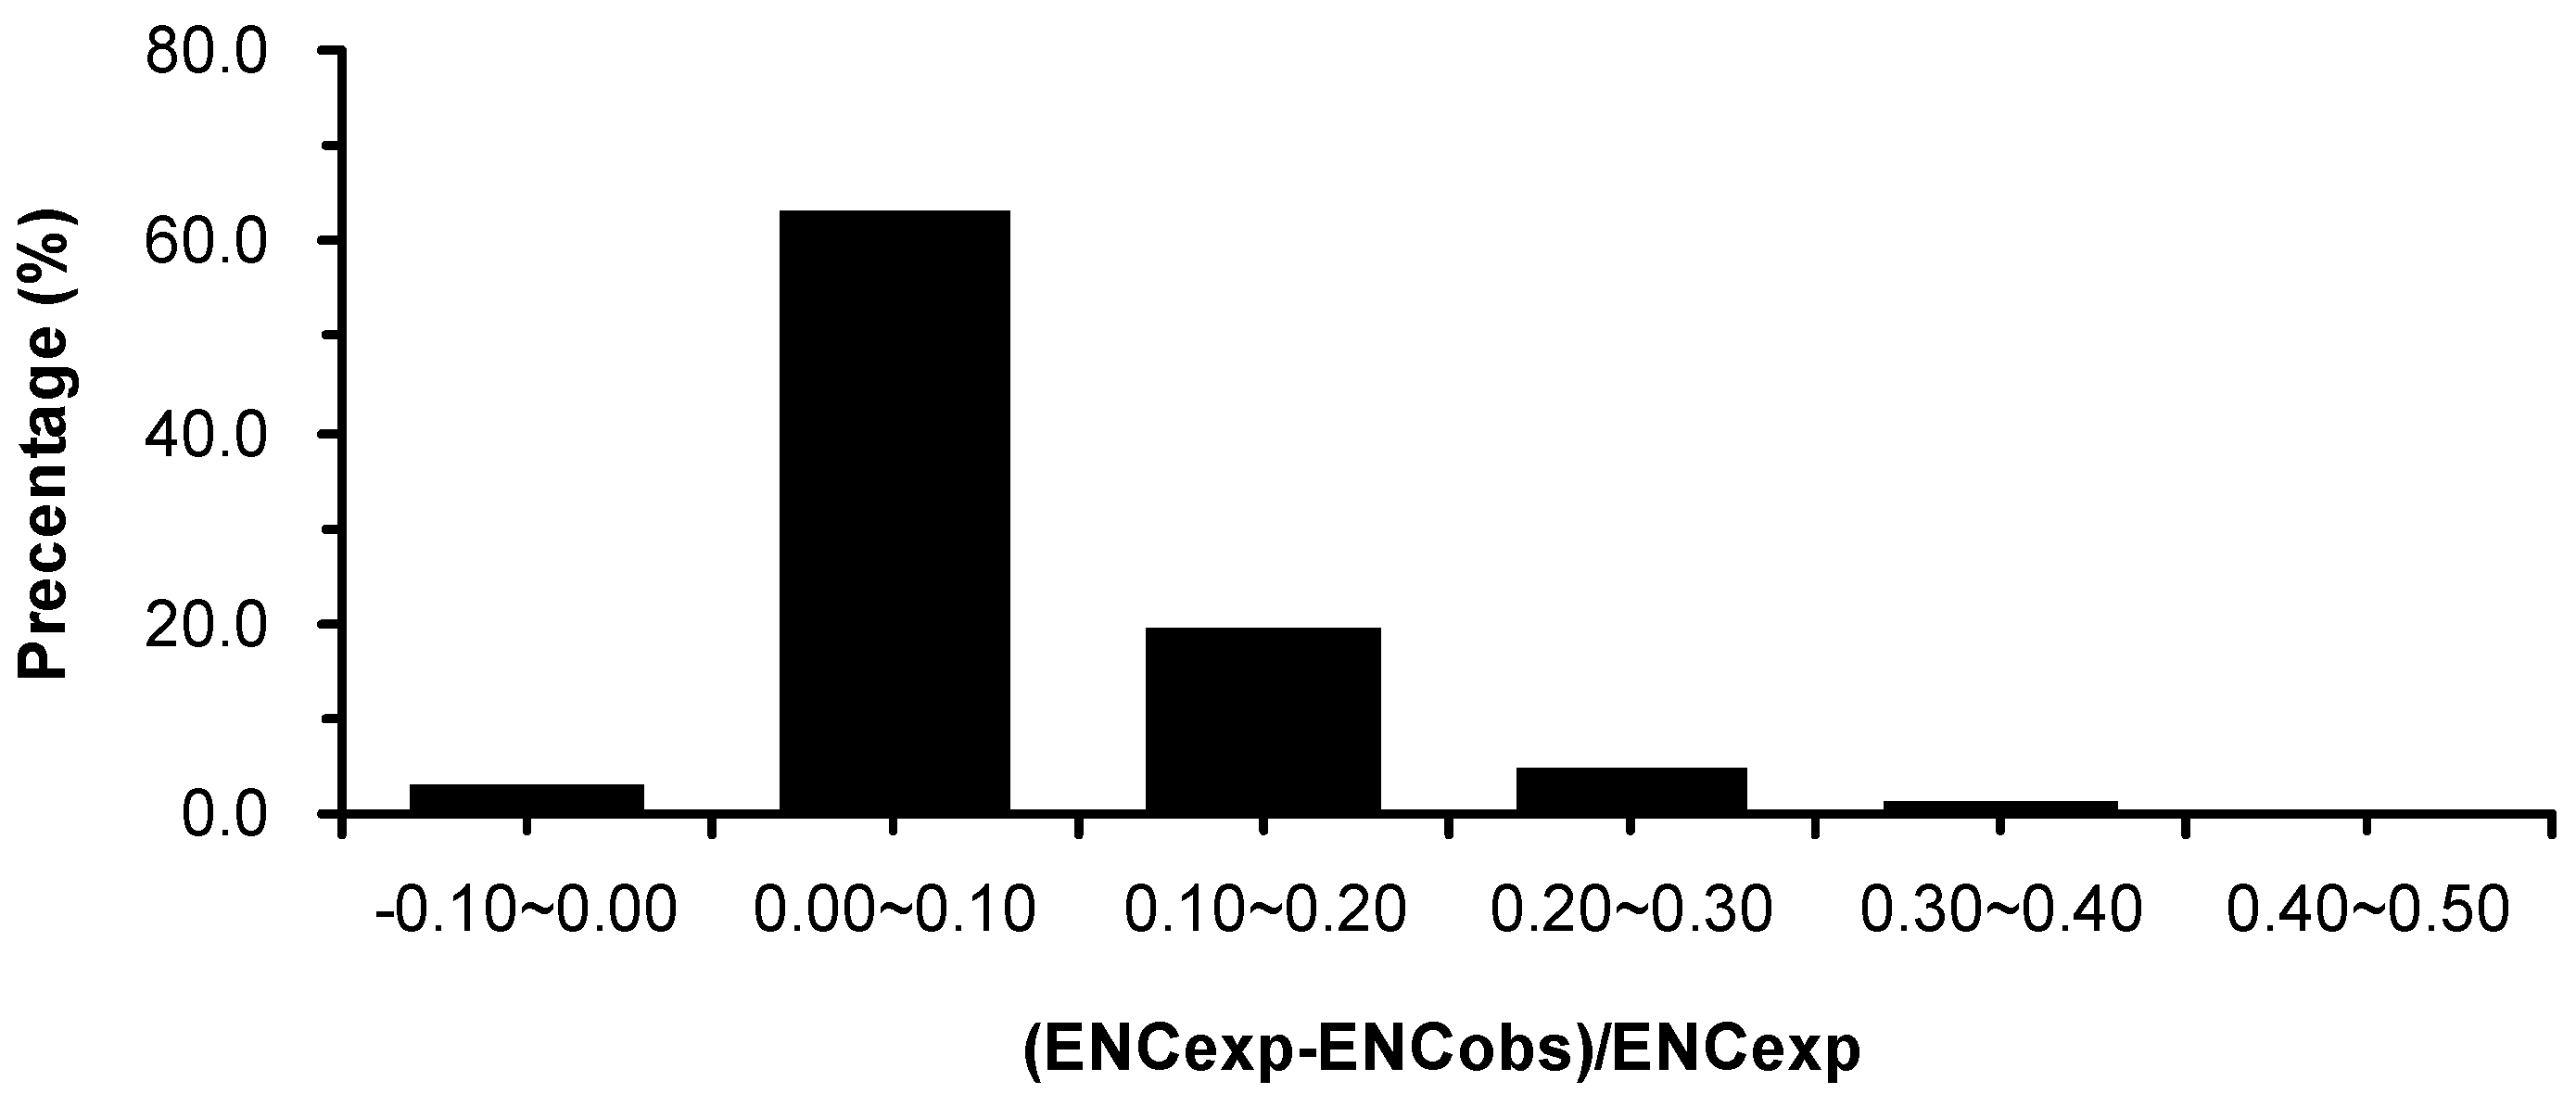
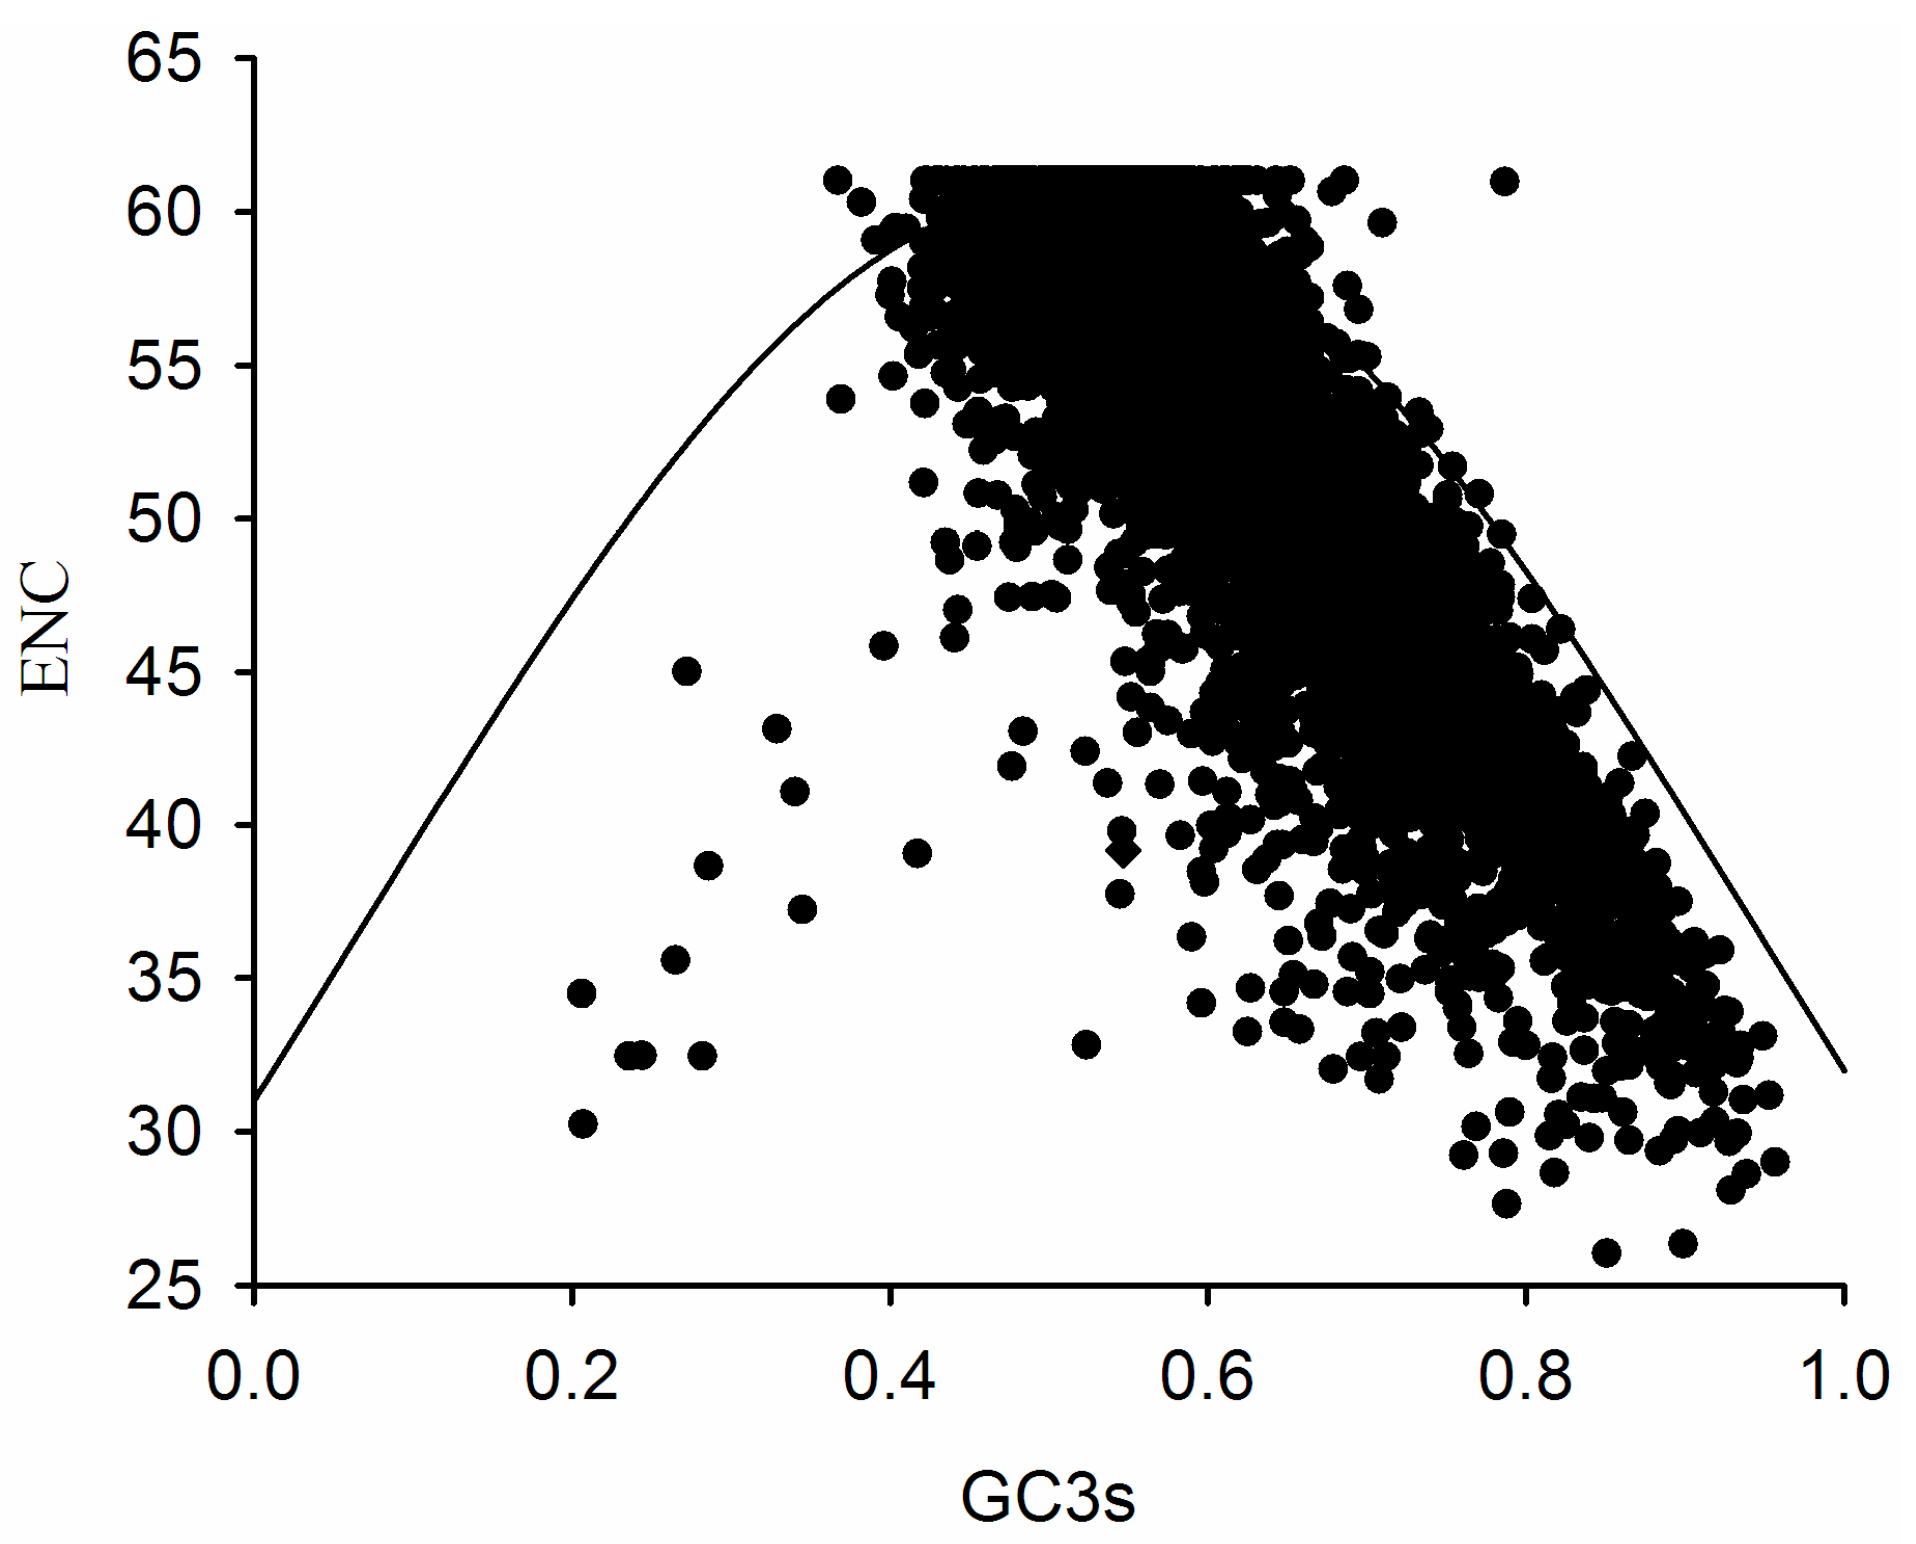
2.3. Association between Effective Number of Codons (ENC) and GC3s

The ENC in E. festucae genes ranged from 26.02 to 61.00, with an average of 51.58. Among the 4870 genes, only 132 genes exhibited high codon bias (ENC < 35), indicating that E. festucae genes, in general, reflect random codon usage without strong codon bias.
We estimated the difference between the observed and the expected ENC values for all genes using a plot of the frequency distribution of (ENCexp − ENCobs)/ENCexp (Figure 2). Most genes appear in the 0.0–0.1 range, suggesting that most observed ENC values are smaller than the ENC values expected based on the GC3s. These results show that E. festucae codon usage can be predicted from GC3s and that mutation plays a role in shaping codon usage.
An ENC plot was generated to explore the influence of GC3s on codon bias in E. festucae. If a gene is located on the expected curve, the codons of that gene are no bias. In this study, most ENC values were lower than expected and were located right below the curve (Figure 3), indicating that other factors, combined with mutation pressure, affects codon usage.
Kawabe and Miyashita [34] reported that the width of the GC3s distribution might be related to variation in the strength of directional selection against mutation pressure. In E. festucae, the GC3s distribution was between 0.4 and 1.0, indicating that E. festucae mainly evolved by mutation pressure.
The ENC is often used in population genetics research to measure the overall codon bias for an individual gene without knowledge of the optimal codons or a reference set of highly-expressed genes. From the ENC plot, a comparison of the observed distribution of genes with the expected distribution based on GC3s can reveal whether the codon biases of genes are influenced by mutation, but the mutation might not be the unique factor [30].
If a given gene is only subject to GC composition/mutation constraints, it will lie just above or below the standard curve. However, if a particular gene is under selective pressure for high expression, its ENC value will deviate more strongly from the expected value, and it will lie significantly below the curve. In the ENC plot, at a GC3 of approximately 0.4, there were some genes that displayed a more biased codon usage than expected based on the respective GC3s.
The translation efficiency constrains codon choice, which the frequency of codon usage is positively correlated with tRNA availability. The degree of codon usage bias is related to the level of gene expression, with highly-expressed genes exhibiting greater codon bias than lowly-expressed genes. Thus, highly-expressed genes reduce the use of these codons under the selection pressure as far as possible [35,36,37]. While the ENC values of high-expression genes will deviate more strongly from the expected value, this indicates that the translation efficiency is associated with small ENC.

2.4. Correlations between Codon Usage Bias, Hydrophobicity, Aromaticity, and Gene Length in E. festucae

To determine the relationship between relative codon bias and nucleotide composition in E. festucae, relationships between codon usage bias and hydrophobicity, aromaticity, and gene length were determined using multivariate correlation analysis (Table 2). The results showed that neither the GRAVY (General average hydropathicity) values nor the Aromo values were significantly correlated with GC3s. Aromo and GRAVY values did, however, exhibit significant negative correlations with ENC values (r = −0.034, p < 0.05; r = −0.164, p < 0.01, respectively), indicating that Aromo and GRAVY values are negatively correlated with codon usage bias in E. festucae. Gene length was positively correlated with ENC values (r = 0.227, p < 0.01), suggesting that gene length may contribute to codon usage bias. The ENC values were significantly positively correlated with the first axis (r = 0.836, p < 0.01) and the second axis (r = 0.193, p < 0.01) values, but were significantly negatively correlated with the GC3s (r = −0.808, p > 0.01) (Table 2). This suggests that ENC may be the main factor shaping codon bias in E. festucae.
The CAI (Codon adaptation index), which reflects the gene expression level, exhibited a significant positive correlation with GC (r = 0.018, p < 0.01), GC3 (r = 0.265, p < 0.01), GC3s (r = 0.266, p < 0.01), T3s (r = 0.045, p < 0.01), C3s (r = 0.526, p < 0.01), GRAVY (r = 0.080, p < 0.01), and Aromo (r = 0.144, p < 0.01) values. However, the CAI was significantly negatively correlated with the first and second axis and with other nucleotide composition indices (gene length, GC1, GC2, A3s, G3s, and ENC). These results indicate that both nucleotide composition and gene expression level are major factors shaping codon usage bias in E. festucae.
To statistically measure the relationship between CAI and codon usage bias in E. festucae, the correlation coefficients for the positions of the genes along the first four major axes were analyzed with their indices of amino acid usage in Table 3.
Though the CAI was negatively correlated with the first axis (r = −0.328, p < 0.01), the second axis (r = −0.623, p < 0.01), and the third axis (r = −0.159, p < 0.01), it was not significantly correlated with the fourth axis (r = 0.005, p > 0.05). GRAVY values were positively correlated with Aromo values (r = 0.420, p < 0.01) and were negatively correlated with all four axes. Aromo values exhibited a significant correlation with the first and second axis.
These results indicate that the most important factor in the amino-acid usage is hydrophobicity, followed by CAI and aromaticity. This provides strong evidence for the inference that selection for translational efficiency of amino acids exists in E. festucae.
In addition, the correspondence analysis was used for some specific aromatic amino acids in codon usage in our research, but the effect of amino acid composition on the codon usage of the whole genome needs further study. Some researchers put forward research that ignores the composition of amino acids in the genome, while some study the codon usage, and some very important properties of correspondence analysis, such as rows weighting, are lost in the process, often diminishing the quantity of information to analyze, occasionally resulting in interpretation errors [38].
Four methods of correspondence analysis (CA) have been developed based on three kinds of input data for synonymous codon usage in 241 bacteria genomes: absolute codon frequency, relative codon frequency, and relative synonymous codon usage (RSCU), as well as within-group CA (WCA). The result shows that WCA is more effective than the other three methods in generating axes that reflect variations in synonymous codon usage, and WCA reveals sources that were previously unnoticed in some genomes, such as synonymous codon usage related to replication strand skew [39]. However, these studies are based on bacteria and some other prokaryote microbiology research, so we are not sure whether the WCA is also the best in eukaryotic organisms, such as fungi. In our study, we just select the CA based on the RSCU, which is widely used to identify major sources of variation in synonymous codon usage. As this is a first study of the codon usage in fungi of Epichloë endophytes, we want to find some common codon usage patterns in this fungi. It is necessary to compare more genomes between fungi and bacteria in future studies.

2.5. Optimal Codons in E. festucae

We found that E. festucae exhibits weak codon biases based on the RSCU values of the 61 sense codons (Table 4). Twenty-five codons were frequently used, such as CUC (RSCU = 1.84) and GGC (RSCU = 1.79), encoding Leu and Gly, respectively. Most frequent codons ended in a G or C, such as UUC, UUG, AUC, and GUC.
The total putative optimal codons of E. festucae are presented in Table 5. There is the synonymous codon of each amino acid, and the RSCU values and codon numbers with corresponding “high” and “low” expression date dataset behind each synonymous codon. The number of the synonymous codons of each amino acid is different, such as Ser, were encoded by four codons (UCU, UCC, UCA, and UCG); behind the corresponding codons are the RSCU values and codon numbers with corresponding “high” and “low” expression date dataset, respectively.
There are 27 optimal codons that end in a G (14/27) or C (13/27). This suggests that the preferred codons of E. festucae may be related to the GC content at third positions. There are three optimal codons (AGG, CGC, and CGG) encoding the amino acid Arg and two optimal codons each that encode Ala, Thr, Pro, Ser, Val, and Leu. These codons were significantly correlated with translation levels and may be useful in the design of degenerate primers and investigations into the evolutionary history of E. festucae.
Similarly to E. festucae, the optimal codons of Aspergillus nidulans [40], Oryza sativa [41], Triticum aestivum [33], Zea mays [42], and other higher plant nuclear genomes end in G or C, though this differs from results from E. coli, B. subtilis, Dictyostelium discoideum, D. melanogaster, Schizosaccharomyces pombe, S. cerevisiae, and other Saccharomyces spp. [7,43]. Close to one-third of all optimal codons end in a uracil, while others end in cytosine or guanine. This phenomenon may be related to their origin and relatives.
In summary, codon usage bias in E. festucae was found to be relatively weak and affected by nucleotide composition, mutational pressure, natural selection, and gene expression level. However, natural selection may play a major role in shaping codon usage variation, manifesting itself in weaker codon usage bias. In addition, the codon preferences of E. festucae were more biased than those of A. thaliana, E. coli, or Caenorhabditis elegans [44].
Currently, no complete Epichloë sp. mitochondrial genome is available in GenBank. As more complete mitochondrial and nuclear genomes of Epichloë species are released, further comparative analyses will be possible, allowing for investigation of the genetic and environmental constraints that influence codon usage patterns at the intra- and inter-species levels. In addition, because Epichloë is an endophytic fungus, different strains possess different host specificities. Comparing the differences in codon usage of different Epichloë strains from the same species may explain these host specificities. Moreover, comparisons of codon usage between the mitochondrial and nuclear genomes in the same Epichloë strain may enable exploration into the mechanism of interaction between Epichloë endophytes and host grasses.

3. Materials and Methods

The complete genome sequences of E. festucae (E2368, version 4) were obtained from Genome Projects at University of Kentucky [45]. CDS (Coding DNA sequences) were downloaded from GenBank [46]. To improve the quality of sequences and minimize sampling errors, CDS were filtered based on the following considerations: (i) the presence of a start codon at the beginning and a stop codon at the end of each CDS was required; (ii) each CDS had to be greater than 300 nucleotides in length; and (iii) duplicated sequences (exact matches) were detected and excluded from the dataset. As a result, 4870 CDS were used for further analysis.

3.1. Indices of Codon Usage and Synonymous Codon Usage Bias

The GC3s value is defined as the proportion of GC nucleotides at the third (variable) coding position of synonymous codons. It is a useful parameter for evaluating the degree of base composition bias.
Similarly, A3s, G3s, C3s, T3s, and GC3s values can also be deduced by analogy to quantify the usage of each base at synonymous third codon positions. The GC content of each full-length gene, as well as at first, second, and third codon positions (GC, GC1, GC2, and GC3, respectively) were also calculated. GC12 represents the average of GC1 and GC2 and was used for neutrality plot analysis.
Codon adaptation index (CAI) values are often used to measure the extent of bias toward codons that are known to be preferred in highly expressed genes [47]. With values ranging from 0 to 1.0, the higher the value is, the higher the expression level will be.
The effective number of codons (ENC) value, ranging from 20 to 61, is used to measure the magnitude of codon bias in individual genes. This is also a measure of the unevenness of use of codons across all amino acids in a protein. It is worth noting that ENC values are affected by base composition. If all codons for each amino acid were used equally (completely random usage), the ENC would be 61, while if a single codon was used for each amino acid, the ENC would be 20 [30].
The relative synonymous codon usage (RSCU) is the ratio of the observed frequency of codons relative to the expected frequency of the codon under a uniform synonymous codon usage. An RSCU value equal to 1 reflects that codon use is not biased. RSCU values less than 1.0 occur when the observed frequency is less than the expected frequency, and vice versa [48].
General average hydropathicity (GRAVY) values represent the sum of the hydropathy values of all amino acids in the gene product divided by the number of residues in the sequence [49]. The more negative the GRAVY value, the more hydrophilic the protein, while the more positive the GRAVY value, the more hydrophobic the protein.
Aromo values denote the frequency of aromatic amino acids (Phe, Tyr, Trp) in the hypothetical translated gene product. The Aromo and GRAVY values have been used to quantify the major correspondence analysis (COA) trends in the amino acid composition of E. coli genes [40].

3.2. ENC Plot

The ENC plot (a plot of ENC vs. GC3s) is a strategic investigation into patterns of synonymous codon usage, providing a visual display of the main features of codon usage patterns for a number of genes. Values of ENC were always within the range from 20 (only one codon effectively used for each amino acid) to 61 (codons used randomly). The expected ENC values were calculated as follows [30]:
ENCexp = 2 + S + (29/(S2 +(1 − S2)))
where S is the frequency of G + C (i.e., GC3s).

3.3. Neutrality Plot

A neutrality plot [50] can be used to analyze factors influencing codon usage patterns and biases, including estimation and characterization of the relationships between GC12 and GC3.
A neutrality plot regression with a slope of 0 indicates no effects of directional mutation pressure (complete selective constraints), while a slope of 1 is indicative of complete neutrality [50].

3.4. Determination of Optimal Codons

The independent optimal codon index can be used as a standard to distinguish between strong and weak translation-coupled biases in datasets. In this study, we ordered the sequences by their ENC ratio values. Using the 5% of sequences from either end of the ordered dataset, we formed two subsets: the “high bias” dataset comprised genes with higher overall ENC ratios, suggesting that their observed ENC values were far from those expected based on GC content, while the “low bias” dataset comprised genes with the lowest ENC ratios [33]. When the difference between the RSCU of “high bias” and “low bias” dataset (ΔRSCU) was larger than 0.08, the corresponding codon was defined as the optimal codon [41].

3.5. Correspondence Analysis of RSCU

Correspondence analysis (COA) is a widely used method in multivariate statistical analysis of codon usage patterns. While there are a total of 59 synonymous codons (excluded three termination codons, methionine (Met) and tryptophan (Trp)), in order to generate a COA of RSCU, the degrees of freedom were reduced to 40 after removing variations caused by the unequal usage of amino acids [44].

3.6. Software Used

Using Mobyle server [51], including Codon W (Ver.1.4.4) [52], we selected yeast as the model in this research. CHIPS [53] and CUSP [54] were used to calculate the indices of codon usage bias.

3.7. Statistical Analysis

Correlations between codon usage and various indices were carried out using SPSS 19.0 (SPSS Inc., Chicago, IL, USA). Effects were corrected for multiple testing with a Tukey-Kramer test, with p ≤ 0.01 and p ≤ 0.05 as significance levels, respectively [55]. All analyses were performed with SPSS, version 22.0 and GraphPad Prism 5 (GraphPad Software, San Diego, CA, USA).

Acknowledgments

This study is supported by National Basic Research Program of China (2014CB138702), the National Natural Science Foundation of China (31372366; 31502001) and Program for Changjiang Scholars and Innovative Research Team in University of China (IRT13019).

Author Contributions

Xiuzhang Li, Hui Song and Chunjie Li conceived and designed the experiments; Xiuzhang Li performed the experiments; Xiuzhang Li, Yu Kuang, Shuihong Chen and Pei Tian analyzed the data; Chunjie Li and Zhibiao Nan contributed analysis tools; Xiuzhang Li and Hui Song wrote the paper.

Conflicts of Interest

The authors declare no conflict of interest.

References

  1. Grantham, R.; Gautier, C.; Gouy, M.; Mercier, R.; Pave, A. Codon catalog usage and the genome hypothesis. Nucleic Acids Res. 1980, 8, 197–197. [Google Scholar]
  2. Martin, A.; Bertranpetit, J.; Oliver, J.; Medina, J. Variation in g + c-content and codon choice: Differences among synonymous codon groups in vertebrate genes. Nucleic Acids Res. 1989, 17, 6181–6189. [Google Scholar] [CrossRef]
  3. Sharp, P.M.; Li, W.H. Codon usage in regulatory genes in Escherichia coli does not reflect selection for ‘rare’codons. Nucleic Acids Res. 1986, 14, 7737–7749. [Google Scholar] [CrossRef] [PubMed]
  4. Duret, L.; Mouchiroud, D. Expression pattern and, surprisingly, gene length shape codon usage in Caenorhabditis, Drosophila, and Arabidopsis. Proc. Natl. Acad. Sci. USA 1999, 96, 4482–4487. [Google Scholar] [CrossRef] [PubMed]
  5. Gu, W.; Zhou, T.; Ma, J.; Sun, X.; Lu, Z. Analysis of synonymous codon usage in sars coronavirus and other viruses in the nidovirales. Virus Res. 2004, 101, 155–161. [Google Scholar] [CrossRef] [PubMed]
  6. Van der, L.; Marx, G.; de Farias, S.T. Correlation between codon usage and thermostability. Extremophiles 2006, 10, 479–481. [Google Scholar] [CrossRef] [PubMed]
  7. Sharp, P.M.; Cowe, E.; Higgins, D.G.; Shields, D.C.; Wolfe, K.H.; Wright, F. Codon usage patterns in Escherichia coli, Bacillus subtilis, Saccharomyces cerevisiae, Schizosaccharomyces pombe, Drosophila melanogaster and Homo sapiens; a review of the considerable within-species diversity. Nucleic Acids Res. 1988, 16, 8207–8211. [Google Scholar] [CrossRef] [PubMed]
  8. Chiapello, H.; Lisacek, F.; Caboche, M.; Henaut, A. Codon usage and gene function are related in sequences of Arabidopsis thaliana. Gene 1998, 209, GC1–GC38. [Google Scholar] [CrossRef]
  9. Moriyama, E.N.; Powell, J.R. Gene length and codon usage bias in Drosophila melanogaster, Saccharomyces cerevisiae and Escherichia coli. Nucleic Acids Res. 1998, 26, 3188–3193. [Google Scholar] [CrossRef] [PubMed]
  10. Sueoka, N.; Kawanishi, Y. DNA g + c content of the third codon position and codon usage biases of human genes. Gene 2000, 261, 53–62. [Google Scholar] [CrossRef]
  11. Marais, G.; Mouchiroud, D.; Duret, L. Does recombination improve selection on codon usage? Lessons from nematode and fly complete genomes. Proc. Natl. Acad. Sci. USA 2001, 98, 5688–5692. [Google Scholar] [CrossRef] [PubMed]
  12. Zhou, T.; Gu, W.; Ma, J.; Sun, X.; Lu, Z. Analysis of synonymous codon usage in h5n1 virus and other influenza a viruses. Biosystems 2005, 81, 77–86. [Google Scholar] [CrossRef] [PubMed]
  13. Chen, H.T.; Gu, Y.X.; Liu, Y.S. Analysis of synonymous codon usage in dengue viruses. J. Anim. Vet. Adv. 2013, 12, 88–98. [Google Scholar]
  14. Butt, A.M.; Nasrullah, I.; Tong, Y. Genome-wide analysis of codon usage and influencing factors in chikungunya viruses. PLoS ONE 2014, 9, e90905. [Google Scholar] [CrossRef] [PubMed]
  15. Schardl, C.L.; Balestrini, R.; Florea, S.; Zhang, D.X.; Scott, B. Epichloë endophytes: Clavicipitaceous symbionts of grasses. In Plant Relationships; Springer: London, UK, 2009; pp. 275–306. [Google Scholar]
  16. Leuchtmann, A.; Bacon, C.W.; Schardl, C.L.; White, J.F.; Tadych, M. Nomenclatural realignment of neotyphodium species with genus Epichloë. Mycologia 2014, 106, 202–215. [Google Scholar] [CrossRef] [PubMed]
  17. Tanaka, A.; Takemoto, D.; Chujo, T.; Scott, B. Fungal endophytes of grasses. Curr. Opin. Plant Biol. 2012, 15, 462–468. [Google Scholar] [CrossRef] [PubMed]
  18. Clay, K.; Schardl, C. Evolutionary origins and ecological consequences of endophyte symbiosis with grasses. Am. Nat. 2002, 160, S99–S127. [Google Scholar] [CrossRef] [PubMed]
  19. Hahn, H.; McManus, M.T.; Warnstorff, K.; Monahan, B.J.; Young, C.A.; Davies, E.; Tapper, B.A.; Scott, B. Neotyphodium fungal endophytes confer physiological protection to perennial ryegrass (Lolium perenne L.) subjected to a water deficit. Environ. Exp. Bot. 2008, 63, 183–199. [Google Scholar] [CrossRef]
  20. Schardl, C.L.; Leuchtmann, A.; Spiering, M.J. Symbioses of grasses with seedborne fungal endophytes. Annu. Rev. Plant Biol. 2004, 55, 315–340. [Google Scholar] [CrossRef] [PubMed]
  21. Schardl, C.L.; Grossman, R.B.; Nagabhyru, P.; Faulkner, J.R.; Mallik, U.P. Loline alkaloids: Currencies of mutualism. Phytochemistry 2007, 68, 980–996. [Google Scholar] [CrossRef] [PubMed]
  22. Latch, G. An overview of Neotyphodium-grass interactions. In Neotyphodium/Grass Interactions; Springer: London, UK, 1997; pp. 1–11. [Google Scholar]
  23. Leuchtmann, A.; Schardl, C.L.; Siegel, M.R. Sexual compatibility and taxonomy of a new species of Epichloë symbiotic with fine fescue grasses. Mycologia 1994, 86, 802–812. [Google Scholar] [CrossRef]
  24. Schardl, C.L. Epichloë festucae and related mutualistic symbionts of grasses. Fungal Genet. Biol. 2001, 33, 69–82. [Google Scholar] [CrossRef] [PubMed]
  25. Christensen, M.J.; Bennett, R.J.; Schmid, J. Growth of Epichloë/Neotyphodium and p-endophytes in leaves of Lolium and Festuca grasses. Mycol. Res. 2002, 106, 93–106. [Google Scholar] [CrossRef]
  26. Scott, B.; Becker, Y.; Becker, M.; Cartwright, G. Morphogenesis, growth, and development of the grass symbiont Epichlöe festucae. In Morphogenesis and Pathogenicity in Fungi; Springer: London, UK, 2012; pp. 243–264. [Google Scholar]
  27. Schardl, C.L.; Young, C.A.; Uljana, H.; Amyotte, S.G.; Kalina, A.; Calie, P.J.; Fleetwood, D.J.; Haws, D.C.; Neil, M.; Birgitt, O. Plant-symbiotic fungi as chemical engineers: Multi-genome analysis of the clavicipitaceae reveals dynamics of alkaloid loci. PLoS Genet. 2013, 9, e1003323. [Google Scholar] [CrossRef] [PubMed]
  28. Bulmer, M. The selection-mutation-drift theory of synonymous codon usage. Genetics 1991, 129, 897. [Google Scholar] [PubMed]
  29. Nakamura, Y.; Gojobori, T.; Ikemura, T. Codon usage tabulated from the international DNA sequence databases; its status 1999. Nucleic Acids Res. 1999, 27, 292. [Google Scholar] [CrossRef] [PubMed]
  30. Wright, F. The ‘effective number of codons’ used in a gene. Gene 1990, 87, 23–29. [Google Scholar] [CrossRef]
  31. Fuglsang, A. The ‘effective number of codons’ revisited. Biochem. Bioph. Res. Commun. 2004, 317, 957–964. [Google Scholar] [CrossRef] [PubMed]
  32. Shields, D.C.; Sharp, P.M. Synonymous codon usage in bacillus subtilis reflects both translational selection and mutational biases. Nucleic Acids Res. 1987, 15, 8023–8040. [Google Scholar] [CrossRef] [PubMed]
  33. Zhang, W.J.; Zhou, J.; Li, Z.F.; Wang, L.; Gu, X.; Zhong, Y. Comparative analysis of codon usage patterns among mitochondrion, chloroplast and nuclear genes in Triticum aestivum L. J. Integr. Plant Biol. 2007, 49, 246–254. [Google Scholar] [CrossRef]
  34. Kawabe, A.; Miyashita, N.T. Patterns of codon usage bias in three dicot and four monocot plant species. Genes Genet. Syst. 2003, 78, 343–352. [Google Scholar] [CrossRef] [PubMed]
  35. Ikemura, T. Correlation between the abundance of Escherichia coli transfer rnas and the occurrence of the respective codons in its protein genes. J. Mol. Biol. 1981, 146, 1–21. [Google Scholar] [CrossRef]
  36. Varenne, S.; Baty, D.; Verheij, H.; Shire, D.; Lazdunski, C. The maximum rate of gene expression is dependent in the downstream context of unfavourable codons. Biochimie 1989, 71, 1221–1229. [Google Scholar] [CrossRef]
  37. Li, H.; Luo, L.F. The relations of gene expression level with codon usage and its prediction. J. Inner Mong. Univ. (Nat. Sci.) 1995, 26, 544–561. [Google Scholar]
  38. Perrière, G.; Thioulouse, J. Use and misuse of correspondence analysis in codon usage studies. Nucleic Acids Res. 2002, 30, 4548–4555. [Google Scholar] [CrossRef] [PubMed]
  39. Suzuki, H.; Brown, C.J.; Forney, L.J.; Top, E.M. Comparison of correspondence analysis methods for synonymous codon usage in bacteria. DNA Res. 2008, 15, 357–365. [Google Scholar] [CrossRef] [PubMed]
  40. Lloyd, A.T.; Sharp, P.M. Codon usage in Aspergillus nidulans. Mol. Genet. Genom. 1991, 230, 288–294. [Google Scholar] [CrossRef]
  41. Liu, Q.P.; Feng, Y.; Zhao, X.A.; Dong, H.; Xue, Q.Z. Synonymous codon usage bias in Oryza sativa. Plant Sci. 2004, 167, 101–105. [Google Scholar] [CrossRef]
  42. Liu, H.; He, R.; Zhang, H.; Huang, Y.; Tian, M.; Zhang, J. Analysis of synonymous codon usage in Zea mays. Mol. Biol. Rep. 2010, 37, 677–684. [Google Scholar] [CrossRef] [PubMed]
  43. Sharp, P.M.; Cowe, E. Synonymous codon usage in Saccharomyces cerevisiae. Yeast 1991, 7, 657–678. [Google Scholar] [CrossRef] [PubMed]
  44. Jia, X.; Liu, S.Y.; Zheng, H.; Li, B.; Qi, Q.; Wei, L.; Zhao, T.Y.; He, J.; Sun, J.C. Non-uniqueness of factors constraint on the codon usage in bombyx mori. BMC Genom. 2015, 16, 1. [Google Scholar] [CrossRef] [PubMed]
  45. Genome Projects at University of Kentucky. Available online: http://csbio-l.csr.uky.edu/endophyte/ (accessed on 14 July 2016).
  46. GenBank. Available online: http://www.ncbi.nlm.nih.gov (accessed on 14 July 2016).
  47. Jansen, R.; Bussemaker, H.J.; Gerstein, M. Revisiting the codon adaptation index from a whole-genome perspective: Analyzing the relationship between gene expression and codon occurrence in yeast using a variety of models. Nucleic Acids Res. 2003, 31, 2242–2251. [Google Scholar] [CrossRef] [PubMed]
  48. Sharp, P.M.; Li, W.H. The codon adaptation index-a measure of directional synonymous codon usage bias, and its potential applications. Nucleic Acids Res. 1987, 15, 1281–1295. [Google Scholar] [CrossRef] [PubMed]
  49. Kyte, J.; Doolittle, R.F. A simple method for displaying the hydropathic character of a protein. J. Mol. Biol. 1982, 157, 105–132. [Google Scholar] [CrossRef]
  50. Sueoka, N. Directional mutation pressure and neutral molecular evolution. Proc. Natl. Acad. Sci. USA 1988, 85, 2653–2657. [Google Scholar] [CrossRef] [PubMed]
  51. Mobyle server. Available online: http://mobyle.pasteur.fr (accessed on 14 July 2016).
  52. Codon W. Available online: http://codonw.sourceforge.net/culong.html#CodonW (accessed on 14 July 2016).
  53. CHIPS. Available online: http://mobyle.pasteur.fr/cgi-bin/portal.py#forms::chips (accessed on 14 July 2016).
  54. CUSP. Available online: http://mobyle.pasteur.fr/cgi-bin/portal.py#forms::cusp (accessed on 14 July 2016).
  55. Kramer, C.Y. Extension of multiple range tests to group means with unequal numbers of replications. Biometrics 1956, 12, 307–310. [Google Scholar] [CrossRef]
Figure 1. Neutrality plots (GC12 vs. GC3).GC12 stands for the average value of GC content in the first and second position of the codons (GC1 and GC2). While GC3 refers to the GC content in the third position. The solid line is the linear regression of GC12 against GC3, R2 = 0.0146, p < 0.01.
Ijms 17 01138 g001
Figure 2. The frequency distribution of effective number of codons (ENC) ratio.
Ijms 17 01138 g002
Figure 3. Effective number of codons ENC-plot showing relationship between ENC and GC3s.
Ijms 17 01138 g003
Table 1. Base composition, ENC, Gravy, and Aromo of codons from Epichloë Festucae.
ClassGenesCodonsGC (%)GC1 (%)GC2 (%)GC3 (%)GC3s (%)T3s (%)C3s (%)A3s (%)G3s (%)GravyAroENCCAI
Total4870249825556.41 ± 4.6058.68 ± 5.3046.43 ± 5.8064.11 ± 10.1662.86 ± 10.5223.91 ± 7.4143.85 ± 9.9921.13 ± 7.533.66 ± 7.37−0.41 ± 0.370.07 ± 0.0251.58 ± 7.140.22 ± 0.04
Table 2. Correlation coefficients between the positions of genes along the first two major axes with index of total genes’ codon usage and synonymous codon usage bias.
LengthGCGC1GC2GC3GC3SA3ST3SC3SG3SGRAVYAROMOENCCAIAXIS1
GC−0.191 **
GC1−0.041 **0.568 **
GC2−0.069 **0.443 **0.085 **
GC3−0.199 **0.808 **0.201 **−0.013
GC3S−0.200 **0.816 **0.214 **−0.0040.998 **
A3S0.189 **−0.710 **−0.181 **−0.028 *−0.854 **−0.857 **
T3S0.160 **−0.753 **−0.196 **−0.092 **−0.868 **−0.868 **0.508 **
C3S−0.152 **0.635 **0.120 **−0.063 **0.835 **0.838 **−0.760 **−0.671 **
G3S−0.117 **0.393 **0.168 **−0.194 **0.557 **0.555 **−0.383 **−0.530 **0.060 **
GRAVY−0.065 **0.033 *−0.180 **−0.138 **0.217 **0.207 **−0.336 **−0.114 **0.198 **−0.063 **
AROMO−0.040 **−0.195 **−0.412 **−0.317 **0.130 **0.106 **−0.129 **−0.0280.163 **0.0040.420 **
ENC0.227 **−0.673 **−0.211 **−0.008−0.799 **−0.808 **0.786 **0.608 **−0.807 **−0.252 **−0.164 **−0.034 *
CAI−0.0240.108 **−0.015−0.193 **0.265 **0.266 **−0.455 **0.045 **0.526 **−0.176 **0.080 **0.144 **−0.402 **
AXIS10.195 **−0.813 **−0.231 **−0.023−0.970 **−0.972 **0.850 **0.830 **−0.884 **−0.436 **−0.182 **−0.087 **0.836 **−0.328 **
AXIS2−0.050 **0.119 **0.034 *0.042 **0.120 **0.115 **0.177 **−0.374 **−0.345 **0.690 **−0.054 **−0.0250.193 **−0.613 **0.000
** p < 0.01; * p < 0.05.
Table 3. Correlation coefficients between the positions of genes along the first four major axes with an index of total genes’ amino acid usage.
CAIGRAVYAromoAxis1Axis2Axis3
Gravy0.080 **
Aromo0.144 **0.420 **
Axis1−0.328 **−0.182 **−0.087 **
Axis2−0.613 **−0.054 **−0.025 *0.000
Axis3−0.159 **−0.056 **0.0070.0000.001
Axis40.005−0.008−0.036 **−0.003−0.0010.002
** p < 0.01; * p < 0.05.
Table 4. Codon usage of Epichloë festucae.
Amino AcidCodonTotal CountRSCU
PheUUU31,3610.71
UUC53,8071.28
LeuUUA85390.22
UUG39,2891.05
CUU32,5670.86
CUC63,0091.84
CUA15,9080.42
CUG57,1441.61
IleAUU36,9530.97
AUC56,3831.61
AUA14,9800.42
MetAUG56,5641.00
ValGUU33,0110.83
GUC63,5831.69
GUA15,2300.39
GUG41,2641.08
TyrUAU21,1650.68
UAC39,0271.29
CysUGU10,2310.59
UGC20,3931.25
HisCAU27,3930.81
CAC36,2891.16
GlnCAA44,0720.80
CAG59,5691.19
AsnAAU32,2510.70
AAC55,8291.29
LysAAA37,6950.63
AAG80,1721.37
AspGAU60,6660.79
GAC87,7561.21
GluGAA60,9780.76
GAG89,3201.23
SerUCU33,3260.87
UCC44,2911.33
UCA30,2420.76
UCG39,2741.14
ProCCU35,4000.86
CCC49,7101.37
CCA35,3720.83
CCG36,1670.93
ThrACU27,3620.71
ACC46,5021.30
ACA31,6120.81
ACG40,7911.17
AlaGCU49,2810.84
GCC88,2691.58
GCA44,1420.75
GCG45,4060.83
TERUGA24451.39
UAA12710.74
UAG15290.87
TrpUGG34,1010.94
ArgCGU20,7310.73
CGC40,8801.55
CGA33,8361.13
CGG23,8060.86
AGA24,2250.84
AGG23,4890.89
GlyGGU35,3580.75
GGC79,0151.79
GGA35,6770.78
GGG28,0010.67
SerAGU21,3670.57
AGC46,1721.32
Codon indicates synonymous codons; Total Count indicates the number of the synonymous codons; RSCU indicates relative synonymous coden usage, the preferentially-used codons are underlined.
Table 5. Optimal codons of genes in E. festucae.
Amino AcidCodonHigh RSCUNLow RSCUN
PheUUU0.4112460.974176
UUC *1.5948741.034414
LeuUUA0.03860.542081
UUG0.5513751.274893
CUU0.297441.224713
CUC *2.9073201.104257
CUA0.143580.712725
CUG *2.0852521.164456
IleAUU0.5713391.204799
AUC *2.2452771.134511
AUA0.194420.682704
MetAUG1.0039401.005668
ValGUU0.3510251.184457
GUC *2.3970111.214561
GUA0.113220.632379
GUG *1.1633960.973649
TyrUAU0.296511.033182
UAC *1.7139100.972979
SerAGU0.244880.763234
AGC *1.6132661.054495
HisCAU0.428751.113946
CAC *1.5833220.893180
GlnCAA0.4211841.076735
CAG *1.5844570.935867
AsnAAU0.308080.984824
AAC *1.7045571.024978
LysAAA0.2910910.945763
AAG *1.7163061.066539
AspGAU0.4019411.038086
GAC *1.6077650.977678
GluGAA0.3918021.038278
GAG *1.6173960.977846
SerUCU0.408181.225215
UCC *1.9639890.893811
UCA0.316351.175018
UCG *1.4829980.913878
ProCCU0.4310301.104937
CCC *2.1351000.813633
CCA0.327631.275704
CCG *1.1226890.813651
ThrACU0.286851.044130
ACC *1.8044280.913615
ACA0.389411.204774
ACG *1.5437960.863422
AlaGCU0.3816651.146365
GCC *2.2999601.055840
GCA0.3414621.106141
GCG *0.9943330.703903
CysUGU0.293220.951626
UGC *1.7118691.051790
TrpUGG1.0025611.003365
GlyGGU0.3913220.964175
GGC *2.5586411.355864
GGA0.3712631.034480
GGG0.6923530.652813
ArgAGA0.458251.173566
AGG *1.2923900.792427
CGU0.376800.822510
CGC *2.3443291.023113
CGA0.509321.414306
CGG *1.0519340.802440
TERUAA0.621010.79169
UAG0.921500.74158
UGA1.472401.48317
Codon indicates synonymous codons; N indicates codon frequency; RSCU indicates relative synonymous codon usage; High and Low indicate the codon usage of 244 genes (5% of the total number of genes) from the top and bottom of the dataset ordered by ENC ratio value, respectively. The optimal codons are indicated with a (*).

