
Applications of Fourier Transform Ion Cyclotron Resonance (FT-ICR) and Orbitrap Based High Resolution Mass Spectrometry in Metabolomics and Lipidomics


Abstract
:1. Introduction
2. Advantages of Fourier Transform Ion Cyclotron Resonance (FT-ICR) and Orbitrap Based High Resolution Mass Spectrometry (HRMS) for Metabolomics and Lipidomics
- (a)
- High mass resolution with the ability to achieve measurements with ppm and sub-ppm errors allows a complex metabolic extract to be analyzed with minimal chance of interference from overlap of other species in the mass spectrum [13]. The ability to discriminate metabolites at the 1–3 ppm level not only dramatically improves characterization of complex mixtures but also minimizes ambiguity of molecular formula assignments.
- (b)
- Extremely high mass accuracy and sufficiently high acquisition rates makes FT-ICR and Orbitrap based instruments very popular in direct infusion mass spectrometry (DIMS), especially for metabolic and lipidomics fingerprinting studies. The ability of direct sample infusion would be clearly advantageous over existing time-consuming metabolite analyses or screening methods. With only a few minutes required for data acquisition with very high information content [12], DIMS can decrease the demand for extensive chromatographic separation and dramatically increase sample throughput in large scale screening experiments [12,25,26]. The high-throughput approach permits a sample to be processed within a few minutes and the short analysis time increases inter-sample reproducibility and improves the accuracy of subsequent cluster analysis [27].
- (c)
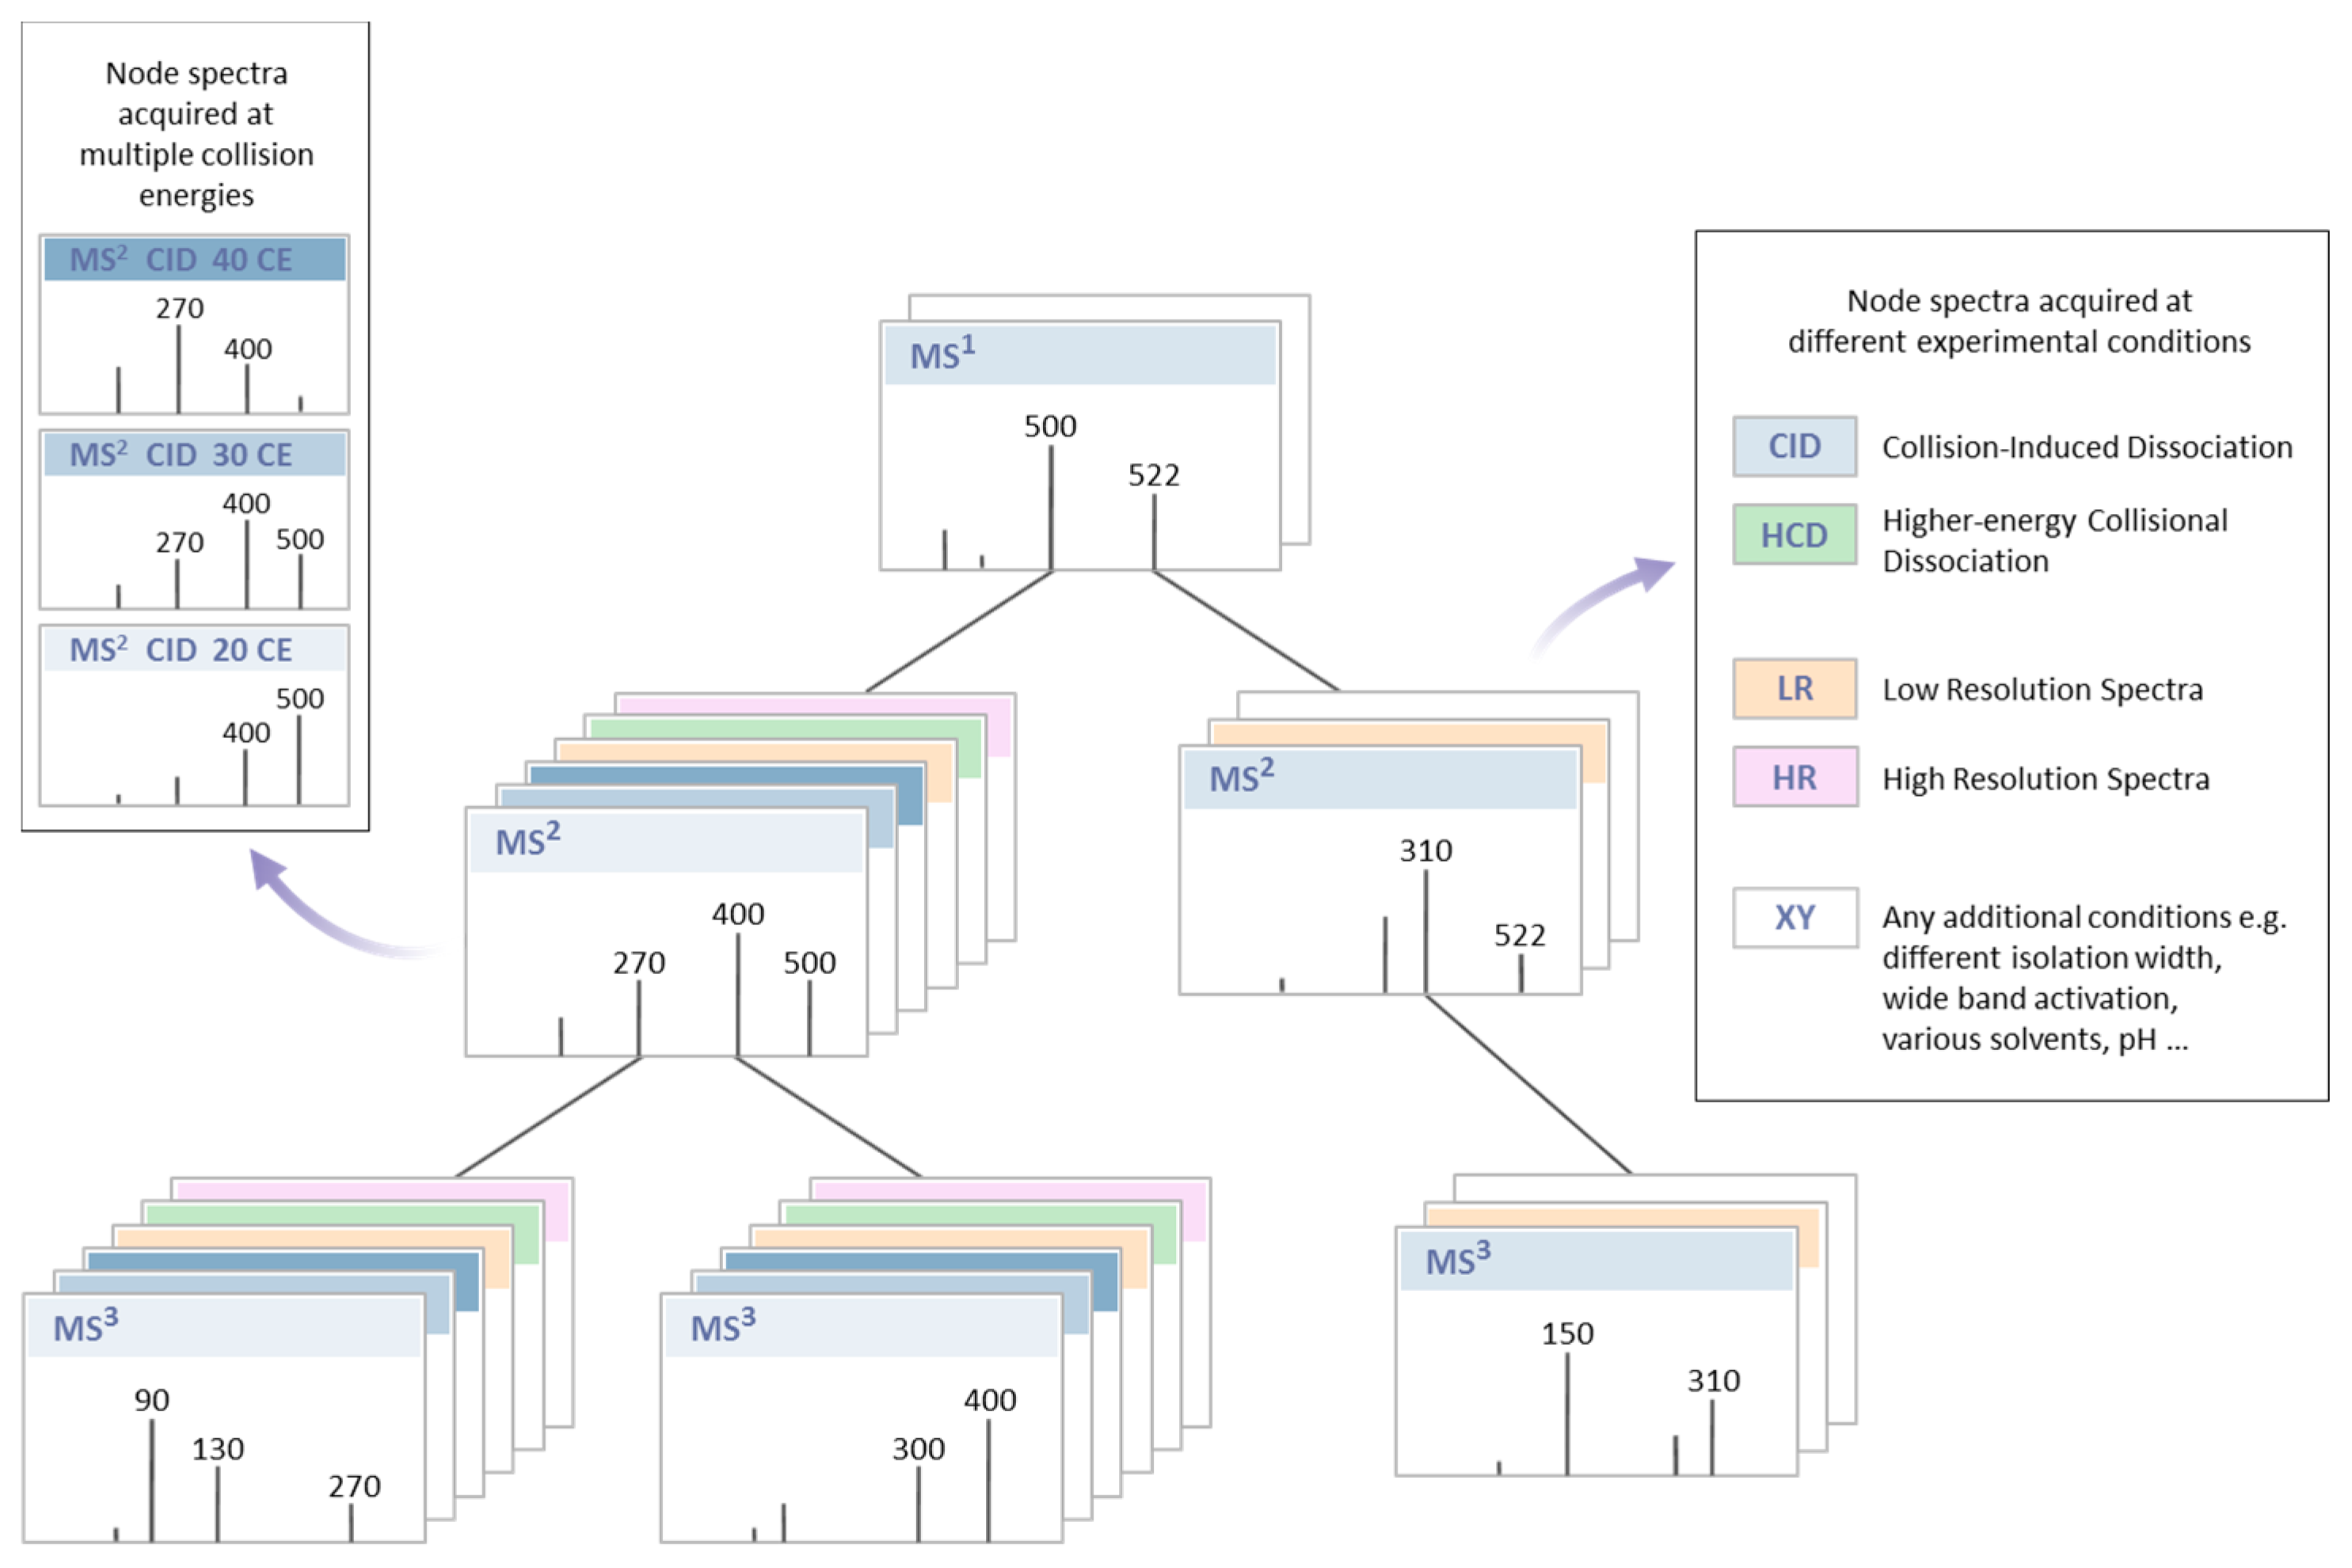
- Flexibility in choosing the ion source or fragmentation technique. Variety of ion sources, including electrospray ionization (ESI), atmospheric pressure chemical ionization (APCI), vacuum or atmospheric, matrix assisted laser desorption ionization (MALDI), desorption ionization (DESI), and direct analysis in real time (DART), are currently available and have been used for metabolomics and lipidomics applications [5,6,13,20,28,29]. Different fragmentation techniques like collision induced dissociation (CID), higher-energy collisional dissociation (HCD), electron induced dissociation (EID), infrared multiphoton dissociation (IRMPD), electron-transfer dissociation (ETD) and electron-transfer and higher-energy collision dissociation (EThcD) are available at any stage of MSn with detection in either the Orbitrap or linear ion trap detector [20].
- (d)
- Ability to perform stepwise fragmentation in multiple stage mass spectrometry (MSn) experiments is useful for more confident metabolite identification or in-depth metabolite characterization of unknown compounds [7].
3. HRMS Applications in Metabolomics and Lipidomics
3.1. Shotgun Based Approaches
3.2. Hyphenated Techniques
3.3. Mass Spectrometry Imaging
3.4. Other Applications of HRMS
4. Data Analysis and Databases
5. Conclusions: Technological Developments and Future Perspectives
Acknowledgments
Conflicts of Interest
Abbreviations
| AE | Anion exchange |
| APCI | Atmospheric pressure chemical ionization |
| AP-MALDI | Atmospheric pressure matrix-assisted laser desorption ionization |
| ATI | Acute tubular injury |
| CCS | Collisional cross section |
| CE-MS | Capillary electrophoresis mass spectrometry |
| CID | Collision induced dissociation |
| CSH | Charged surface hybrid |
| DART | Direct analysis in real time |
| DC-FTMS | Dual chromatography-Fourier transform mass spectrometry |
| DESI | Desorption electrospray ionization |
| DFT | Discrete Fourier transform |
| DIMS | Direct infusion mass spectrometry |
| DNA | Deoxyribonucleic acid |
| EID | Electron induced dissociation |
| ESI | Electro spray ionization |
| ETD | Electron-transfer dissociation |
| EThcD | Electron-transfer and higher-energy collision dissociation |
| FT-ICR-MS | Fourier transform ion cyclotron resonance mass spectrometry |
| FTMS | Fourier transform mass spectrometry |
| FWHM | Full width at half maximum |
| GC-MS | Gas chromatography coupled to mass spectrometry |
| HCD | Higher-energy collisional dissociation |
| HRMS | High resolution mass spectrometry |
| IC | Ion chromatography |
| IRMPD | Infrared multiphoton dissociation |
| KEGG | Kyoto encyclopedia of genes and genomes |
| LC-FT-ICR-MS | Liquid chromatography-Fourier transform ion cyclotron resonance mass spectrometry |
| LC-FTMS | Liquid chromatography-Fourier transform mass spectrometry |
| LC-MS | Liquid chromatography coupled to mass spectrometry |
| LPC | Lyso-phosphatidylcholines |
| m/z | Mass to charge ratio |
| MALDESI | Matrix-assisted laser desorption electrospray ionization |
| MALDI | Matrix assisted laser desorption ionization |
| MIDA | Molecular ion directed acquisition |
| MMCD | Madison metabolomics consortium database |
| MS/MS | Tandem mass spectrometry |
| MS | Mass spectrometry |
| MSI | Mass spectrometry imaging |
| MSn | Multiple-stage mass spectrometry |
| NMR | Nuclear magnetic resonance |
| PCDD | Polychlorinated dibenzo-p-dioxins |
| PCDF | Polychlorinated dibenzofurans |
| PIF | Precursor ion fingerprinting |
| SIM | Selected ion monitoring |
| UHPLC | Ultra high performance liquid chromatography |
| UPLC | Ultra performance liquid chromatography |
References
- Oliver, S.G.; Winson, M.K.; Kell, D.B.; Baganz, F. Systematic functional analysis of the yeast genome. Trends Biotechnol. 1998, 16, 373–378. [Google Scholar] [CrossRef]
- Schuhmann, K.; Herzog, R.; Schwudke, D.; Metelmann-Strupat, W.; Bornstein, S.R.; Shevchenko, A. Bottom-up shotgun lipidomics by higher energy collisional dissociation on LTQ Orbitrap mass spectrometers. Anal. Chem. 2011, 83, 5480–5487. [Google Scholar] [CrossRef] [PubMed]
- Soltow, Q.A.; Jones, D.P.; Promislow, D.E. A network perspective on metabolism and aging. Integr. Comp. Biol. 2010, 50, 844–854. [Google Scholar] [CrossRef] [PubMed]
- Want, E.J.; Nordstrom, A.; Morita, H.; Siuzdak, G. From exogenous to endogenous: The inevitable imprint of mass spectrometry in metabolomics. J. Proteome Res. 2007, 6, 459–468. [Google Scholar] [CrossRef] [PubMed]
- Kuehnbaum, N.L.; Britz-McKibbin, P. New advances in separation science for metabolomics: Resolving chemical diversity in a post-genomic era. Chem. Rev. 2013, 113, 2437–2468. [Google Scholar] [CrossRef] [PubMed]
- Nagornov, K.O.; Gorshkov, M.V.; Kozhinov, A.N.; Tsybin, Y.O. High-resolution Fourier transform ion cyclotron resonance mass spectrometry with increased throughput for biomolecular analysis. Anal. Chem. 2014, 86, 9020–9028. [Google Scholar] [CrossRef] [PubMed]
- Rojas-Cherto, M.; Peironcely, J.E.; Kasper, P.T.; van der Hooft, J.J.; de Vos, R.C.; Vreeken, R.; Hankemeier, T.; Reijmers, T. Metabolite identification using automated comparison of high-resolution multistage mass spectral trees. Anal. Chem. 2012, 84, 5524–5534. [Google Scholar] [CrossRef] [PubMed]
- Erve, J.C.; Demaio, W.; Talaat, R.E. Rapid metabolite identification with sub parts-per-million mass accuracy from biological matrices by direct infusion nanoelectrospray ionization after clean-up on a ZipTip and LTQ/Orbitrap mass spectrometry. Rapid Commun. Mass Spectrom. 2008, 22, 3015–3026. [Google Scholar] [CrossRef] [PubMed]
- Comisarow, M.B.; Marshall, A.G. The early development of Fourier transform ion cyclotron resonance (FT-ICR) spectroscopy. J. Mass Spectrom. 1996, 31, 581–585. [Google Scholar] [CrossRef]
- Marshall, A.G.; Hendrickson, C.L.; Jackson, G.S. Fourier transform ion cyclotron resonance mass spectrometry: A primer. Mass Spectrom. Rev. 1998, 17, 1–35. [Google Scholar] [CrossRef]
- Villas-Boas, S.G.; Mas, S.; Akesson, M.; Smedsgaard, J.; Nielsen, J. Mass spectrometry in metabolome analysis. Mass Spectrom. Rev. 2005, 24, 613–646. [Google Scholar] [CrossRef] [PubMed]
- Aharoni, A.; Ric de Vos, C.H.; Verhoeven, H.A.; Maliepaard, C.A.; Kruppa, G.; Bino, R.; Goodenowe, D.B. Nontargeted metabolome analysis by use of Fourier Transform Ion Cyclotron Mass Spectrometry. Omics J. Integr. Biol. 2002, 6, 217–234. [Google Scholar] [CrossRef] [PubMed]
- Brown, S.C.; Kruppa, G.; Dasseux, J.L. Metabolomics applications of FT-ICR mass spectrometry. Mass Spectrom. Rev. 2005, 24, 223–231. [Google Scholar] [CrossRef] [PubMed]
- Jeandet, P.; Heinzmann, S.S.; Roullier-Gall, C.; Cilindre, C.; Aron, A.; Deville, M.A.; Moritz, F.; Karbowiak, T.; Demarville, D.; Brun, C.; et al. Chemical messages in 170-year-old champagne bottles from the Baltic Sea: Revealing tastes from the past. Proc. Natl. Acad. Sci. USA 2015, 112, 5893–5898. [Google Scholar] [CrossRef] [PubMed]
- Comisarow, M.B.; Marshall, A.G. Fourier transform ion cyclotron resonance spectroscopy. Chem. Phys. Lett. 1974, 25, 282–283. [Google Scholar] [CrossRef]
- Hu, Q.; Noll, R.J.; Li, H.; Makarov, A.; Hardman, M.; Graham Cooks, R. The Orbitrap: A new mass spectrometer. J. Mass Spectrom. 2005, 40, 430–443. [Google Scholar] [CrossRef] [PubMed]
- Makarov, A.; Scigelova, M. Coupling liquid chromatography to Orbitrap mass spectrometry. J. Chromatogr. A 2010, 1217, 3938–3945. [Google Scholar] [CrossRef] [PubMed]
- Peterson, A.C.; Balloon, A.J.; Westphall, M.S.; Coon, J.J. Development of a GC/Quadrupole-Orbitrap mass spectrometer, part II: New approaches for discovery metabolomics. Anal. Chem. 2014, 86, 10044–10051. [Google Scholar] [CrossRef] [PubMed]
- Peterson, A.C.; Hauschild, J.P.; Quarmby, S.T.; Krumwiede, D.; Lange, O.; Lemke, R.A.; Grosse-Coosmann, F.; Horning, S.; Donohue, T.J.; Westphall, M.S.; et al. Development of a GC/Quadrupole-Orbitrap mass spectrometer, part I: Design and characterization. Anal. Chem. 2014, 86, 10036–10043. [Google Scholar] [CrossRef] [PubMed]
- Junot, C.; Fenaille, F.; Colsch, B.; Becher, F. High resolution mass spectrometry based techniques at the crossroads of metabolic pathways. Mass Spectrom. Rev. 2014, 33, 471–500. [Google Scholar] [CrossRef] [PubMed]
- Junot, C.; Madalinski, G.; Tabet, J.C.; Ezan, E. Fourier transform mass spectrometry for metabolome analysis. Analyst 2010, 135, 2203–2219. [Google Scholar] [CrossRef] [PubMed]
- Schwudke, D.; Schuhmann, K.; Herzog, R.; Bornstein, S.R.; Shevchenko, A. Shotgun lipidomics on high resolution mass spectrometers. Cold Spring Harbor Perspect. Biol. 2011, 3, a004614. [Google Scholar] [CrossRef] [PubMed]
- Balbo, S.; Turesky, R.J.; Villalta, P.W. DNA adductomics. Chem. Res. Toxicol. 2014, 27, 356–366. [Google Scholar] [CrossRef] [PubMed]
- Balbo, S.; Hecht, S.S.; Upadhyaya, P.; Villalta, P.W. Application of a high-resolution mass-spectrometry-based DNA adductomics approach for identification of DNA adducts in complex mixtures. Anal. Chem. 2014, 86, 1744–1752. [Google Scholar] [CrossRef] [PubMed]
- Raterink, R.-J.; Kloet, F.M.; Li, J.; Wattel, N.A.; Schaaf, M.J.M.; Spaink, H.P.; Berger, R.; Vreeken, R.J.; Hankemeier, T. Rapid metabolic screening of early zebrafish embryogenesis based on direct infusion-nanoESI-FTMS. Metabolomics 2013, 9, 864–873. [Google Scholar] [CrossRef]
- Soltow, Q.A.; Strobel, F.H.; Mansfield, K.G.; Wachtman, L.; Park, Y.; Jones, D.P. High-performance metabolic profiling with dual chromatography-Fourier-transform mass spectrometry (DC-FTMS) for study of the exposome. Metabolomics 2013, 9, S132–S143. [Google Scholar] [CrossRef] [PubMed]
- Dettmer, K.; Aronov, P.A.; Hammock, B.D. Mass spectrometry-based metabolomics. Mass Spectrom. Rev. 2007, 26, 51–78. [Google Scholar] [CrossRef] [PubMed]
- Lei, Z.; Huhman, D.V.; Sumner, L.W. Mass spectrometry strategies in metabolomics. J. Biol. Chem. 2011, 286, 25435–25442. [Google Scholar] [CrossRef] [PubMed]
- Moco, S.; Capanoglu, E.; Tikunov, Y.; Bino, R.J.; Boyacioglu, D.; Hall, R.D.; Vervoort, J.; de Vos, R.C. Tissue specialization at the metabolite level is perceived during the development of tomato fruit. J. Exp. Bot. 2007, 58, 4131–4146. [Google Scholar] [CrossRef] [PubMed]
- Wishart, D.S.; Lewis, M.J.; Morrissey, J.A.; Flegel, M.D.; Jeroncic, K.; Xiong, Y.; Cheng, D.; Eisner, R.; Gautam, B.; Tzur, D.; et al. The human cerebrospinal fluid metabolome. J. Chromatogr. B 2008, 871, 164–173. [Google Scholar] [CrossRef] [PubMed]
- Witting, M.; Lucio, M.; Tziotis, D.; Wagele, B.; Suhre, K.; Voulhoux, R.; Garvis, S.; Schmitt-Kopplin, P. DI-ICR-FT-MS-based high-throughput deep metabotyping: A case study of the Caenorhabditis elegans-Pseudomonas aeruginosa infection model. Anal. Bioanal. Chem. 2015, 407, 1059–1073. [Google Scholar] [CrossRef] [PubMed]
- Zhou, J.; Weber, R.J.; Allwood, J.W.; Mistrik, R.; Zhu, Z.; Ji, Z.; Chen, S.; Dunn, W.B.; He, S.; Viant, M.R. HAMMER: Automated operation of mass frontier to construct in silico mass spectral fragmentation libraries. Bioinformatics 2014, 30, 581–583. [Google Scholar] [CrossRef] [PubMed]
- Zhu, Z.J.; Schultz, A.W.; Wang, J.; Johnson, C.H.; Yannone, S.M.; Patti, G.J.; Siuzdak, G. Liquid chromatography quadrupole time-of-flight mass spectrometry characterization of metabolites guided by the METLIN database. Nat. Protoc. 2013, 8, 451–460. [Google Scholar] [CrossRef] [PubMed]
- Meijon, M.; Feito, I.; Oravec, M.; Delatorre, C.; Weckwerth, W.; Majada, J.; Valledor, L. Exploring natural variation of Pinus pinaster Aiton using metabolomics: Is it possible to identify the region of origin of a pine from its metabolites? Mol. Ecol. 2016, 25, 959–976. [Google Scholar] [CrossRef] [PubMed]
- Diaz, R.; Gallart-Ayala, H.; Sancho, J.V.; Nunez, O.; Zamora, T.; Martins, C.P.; Hernandez, F.; Hernandez-Cassou, S.; Saurina, J.; Checa, A. Told through the wine: A liquid chromatography-mass spectrometry interplatform comparison reveals the influence of the global approach on the final annotated metabolites in non-targeted metabolomics. J. Chromatogr. A 2016, 1433, 90–97. [Google Scholar] [CrossRef] [PubMed]
- Thevenot, E.A.; Roux, A.; Xu, Y.; Ezan, E.; Junot, C. Analysis of the human adult urinary metabolome variations with age, body mass index, and gender by implementing a comprehensive workflow for univariate and OPLS statistical analyses. J. Proteome Res. 2015, 14, 3322–3335. [Google Scholar] [CrossRef] [PubMed]
- Sun, J.; Monagas, M.; Jang, S.; Molokin, A.; Harnly, J.M.; Urban, J.F., Jr.; Solano-Aguilar, G.; Chen, P. A high fat, high cholesterol diet leads to changes in metabolite patterns in pigs—A metabolomic study. Food Chem. 2015, 173, 171–178. [Google Scholar] [CrossRef] [PubMed]
- Sun, J.; Kou, L.; Geng, P.; Huang, H.; Yang, T.; Luo, Y.; Chen, P. Metabolomic assessment reveals an elevated level of glucosinolate content in CaCl2 treated broccoli microgreens. J. Agric. Food Chem. 2015, 63, 1863–1868. [Google Scholar] [CrossRef] [PubMed]
- Shen, C.; Sun, Z.; Chen, D.; Su, X.; Jiang, J.; Li, G.; Lin, B.; Yan, J. Developing urinary metabolomic signatures as early bladder cancer diagnostic markers. Omics J. Integr. Biol. 2015, 19, 1–11. [Google Scholar] [CrossRef] [PubMed]
- Scalabrin, E.; Radaelli, M.; Rizzato, G.; Bogani, P.; Buiatti, M.; Gambaro, A.; Capodaglio, G. Metabolomic analysis of wild and transgenic Nicotiana langsdorffii plants exposed to abiotic stresses: Unraveling metabolic responses. Anal. Bioanal. Chem. 2015, 407, 6357–6368. [Google Scholar] [CrossRef] [PubMed]
- Nicolardi, S.; Bogdanov, B.; Deelder, A.M.; Palmblad, M.; van der Burgt, Y.E. Developments in FTICR-MS and its potential for body fluid signatures. Int. J. Mol. Sci. 2015, 16, 27133–27144. [Google Scholar] [CrossRef] [PubMed]
- Schuhmann, K.; Almeida, R.; Baumert, M.; Herzog, R.; Bornstein, S.R.; Shevchenko, A. Shotgun lipidomics on a LTQ Orbitrap mass spectrometer by successive switching between acquisition polarity modes. J. Mass Spectrom. 2012, 47, 96–104. [Google Scholar] [CrossRef] [PubMed]
- Koulman, A.; Woffendin, G.; Narayana, V.K.; Welchman, H.; Crone, C.; Volmer, D.A. High-resolution extracted ion chromatography, a new tool for metabolomics and lipidomics using a second-generation orbitrap mass spectrometer. Rapid Commun. Mass Spectrom. 2009, 23, 1411–1418. [Google Scholar] [CrossRef] [PubMed]
- Herzog, R.; Schwudke, D.; Schuhmann, K.; Sampaio, J.L.; Bornstein, S.R.; Schroeder, M.; Shevchenko, A. A novel informatics concept for high-throughput shotgun lipidomics based on the molecular fragmentation query language. Genome Biol. 2011, 12, R8. [Google Scholar] [CrossRef] [PubMed]
- Graessler, J.; Schwudke, D.; Schwarz, P.E.; Herzog, R.; Shevchenko, A.; Bornstein, S.R. Top-down lipidomics reveals ether lipid deficiency in blood plasma of hypertensive patients. PLoS ONE 2009, 4, e6261. [Google Scholar] [CrossRef] [PubMed]
- Schwudke, D.; Liebisch, G.; Herzog, R.; Schmitz, G.; Shevchenko, A. Shotgun lipidomics by tandem mass spectrometry under data-dependent acquisition control. Methods Enzymol. 2007, 433, 175–191. [Google Scholar] [PubMed]
- Shevchenko, A.; Simons, K. Lipidomics: Coming to grips with lipid diversity. Nat. Rev. Mol. Cell Biol. 2010, 11, 593–598. [Google Scholar] [CrossRef] [PubMed]
- Matyash, V.; Liebisch, G.; Kurzchalia, T.V.; Shevchenko, A.; Schwudke, D. Lipid extraction by methyl-tert-butyl ether for high-throughput lipidomics. J. Lipid Res. 2008, 49, 1137–1146. [Google Scholar] [CrossRef] [PubMed]
- Almeida, R.; Pauling, J.K.; Sokol, E.; Hannibal-Bach, H.K.; Ejsing, C.S. Comprehensive lipidome analysis by shotgun lipidomics on a hybrid quadrupole-orbitrap-linear ion trap mass spectrometer. J. Am. Soc. Mass Spectrom. 2015, 26, 133–148. [Google Scholar] [CrossRef] [PubMed]
- Ejsing, C.S.; Duchoslav, E.; Sampaio, J.; Simons, K.; Bonner, R.; Thiele, C.; Ekroos, K.; Shevchenko, A. Automated identification and quantification of glycerophospholipid molecular species by multiple precursor ion scanning. Anal. Chem. 2006, 78, 6202–6214. [Google Scholar] [CrossRef] [PubMed]
- Tarasov, K.; Stefanko, A.; Casanovas, A.; Surma, M.A.; Berzina, Z.; Hannibal-Bach, H.K.; Ekroos, K.; Ejsing, C.S. High-content screening of yeast mutant libraries by shotgun lipidomics. Mol. Biosyst. 2014, 10, 1364–1376. [Google Scholar] [CrossRef] [PubMed]
- Almeida, R.; Berzina, Z.; Arnspang, E.C.; Baumgart, J.; Vogt, J.; Nitsch, R.; Ejsing, C.S. Quantitative spatial analysis of the mouse brain lipidome by pressurized liquid extraction surface analysis. Anal. Chem. 2015, 87, 1749–1756. [Google Scholar] [CrossRef] [PubMed]
- Casanovas, A.; Hannibal-Bach, H.K.; Jensen, O.N.; Ejsing, C.S. Shotgun lipidomic analysis of chemically sulfated sterols compromises analytical sensitivity: Recommendation for large-scale global lipidome analysis. Eur. J. Lipid Sci. Technol. 2014, 116, 1618–1620. [Google Scholar] [CrossRef] [PubMed]
- Hansen, M.L.; Clausen, A.; Ejsing, C.S.; Risbo, J. Modulation of the Lactobacillus acidophilus La-5 lipidome by different growth conditions. Microbiology 2015, 161, 1990–1998. [Google Scholar] [CrossRef] [PubMed]
- Jensen, S.M.; Brandl, M.; Treusch, A.H.; Ejsing, C.S. Structural characterization of ether lipids from the archaeon Sulfolobus islandicus by high-resolution shotgun lipidomics. J. Mass Spectrom. 2015, 50, 476–487. [Google Scholar] [CrossRef] [PubMed]
- Jensen, S.M.; Neesgaard, V.L.; Skjoldbjerg, S.L.; Brandl, M.; Ejsing, C.S.; Treusch, A.H. The effects of temperature and growth phase on the lipidomes of Sulfolobus islandicus and Sulfolobus tokodaii. Life 2015, 5, 1539–1566. [Google Scholar] [CrossRef] [PubMed]
- Sokol, E.; Ulven, T.; Faergeman, N.J.; Ejsing, C.S. Comprehensive and quantitative profiling of lipid species in human milk, cow milk and a phospholipid-enriched milk formula by GC and MS/MS. Eur. J. Lipid Sci. Technol. 2015, 117, 751–759. [Google Scholar] [CrossRef] [PubMed]
- Wang, M.; Wang, C.; Han, R.H.; Han, X. Novel advances in shotgun lipidomics for biology and medicine. Prog. Lipid Res. 2016, 61, 83–108. [Google Scholar] [CrossRef] [PubMed]
- Wang, M.; Han, X. Advanced shotgun lipidomics for characterization of altered lipid patterns in neurodegenerative diseases and brain injury. Methods Mol. Biol. 2016, 1303, 405–422. [Google Scholar] [PubMed]
- Hu, S.; Wang, J.; Ji, E.H.; Christison, T.; Lopez, L.; Huang, Y. Targeted metabolomic analysis of head and neck cancer cells using high performance ion chromatography coupled with a Q Exactive HF mass spectrometer. Anal. Chem. 2015, 87, 6371–6379. [Google Scholar] [CrossRef] [PubMed]
- Bird, S.S.; Stavrovskaya, I.G.; Gathungu, R.M.; Tousi, F.; Kristal, B.S. Qualitative characterization of the rat liver mitochondrial lipidome using all ion fragmentation on an Exactive benchtop Orbitrap MS. Methods Mol. Biol. 2015, 1264, 441–452. [Google Scholar] [PubMed]
- Wang, M.; Huang, Y.; Han, X. Accurate mass searching of individual lipid species candidates from high-resolution mass spectra for shotgun lipidomics. Rapid Commun. Mass Spectrom. 2014, 28, 2201–2210. [Google Scholar] [CrossRef] [PubMed]
- Zhang, R.; Watson, D.G.; Wang, L.; Westrop, G.D.; Coombs, G.H.; Zhang, T. Evaluation of mobile phase characteristics on three zwitterionic columns in hydrophilic interaction liquid chromatography mode for liquid chromatography-high resolution mass spectrometry based untargeted metabolite profiling of Leishmania parasites. J. Chromatogr. A 2014, 1362, 168–179. [Google Scholar] [CrossRef] [PubMed]
- Wang, M.; Han, X. Multidimensional mass spectrometry-based shotgun lipidomics. Methods Mol. Biol. 2014, 1198, 203–220. [Google Scholar] [PubMed]
- Wang, J.; Christison, T.T.; Misuno, K.; Lopez, L.; Huhmer, A.F.; Huang, Y.; Hu, S. Metabolomic profiling of anionic metabolites in head and neck cancer cells by capillary ion chromatography with Orbitrap mass spectrometry. Anal. Chem. 2014, 86, 5116–5124. [Google Scholar] [CrossRef] [PubMed]
- Wang, M.; Fang, H.; Han, X. Shotgun lipidomics analysis of 4-hydroxyalkenal species directly from lipid extracts after one-step in situ derivatization. Anal. Chem. 2012, 84, 4580–4586. [Google Scholar] [CrossRef] [PubMed]
- Han, X.; Yang, K.; Gross, R.W. Multi-dimensional mass spectrometry-based shotgun lipidomics and novel strategies for lipidomic analyses. Mass Spectrom. Rev. 2012, 31, 134–178. [Google Scholar] [CrossRef] [PubMed]
- Leiserowitz, G.S.; Lebrilla, C.; Miyamoto, S.; An, H.J.; Duong, H.; Kirmiz, C.; Li, B.; Liu, H.; Lam, K.S. Glycomics analysis of serum: A potential new biomarker for ovarian cancer? Int. J. Gynecol. Cancer 2008, 18, 470–475. [Google Scholar] [CrossRef] [PubMed]
- Kirmiz, C.; Li, B.; An, H.J.; Clowers, B.H.; Chew, H.K.; Lam, K.S.; Ferrige, A.; Alecio, R.; Borowsky, A.D.; Sulaimon, S.; Lebrilla, C.B.; Miyamoto, S. A serum glycomics approach to breast cancer biomarkers. Mol. Cell. Proteom. 2007, 6, 43–55. [Google Scholar] [CrossRef] [PubMed]
- Dalpathado, D.S.; Irungu, J.; Go, E.P.; Butnev, V.Y.; Norton, K.; Bousfield, G.R.; Desaire, H. Comparative glycomics of the glycoprotein follicle stimulating hormone: Glycopeptide analysis of isolates from two mammalian species. Biochemistry 2006, 45, 8665–8673. [Google Scholar] [CrossRef] [PubMed]
- Senyuva, H.Z.; Gokmen, V.; Sarikaya, E.A. Future perspectives in Orbitrap™-high-resolution mass spectrometry in food analysis: A review. Food Addit. Contam. Part A 2015, 32, 1568–1606. [Google Scholar] [CrossRef] [PubMed]
- Rubert, J.; Zachariasova, M.; Hajslova, J. Advances in high-resolution mass spectrometry based on metabolomics studies for food—A review. Food Addit. Contam. Part A 2015, 32, 1685–1708. [Google Scholar] [CrossRef] [PubMed]
- Rizzuti, A.; Aguilera-Saez, L.M.; Gallo, V.; Cafagna, I.; Mastrorilli, P.; Latronico, M.; Pacifico, A.; Matarrese, A.M.; Ferrara, G. On the use of Ethephon as abscising agent in cv. Crimson Seedless table grape production: Combination of Fruit Detachment Force, Fruit Drop and metabolomics. Food Chem. 2015, 171, 341–350. [Google Scholar] [CrossRef] [PubMed]
- Nielsen, K.F.; Larsen, T.O. The importance of mass spectrometric dereplication in fungal secondary metabolite analysis. Front. Microbiol. 2015, 6. [Google Scholar] [CrossRef] [PubMed]
- Wolfender, J.L.; Marti, G.; Thomas, A.; Bertrand, S. Current approaches and challenges for the metabolite profiling of complex natural extracts. J. Chromatogr. A 2015, 1382, 136–164. [Google Scholar] [CrossRef] [PubMed]
- Bundy, J.G.; Davey, M.P.; Viant, M.R. Environmental metabolomics: A critical review and future perspectives. Metabolomics 2008, 5, 3–21. [Google Scholar] [CrossRef]
- Lankadurai, B.P.; Nagato, E.G.; Simpson, M.J. Environmental metabolomics: An emerging approach to study organism responses to environmental stressors. Environ. Rev. 2013, 21, 180–205. [Google Scholar] [CrossRef]
- Drexler, D.M.; Reily, M.D.; Shipkova, P.A. Advances in mass spectrometry applied to pharmaceutical metabolomics. Anal. Bioanal. Chem. 2011, 399, 2645–2653. [Google Scholar] [CrossRef] [PubMed]
- Raro, M.; Ibanez, M.; Gil, R.; Fabregat, A.; Tudela, E.; Deventer, K.; Ventura, R.; Segura, J.; Marcos, J.; Kotronoulas, A.; et al. Untargeted metabolomics in doping control: Detection of new markers of testosterone misuse by ultrahigh performance liquid chromatography coupled to high-resolution mass spectrometry. Anal. Chem. 2015, 87, 8373–8380. [Google Scholar] [CrossRef] [PubMed]
- Allen, J.; Davey, H.M.; Broadhurst, D.; Heald, J.K.; Rowland, J.J.; Oliver, S.G.; Kell, D.B. High-throughput classification of yeast mutants for functional genomics using metabolic footprinting. Nat. Biotechnol. 2003, 21, 692–696. [Google Scholar] [CrossRef] [PubMed]
- Klose, C.; Tarasov, K. Profiling of yeast lipids by shotgun lipidomics. Methods Mol. Biol. 2016, 1361, 309–324. [Google Scholar] [PubMed]
- Wang, C.; Wang, M.; Han, X. Comprehensive and quantitative analysis of lysophospholipid molecular species present in obese mouse liver by shotgun lipidomics. Anal. Chem. 2015, 87, 4879–4887. [Google Scholar] [CrossRef] [PubMed]
- Surma, M.A.; Herzog, R.; Vasilj, A.; Klose, C.; Christinat, N.; Morin-Rivron, D.; Simons, K.; Masoodi, M.; Sampaio, J.L. An automated shotgun lipidomics platform for high throughput, comprehensive, and quantitative analysis of blood plasma intact lipids. Eur. J. Lipid Sci. Technol. 2015, 117, 1540–1549. [Google Scholar] [CrossRef] [PubMed]
- Papan, C.; Penkov, S.; Herzog, R.; Thiele, C.; Kurzchalia, T.; Shevchenko, A. Systematic screening for novel lipids by shotgun lipidomics. Anal. Chem. 2014, 86, 2703–2710. [Google Scholar] [CrossRef] [PubMed]
- Lintonen, T.P.; Baker, P.R.; Suoniemi, M.; Ubhi, B.K.; Koistinen, K.M.; Duchoslav, E.; Campbell, J.L.; Ekroos, K. Differential mobility spectrometry-driven shotgun lipidomics. Anal. Chem. 2014, 86, 9662–9669. [Google Scholar] [CrossRef] [PubMed]
- Bhattacharya, S.K. Recent advances in shotgun lipidomics and their implication for vision research and ophthalmology. Curr. Eye Res. 2013, 38, 417–427. [Google Scholar] [CrossRef] [PubMed]
- Wang, J.N.; Zhou, Y.; Zhu, T.Y.; Wang, X.; Guo, Y.L. Prediction of acute cellular renal allograft rejection by urinary metabolomics using MALDI-FTMS. J. Proteome Res. 2008, 7, 3597–3601. [Google Scholar] [CrossRef] [PubMed]
- Wang, J.; Zhou, Y.; Xu, M.; Rong, R.; Guo, Y.; Zhu, T. Urinary metabolomics in monitoring acute tubular injury of renal allografts: A preliminary report. Transplant. Proc. 2011, 43, 3738–3742. [Google Scholar] [CrossRef] [PubMed]
- Grata, E.; Boccard, J.; Glauser, G.; Carrupt, P.A.; Farmer, E.E.; Wolfender, J.L.; Rudaz, S. Development of a two-step screening ESI-TOF-MS method for rapid determination of significant stress-induced metabolome modifications in plant leaf extracts: The wound response in Arabidopsis thaliana as a case study. J. Sep. Sci. 2007, 30, 2268–2278. [Google Scholar] [CrossRef] [PubMed]
- Shuman, J.L.; Cortes, D.F.; Armenta, J.M.; Pokrzywa, R.M.; Mendes, P.; Shulaev, V. Plant metabolomics by GC-MS and differential analysis. Methods Mol. Biol. 2011, 678, 229–246. [Google Scholar] [PubMed]
- Shulaev, V.; Cortes, D.; Miller, G.; Mittler, R. Metabolomics for plant stress response. Physiol. Plant. 2008, 132, 199–208. [Google Scholar] [CrossRef] [PubMed]
- Shulaev, V. Metabolomics technology and bioinformatics. Brief. Bioinform. 2006, 7, 128–139. [Google Scholar] [CrossRef] [PubMed]
- Hu, C.; van Dommelen, J.; van der Heijden, R.; Spijksma, G.; Reijmers, T.H.; Wang, M.; Slee, E.; Lu, X.; Xu, G.; van der Greef, J.; et al. RPLC-ion-trap-FTMS method for lipid profiling of plasma: Method validation and application to p53 mutant mouse model. J. Proteome Res. 2008, 7, 4982–4991. [Google Scholar] [CrossRef] [PubMed]
- Hummel, J.; Segu, S.; Li, Y.; Irgang, S.; Jueppner, J.; Giavalisco, P. Ultra performance liquid chromatography and high resolution mass spectrometry for the analysis of plant lipids. Front. Plant Sci. 2011, 2. [Google Scholar] [CrossRef] [PubMed]
- Alexandre-Gouabau, M.C.; Courant, F.; Moyon, T.; Kuster, A.; le Gall, G.; Tea, I.; Antignac, J.P.; Darmaun, D. Maternal and cord blood LC-HRMS metabolomics reveal alterations in energy and polyamine metabolism, and oxidative stress in very-low birth weight infants. J. Proteome Res. 2013, 12, 2764–2778. [Google Scholar] [CrossRef] [PubMed]
- Arroyo-Manzanares, N.; di Mavungu, J.D.; Uka, V.; Malysheva, S.V.; Cary, J.W.; Ehrlich, K.C.; Vanhaecke, L.; Bhatnagar, D.; de Saeger, S. Use of UHPLC high-resolution Orbitrap mass spectrometry to investigate the genes involved in the production of secondary metabolites in Aspergillus flavus. Food Addit. Contam. Part A 2015, 32, 1656–1673. [Google Scholar] [CrossRef] [PubMed]
- Bessonneau, V.; Bojko, B.; Pawliszyn, J. Analysis of human saliva metabolome by direct immersion solid-phase microextraction LC and benchtop orbitrap MS. Bioanalysis 2013, 5, 783–792. [Google Scholar] [CrossRef] [PubMed]
- Bobeldijk, I.; Hekman, M.; de Vries-van der Weij, J.; Coulier, L.; Ramaker, R.; Kleemann, R.; Kooistra, T.; Rubingh, C.; Freidig, A.; Verheij, E. Quantitative profiling of bile acids in biofluids and tissues based on accurate mass high resolution LC-FT-MS: Compound class targeting in a metabolomics workflow. J. Chromatogr. B 2008, 871, 306–313. [Google Scholar] [CrossRef] [PubMed]
- Boyard-Kieken, F.; Dervilly-Pinel, G.; Garcia, P.; Paris, A.C.; Popot, M.A.; le Bizec, B.; Bonnaire, Y. Comparison of different liquid chromatography stationary phases in LC-HRMS metabolomics for the detection of recombinant growth hormone doping control. J. Sep. Sci. 2011, 34, 3493–3501. [Google Scholar] [CrossRef] [PubMed]
- Bueschl, C.; Krska, R.; Kluger, B.; Schuhmacher, R. Isotopic labeling-assisted metabolomics using LC-MS. Anal. Bioanal. Chem. 2013, 405, 27–33. [Google Scholar] [CrossRef] [PubMed]
- Du, L.N.; Xie, T.; Xu, J.Y.; Kang, A.; Di, L.Q.; Shan, J.J.; Wang, S.C. A metabolomics approach to studying the effects of Jinxin oral liquid on RSV-infected mice using UPLC/LTQ-Orbitrap mass spectrometry. J. Ethnopharmacol. 2015, 174, 25–36. [Google Scholar] [CrossRef] [PubMed]
- Gertsman, I.; Gangoiti, J.A.; Barshop, B.A. Validation of a dual LC-HRMS platform for clinical metabolic diagnosis in serum, bridging quantitative analysis and untargeted metabolomics. Metabolomics 2014, 10, 312–323. [Google Scholar] [CrossRef] [PubMed]
- Guo, X.; Lankmayr, E. Multidimensional approaches in LC and MS for phospholipid bioanalysis. Bioanalysis 2010, 2, 1109–1123. [Google Scholar] [CrossRef] [PubMed]
- Kieken, F.; Pinel, G.; Antignac, J.P.; Monteau, F.; Christelle Paris, A.; Popot, M.A.; Bonnaire, Y.; Le Bizec, B. Development of a metabonomic approach based on LC-ESI-HRMS measurements for profiling of metabolic changes induced by recombinant equine growth hormone in horse urine. Anal. Bioanal. Chem. 2009, 394, 2119–2128. [Google Scholar] [CrossRef] [PubMed]
- Kluger, B.; Bueschl, C.; Neumann, N.; Stuckler, R.; Doppler, M.; Chassy, A.W.; Waterhouse, A.L.; Rechthaler, J.; Kampleitner, N.; Thallinger, G.G.; et al. Untargeted profiling of tracer-derived metabolites using stable isotopic labeling and fast polarity-switching LC-ESI-HRMS. Anal. Chem. 2014, 86, 11533–11537. [Google Scholar] [CrossRef] [PubMed]
- Kokkotou, K.; Ioannou, E.; Nomikou, M.; Pitterl, F.; Vonaparti, A.; Siapi, E.; Zervou, M.; Roussis, V. An integrated approach using UHPLC-PDA-HRMS and 2D HSQC NMR for the metabolic profiling of the red alga Laurencia: Dereplication and tracing of natural products. Phytochemistry 2014, 108, 208–219. [Google Scholar] [CrossRef] [PubMed]
- Li, L.; Zhang, F.; Zaia, J.; Linhardt, R.J. Top-down approach for the direct characterization of low molecular weight heparins using LC-FT-MS. Anal. Chem. 2012, 84, 8822–8829. [Google Scholar] [CrossRef] [PubMed]
- Lu, W.; Bennett, B.D.; Rabinowitz, J.D. Analytical strategies for LC-MS-based targeted metabolomics. J. Chromatogr. B 2008, 871, 236–242. [Google Scholar] [CrossRef] [PubMed]
- Madji Hounoum, B.; Blasco, H.; Nadal-Desbarats, L.; Dieme, B.; Montigny, F.; Andres, C.R.; Emond, P.; Mavel, S. Analytical methodology for metabolomics study of adherent mammalian cells using NMR, GC-MS and LC-HRMS. Anal. Bioanal. Chem. 2015, 407, 8861–8872. [Google Scholar] [CrossRef] [PubMed]
- Nemkov, T.; D’Alessandro, A.; Hansen, K.C. Three-minute method for amino acid analysis by UHPLC and high-resolution quadrupole orbitrap mass spectrometry. Amino Acids 2015, 47, 2345–2357. [Google Scholar] [CrossRef] [PubMed]
- Neumann, N.K.; Lehner, S.M.; Kluger, B.; Bueschl, C.; Sedelmaier, K.; Lemmens, M.; Krska, R.; Schuhmacher, R. Automated LC-HRMS(/MS) approach for the annotation of fragment ions derived from stable isotope labeling-assisted untargeted metabolomics. Anal. Chem. 2014, 86, 7320–7327. [Google Scholar] [CrossRef] [PubMed]
- Ni, Z.; Milic, I.; Fedorova, M. Identification of carbonylated lipids from different phospholipid classes by shotgun and LC-MS lipidomics. Anal. Bioanal. Chem. 2015, 407, 5161–5173. [Google Scholar] [CrossRef] [PubMed]
- Orellana, G.; Vanden Bussche, J.; van Meulebroek, L.; Vandegehuchte, M.; Janssen, C.; Vanhaecke, L. Validation of a confirmatory method for lipophilic marine toxins in shellfish using UHPLC-HR-Orbitrap MS. Anal. Bioanal. Chem. 2014, 406, 5303–5312. [Google Scholar] [CrossRef] [PubMed]
- Rochat, B. Quantitative/qualitative analysis using LC-HRMS: The fundamental step forward for clinical laboratories and clinical practice. Bioanalysis 2012, 4, 1709–1711. [Google Scholar] [CrossRef] [PubMed]
- Stojiljkovic, N.; Paris, A.; Garcia, P.; Popot, M.A.; Bonnaire, Y.; Tabet, J.C.; Junot, C. Evaluation of horse urine sample preparation methods for metabolomics using LC coupled to HRMS. Bioanalysis 2014, 6, 785–803. [Google Scholar] [CrossRef] [PubMed]
- Takahashi, H.; Morimoto, T.; Ogasawara, N.; Kanaya, S. AMDORAP: Non-targeted metabolic profiling based on high-resolution LC-MS. BMC Bioinform. 2011, 12, 259. [Google Scholar] [CrossRef] [PubMed]
- Zeng, Z.; Liu, X.; Dai, W.; Yin, P.; Zhou, L.; Huang, Q.; Lin, X.; Xu, G. Ion fusion of high-resolution LC-MS-based metabolomics data to discover more reliable biomarkers. Anal. Chem. 2014, 86, 3793–3800. [Google Scholar] [CrossRef] [PubMed]
- Zhou, T.; Wang, M.; Cheng, H.; Cui, C.; Su, S.; Xu, P.; Xue, M. UPLC-HRMS based metabolomics reveals the sphingolipids with long fatty chains and olefinic bonds up-regulated in metabolic pathway for hypoxia preconditioning. Chem. Biol. Interact. 2015, 242, 145–152. [Google Scholar] [CrossRef] [PubMed]
- Granafei, S.; Losito, I.; Palmisano, F.; Cataldi, T.R. Identification of isobaric lyso-phosphatidylcholines in lipid extracts of gilthead sea bream (Sparus aurata) fillets by hydrophilic interaction liquid chromatography coupled to high-resolution Fourier-transform mass spectrometry. Anal. Bioanal. Chem. 2015, 407, 6391–6404. [Google Scholar] [CrossRef] [PubMed]
- Damen, C.W.; Isaac, G.; Langridge, J.; Hankemeier, T.; Vreeken, R.J. Enhanced lipid isomer separation in human plasma using reversed-phase UPLC with ion-mobility/high-resolution MS detection. J. Lipid Res. 2014, 55, 1772–1783. [Google Scholar] [CrossRef] [PubMed]
- Peterson, A.C.; McAlister, G.C.; Quarmby, S.T.; Griep-Raming, J.; Coon, J.J. Development and characterization of a GC-enabled QLT-Orbitrap for high-resolution and high-mass accuracy GC/MS. Anal. Chem. 2010, 82, 8618–8628. [Google Scholar] [CrossRef] [PubMed]
- Buck, A.; Ly, A.; Balluff, B.; Sun, N.; Gorzolka, K.; Feuchtinger, A.; Janssen, K.P.; Kuppen, P.J.; van de Velde, C.J.; Weirich, G.; et al. High-resolution MALDI-FT-ICR MS imaging for the analysis of metabolites from formalin-fixed, paraffin-embedded clinical tissue samples. J. Pathol. 2015, 237, 123–132. [Google Scholar] [CrossRef] [PubMed]
- Jiao, J.; Miao, A.; Zhang, Y.; Fan, Q.; Lu, Y.; Lu, H. Imaging phosphorylated peptide distribution in human lens by MALDI MS. Analyst 2015, 140, 4284–4290. [Google Scholar] [CrossRef] [PubMed]
- Ronci, M.; Sharma, S.; Martin, S.; Craig, J.E.; Voelcker, N.H. MALDI MS imaging analysis of apolipoprotein E and lysyl oxidase-like 1 in human lens capsules affected by pseudoexfoliation syndrome. J. Proteomics 2013, 82, 27–34. [Google Scholar] [CrossRef] [PubMed]
- Ronci, M.; Sharma, S.; Chataway, T.; Burdon, K.P.; Martin, S.; Craig, J.E.; Voelcker, N.H. MALDI-MS-imaging of whole human lens capsule. J. Proteome Res. 2011, 10, 3522–3529. [Google Scholar] [CrossRef] [PubMed]
- Hart, P.J.; Francese, S.; Claude, E.; Woodroofe, M.N.; Clench, M.R. MALDI-MS imaging of lipids in ex vivo human skin. Anal. Bioanal. Chem. 2011, 401, 115–125. [Google Scholar] [CrossRef] [PubMed]
- Jirasko, R.; Holcapek, M.; Kunes, M.; Svatos, A. Distribution study of atorvastatin and its metabolites in rat tissues using combined information from UHPLC/MS and MALDI-Orbitrap-MS imaging. Anal. Bioanal. Chem. 2014, 406, 4601–4610. [Google Scholar] [CrossRef] [PubMed]
- Kim, Y.H.; Fujimura, Y.; Sasaki, M.; Yang, X.; Yukihira, D.; Miura, D.; Unno, Y.; Ogata, K.; Nakajima, H.; Yamashita, S.; et al. In situ label-free visualization of orally dosed strictinin within mouse kidney by MALDI-MS imaging. J. Agric. Food Chem. 2014, 62, 9279–9285. [Google Scholar] [CrossRef] [PubMed]
- Park, E.S.; Lee, J.H.; Hong, J.H.; Park, Y.K.; Lee, J.W.; Lee, W.J.; Kim, K.P.; Kim, K.H. Phosphatidylcholine alteration identified using MALDI imaging MS in HBV-infected mouse livers and virus-mediated regeneration defects. PLoS ONE 2014, 9, e103955. [Google Scholar] [CrossRef] [PubMed]
- Schulz, S.; Gerhardt, D.; Meyer, B.; Seegel, M.; Schubach, B.; Hopf, C.; Matheis, K. DMSO-enhanced MALDI MS imaging with normalization against a deuterated standard for relative quantification of dasatinib in serial mouse pharmacology studies. Anal. Bioanal. Chem. 2013, 405, 9467–9476. [Google Scholar] [CrossRef] [PubMed]
- Berry, K.A.; Li, B.; Reynolds, S.D.; Barkley, R.M.; Gijon, M.A.; Hankin, J.A.; Henson, P.M.; Murphy, R.C. MALDI imaging MS of phospholipids in the mouse lung. J. Lipid Res. 2011, 52, 1551–1560. [Google Scholar] [CrossRef] [PubMed]
- Kusari, S.; Sezgin, S.; Nigutova, K.; Cellarova, E.; Spiteller, M. Spatial chemo-profiling of hypericin and related phytochemicals in Hypericum species using MALDI-HRMS imaging. Anal. Bioanal. Chem. 2015, 407, 4779–4791. [Google Scholar] [CrossRef] [PubMed]
- Horn, P.J.; Korte, A.R.; Neogi, P.B.; Love, E.; Fuchs, J.; Strupat, K.; Borisjuk, L.; Shulaev, V.; Lee, Y.J.; Chapman, K.D. Spatial mapping of lipids at cellular resolution in embryos of cotton. Plant Cell 2012, 24, 622–636. [Google Scholar] [CrossRef] [PubMed]
- Horn, P.J.; Chapman, K.D. Lipidomics in situ: Insights into plant lipid metabolism from high resolution spatial maps of metabolites. Prog. Lipid Res. 2014, 54, 32–52. [Google Scholar] [CrossRef] [PubMed]
- Sturtevant, D.; Lee, Y.J.; Chapman, K.D. Matrix assisted laser desorption/ionization-mass spectrometry imaging (MALDI-MSI) for direct visualization of plant metabolites in situ. Curr Opin Biotechnol 2016, 37, 53–60. [Google Scholar] [CrossRef] [PubMed]
- Touboul, D.; Brunelle, A. MALDI mass spectrometry imaging of lipids and primary metabolites on rat brain sections. Methods Mol. Biol. 2015, 1203, 41–48. [Google Scholar] [PubMed]
- Jadoul, L.; Longuespee, R.; Noel, A.; de Pauw, E. A spiked tissue-based approach for quantification of phosphatidylcholines in brain section by MALDI mass spectrometry imaging. Anal. Bioanal. Chem. 2015, 407, 2095–2106. [Google Scholar] [CrossRef] [PubMed]
- Krasny, L.; Hoffmann, F.; Ernst, G.; Trede, D.; Alexandrov, T.; Havlicek, V.; Guntinas-Lichius, O.; von Eggeling, F.; Crecelius, A.C. Spatial segmentation of MALDI FT-ICR MSI data: A powerful tool to explore the head and neck tumor in situ lipidome. J. Am. Soc. Mass Spectrom. 2015, 26, 36–43. [Google Scholar] [CrossRef] [PubMed]
- Wei, Y.; Zhang, Y.; Lin, Y.; Li, L.; Liu, J.; Wang, Z.; Xiong, S.; Zhao, Z. A uniform 2,5-dihydroxybenzoic acid layer as a matrix for MALDI-FTICR MS-based lipidomics. Analyst 2015, 140, 1298–1305. [Google Scholar] [CrossRef] [PubMed]
- Ly, A.; Schone, C.; Becker, M.; Rattke, J.; Meding, S.; Aichler, M.; Suckau, D.; Walch, A.; Hauck, S.M.; Ueffing, M. High-resolution MALDI mass spectrometric imaging of lipids in the mammalian retina. Histochem. Cell Biol. 2015, 143, 453–462. [Google Scholar] [CrossRef] [PubMed]
- Wildburger, N.C.; Wood, P.L.; Gumin, J.; Lichti, C.F.; Emmett, M.R.; Lang, F.F.; Nilsson, C.L. ESI-MS/MS and MALDI-IMS localization reveal alterations in phosphatidic acid, diacylglycerol, and DHA in glioma stem cell xenografts. J. Proteome Res. 2015, 14, 2511–2519. [Google Scholar] [CrossRef] [PubMed]
- Holcapek, M.; Cervena, B.; Cifkova, E.; Lisa, M.; Chagovets, V.; Vostalova, J.; Bancirova, M.; Galuszka, J.; Hill, M. Lipidomic analysis of plasma, erythrocytes and lipoprotein fractions of cardiovascular disease patients using UHPLC/MS, MALDI-MS and multivariate data analysis. J. Chromatogr. B 2015, 990, 52–63. [Google Scholar] [CrossRef] [PubMed]
- Xu, L.; Kliman, M.; Forsythe, J.G.; Korade, Z.; Hmelo, A.B.; Porter, N.A.; McLean, J.A. Profiling and imaging ion mobility-mass spectrometry analysis of cholesterol and 7-dehydrocholesterol in cells via sputtered silver MALDI. J. Am. Soc. Mass Spectrom. 2015, 26, 924–933. [Google Scholar] [CrossRef] [PubMed]
- Korte, A.R.; Yandeau-Nelson, M.D.; Nikolau, B.J.; Lee, Y.J. Subcellular-level resolution MALDI-MS imaging of maize leaf metabolites by MALDI-linear ion trap-Orbitrap mass spectrometer. Anal. Bioanal. Chem. 2015, 407, 2301–2309. [Google Scholar] [CrossRef] [PubMed]
- Gemperline, E.; Jayaraman, D.; Maeda, J.; Ane, J.M.; Li, L. Multifaceted investigation of metabolites during nitrogen fixation in Medicago via high resolution MALDI-MS imaging and ESI-MS. J. Am. Soc. Mass Spectrom. 2015, 26, 149–158. [Google Scholar] [CrossRef] [PubMed]
- Barry, J.A.; Groseclose, M.R.; Robichaud, G.; Castellino, S.; Muddiman, D.C. Assessing drug and metabolite detection in liver tissue by UV-MALDI and IR-MALDESI mass spectrometry imaging coupled to FT-ICR MS. Int. J. Mass Spectrom. 2015, 377, 448–155. [Google Scholar] [CrossRef] [PubMed]
- Bhandari, D.R.; Shen, T.; Rompp, A.; Zorn, H.; Spengler, B. Analysis of cyathane-type diterpenoids from Cyathus striatus and Hericium erinaceus by high-resolution MALDI MS imaging. Anal. Bioanal. Chem. 2014, 406, 695–704. [Google Scholar] [CrossRef] [PubMed]
- Spengler, B.; Hubert, M. Scanning microprobe matrix-assisted laser desorption ionization (SMALDI) mass spectrometry: Instrumentation for sub-micrometer resolved LDI and MALDI surface analysis. J. Am. Soc. Mass Spectrom. 2002, 13, 735–748. [Google Scholar] [CrossRef]
- Bhandari, D.R.; Schott, M.; Rompp, A.; Vilcinskas, A.; Spengler, B. Metabolite localization by atmospheric pressure high-resolution scanning microprobe matrix-assisted laser desorption/ionization mass spectrometry imaging in whole-body sections and individual organs of the rove beetle Paederus riparius. Anal. Bioanal. Chem. 2015, 407, 2189–2201. [Google Scholar] [CrossRef] [PubMed]
- Schober, Y.; Schramm, T.; Spengler, B.; Rompp, A. Protein identification by accurate mass matrix-assisted laser desorption/ionization imaging of tryptic peptides. Rapid Commun. Mass Spectrom. 2011, 25, 2475–2483. [Google Scholar] [CrossRef] [PubMed]
- Rompp, A.; Guenther, S.; Takats, Z.; Spengler, B. Mass spectrometry imaging with high resolution in mass and space (HR2 MSI) for reliable investigation of drug compound distributions on the cellular level. Anal. Bioanal. Chem. 2011, 401, 65–73. [Google Scholar] [CrossRef] [PubMed]
- Comi, T.J.; Ryu, S.W.; Perry, R.H. Synchronized desorption electrospray ionization mass spectrometry imaging. Anal. Chem. 2016, 88, 1169–1175. [Google Scholar] [CrossRef] [PubMed]
- Eberlin, L.S. DESI-MS imaging of lipids and metabolites from biological samples. Methods Mol. Biol. 2014, 1198, 299–311. [Google Scholar] [PubMed]
- Barry, J.A.; Robichaud, G.; Bokhart, M.T.; Thompson, C.; Sykes, C.; Kashuba, A.D.; Muddiman, D.C. Mapping antiretroviral drugs in tissue by IR-MALDESI MSI coupled to the Q Exactive and comparison with LC-MS/MS SRM assay. J. Am. Soc. Mass Spectrom. 2014, 25, 2038–2047. [Google Scholar] [CrossRef] [PubMed]
- Robichaud, G.; Barry, J.A.; Garrard, K.P.; Muddiman, D.C. Infrared matrix-assisted laser desorption electrospray ionization (IR-MALDESI) imaging source coupled to a FT-ICR mass spectrometer. J. Am. Soc. Mass Spectrom. 2013, 24, 92–100. [Google Scholar] [CrossRef] [PubMed]
- Barry, J.A.; Muddiman, D.C. Global optimization of the infrared matrix-assisted laser desorption electrospray ionization (IR MALDESI) source for mass spectrometry using statistical design of experiments. Rapid Commun. Mass Spectrom. 2011, 25, 3527–3536. [Google Scholar] [CrossRef] [PubMed]
- Ojanperä, I.; Kolmonen, M.; Pelander, A. Current use of high-resolution mass spectrometry in drug screening relevant to clinical and forensic toxicology and doping control. Anal. Bioanal. Chem. 2012, 403, 1203–1220. [Google Scholar] [CrossRef] [PubMed]
- Wu, A.H.; Gerona, R.; Armenian, P.; French, D.; Petrie, M.; Lynch, K.L. Role of liquid chromatography-high-resolution mass spectrometry (LC-HR/MS) in clinical toxicology. Clin. Toxicol. 2012, 50, 733–742. [Google Scholar] [CrossRef] [PubMed]
- Martinez-Dominguez, G.; Romero-Gonzalez, R.; Garrido Frenich, A. Multi-class methodology to determine pesticides and mycotoxins in green tea and royal jelly supplements by liquid chromatography coupled to Orbitrap high resolution mass spectrometry. Food Chem. 2016, 197, 907–915. [Google Scholar] [CrossRef] [PubMed]
- Dzuman, Z.; Zachariasova, M.; Veprikova, Z.; Godula, M.; Hajslova, J. Multi-analyte high performance liquid chromatography coupled to high resolution tandem mass spectrometry method for control of pesticide residues, mycotoxins, and pyrrolizidine alkaloids. Anal. Chim. Acta 2015, 863, 29–40. [Google Scholar] [CrossRef] [PubMed]
- De Dominicis, E.; Commissati, I.; Suman, M. Targeted screening of pesticides, veterinary drugs and mycotoxins in bakery ingredients and food commodities by liquid chromatography-high-resolution single-stage Orbitrap mass spectrometry. J. Mass Spectrom. 2012, 47, 1232–1241. [Google Scholar] [CrossRef] [PubMed]
- Lattanzio, V.M.; Gatta, S.D.; Godula, M.; Visconti, A. Quantitative analysis of mycotoxins in cereal foods by collision cell fragmentation-high-resolution mass spectrometry: Performance and comparison with triple-stage quadrupole detection. Food Addit. Contam. Part A 2011, 28, 1424–1437. [Google Scholar] [CrossRef] [PubMed]
- Turnipseed, S.B.; Lohne, J.J.; Boison, J.O. Review: Application of high resolution mass spectrometry to monitor veterinary drug residues in aquacultured products. J. AOAC Int. 2015, 98, 550–558. [Google Scholar] [PubMed]
- Munoz, K.; Schmidt-Heydt, M.; Stoll, D.; Diehl, D.; Ziegler, J.; Geisen, R.; Schaumann, G.E. Effect of plastic mulching on mycotoxin occurrence and mycobiome abundance in soil samples from asparagus crops. Mycotoxin Res. 2015, 31, 191–201. [Google Scholar] [CrossRef] [PubMed]
- Lattanzio, V.M.; Ciasca, B.; Terzi, V.; Ghizzoni, R.; McCormick, S.P.; Pascale, M. Study of the natural occurrence of T-2 and HT-2 toxins and their glucosyl derivatives from field barley to malt by high-resolution Orbitrap mass spectrometry. Food Addit. Contam. Part A 2015, 32, 1647–1655. [Google Scholar] [CrossRef] [PubMed]
- Kelman, M.J.; Renaud, J.B.; Seifert, K.A.; Mack, J.; Sivagnanam, K.; Yeung, K.K.; Sumarah, M.W. Identification of six new Alternaria sulfoconjugated metabolites by high-resolution neutral loss filtering. Rapid Commun. Mass Spectrom. 2015, 29, 1805–1810. [Google Scholar] [CrossRef] [PubMed]
- Deng, Y.Y.; Jia, L.J.; Zhang, K.; Yin, H.W. Combinatorial biochemical and chemical analyses of polychlorinated dibenzo-p-dioxins and dibenzofurans in agricultural soils from Chongming Island, Shanghai, China. Bull. Environ. Contam. Toxicol. 2015, 94, 183–187. [Google Scholar] [CrossRef] [PubMed]
- Kiss, A.; Lucio, M.; Fildier, A.; Buisson, C.; Schmitt-Kopplin, P.; Cren-Olive, C. Doping control using high and ultra-high resolution mass spectrometry based non-targeted metabolomics-a case study of salbutamol and budesonide abuse. PLoS ONE 2013, 8, e74584. [Google Scholar] [CrossRef] [PubMed]
- Sun, J.; Liu, X.; Yang, T.; Slovin, J.; Chen, P. Profiling polyphenols of two diploid strawberry (Fragaria vesca) inbred lines using UHPLC-HRMSn. Food Chem. 2014, 146, 289–298. [Google Scholar] [CrossRef] [PubMed]
- Walker, A.; Lucio, M.; Pfitzner, B.; Scheerer, M.F.; Neschen, S.; de Angelis, M.H.; Hartmann, A.; Schmitt-Kopplin, P. Importance of sulfur-containing metabolites in discriminating fecal extracts between normal and type-2 diabetic mice. J. Proteome Res. 2014, 13, 4220–4231. [Google Scholar] [CrossRef] [PubMed]
- Walker, A.; Pfitzner, B.; Neschen, S.; Kahle, M.; Harir, M.; Lucio, M.; Moritz, F.; Tziotis, D.; Witting, M.; Rothballer, M.; et al. Distinct signatures of host-microbial meta-metabolome and gut microbiome in two C57BL/6 strains under high-fat diet. ISME J. 2014, 8, 2380–2396. [Google Scholar] [CrossRef] [PubMed]
- Nacher-Mestre, J.; Ibanez, M.; Serrano, R.; Perez-Sanchez, J.; Hernandez, F. Qualitative screening of undesirable compounds from feeds to fish by liquid chromatography coupled to mass spectrometry. J. Agric. Food Chem. 2013, 61, 2077–2087. [Google Scholar] [CrossRef] [PubMed]
- Winkler, J. High levels of dioxin-like PCBs found in organic-farmed eggs caused by coating materials of asbestos-cement fiber plates: A case study. Environ. Int. 2015, 80, 72–78. [Google Scholar] [CrossRef] [PubMed]
- Solliec, M.; Roy-Lachapelle, A.; Sauve, S. Quantitative performance of liquid chromatography coupled to Q-Exactive high resolution mass spectrometry (HRMS) for the analysis of tetracyclines in a complex matrix. Anal. Chim. Acta 2015, 853, 415–424. [Google Scholar] [CrossRef] [PubMed]
- Seiwert, B.; Golan-Rozen, N.; Weidauer, C.; Riemenschneider, C.; Chefetz, B.; Hadar, Y.; Reemtsma, T. Electrochemistry combined with LC-HRMS: Elucidating transformation products of the recalcitrant pharmaceutical compound carbamazepine generated by the white-rot fungus Pleurotus ostreatus. Environ. Sci. Technol. 2015, 49, 12342–12350. [Google Scholar] [CrossRef] [PubMed]
- Matsumoto, R.; Tu, N.P.; Haruta, S.; Kawano, M.; Takeuchi, I. Polychlorinated biphenyl (PCB) concentrations and congener composition in masu salmon from Japan: A study of all 209 PCB congeners by high-resolution gas chromatography/high-resolution mass spectrometry (HRGC/HRMS). Mar. Pollut. Bull. 2014, 85, 549–557. [Google Scholar] [CrossRef] [PubMed]
- Kakimoto, K.; Nagayoshi, H.; Konishi, Y.; Kajimura, K.; Ohura, T.; Hayakawa, K.; Toriba, A. Atmospheric chlorinated polycyclic aromatic hydrocarbons in East Asia. Chemosphere 2014, 111, 40–46. [Google Scholar] [CrossRef] [PubMed]
- Song, Y.; Wu, N.; Han, J.; Shen, H.; Tan, Y.; Ding, G.; Xiang, J.; Tao, H.; Jin, S. Levels of PCDD/Fs and DL-PCBs in selected foods and estimated dietary intake for the local residents of Luqiao and Yuhang in Zhejiang, China. Chemosphere 2011, 85, 329–334. [Google Scholar] [CrossRef] [PubMed]
- Woudneh, M.B.; Ou, Z.; Sekela, M.; Tuominen, T.; Gledhill, M. Pesticide multiresidues in waters of the Lower Fraser Valley, British Columbia, Canada. Part I. Surface water. J. Environ. Qual. 2009, 38, 940–947. [Google Scholar] [CrossRef] [PubMed]
- Katajamaa, M.; Oresic, M. Data processing for mass spectrometry-based metabolomics. J Chromatogr A 2007, 1158, 318–328. [Google Scholar] [CrossRef] [PubMed]
- Madsen, R.; Lundstedt, T.; Trygg, J. Chemometrics in metabolomics—A review in human disease diagnosis. Anal. Chim. Acta 2010, 659, 23–33. [Google Scholar] [CrossRef] [PubMed]
- Blekherman, G.; Laubenbacher, R.; Cortes, D.F.; Mendes, P.; Torti, F.M.; Akman, S.; Torti, S.V.; Shulaev, V. Bioinformatics tools for cancer metabolomics. Metabolomics 2011, 7, 329–343. [Google Scholar] [CrossRef] [PubMed]
- Markley, J.L.; Anderson, M.E.; Cui, Q.; Eghbalnia, H.R.; Lewis, I.A.; Hegeman, A.D.; Li, J.; Schulte, C.F.; Sussman, M.R.; Westler, W.M.; et al. New bioinformatics resources for metabolomics. Pac. Symp. Biocomput. 2007, 12, 157–168. [Google Scholar]
- Gougeon, R.D.; Lucio, M.; Frommberger, M.; Peyron, D.; Chassagne, D.; Alexandre, H.; Feuillat, F.; Voilley, A.; Cayot, P.; Gebefugi, I.; et al. The chemodiversity of wines can reveal a metabologeography expression of cooperage oak wood. Proc. Natl. Acad. Sci. USA 2009, 106, 9174–9179. [Google Scholar] [CrossRef] [PubMed]
- Roullier-Gall, C.; Witting, M.; Tziotis, D.; Ruf, A.; Gougeon, R.D.; Schmitt-Kopplin, P. Integrating analytical resolutions in non-targeted wine metabolomics. Tetrahedron 2015, 71, 2983–2990. [Google Scholar] [CrossRef]
- Longnecker, K.; Futrelle, J.; Coburn, E.; Kido Soule, M.C.; Kujawinski, E.B. Environmental metabolomics: Databases and tools for data analysis. Mar. Chem. 2015, 177, 366–373. [Google Scholar] [CrossRef]
- Roux, A.; Xu, Y.; Heilier, J.F.; Olivier, M.F.; Ezan, E.; Tabet, J.C.; Junot, C. Annotation of the human adult urinary metabolome and metabolite identification using ultra high performance liquid chromatography coupled to a linear quadrupole ion trap-Orbitrap mass spectrometer. Anal. Chem. 2012, 84, 6429–6437. [Google Scholar] [CrossRef] [PubMed]
- Far, J.; Delvaux, C.; Kune, C.; Eppe, G.; de Pauw, E. The use of ion mobility mass spectrometry for isomer composition determination extracted from Se-rich yeast. Anal. Chem. 2014, 86, 11246–11254. [Google Scholar] [CrossRef] [PubMed]
- Sumner, L.W.; Amberg, A.; Barrett, D.; Beale, M.H.; Beger, R.; Daykin, C.A.; Fan, T.W.; Fiehn, O.; Goodacre, R.; Griffin, J.L.; et al. Proposed minimum reporting standards for chemical analysis Chemical Analysis Working Group (CAWG) Metabolomics Standards Initiative (MSI). Metabolomics 2007, 3, 211–221. [Google Scholar] [CrossRef] [PubMed]
- Bolton, E.E.; Wang, Y.; Thiessen, P.A.; Bryant, S.H. Chapter 12—PubChem: Integrated platform of small molecules and biological activities. In Annual Reports in Computational Chemistry; Ralph, A.W., David, C.S., Eds.; Elsevier: Amsterdam, The Netherlands, 2008; Volume 4, pp. 217–241. [Google Scholar]
- Kim, S.; Thiessen, P.A.; Bolton, E.E.; Chen, J.; Fu, G.; Gindulyte, A.; Han, L.; He, J.; He, S.; Shoemaker, B.A.; et al. PubChem substance and compound databases. Nucleic Acids Res. 2016, 44, D1202–D1213. [Google Scholar] [CrossRef] [PubMed]
- The PubChem Project. Available online: https://pubchem.ncbi.nlm.nih.gov (accessed on 24 May 2016).
- Little, J.L.; Williams, A.J.; Pshenichnov, A.; Tkachenko, V. Identification of “known unknowns” utilizing accurate mass data and ChemSpider. J. Am. Soc. Mass Spectrom. 2012, 23, 179–185. [Google Scholar] [CrossRef] [PubMed]
- Pence, H.E.; Williams, A. ChemSpider: An online chemical information resource. J. Chem. Educ. 2010, 87, 1123–1124. [Google Scholar] [CrossRef]
- ChemSpider. Available online: http://www.chemspider.com (accessed on 24 May 2016).
- Scripps Center for Metabolomics and Mass Spectrometry. Available online: https://metlin.scripps.edu (accessed on 24 May 2016).
- Tautenhahn, R.; Cho, K.; Uritboonthai, W.; Zhu, Z.; Patti, G.J.; Siuzdak, G. An accelerated workflow for untargeted metabolomics using the METLIN database. Nat. Biotechnol. 2012, 30, 826–828. [Google Scholar] [CrossRef] [PubMed]
- Sana, T.R.; Roark, J.C.; Li, X.; Waddell, K.; Fischer, S.M. Molecular formula and METLIN personal metabolite database matching applied to the identification of compounds generated by LC/TOF-MS. J. Biomol. Tech. 2008, 19, 258–266. [Google Scholar] [PubMed]
- Smith, C.A.; O’Maille, G.; Want, E.J.; Qin, C.; Trauger, S.A.; Brandon, T.R.; Custodio, D.E.; Abagyan, R.; Siuzdak, G. METLIN: A metabolite mass spectral database. Ther. Drug Monit. 2005, 27, 747–751. [Google Scholar] [CrossRef] [PubMed]
- Wagele, B.; Witting, M.; Schmitt-Kopplin, P.; Suhre, K. MassTRIX reloaded: Combined analysis and visualization of transcriptome and metabolome data. PLoS ONE 2012, 7, e39860. [Google Scholar] [CrossRef] [PubMed]
- Suhre, K.; Schmitt-Kopplin, P. MassTRIX: Mass translator into pathways. Nucleic Acids Res. 2008, 36, W481–W484. [Google Scholar] [CrossRef] [PubMed]
- Witting, M.; Schmitt-Kopplin, P. Transcriptome and metabolome data integration—Technical perquisites for successful data fusion and visualization. In Comprehensive Analytical Chemistry; Carolina Simó, A.C., Virginia, G.-C., Eds.; Elsevier: Newnes, Australia, 2014; pp. 421–442. [Google Scholar]
- Tziotis, D.; Hertkorn, N.; Schmitt-Kopplin, P. Kendrick-analogous network visualisation of ion cyclotron resonance Fourier transform mass spectra: Improved options for the assignment of elemental compositions and the classification of organic molecular complexity. Eur. J. Mass Spectrom. 2011, 17, 415–421. [Google Scholar] [CrossRef] [PubMed]
- Forcisi, S.; Moritz, F.; Lucio, M.; Lehmann, R.; Stefan, N.; Schmitt-Kopplin, P. Solutions for low and high accuracy mass spectrometric data matching: A data-driven annotation strategy in nontargeted metabolomics. Anal. Chem. 2015, 87, 8917–8924. [Google Scholar] [CrossRef] [PubMed]
- Wixon, J.; Kell, D. The Kyoto encyclopedia of genes and genomes—KEGG. Yeast 2000, 17, 48–55. [Google Scholar] [PubMed]
- Kanehisa, M.; Goto, S. KEGG: Kyoto encyclopedia of genes and genomes. Nucleic Acids Res. 2000, 28, 27–30. [Google Scholar] [CrossRef] [PubMed]
- Cui, Q.; Lewis, I.A.; Hegeman, A.D.; Anderson, M.E.; Li, J.; Schulte, C.F.; Westler, W.M.; Eghbalnia, H.R.; Sussman, M.R.; Markley, J.L. Metabolite identification via the madison metabolomics consortium database. Nat. Biotechnol. 2008, 26, 162–164. [Google Scholar] [CrossRef] [PubMed]
- Wishart, D.S.; Knox, C.; Guo, A.C.; Eisner, R.; Young, N.; Gautam, B.; Hau, D.D.; Psychogios, N.; Dong, E.; Bouatra, S.; et al. HMDB: A knowledgebase for the human metabolome. Nucleic Acids Res. 2009, 37, D603–D610. [Google Scholar] [CrossRef] [PubMed]
- Wishart, D.S.; Tzur, D.; Knox, C.; Eisner, R.; Guo, A.C.; Young, N.; Cheng, D.; Jewell, K.; Arndt, D.; Sawhney, S.; et al. HMDB: The human metabolome database. Nucleic Acids Res. 2007, 35, D521–D526. [Google Scholar] [CrossRef] [PubMed]
- Fahy, E.; Sud, M.; Cotter, D.; Subramaniam, S. LIPID MAPS online tools for lipid research. Nucleic Acids Res. 2007, 35, W606–W612. [Google Scholar] [CrossRef] [PubMed]
- Sud, M.; Fahy, E.; Cotter, D.; Brown, A.; Dennis, E.A.; Glass, C.K.; Merrill, A.H., Jr.; Murphy, R.C.; Raetz, C.R.; Russell, D.W.; et al. LMSD: LIPID MAPS structure database. Nucleic Acids Res. 2007, 35, D527–D532. [Google Scholar] [CrossRef] [PubMed]
- Zhou, B.; Wang, J.; Ressom, H.W. MetaboSearch: Tool for mass-based metabolite identification using multiple databases. PLoS ONE 2012, 7, e40096. [Google Scholar] [CrossRef] [PubMed]
- Taguchi, R.; Ishikawa, M. Precise and global identification of phospholipid molecular species by an Orbitrap mass spectrometer and automated search engine Lipid Search. J. Chromatogr. A 2010, 1217, 4229–4239. [Google Scholar] [CrossRef] [PubMed]
- Herzog, R.; Schwudke, D.; Shevchenko, A. LipidXplorer: Software for quantitative shotgun lipidomics compatible with multiple mass spectrometry platforms. Curr. Protoc. Bioinform. 2013, 11, 14.12:1–14.12:30. [Google Scholar]
- Narvaez-Rivas, M.; Zhang, Q. Comprehensive untargeted lipidomic analysis using core-shell C30 particle column and high field orbitrap mass spectrometer. J. Chromatogr. A 2016, 1440, 123–134. [Google Scholar] [CrossRef] [PubMed]
- Breitkopf, S.B.; Yuan, M.; Helenius, K.P.; Lyssiotis, C.A.; Asara, J.M. Triomics analysis of imatinib-treated myeloma cells connects kinase inhibition to RNA processing and decreased lipid biosynthesis. Anal. Chem. 2015, 87, 10995–11006. [Google Scholar] [CrossRef] [PubMed]
- Tafesse, F.G.; Rashidfarrokhi, A.; Schmidt, F.I.; Freinkman, E.; Dougan, S.; Dougan, M.; Esteban, A.; Maruyama, T.; Strijbis, K.; Ploegh, H.L. Disruption of sphingolipid biosynthesis blocks phagocytosis of Candida albicans. PLoS Pathog. 2015, 11, e1005188. [Google Scholar] [CrossRef] [PubMed]
- Trevino, M.B.; Machida, Y.; Hallinger, D.R.; Garcia, E.; Christensen, A.; Dutta, S.; Peake, D.A.; Ikeda, Y.; Imai, Y. Perilipin 5 regulates islet lipid metabolism and insulin secretion in a cAMP-dependent manner: Implication of its role in the postprandial insulin secretion. Diabetes 2015, 64, 1299–1310. [Google Scholar] [CrossRef] [PubMed]
- Yamada, T.; Uchikata, T.; Sakamoto, S.; Yokoi, Y.; Fukusaki, E.; Bamba, T. Development of a lipid profiling system using reverse-phase liquid chromatography coupled to high-resolution mass spectrometry with rapid polarity switching and an automated lipid identification software. J. Chromatogr. A 2013, 1292, 211–218. [Google Scholar] [CrossRef] [PubMed]
- Song, H.; Hsu, F.F.; Ladenson, J.; Turk, J. Algorithm for processing raw mass spectrometric data to identify and quantitate complex lipid molecular species in mixtures by data-dependent scanning and fragment ion database searching. J. Am. Soc. Mass Spectrom. 2007, 18, 1848–1858. [Google Scholar] [CrossRef] [PubMed]
- Haimi, P.; Uphoff, A.; Hermansson, M.; Somerharju, P. Software tools for analysis of mass spectrometric lipidome data. Anal. Chem. 2006, 78, 8324–8331. [Google Scholar] [CrossRef] [PubMed]
- Leavell, M.D.; Leary, J.A. Fatty acid analysis tool (FAAT): An FT-ICR MS lipid analysis algorithm. Anal. Chem. 2006, 78, 5497–5503. [Google Scholar] [CrossRef] [PubMed]
- Hubner, G.; Crone, C.; Lindner, B. lipID—A software tool for automated assignment of lipids in mass spectra. J. Mass Spectrom. 2009, 44, 1676–1683. [Google Scholar] [CrossRef] [PubMed]
- Song, H.; Ladenson, J.; Turk, J. Algorithms for automatic processing of data from mass spectrometric analyses of lipids. J. Chromatogr. B 2009, 877, 2847–2854. [Google Scholar] [CrossRef] [PubMed]
- Kasper, P.T.; Rojas-Cherto, M.; Mistrik, R.; Reijmers, T.; Hankemeier, T.; Vreeken, R.J. Fragmentation trees for the structural characterisation of metabolites. Rapid Commun. Mass Spectrom. 2012, 26, 2275–2286. [Google Scholar] [CrossRef] [PubMed]
- Sheldon, M.T.; Mistrik, R.; Croley, T.R. Determination of ion structures in structurally related compounds using precursor ion fingerprinting. J. Am. Soc. Mass Spectrom. 2009, 20, 370–376. [Google Scholar] [CrossRef] [PubMed]
- mzCloud—Advanced Mass Spectral Database. Available online: https://www.mzcloud.org (accessed on 24 May 2016).


© 2016 by the authors; licensee MDPI, Basel, Switzerland. This article is an open access article distributed under the terms and conditions of the Creative Commons Attribution (CC-BY) license (http://creativecommons.org/licenses/by/4.0/).
Share and Cite
Ghaste, M.; Mistrik, R.; Shulaev, V. Applications of Fourier Transform Ion Cyclotron Resonance (FT-ICR) and Orbitrap Based High Resolution Mass Spectrometry in Metabolomics and Lipidomics. Int. J. Mol. Sci. 2016, 17, 816. https://doi.org/10.3390/ijms17060816
Ghaste M, Mistrik R, Shulaev V. Applications of Fourier Transform Ion Cyclotron Resonance (FT-ICR) and Orbitrap Based High Resolution Mass Spectrometry in Metabolomics and Lipidomics. International Journal of Molecular Sciences. 2016; 17(6):816. https://doi.org/10.3390/ijms17060816
Chicago/Turabian StyleGhaste, Manoj, Robert Mistrik, and Vladimir Shulaev. 2016. "Applications of Fourier Transform Ion Cyclotron Resonance (FT-ICR) and Orbitrap Based High Resolution Mass Spectrometry in Metabolomics and Lipidomics" International Journal of Molecular Sciences 17, no. 6: 816. https://doi.org/10.3390/ijms17060816
APA StyleGhaste, M., Mistrik, R., & Shulaev, V. (2016). Applications of Fourier Transform Ion Cyclotron Resonance (FT-ICR) and Orbitrap Based High Resolution Mass Spectrometry in Metabolomics and Lipidomics. International Journal of Molecular Sciences, 17(6), 816. https://doi.org/10.3390/ijms17060816