Article

The Opposite Effect of Metal Ions on Short-/Long-Range Water Structure: A Multiple Characterization Study

School of Environmental Science and Engineering, Tianjin University, Tianjin 300072, China
*
Author to whom correspondence should be addressed.
Int. J. Mol. Sci. 2016, 17(5), 602; https://doi.org/10.3390/ijms17050602
Submission received: 15 March 2016 / Revised: 14 April 2016 / Accepted: 18 April 2016 / Published: 25 April 2016
(This article belongs to the Section Physical Chemistry, Theoretical and Computational Chemistry)

Abstract

:
Inorganic electrolyte solutions are very important in our society as they dominate many biochemical and geochemical processes. Herein, an in-depth study was performed to illustrate the ion-induced effect on water structure by coupling NMR, viscometer, Raman and Molecular Dynamic (MD) simulations. The NMR coefficient (BNMR) and diffusion coefficient (D) from NMR, and viscosity coefficient (Bvis) from a viscometer all proved that dissolved metal ions are capable of enhancing the association degree of adjacent water molecules, and the impact on water structure decreased in the order of Cr3+ > Fe3+ > Cu2+ > Zn2+. This regularity was further evidenced by Raman analysis; however, the deconvoluted Raman spectrum indicated the decrease in high association water with salt concentration and the increase in low association water before 200 mmol·L−1. By virtue of MD simulations, the opposite changing manner proved to be the result of the opposite effect on short-/long-range water structure induced by metal ions. Our results may help to explain specific protein denaturation induced by metal ions.

1. Introduction

It is well known that salt solution, as compared to pure water, is characterized by four colligative properties, i.e., freezing point depression, boiling point elevation, vapor pressure lowering, and osmotic pressure [1], which makes it used in dialysis, melting snow, etc. Besides anions, cations dissolved in aqueous solution have proved to be the key to the changes in water properties [1,2]. In addition, metal ions can also interact with a variety of biomolecules, such as protein [3] and DNA [4], and further lead to their structural changes to different extents. In this process, metal ions may bind directly with the functional groups on biomolecules [3,5] but may also indirectly force biomolecules to degenerate by alternating the water structure surrounding the biomolecules [6]. As a result, a complete knowledge of solution structure is very important to understand metal ion-related chemical and biological phenomena occurring in our daily life.
In recent years, the effects of dissolved metal ions on surrounding water molecules have been extensively characterized by Terahertz Time-Domain Spectroscopy (THz TDS), Raman/IR, NMR, Molecular Dynamic (MD) simulations, etc. Kropman and Bakker [7] found the hydrogen-bonding (HB) dynamics of water molecules solvating Cl, Br, I anions slow compared with pure water, indicating the remarkable influence of center ions on solvating water molecules. Furthermore, this group observed significant dependence of vibrational lifetime of hydration water on the nature of metal ions [8], but the enhancement of the HB network upon adding ions is confined within the first solvation shell as indicated by the changes in rotational dynamics [9]. In addition to HB dynamics, static water structures have also been determined to study the metal ion-induced effects. An X-ray diffraction study suggested that the KCl unit in aqueous solution could control 45 water molecules to form rigid spherical structure [10]. Another neutron diffraction study provided compelling evidence that Ca2+ could have an impact on the hydrogen structure in the second hydration shell [11]. In 2012, an IR photodissociation study on water nanodrops involving ions, manifested that the ion-induced effect on water structure propagates all the way to the distance more than 1 nm from the ion, corresponding to 250 water molecules [12]. Thus, ions are very likely to have effects on both the adjacent hydration water and those far away from center ions, which is still waiting for further study.
Moreover, the ion-induced effects are always ion-specific. For example, K+ and Cs+ were found to have “negative hydration” effect, which means that the water molecules near the ions become more mobile than in pure water [13]. On the contrary, the bivalent ion, Mg2+, was found to interact intensively with molecules in the first solvation shell [14], and to enhance the HB intensity within aqueous solution [15]. As for another monovalent, Na+ just manifested a very slight effect on the average diffusion of water [16], and has been believed to be the borderline between strong and weak interaction [17]. This difference may be the origin of “kosmotropes” and “chaotropes”. Even though still controversial, this classification has suggested that the stark contrast in ion-related effects may originate from ionic charge [15], ionic radius [18], or ionic charge density [18,19].
Interestingly, a previous THz TDS study showed that, the dissolved cations can have an effect on both hydration water molecules and those beyond hydration shells [20]. To further address this suspending problem, multiple characterization methods were adopted to analyze the structural features of CrCl3, FeCl3, CuCl2 and ZnCl2 solutions. In this work, NMR coefficient (BNMR) and diffusion coefficient (D) were obtained to analyze the ion-induced influence on water association degree and to evaluate the difference among the four metal ions. Then, the alteration in water structure nearby was further discussed by comparing viscosity coefficient (Bvis). Subsequently, the Raman spectra of aqueous solutions with different concentrations were recorded and deconvoluted to find out the changes in content of different water species upon ion addition. Finally, the ion-induced effect on short-/long-range water structure was confirmed by studying Radial Distribution Function (RDF) obtained from MD simulations.

2. Results

2.1. NMR Analysis

NMR is very sensitive to the changes in chemical environment of specific element, which makes it suitable for solution structure characterization. Here, we make use of two characteristic parameters from NMR to analyze the variations in association degree of hydrogen bond network upon adding different electrolytes into the solutions.

2.1.1. Spin-Lattice Relaxation Time (T1)

T1 can reflect the process of energy exchange between excited atoms and surroundings, in other words, the smaller T1 means the stronger bounds between target atoms and surroundings within the system. T0 is the spin-lattice relaxation time of pure water. The T1 of ZnCl2, CuCl2, FeCl3 and CrCl3 aqueous solutions at different concentrations were shown Figure 1. From Figure 1, we can see that the T0/T1 of the four electrolyte solutions increased with concentrations in a linear fashion, which is in accordance with the observations from Engel and Hertz [21].
According to Engel and Hertz [21], the relation between T0, T1 and solution concentration could be depicted by Equation (1):
[ ( 1 / T 1 ) / ( 1 / T 0 ) ] = 1 + B N M R C + · · ·
where T0, T1 are the spin-lattice relaxation time of pure water and aqueous solution, respectively, ms. C is the solution concentration, mmol·L−1. BNMR is the NMR coefficient, L·mmol−1, and could reflect the influence of electrolyte on the association degree of the solution system. Hence, four empirical Equations (2)–(5) were obtained by linear fitting the experimental data to Equation (1), and the fitting line can be seen in Figure 1.
T 0 / T 1 = 0.99844 + 0.05646 C CrCl 3 R 2 = 0.99023
T 0 / T 1 = 0.99959 + 0.05082 C FeCl 3 R 2 = 0.99681
T 0 / T 1 = 0.99996 + 0.02771 C CuCl 2 R 2 = 0.99943
T 0 / T 1 = 1.00005 + 0.02349 C ZnCl 2 R 2 = 0.99986
According to the four equations, the BNMR were all larger than zero, which means the association degree of the aqueous solutions on average are higher than that of pure water due to the addition of four electrolytes. Importantly, it has been reported that Cl has negligible effect on water hydrogen bond network [22,23], so the difference in association degree between aqueous solution and pure water is due mainly to the metal ions appearing in the solution. Considering that there are no other additives except for metal chloride in all sample solutions, the discussion on structural changes in the following parts would just be proceeded based on the differences in dissolved metal ions.

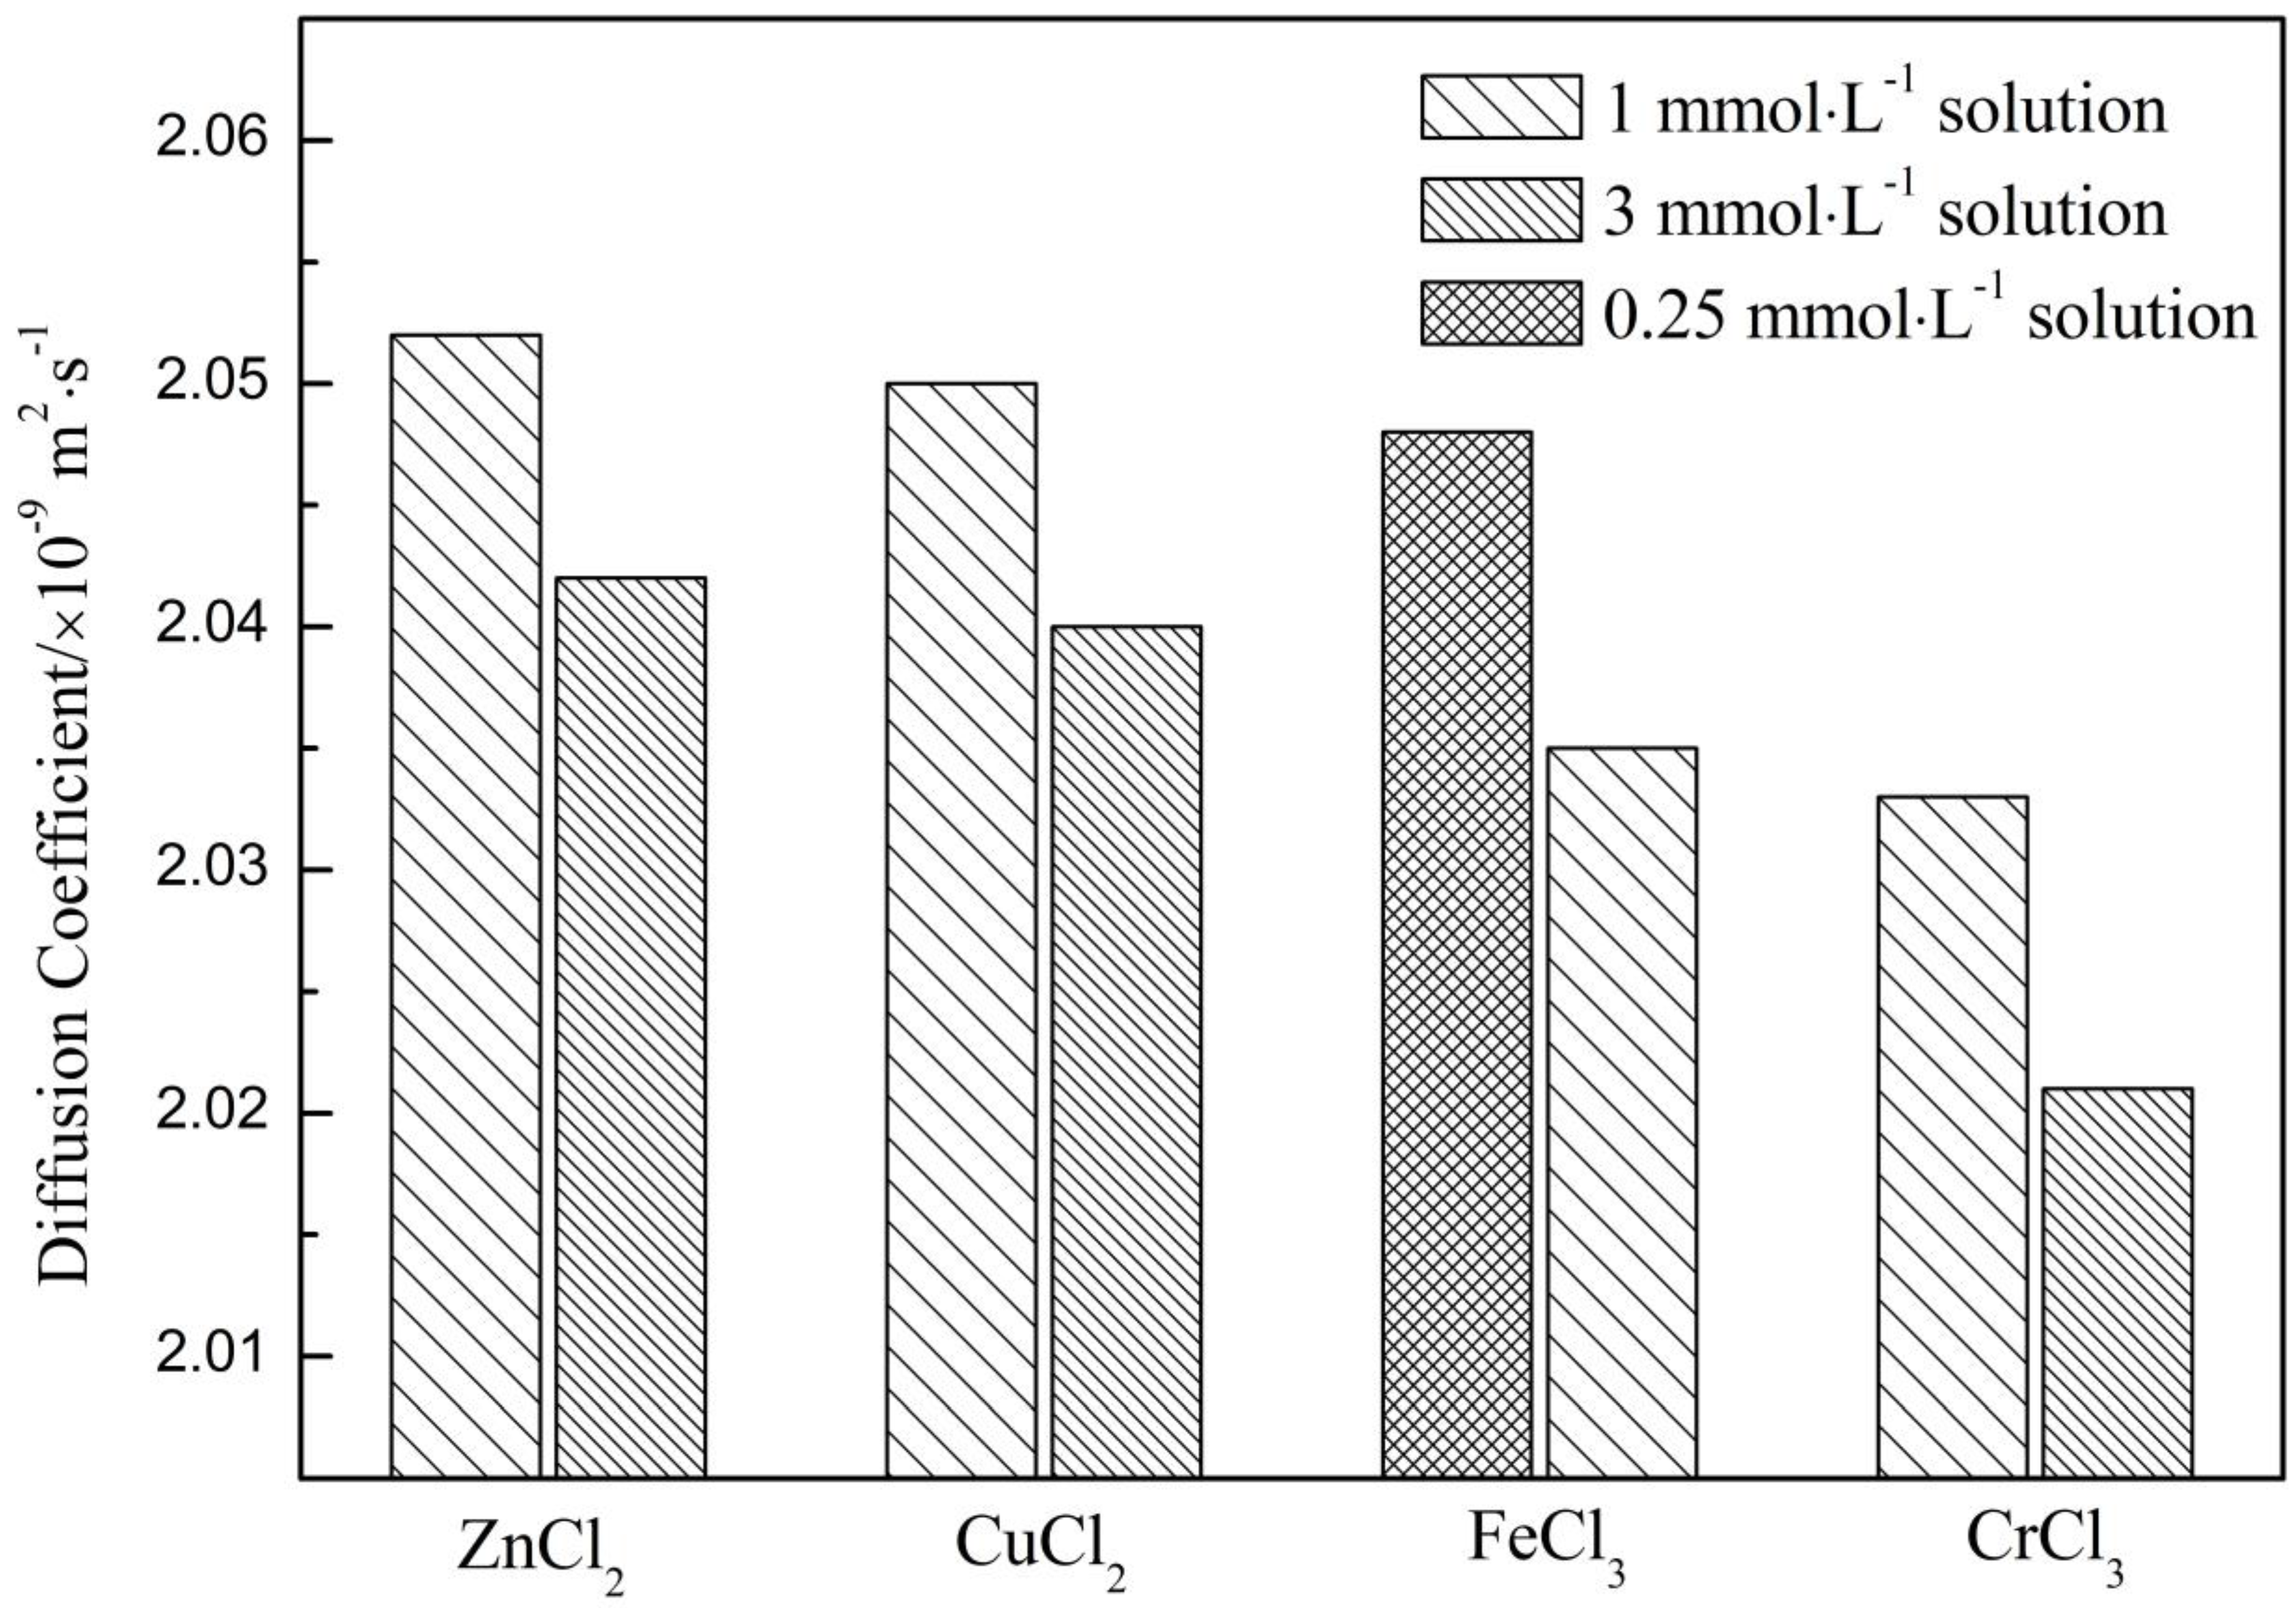
2.1.2. Diffusion Coefficient (D)

The molecular translational motion in solution is commonly referred to as self-diffusion and is defined with a self-diffusion coefficient D [24]. According to Cohen et al. [25], compared with free diffusion, the restricted diffusion was characterized by a modified diffusion behavior as indicated by the mean displacement experienced by the diffusing molecular species. Thus, the force on translational water molecule exerted by metal ions could be manifested by D.
First, we obtained a diffusion coefficient of H2O at 298.15 K, D = 2.058 × 10⁻⁹ m2·s−1, which was almost identical to another Pulsed Gradient Spin-Echo (PGSE) NMR result (2.11 ± 0.20 × 10⁻⁹ m2·s−1) acquired under the same condition [26]. However, the diffusion coefficient of D2O (1.762 × 10⁻⁹ m2·s−1) obtained here was much smaller than that of H2O. Up to now, many IR studies have shown that D2O bears hydrogen bond interaction stronger than H2O at the presence of the red-shift of OH stretching vibration peak [27,28,29]. Thus, the difference in D just reflects the enhancement in hydrogen bond network of D2O. Furthermore, the diffusion coefficient of four electrolyte aqueous solutions could be compared in Figure 2. It is obvious that the diffusion coefficients of aqueous solutions are smaller than that of H2O but much larger than that of D2O at the meantime. In addition, the diffusion coefficients of the aqueous solutions would further decrease with metal ion concentration increasing from 1 to 3 mmol·L−1 for ZnCl2, CuCl2 and CrCl3 solutions, from 0.25 to 1 mmol·L−1 for FeCl3 solutions. That is to say, the translational motion of water molecule on average would be further confined with increasing salt concentration.
Moreover, according to Figure 2, the diffusion coefficients of 1 mmol·L−1 metal ion solution followed the order: D(H2O) > D(ZnCl2) > D(CuCl2) > D(FeCl3) > D(CrCl3) > D(D2O). That is to say, the ability in enhancing association degree of water decrease in the order of Cr3+ > Fe3+ > Cu2+ > Zn2+. Not only that, the BNMR for the four electrolytes also followed the order: Cr3+ > Fe3+ > Cu2+ > Zn2+ (see Section 2.1.1). The identical order of D and BNMR indicated that the NMR is suitable for manifesting the metal ion-induced effect on water structure. The concrete reason for the difference in changing water structure would be discussed by combining viscosity and Raman results.

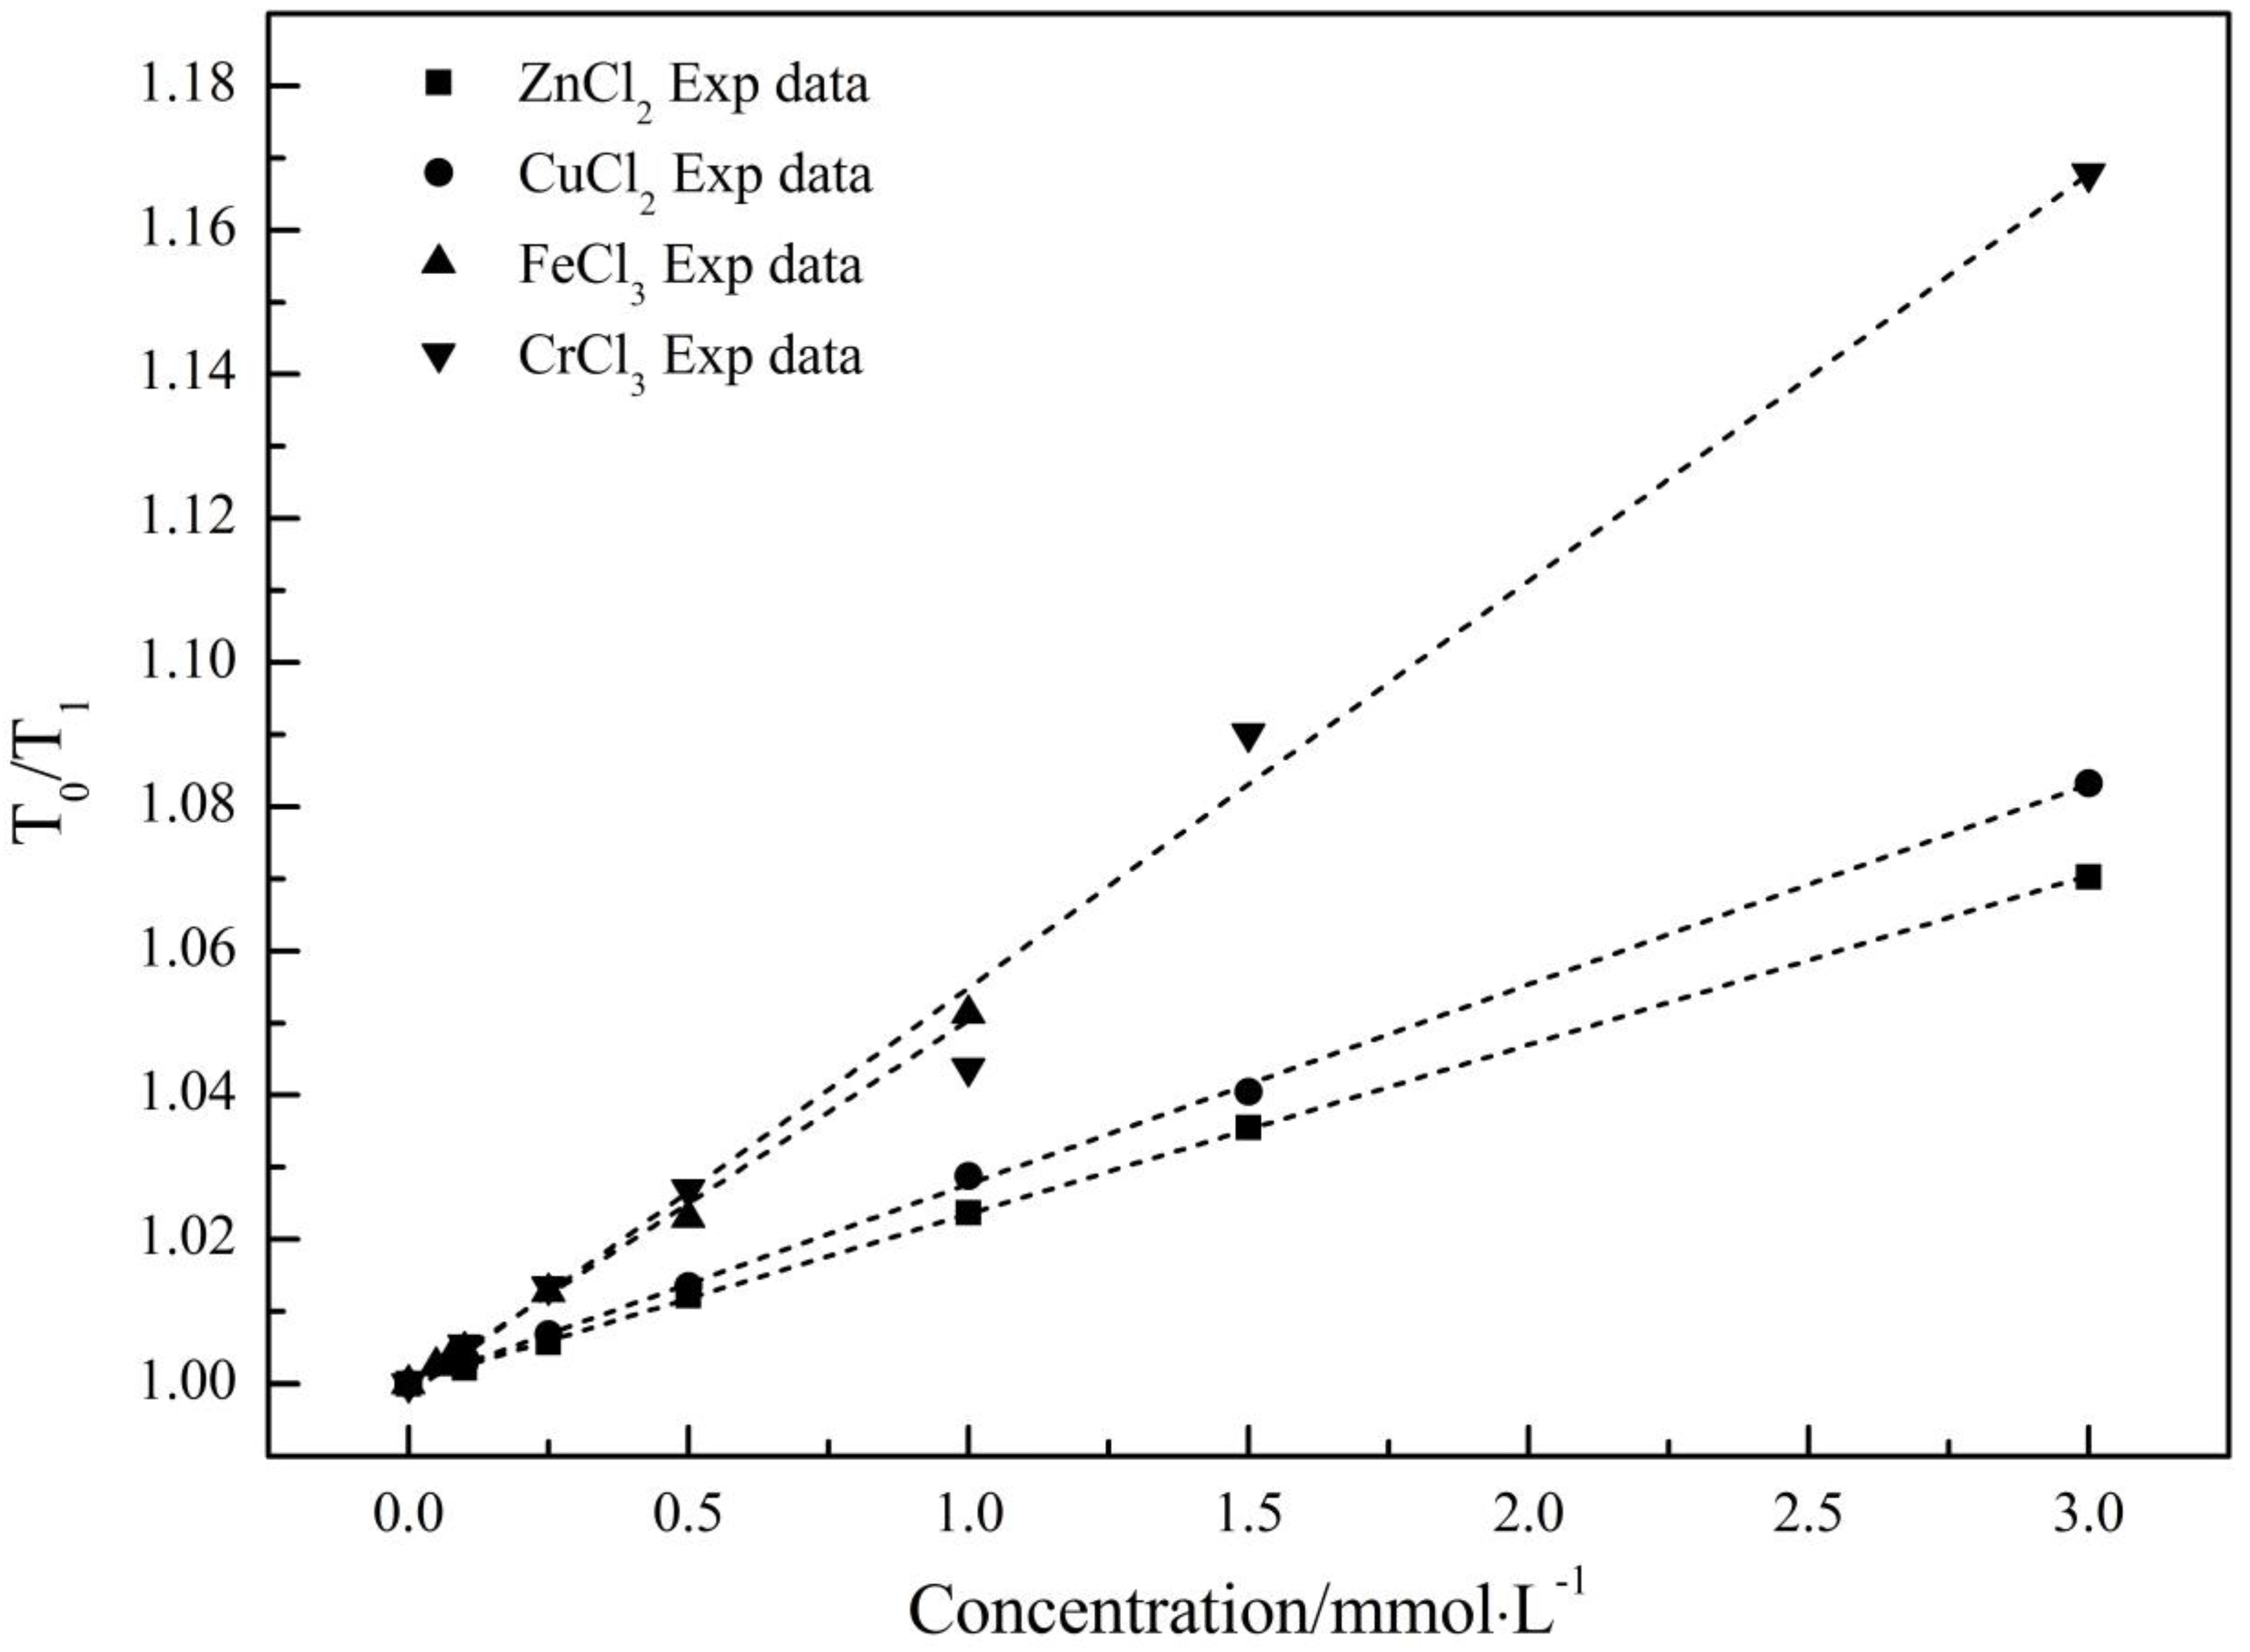
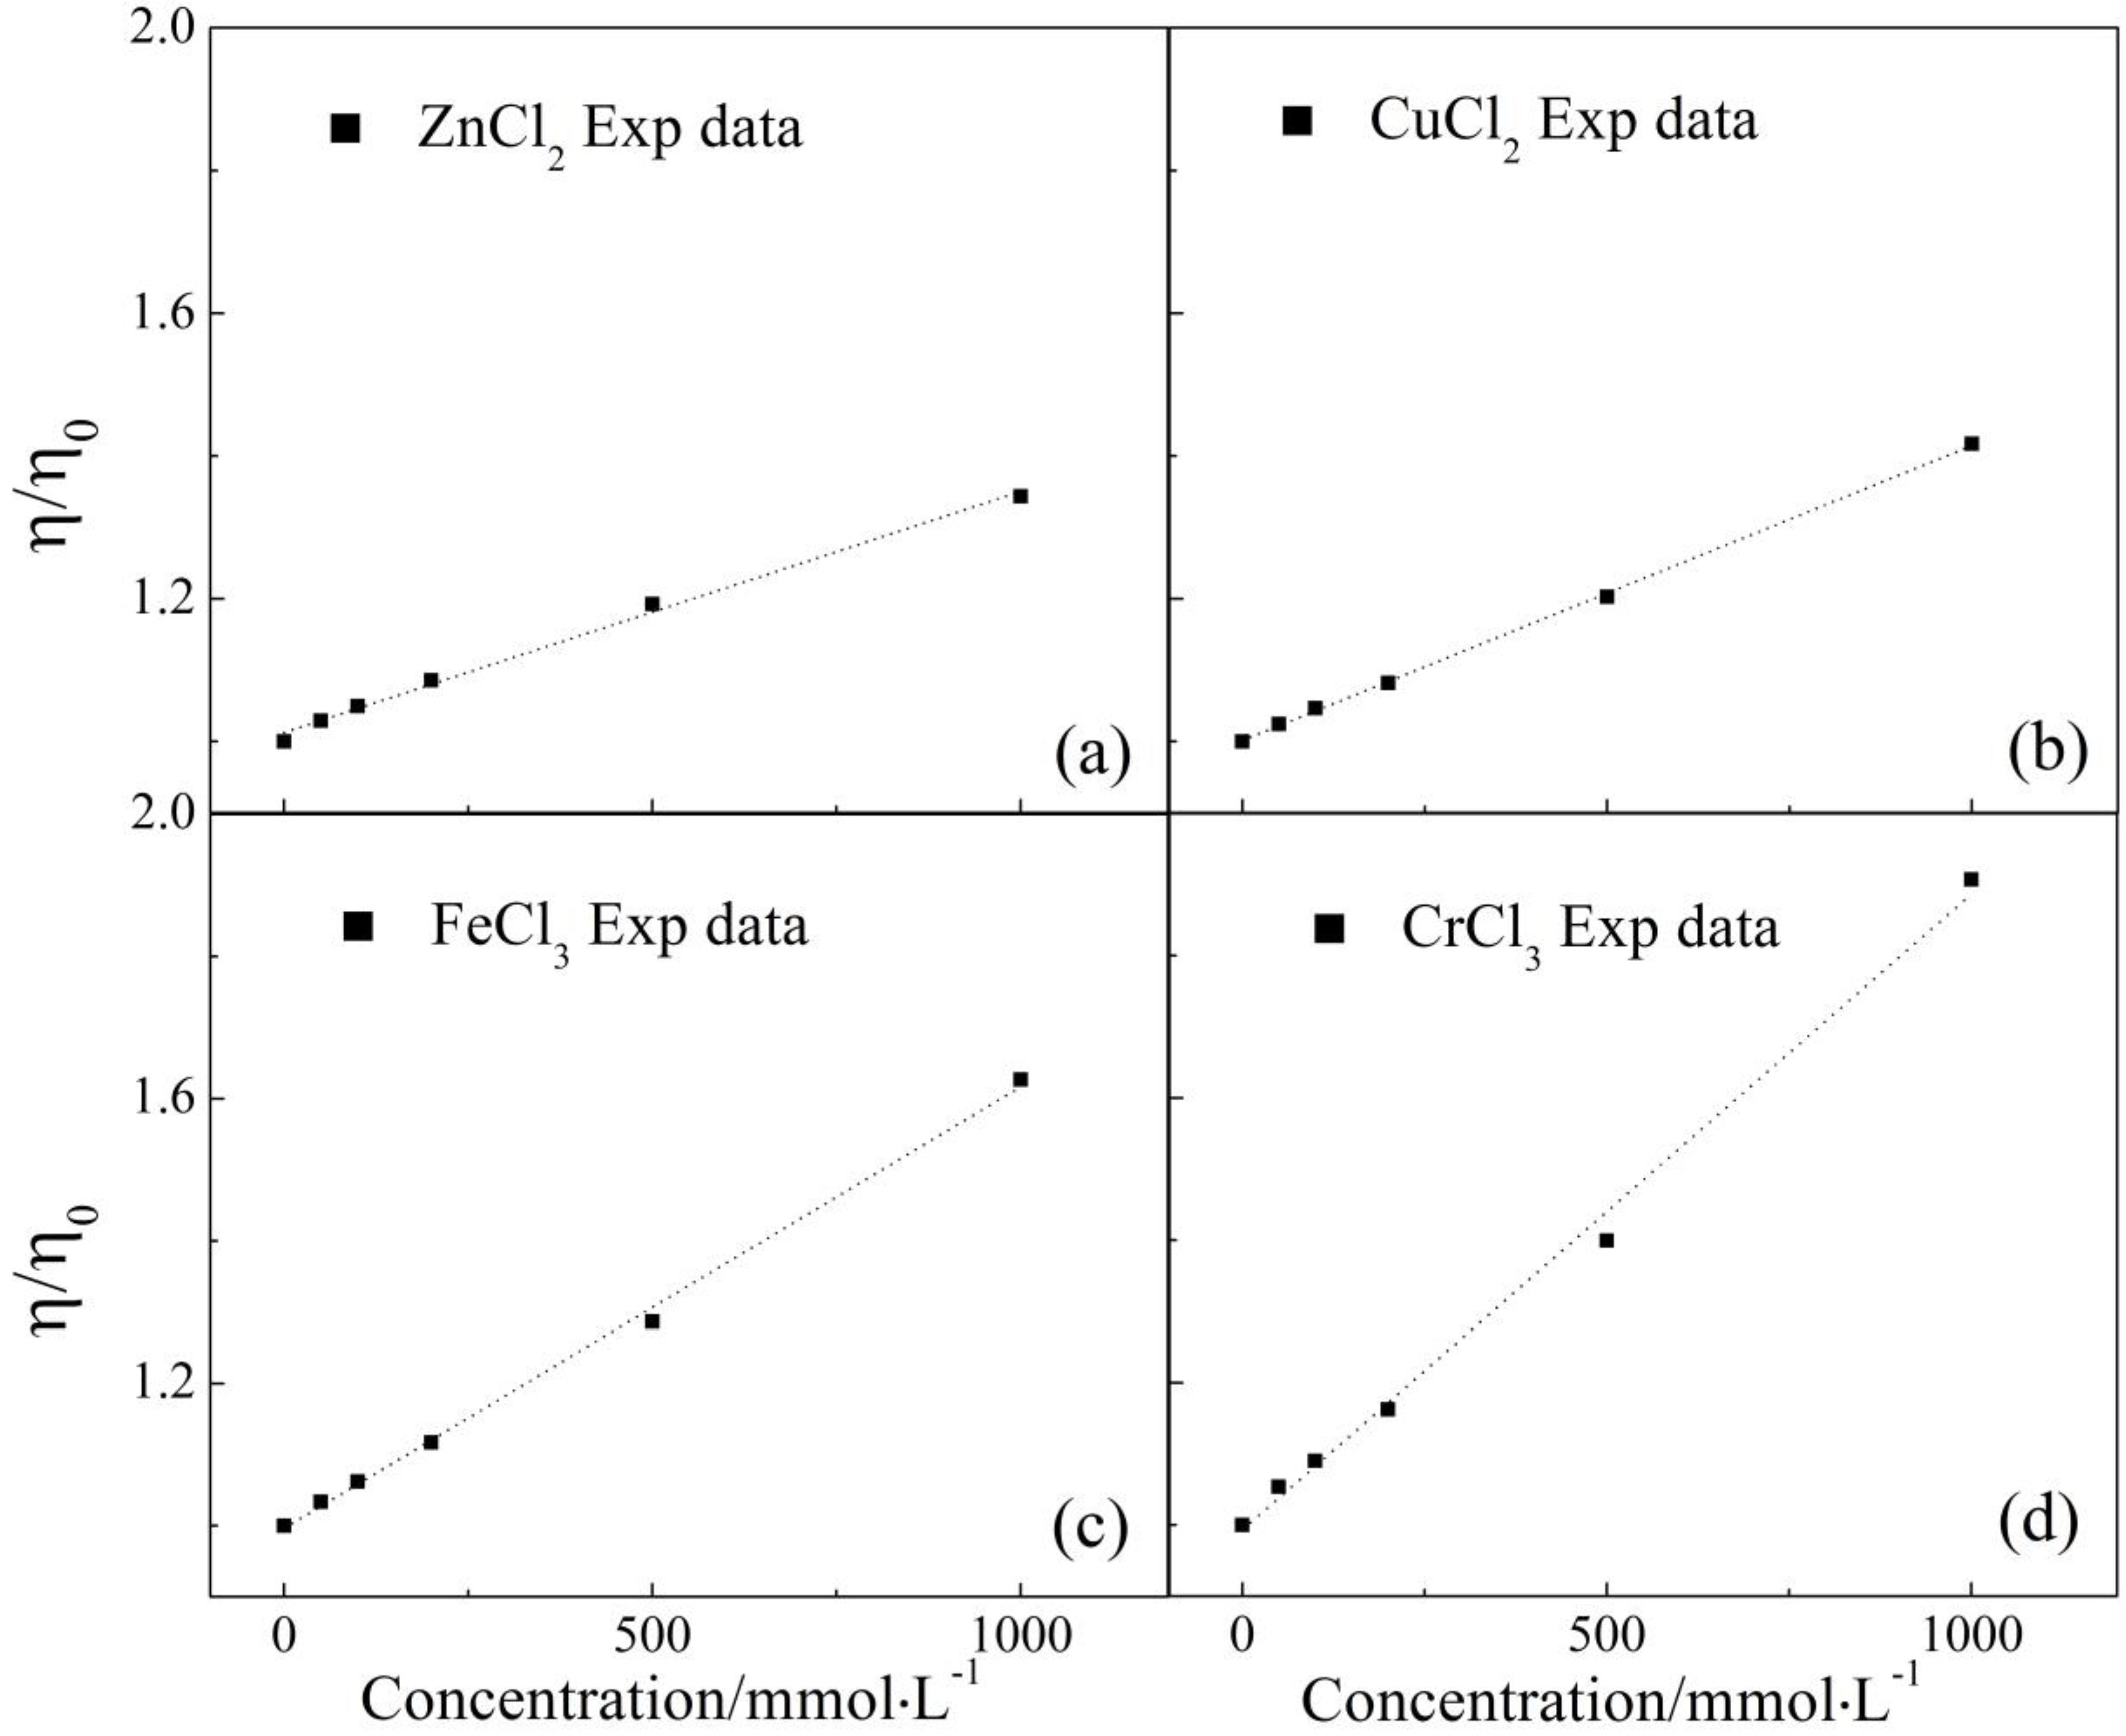
2.2. Viscosity Measurement

In 1929, Jones and Dole [30] came up with the semi-empirical equation, Jones–Dole equation, to account for the relationship between viscosity and solution concentration. Especially when solute concentration is lower than 1 mol·L−1, the equation could be reduced as follows:
η / η 0 = 1 + B vis C
where η and η0 are the viscosity of salt solution and pure water, respectively, m2·s−1. C is the solution concentration, mmol·L−1. Bvis is the viscosity coefficient, L·mmol−1, and used to describe the interaction between solute and solvent molecule. The Jones–Dole equation proves that the viscosity of less concentrated solution is dominated by solute–solvent interaction and local structure surrounding center metal ions. Here, specific viscosity and corresponding fitted lines of different solutions could be seen in Figure 3. For the four electrolytes, the specific viscosity increased with salt concentration in a linear fashion, which is supported by the acceptable goodness of fit (see Table 1). The linear fitting results are tabulated in Table 1.
Based on the Jones–Dole equation, the Bvis for the four solutes (see Table 1), consistently larger than zero which is the characteristic value for pure water, was the supportative evidence that the four metal ions can interact with the adjacent water molecules intensively to form ionic cluster, similar to those hydrated metal ions found by Extended X-ray Absorption Fine Structure (EXAFS) [31,32,33,34]. Even though the size of ionic cluster predicted here may be different from those of hydrated metal ions, the Bvis confirmed that the four metal ions are capable of increasing the association degree of adjacent water cluster to some extent.
Besides concentration, ionic species is another factor affecting solution viscosity as indicated by Bvis (see Table 1). Cr(III) had the largest Bvis, the second was Fe(III) followed by Cu(II), and Zn(II) bore the smallest Bvis. Thus, the ability in increasing association degree decreased in the order of Cr3+ > Fe3+ > Cu2+ > Zn2+. Furthermore, according to the Einstein equation [35], the size of the ionic cluster could be compared by using the specific viscosity of the four aqueous solutions with the same concentration. As a result, we found that Cr(III) was characterized by the largest effective radius, the second was Fe(III), and Cu(II) and Zn(II) had the third largest and the smallest effective radius, respectively. This order is identical to that of Bvis, and those of D and BNMR from NMR measurements, which proved that the four metal ions chosen here can enhance association degree of local water cluster with some regularities.

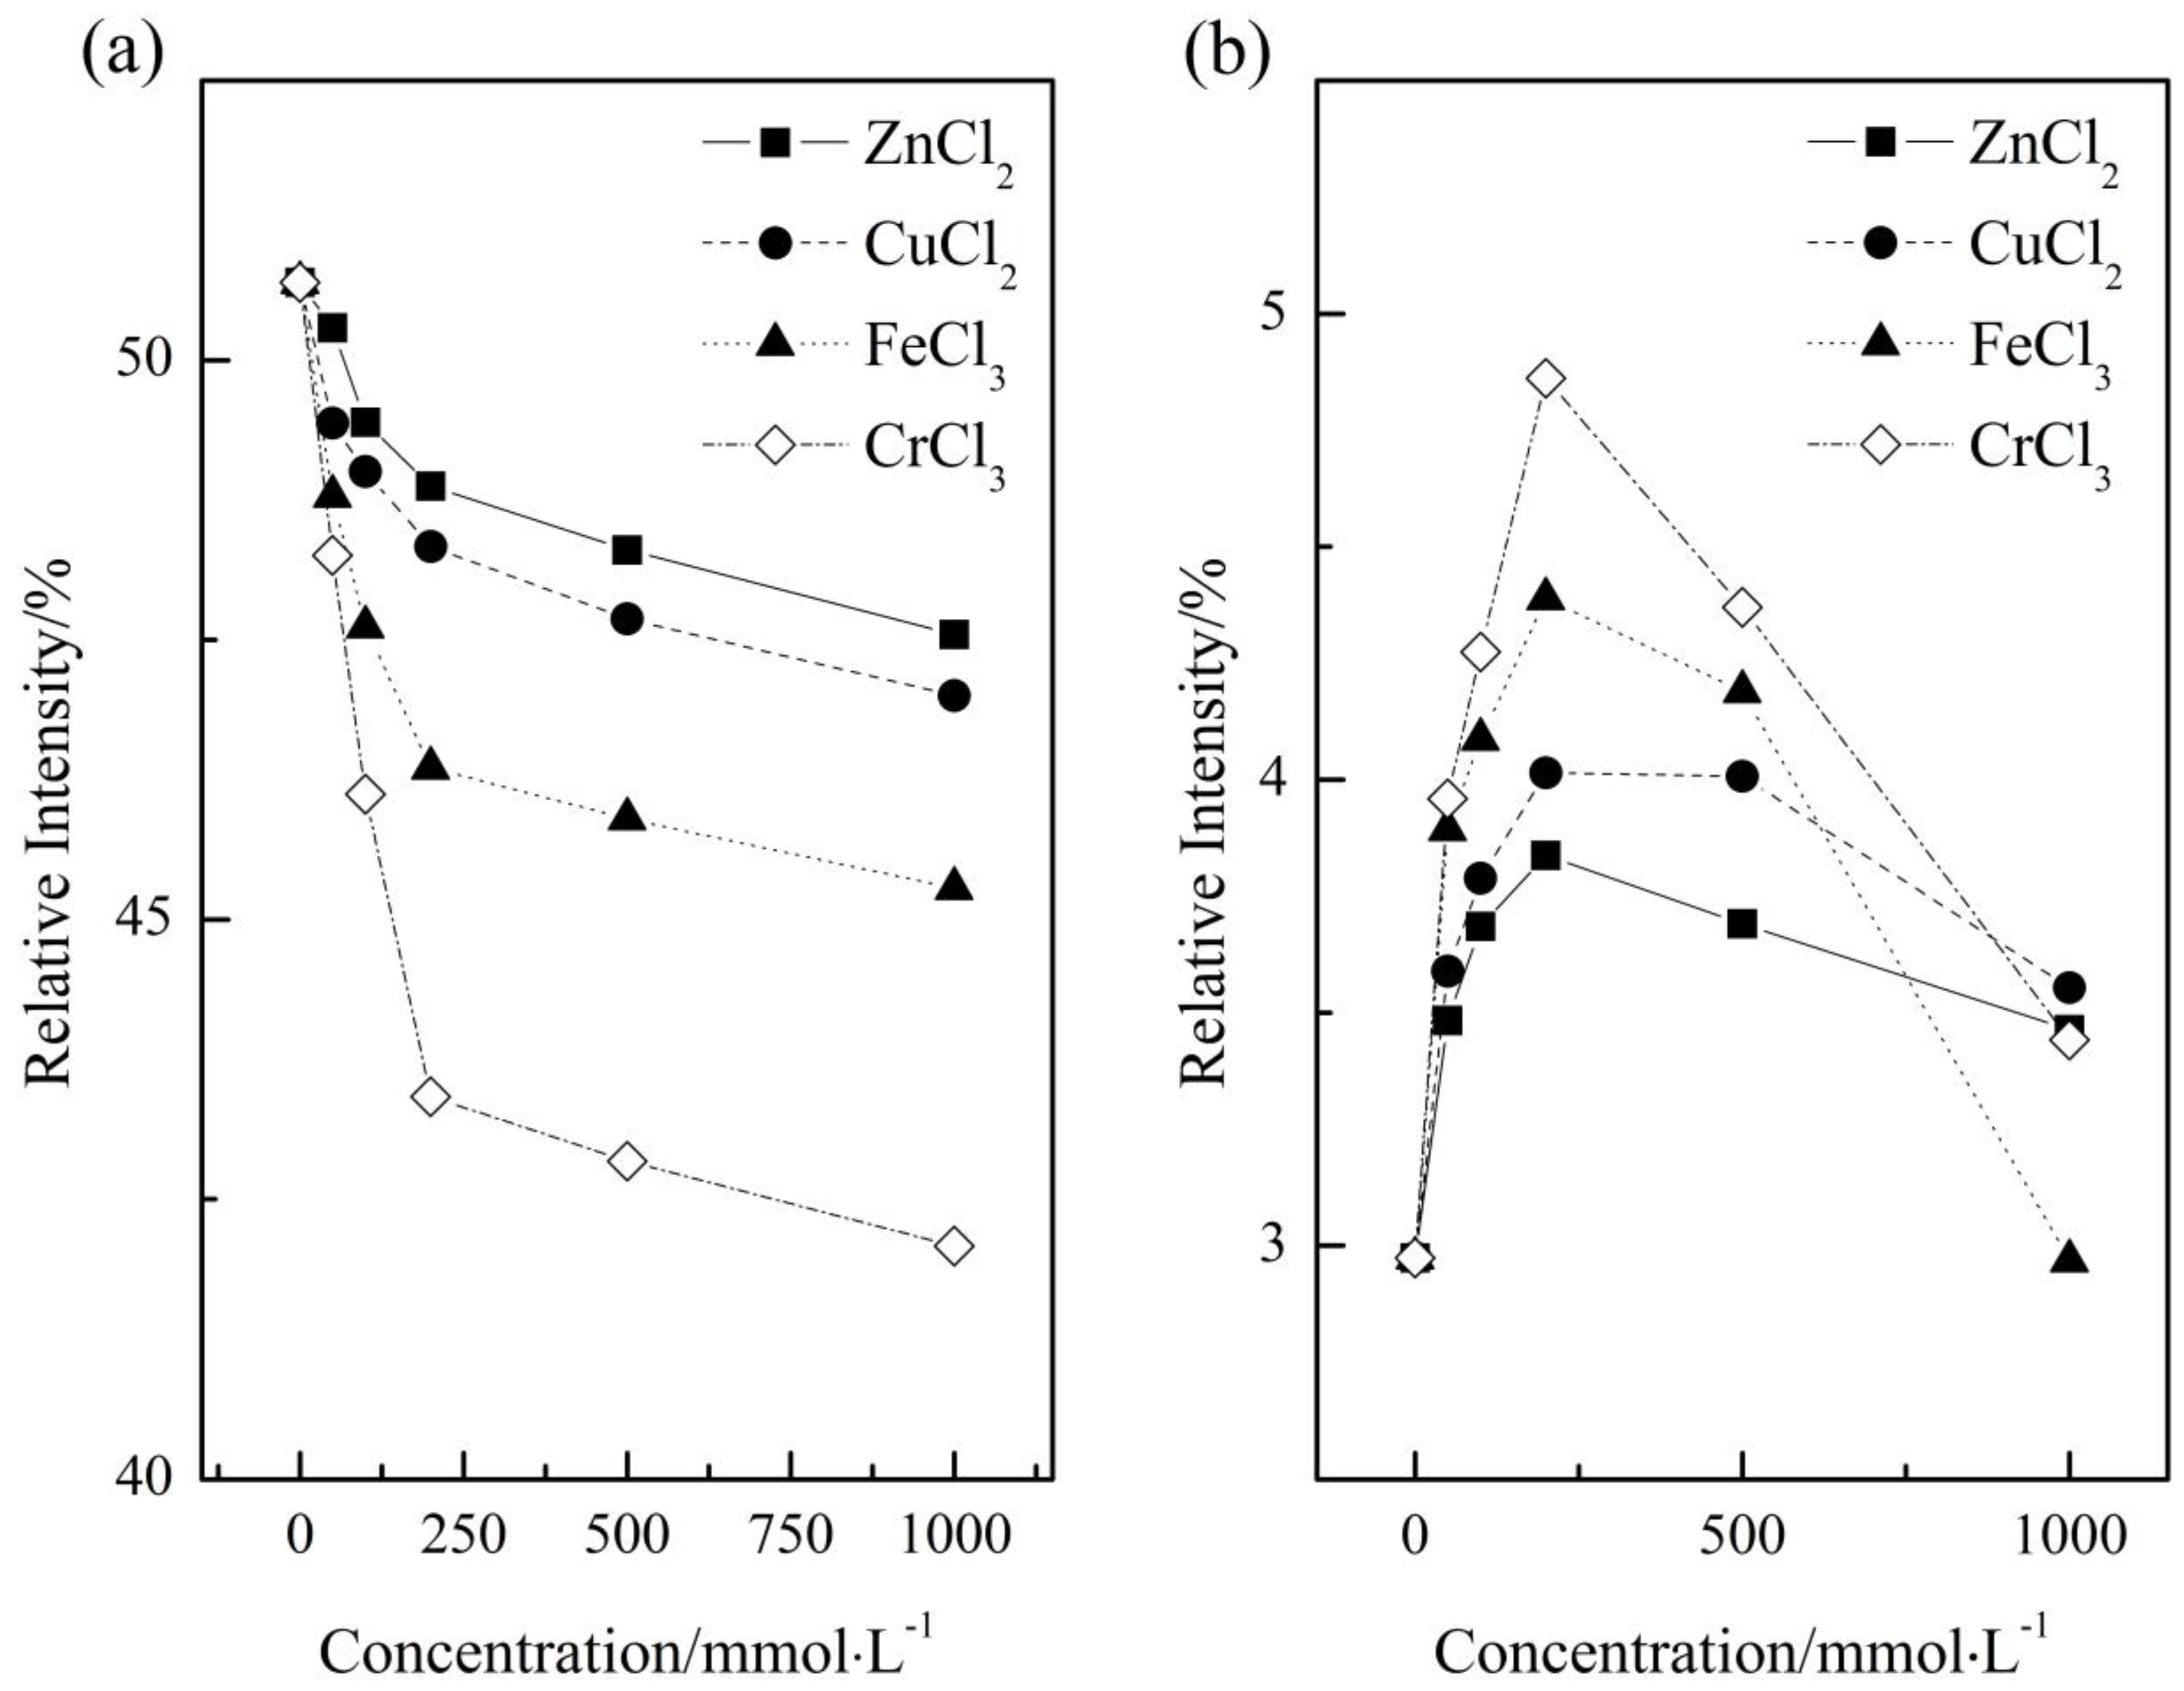
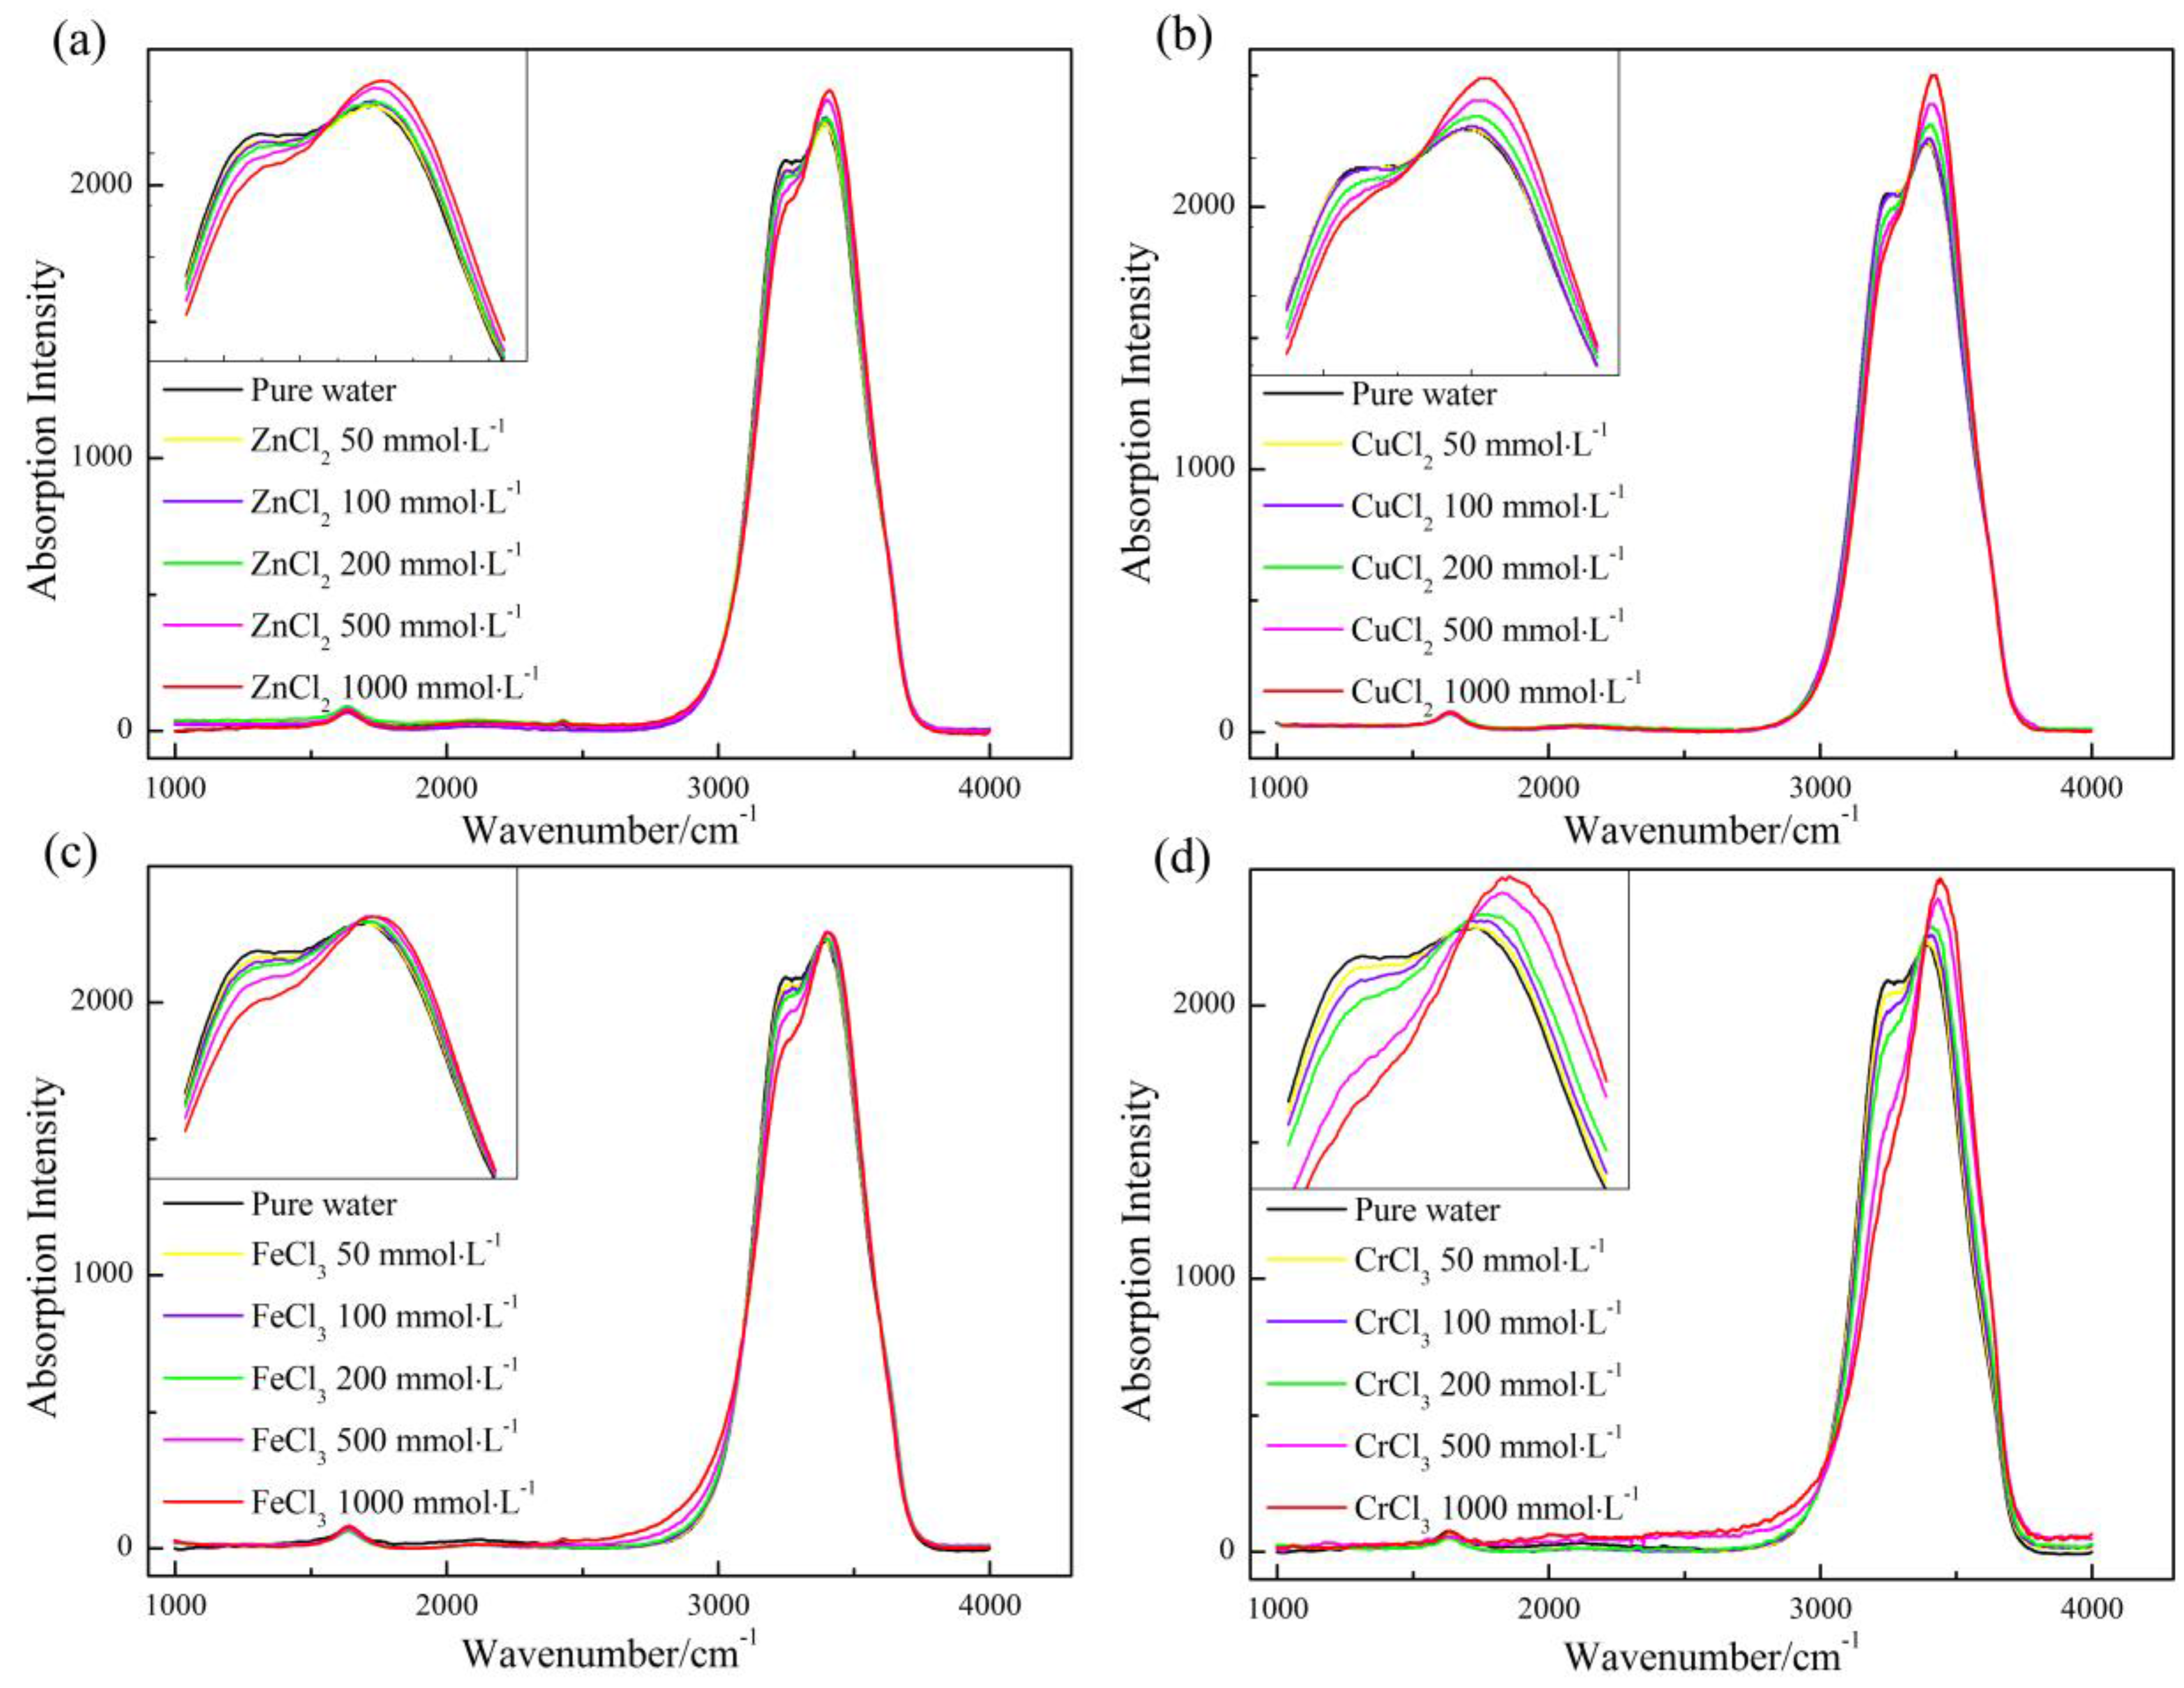
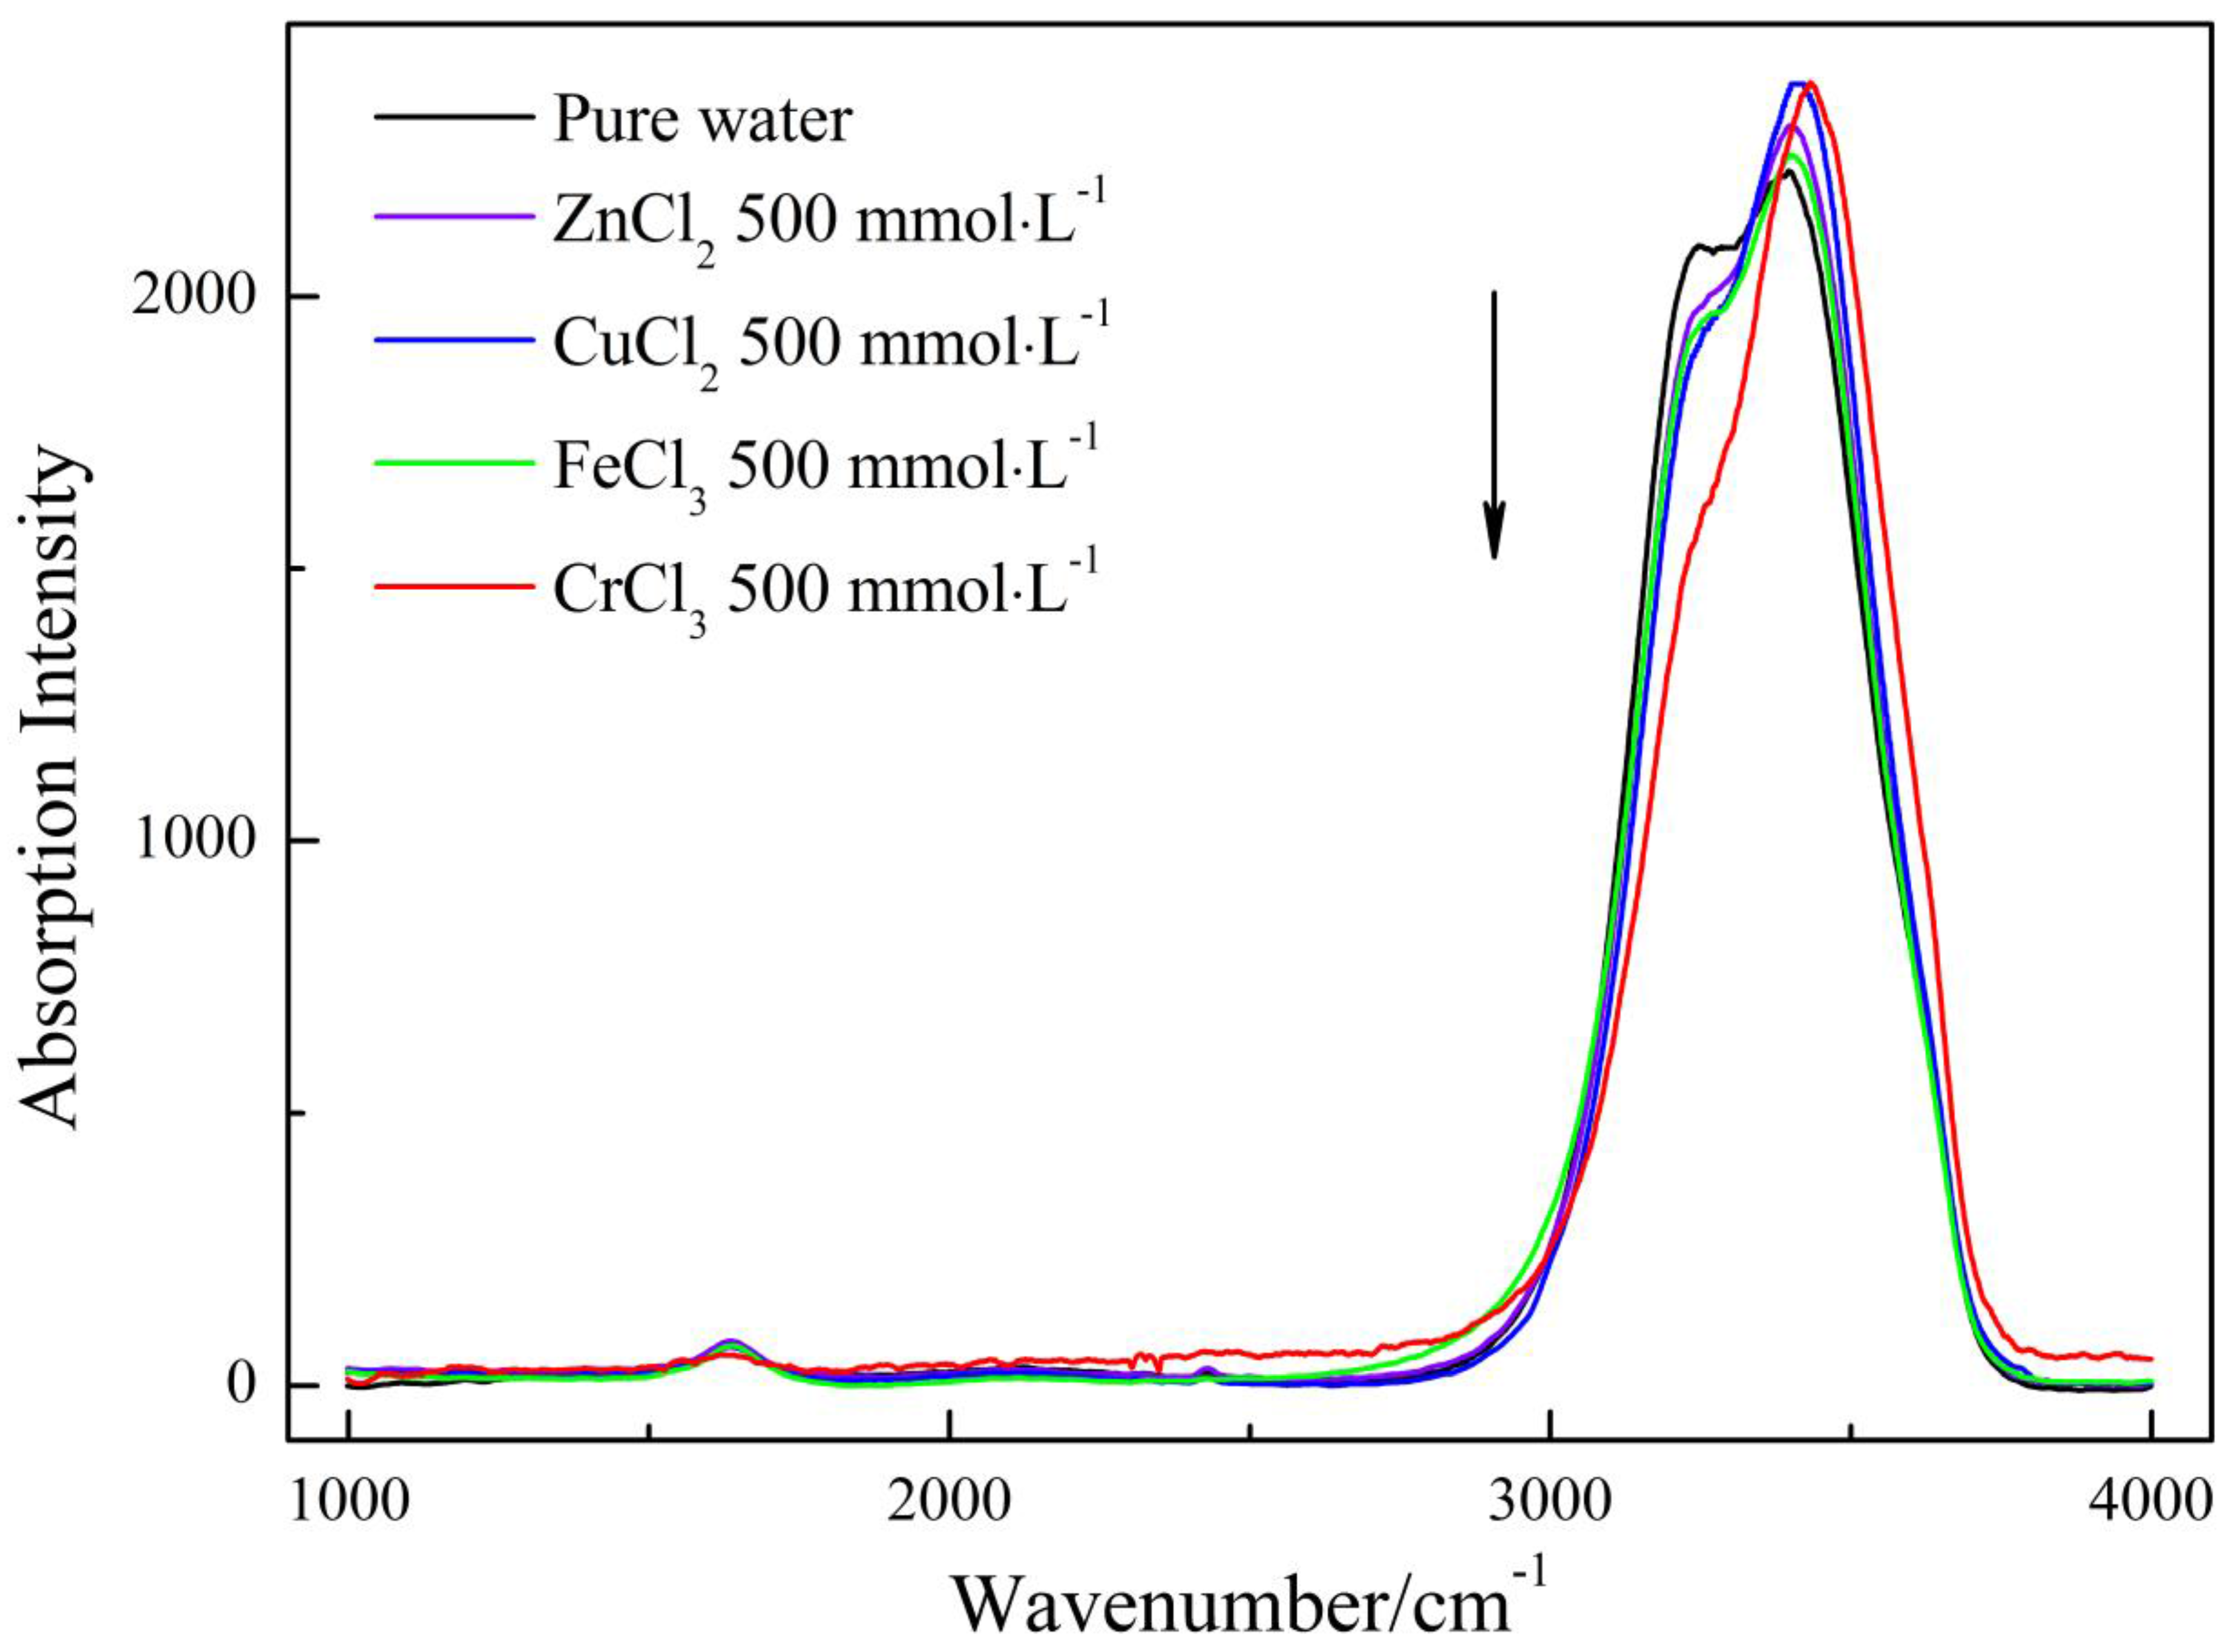
2.3. Raman Characterization

Mid-infrared Raman/IR spectroscopy of aqueous solution has been widely employed to probe into the water structure and the effect of solutes on water cluster in the field of solution chemistry [36,37,38]. The Raman spectrum of a variety of aqueous solutions with different concentrations were collected (see Figure 4).
The Raman spectrum of the four salt solutions were all characterized by a weak peak at ~1600 cm−1 and a strong peak (OH stretching vibration) ranging from 3000 to 3700 cm−1. However, the shape of OH stretching peak presented remarkable changes with solute concentrations regardless of metal chloride. By scrutinizing the insets of Figure 4, one can see an intersection point existing among the multiple spectrums, and the peak on the left-side of the point got weakened with salt concentration, while the peak on the right-side changed in an opposite manner. According to the working principle of Raman spectroscopy, the opposite changes in the peak intensity means that the amount of high association component becomes fewer and fewer upon solute addition, while the amount of low association component increases at the same time. It is weird to see the changing manner of water structure, when considering our NMR and viscosity results. The reason leading to the discrepancy between Raman, NMR and viscosity results was discussed in Section 3.
Deconvolution of OH stretching peak into sub-peaks is a powerful tool to probe into water structure, provided suitable fitting strategy is chosen [37,39]. Here, according to Carey and Korenowski [40], the Raman spectrum of different aqueous solutions were decomposed into five sub-peaks centered at 3051, 3233, 3393, 3511, and 3628 cm−1, respectively. It is widely accepted that, the higher the association degree is, the lower the vibrational energy is [37,39]. Thus, the two sub-peaks centered at 3051 and 3233 cm−1 corresponded to the species with high association degree, the sub-peak centered at the highest wavenumber corresponded to the low association water, and the other two peaks corresponded to the species with medium association degree. On the basis of which, the variations in content of two species with concentration were shown, quantitatively, in Figure 5.
According to the fitting results (see Table S1), the goodness of fit, R2, were all higher than 99.8%, which means that the fitting results are mathematically reasonable. From Figure 5, the content of high association water declined consistently with salt concentration, while the content of low association water increased rapidly before 200 mmol·L−1 and then decreased with salt concentration. The decrease in the amount of low association water, as pointed out by Pestova et al. [10] and O’Brien and Williams [12], is due mainly to the overlap of hydration layer with the continuous increase in metal ion concentration. However, the addition of the electrolytes promotes the decrease in association degree, which is in contrast to the regularities obtained from NMR and viscosity measurements and needs to be further discussed.
Moreover, the impact on water structure is ion-specific as shown in Figure 5. Concretely, the high association water and low association water were characterized by the largest amplitude of variation upon CrCl3 addition, and FeCl3 and CuCl2 were in the second and third place, respectively, and ZnCl2 had the minimum effect on the amount of the two species. To compare the influence induced by the four electrolytes, we plotted the normalized Raman spectrum of pure water and four aqueous solutions with the same concentrations (500 mmol·L−1) in Figure 6. From Figure 6, one can see a main peak and a shoulder peak centered at the lower wavenumber for the five solutions, among which, pure water had the strongest shoulder peak, second place was acquired by ZnCl2, CuCl2 and FeCl3 had similar peak intensity, and CrCl3 was characterized by the weakest shoulder peak. This relative position is almost identical to those obtained from other experimental measurements occupied in this article.

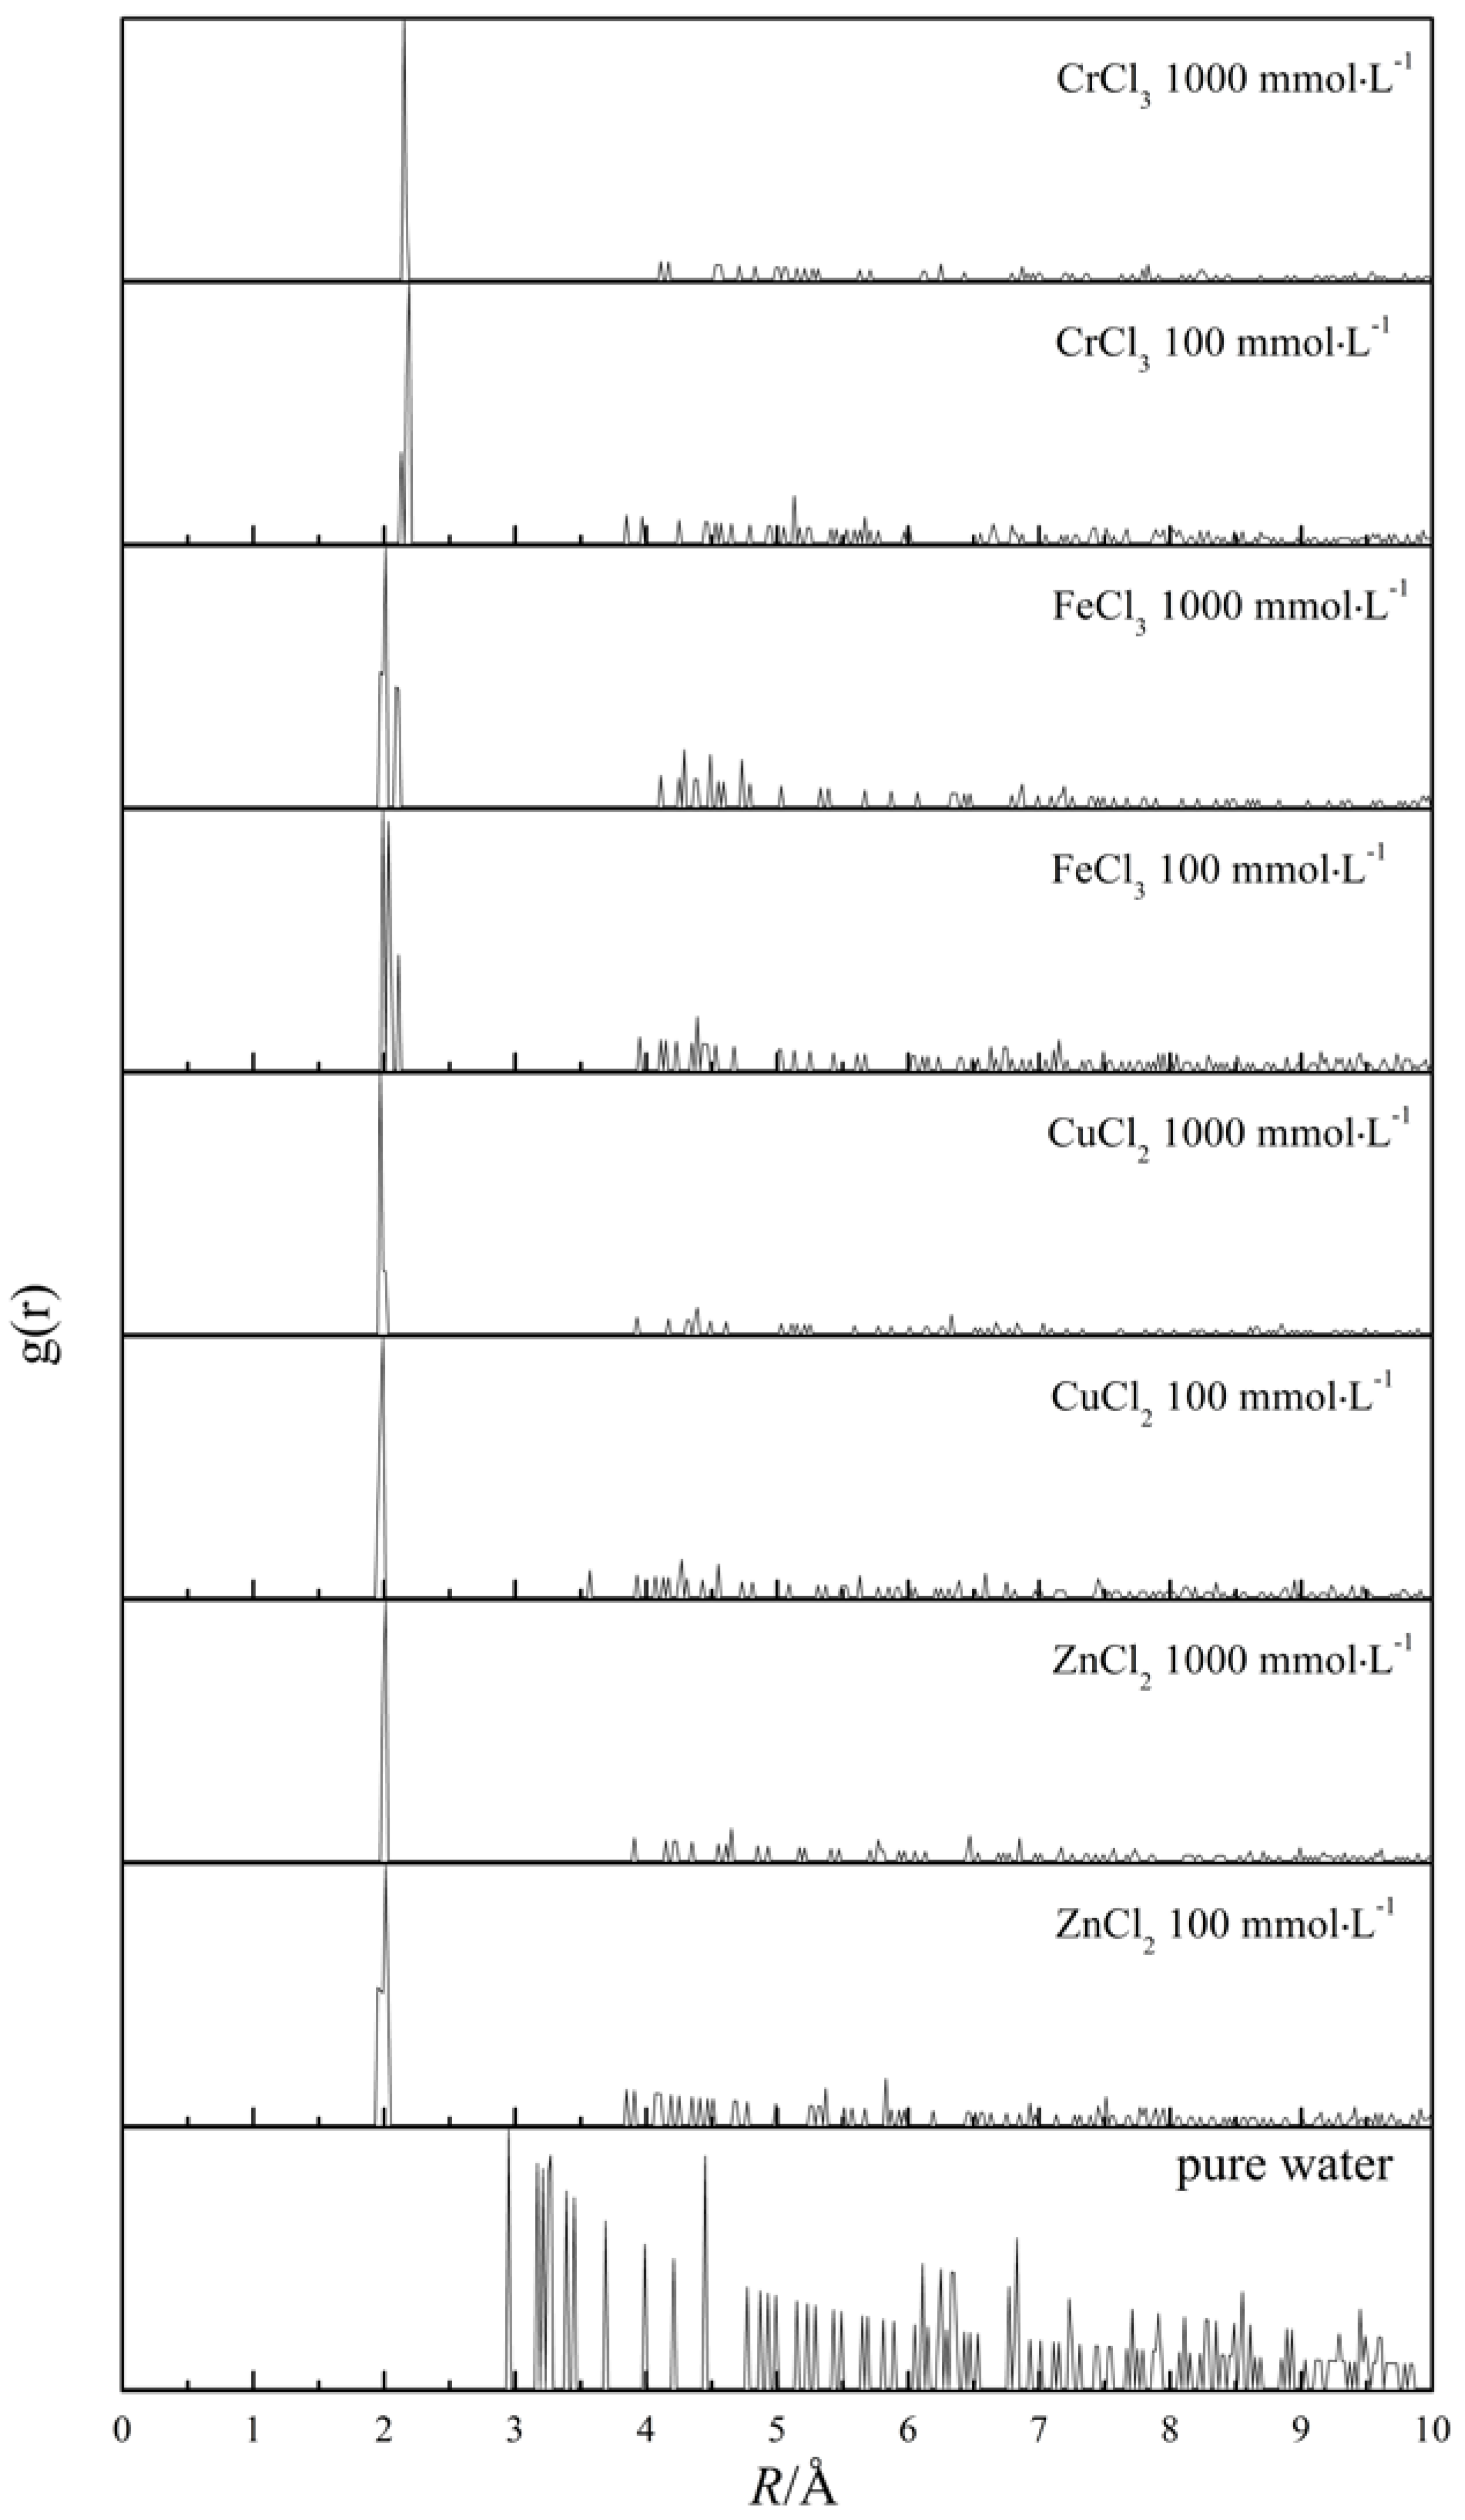
2.4. Molecular Dynamics Simulations

In addition to the experimental methods, computer simulations is another alternative to study the effect of metal ions on water structure from the perspective of microscopic particle interactions. Here, molecular dynamics simulations were used to represent the spatial arrangement of water molecules around the center metal ions. Firstly, the distance of center water molecule and the nearest water molecule in the first coordination layer (O–O) was calculated to be 2.9–3.0 Å, which was similar to another MD simulation result (2.80 Å) [41], and even closer to an spectral result (2.976 Å) [42]. This characteristic value was also manifested by the first peak of pure water RDF in Figure 7. Furthermore, except for specific position, e.g., ~4.5 Å, the RDF of pure water decreased gradually with distance, which means that the disorder degree of water structure increases with distance in a gentle manner.
As for electrolyte aqueous solutions, the RDF was obtained by calculating the appearance probability of oxygen atoms surrounding center metal ions. From Figure 7, one could observe that the first hydration layer was located ~2.0 Å away from center metal ions, which was identical to the corresponding value reported in the literature [31,32,33,34]. Nevertheless, the RDF of the four aqueous solutions fell to zero rapidly and then presented weak peaks at further distances. In addition, the RDF of aqueous solutions at low concentration (100 mmol·L−1) had stronger peaks at 4–8 Å than those at high concentration (1000 mmol·L−1). The stark contrast in RDF between pure water and electrolyte aqueous solution proved that the increased content of low association water observed by Raman spectrum might be the result of the increased disorder degree of water structure at further distance induced by solute addition.
Furthermore, for the solutions at the same concentration, an Fe-containing system was characterized by the remarkable long-range order as indicated by the strongest RDF peak at 4–8 Å. Comparatively, the other three metal ions could further break the long-range ordered water structure to a similar extent. Namely, there is no apparent ion-dependent regularity, which still remains to be answered.

3. Discussion

Several experimental methods together with MD simulations were adopted by us to characterize the influence of metal ions on water structure. Firstly, the four metal ions (Cr3+, Fe3+, Cu2+, Zn2+) studied here have been classified as kosmotropes by Collins [43], as their strong interactions with adjacent water molecules than water with itself. Thus, the dissolved metal ions can pose a restriction on translational motion of a number of water molecules, and further promote their association. Accordingly, this confinement on adjacent water molecule have been confirmed by NMR coefficient (BNMR) and diffusion coefficient (D) from NMR, viscosity coefficient (Bvis) from viscometer. However, our Raman spectrum suggested that ion addition would decrease the content of high association water. The stark contrast among the experimental results presented above may just come from the difference in the working principle of these detection methods. NMR is the technique that can emit radio frequency radiation to detect sample structure with the characteristic time-scale of 10−9–10−6 s [44]. By comparison, Raman spectroscopy is capable of catching molecular vibration/rotation information on shorter time-scales (10−12–10−9 s) by producing electromagnetic waves [44,45]. In addition, ultrafast laser studies have confirmed that the dynamics of the HB network is pretty fast in pure water; specifically, the spectral diffusion time for HDO/D2O system and the vibrational lifetime in pure H2O are less than 200 fs [46], and ~200 fs [47], respectively. Furthermore, Cowan et al. [48] found the timescale of energy redistribution within the HB network was less than 50 fs by using 2D IR spectroscopy. Thus, Raman spectroscopy would be more sensitive to all shorter-lived water species with different association degree relative to NMR. Additionally, as for viscosity measurement, specific viscosity, η/η0 is the characterization of ionic-centered water cluster according to the Einstein equation [35], which is similar to the results obtained from NMR. Thus, viscosity, NMR and Raman spectroscopy are all able to present structural features of solution system but attach their importance on different aspects of solution system.
Very recently, a THz TDS study concluded that the saccharides having strong hydration capacity can destruct the HB network of bulk water [49]. Additionally, a dielectric relaxation study also found the opposite effects of ions on water structure, namely, a decelerating effect within the hydration shell and breaking effect beyond the hydration shell [20]. Thus, those findings have pointed out the destructing effect on water structure, which is also observed in this article by ingenious deconvolution of Raman spectrum. Furthermore, as shown in Figure 7, the distant RDF peaks, e.g., 4–8 Å, got weaker with salt concentration increasing. Thus, the destructing effect comes mainly from the ion-related influence on long-range water structure. By combining the experimental and simulation results, it is confirmed that the dissolved metal ions studied here (Cr3+, Fe3+, Cu2+, Zn2+) can elevate the association degree of adjacent water molecules, but break the ordered water cluster far away from center ion simultaneously, just at the presence of collective hydrogen bond dynamics existing among water molecules [50]. The point summarized here can also shed light on the opposite effect of dissolved cations on dielectric spectra between the hydration shell and the outer shell [20].
Additionally, the water structural changes were also found to be dependent on the nature of metal ions. Specifically, the ability in alternating water structure decreased in the order of Cr3+ > Fe3+ > Cu2+ > Zn2+ as consistently manifested by NMR, viscometer and Raman measurements. In 2012, a statistical mechanics study found the cation-induced changes in molecular orientation and non-linear polarization effects could persist up to ~3–4 hydration layers for low charge density ions, and ~7–9 layers for high charge density ions [19]. Recently, we also found the charge density is the key to the influence of cations on water structure [51]. Thus, given the experimental results here, it is very likely that surface charge density plays the key role in affecting the association degree of local water cluster, as Cr3+ and Fe3+ bear more charges and smaller ionic radii, while Cu2+ and Zn2+ have fewer charges and larger ionic radii [52].

4. Materials and Methods

4.1. Materials

ZnCl2 (guaranteed reagent) was supplied by Kermel Chemical Reagent Company (Tianjin, China). CuCl2·2H2O (guaranteed reagent) was purchased from Sangon Biotech Co., Ltd. (Shanghai, China). FeCl3·6H2O and CrCl3·6H2O were of analytical grade and were the products of Aladdin Industrial Corporation (Shanghai, China). Other chemicals were of analytical grade and used without further purification. The solutions used in NMR, viscosity and Raman characterizations were obtained by dissolving solutes into ultrapure water (18.2 MΩ·cm).

4.2. NMR Measurements

A series of ZnCl2, CuCl2, FeCl3, CrCl3 aqueous solutions and pure water were put into NMR tubes to perform NMR experiments on a Bruker AV-600 MHz NMR spectrometer equipped with a BBO probe (Bruker, Karlsruhe, Germany). 17O NMR spin-lattice relaxation time (T1) of solution samples were measured using the π-τ-π/2 pulse sequence with the characteristic pulse width of π/2, 13.8 μs. T1 were obtained by fitting signal intensity at 14 relaxation time ranging from 0.01 to 100 ms to the following equation:
S τ = S 0 ( 1 e τ / T 1 )
where τ is the relaxation time, ms, and Sτ and S0 are the signal intensity at relaxation time zero and τ, respectively. Importantly, to prevent incorrect T1 from being returned because of the exchange interaction existing between electron spin and proton spin [53], the top concentration for Cr, Cu, Zn-containing system was set to be 3 mmol·L−1. Because of ferromagnetism, the concentration for Fe-containing system was further limited to be less than 1 mmol·L−1.
The aqueous solutions at two concentrations (1 and 3 mmol·L−1 for ZnCl2, CuCl2, CrCl3, 0.25 and 1 for FeCl3) and pure water/deuterated water were put into NMR tubes to perform 2D Diffusion-Ordered Spectroscopy (DOSY) 1H NMR experiments. Constant temperature (297.9 K) DOSY data were acquired using an Smoothed-Square (SMSQ)-shaped 10.100 pulse sequence with 2 ms gradient pulse duration, 20 s time interval between neighbor pulses. Complete signal attenuation was achieved by exponentially increasing the gradient strength from 2%–98% with 8 scans each. The spin-echo attenuation was related to the pulse sequence parameters and the diffusion coefficient, D, by the following equation:
ln I I 0 = ( 2 π γ g z δ ) 2 D ( Δ δ 3 ) × 10 4
where I and I0 are the intensity of signal and original pulse, respectively. D is the diffusion coefficient, m2·s−1, γ is the gyromagnetic ratio of protons, MHz·T−1, gz is the gradient amplitude, δ is the gradient duration, ms, and Δ is the diffusion time.

4.3. Viscosity Measurements

The aqueous solutions with the different concentrations, 50, 100, 200, 500, and 1000 mmol·L−1 for the four electrolytes, were prepared in advance. The density of aqueous solutions and ultrapure water were measured by pycnometer method. The time for solution samples to descend from scale A (upper limit) to scale B (lower limit) was obtained by using Ubbelohde viscometer. The specific viscosity was calculated according to the following equation:
T = η η 0 = ρ × t ρ 0 × t 0
where T is the specific viscosity, η and η0 are the viscosity of aqueous solution and ultrapure water, respectively, m2·s−1, ρ and ρ0 are the density of aqueous solution and ultrapure water, respectively, kg·m−3, t and t0 are the residence time of aqueous solution and ultrapure water between scale A and B, respectively, s. The measurements of density and viscosity were all conducted under water bath of 298.15 K. All assays were carried out in triplicate and only mean values were presented in Section 2.2.

4.4. Raman Characterization

The Raman spectra of aqueous solutions with concentrations identical to those in viscosity measurements, were all recorded at 300.15 K by a confocal microscope Raman spectrometer (Renishaw Invia Reflex, Wotton-under-Edge, UK) equipped with a 532 nm YAG laser. The laser power was 7.05 mW. The Raman spectra of aqueous solutions were collected in the region between 1000 and 4000 cm−1 with spectral resolution of approximately 1 cm−1. The laser beam was focused on the solution sample at a characteristic depth of 1993 μm from the outer surface of quartz cuvette. After smoothing, baseline correction, Raman spectra were normalized based on the OH stretching vibration peak intensity in OriginPro 8 (OriginLab Corporation, Northampton, MA, USA). The broad OH stretching vibration peak was deconvoluted and fitted by using PeakFit v4.12 (SeaSolve Software Inc., Framingham, MA, USA).

4.5. Molecular Dynamics Simulations

All the structures were optimized by using Molecular Dynamic (MD) simulations as implemented in the Materials Studio 7.0 (Accelrys, San Diego, CA, USA). Firstly, metal ions (Cr3+, Fe3+, Cu2+, Zn2+) and water molecule were constructed in the Materials Visualizer module. Then, two cubic simulation boxes corresponding to 100 mmol·L−1 (containing 5 metal ions and 275 water molecules) and 1000 mmol·L−1 (containing 5 metal ions and 2775 water molecules) aqueous solutions were constructed in Amorphous Cell module for each metal. Meanwhile, Condensed-Phase Optimized Molecular Potentials for Atomistic Simulation Studies (COMPASS) force field parameters were assigned to every particles. Furthermore, MD simulations were conducted for each canonical ensemble (NVT system) characterized by 1 g·cm−3 with time step of 1 fs, and dynamics time of 5 ps at 298 K. MD optimized structure for Fe-containing aqueous solutions can be seen in Figure S1. On this basis, RDFs for each optimized system were obtained by using radial distribution analysis in the Forcite module with a specific cutoff of 10.0 Å. Finally, the RDF data were normalized and plotted in OriginPro 8 (OriginLab Corporation).

5. Conclusions

This study has shown that Cr3+, Fe3+, Cu2+ and Zn2+ have remarkable effects on water structure. The combination of NMR, viscosity, Raman and MD simulations allowed us to get a deep insight into the effect of different metal ions and their concentration on short-/long-range water structure. NMR and viscosity data pointed out that all of the four metal ions studied here can improve the association degree of adjacent water clusters and form ionic clusters with neighbor water molecules. The ability in increasing association degree decreased in the order of Cr3+ > Fe3+ > Cu2+ > Zn2+. Meanwhile, the analysis of Raman spectrum showed that the content of high association water declined consistently, while the content of low association water increased rapidly and then decreased with salt concentration. Furthermore, with the help of MD simulations, it is found that dissolved metal ions can increase the association degree of adjacent water molecules, but also break the ordered water structure beyond the adjacent area.
The experimental characterization/MD simulations presented herein proved to be extremely useful for studying the changes in water structure with collective hydrogen bond dynamics induced by metal ions. Meanwhile, the regularities obtained in this article may be helpful to explain the determinant effects of dissolved metal ion on the chemical and biological properties of ionic solution.

Supplementary Materials

Supplementary materials can be found at https://www.mdpi.com/1422-0067/17/5/602/s1.

Acknowledgments

The authors gratefully acknowledge the National Key Technology R & D Program of the Ministry of Science and Technology, China (No. 2012BAC07B02) for giving financial support to this study. The authors would like to thank Tao Xue at the Center for Analysis and Test of Tianjin University. We also thank an anonymous referee for helpful comments and suggestions.

Author Contributions

Lin Zhao designed and supervised this manuscript; Kai Ma performed the experiments and wrote this manuscript.

Conflicts of Interest

The authors declare no conflict of interest.

Abbreviations

MDMolecular Dynamics
RDFRadial Distribution Function
NMRNuclear Magnetic Resonance
DOSYDiffusion-Ordered Spectroscopy
COMPASSCondensed-Phase Optimized Molecular Potentials for Atomistic Simulation Studies
THz TDSTerahertz Time-Domain Spectroscopy
EXAFSExtended X-Ray Absorption Fine Structure

References

  1. Zavitsas, A.A. Properties of water solutions of electrolytes and nonelectrolytes. J. Phys. Chem. B 2001, 105, 7805–7817. [Google Scholar] [CrossRef]
  2. Zavitsas, A.A. The nature of aqueous solutions: Insights into multiple facets of chemistry and biochemistry from freezing-point depressions. Chem. Eur. J. 2010, 16, 5942–5960. [Google Scholar] [CrossRef] [PubMed]
  3. McDonald, A.; Pushie, M.J.; Millhauser, G.L.; George, G.N. New insights into metal interactions with the prion protein: EXAFS analysis and structure calculations of copper binding to a single octarepeat from the prion protein. J. Phys. Chem. B 2013, 117, 13822–13841. [Google Scholar] [CrossRef] [PubMed]
  4. Eichhorn, G.L.; Shin, Y.A. Interaction of metal ions with polynucleotides and related compounds. XII. The relative effect of various metal ions on DNA helicity. J. Am. Chem. Soc. 1968, 90, 7323–7328. [Google Scholar] [CrossRef] [PubMed]
  5. Navarra, G.; Tinti, A.; Leone, M.; Militello, V.; Torreggiani, A. Influence of metal ions on thermal aggregation of bovine serum albumin: Aggregation kinetics and structural changes. J. Inorg. Biochem. 2009, 103, 1729–1738. [Google Scholar] [CrossRef] [PubMed]
  6. Paliwal, A.; Asthagiri, D.; Abras, D.; Lenhoff, A.; Paulaitis, M. Light-scattering studies of protein solutions: Role of hydration in weak protein-protein interactions. Biophys. J. 2005, 89, 1564–1573. [Google Scholar] [CrossRef] [PubMed]
  7. Kropman, M.F.; Bakker, H.J. Dynamics of water molecules in aqueous solvation shells. Science 2001, 291, 2118–2120. [Google Scholar] [CrossRef] [PubMed]
  8. Kropman, M.F.; Bakker, H.J. Effect of ions on the vibrational relaxation of liquid water. J. Am. Chem. Soc. 2004, 126, 9135–9141. [Google Scholar] [CrossRef] [PubMed]
  9. Omta, A.W.; Kropman, M.F.; Woutersen, S.; Bakker, H.J. Negligible effect of ions on the hydrogen-bond structure in liquid water. Science 2003, 301, 347–349. [Google Scholar] [CrossRef] [PubMed]
  10. Pestova, O.; Kostikov, Y.P.; Khripun, M. X-ray phase analysis of structure of water-salt systems: NaCl–H2O and KCl–H2O. Russ. J. Appl. Chem. 2004, 77, 1066–1069. [Google Scholar] [CrossRef]
  11. Badyal, Y.S.; Barnes, A.C.; Cuello, G.J.; Simonson, J.M. Understanding the effects of concentration on the solvation structure of Ca2+ in aqueous solution. II: Insights into longer range order from neutron diffraction isotope substitution. J. Phys. Chem. A 2004, 108, 11819–11827. [Google Scholar] [CrossRef]
  12. O’Brien, J.T.; Williams, E.R. Effects of ions on hydrogen-bonding water networks in large aqueous nanodrops. J. Am. Chem. Soc. 2012, 134, 10228–10236. [Google Scholar] [CrossRef] [PubMed]
  13. Samoilov, O.Y. A new approach to the study of hydration of ions in aqueous solutions. Discuss. Faraday Soc. 1957, 24, 141–146. [Google Scholar] [CrossRef]
  14. Lightstone, F.C.; Schwegler, E.; Hood, R.Q.; Gygi, F.; Galli, G. A first principles molecular dynamics simulation of the hydrated magnesium ion. Chem. Phys. Lett. 2001, 343, 549–555. [Google Scholar] [CrossRef]
  15. Li, R.H.; Jiang, Z.P.; Guan, Y.T.; Yang, H.W.; Liu, B. Effects of metal ion on the water structure studied by the Raman O–H stretching spectrum. J. Raman Spectrosc. 2009, 40, 1200–1204. [Google Scholar] [CrossRef]
  16. Paul, B.I.; Eugene, M.; Nickels, J.D.; Thuskolov, A.P. Influence of ions on water diffusion—A neutron scattering study. J. Phys. Chem. B 2013, 117, 7724–7728. [Google Scholar]
  17. Water Structure and Science. Available online: http://www1.lsbu.ac.uk/water/kosmotropes_chaotropes.html (accessed on 10 March 2015).
  18. Collins, K.D. Sticky ions in biological systems. Proc. Natl. Acad. Sci. USA 1995, 92, 5553–5557. [Google Scholar] [CrossRef] [PubMed]
  19. Suresh, S.; Kapoor, K.; Talwar, S.; Rastogi, A. Internal structure of water around cations. J. Mol. Liq. 2012, 174, 135–142. [Google Scholar] [CrossRef]
  20. Kondoh, M.; Ohshima, Y.; Tsubouchi, M. Ion effects on the structure of water studied by terahertz time-domain spectroscopy. Chem. Phys. Lett. 2014, 591, 317–322. [Google Scholar] [CrossRef]
  21. Engel, G.; Hertz, H.G. On the negative hydration. A nuclear magnetic relaxation study. Bunsen-Ges. Phys. Chem. Ber. 1968, 72, 808–834. [Google Scholar]
  22. Ben-Amotz, D.; Underwood, R. Unraveling water’s entropic mysteries: A unified view of nonpolar, polar, and ionic hydration. Acc. Chem. Res. 2008, 41, 957–967. [Google Scholar] [CrossRef] [PubMed]
  23. Jenkins, H.D.B.; Marcus, Y. Viscosity B-coefficients of ions in solution. Chem. Rev. 1995, 95, 2695–2724. [Google Scholar] [CrossRef]
  24. Antalek, B. Using pulsed gradient spin echo NMR for chemical mixture analysis: How to obtain optimum results. Concepts Magn. Reson. 2002, 14, 225–258. [Google Scholar] [CrossRef]
  25. Cohen, Y.; Avram, L.; Frish, L. Diffusion nmr spectroscopy in supramolecular and combinatorial chemistry: An old parameter—New insights. Angew. Chem. Int. Ed. 2005, 44, 520–554. [Google Scholar] [CrossRef] [PubMed]
  26. Garbacz, P.; Price, W.S. 1H NMR diffusion studies of water self-diffusion in supercooled aqueous sodium chloride solutions. J. Phys. Chem. A 2014, 118, 3307–3312. [Google Scholar] [CrossRef] [PubMed]
  27. Water Structure and Science. Available online: http://www1.lsbu.ac.uk/water/water_vibrational_spectrum.html (accessed on 10 March 2015).
  28. Deàk, J.C.; Rhea, S.T.; Iwaki, L.K.; Dlott, D.D. Vibrational energy relaxation and spectral diffusion in water and deuterated water. J. Phys. Chem. A 2000, 104, 4866–4875. [Google Scholar] [CrossRef]
  29. Max, J.J.; Chapados, C. Isotope effects in liquid water by infrared spectroscopy. III. H2O and D2O spectra from 6000 to 0 cm−1. J. Chem. Phys. 2009, 131. [Google Scholar] [CrossRef]
  30. Jones, G.; Dole, M. The viscosity of aqueous solutions of strong electrolytes with special reference to barium chloride. J. Am. Chem. Soc. 1929, 51, 2950–2964. [Google Scholar] [CrossRef]
  31. D’Angelo, P.; Barone, V.; Chillemi, G.; Sanna, N.; Meyer-Klaucke, W.; Pavel, N.V. Hydrogen and higher shell contributions in Zn2+, Ni2+, and Co2+ aqueous solutions: An X-ray absorption fine structure and molecular dynamics study. J. Am. Chem. Soc. 2002, 124, 1958–1967. [Google Scholar] [CrossRef] [PubMed]
  32. D’Angelo, P.; Benfatto, M. Effect of multielectronic configurations on the XAFS analysis at the Fe K edge. J. Phys. Chem. A 2004, 108, 4505–4514. [Google Scholar] [CrossRef]
  33. D’Angelo, P.; Bottari, E.; Festa, M.R.; Nolting, H.F.; Pavel, N.V. Structural investigation of copper (II) chloride solutions using X-ray absorption spectroscopy. J. Chem. Phys. 1997, 107, 2807–2812. [Google Scholar] [CrossRef]
  34. Lindqvist-Reis, P.; Muñoz-Páez, A.; Díaz-Moreno, S.; Pattanaik, S.; Persson, I.; Sandström, M. The structure of the hydrated gallium(III), indium(III), and chromium(III) ions in aqueous solution. A large angle X-ray scattering and EXAFS study. Inorg. Chem. 1998, 37, 6675–6683. [Google Scholar] [CrossRef] [PubMed]
  35. Einstein, A. Investigations on the Theory of the Brownian Movement; Dover Publications: New York, NY, USA, 1956. [Google Scholar]
  36. Smith, J.D.; Cappa, C.D.; Wilson, K.R.; Cohen, R.C.; Geissler, P.L.; Saykally, R.J. Unified description of temperature-dependent hydrogen-bond rearrangements in liquid water. Proc. Natl. Acad. Sci. USA 2005, 102, 14171–14174. [Google Scholar] [CrossRef] [PubMed]
  37. Sun, Q. Local statistical interpretation for water structure. Chem. Phys. Lett. 2013, 568–569, 90–94. [Google Scholar] [CrossRef]
  38. Fayer, M.D.; Moilanen, D.E.; Wong, D.; Rosenfeld, D.E.; Fenn, E.E.; Park, S. Water dynamics in salt solutions studied with ultrafast two-dimensional infrared (2D IR) vibrational echo spectroscopy. Acc. Chem. Res. 2009, 42, 1210–1219. [Google Scholar] [CrossRef] [PubMed]
  39. Raichlin, Y.; Millo, A.; Katzir, A. Investigations of the structure of water using mid-IR fiberoptic evanescent wave spectroscopy. Phys. Rev. Lett. 2004, 93. [Google Scholar] [CrossRef] [PubMed]
  40. Carey, D.M.; Korenowski, G.M. Measurement of the Raman spectrum of liquid water. J. Chem. Phys. 1998, 108, 2669–2675. [Google Scholar] [CrossRef]
  41. Chaplin, M. A proposal for the structuring of water. Biophys. Chem. 2000, 83, 211–221. [Google Scholar] [CrossRef]
  42. Odutola, J.A.; Dyke, T.R. Partially deuterated water dimers: Microwave spectra and structure. J. Chem. Phys. 1980, 72, 5062–5070. [Google Scholar] [CrossRef]
  43. Collins, K.D. Charge density-dependent strength of hydration and biological structure. Biophys. J. 1997, 72, 65–76. [Google Scholar] [CrossRef]
  44. Water Structure and Science. Available online: http://www1.lsbu.ac.uk/water/water_methods.html#vib (accessed on 10 March 2015).
  45. Savolainen, J.; Ahmed, S.; Hamm, P. Two-dimensional Raman-terahertz spectroscopy of water. Proc. Natl. Acad. Sci. USA 2013, 110, 20402–20407. [Google Scholar] [CrossRef] [PubMed]
  46. Fecko, C.; Eaves, J.; Loparo, J.; Tokmakoff, A.; Geissler, P. Ultrafast hydrogen-bond dynamics in the infrared spectroscopy of water. Science 2003, 301, 1698–1702. [Google Scholar] [CrossRef] [PubMed]
  47. Lock, A.J.; Woutersen, S.; Bakker, H.J. Ultrafast energy equilibration in hydrogen-bonded liquids. J. Phys. Chem. A 2001, 105, 1238–1243. [Google Scholar] [CrossRef]
  48. Cowan, M.; Bruner, B.D.; Huse, N.; Dwyer, J.; Chugh, B.; Nibbering, E.; Elsaesser, T.; Miller, R. Ultrafast memory loss and energy redistribution in the hydrogen bond network of liquid H2O. Nature 2005, 434, 199–202. [Google Scholar] [CrossRef] [PubMed]
  49. Shiraga, K.; Suzuki, T.; Kondo, N.; De Baerdemaeker, J.; Ogawa, Y. Quantitative characterization of hydration state and destructuring effect of monosaccharides and disaccharides on water hydrogen bond network. Carbohydr. Res. 2015, 406, 46–54. [Google Scholar] [CrossRef] [PubMed]
  50. Nicodemus, R.A.; Ramasesha, K.; Roberts, S.T.; Tokmakoff, A. Hydrogen bond rearrangements in water probed with temperature-dependent 2D IR. J. Phys. Chem. Lett. 2010, 1, 1068–1072. [Google Scholar] [CrossRef]
  51. Zhao, L.; Ma, K.; Yang, Z. Changes of water hydrogen bond network with different externalities. Int. J. Mol. Sci. 2015, 16, 8454–8489. [Google Scholar] [CrossRef] [PubMed]
  52. Shannon, R.D.T. Revised effective ionic radii and systematic studies of interatomic distances in halides and chalcogenides. Acta Crystallogr. Sect. A Cryst. Phys. Differ. Theor. Gen. Crystallogr. 1976, 32, 751–767. [Google Scholar] [CrossRef]
  53. Bloembergen, N. Proton relaxation times in paramagnetic solutions. J. Chem. Phys. 1957, 27, 572–573. [Google Scholar] [CrossRef]
Figure 1. T0/T1 of ZnCl2, CuCl2, FeCl3 and CrCl3 aqueous solutions at different concentrations. T0 is the spin-lattice relaxation time of pure water. Short dashed lines are the linear fitting results corresponding to the experimental data measured by NMR.
Ijms 17 00602 g001
Figure 2. Comparison of diffusion coefficient of four electrolyte aqueous solutions at different concentrations. The solutions with identical concentration are designated as the same fill pattern of the histogram.
Ijms 17 00602 g002
Figure 3. Specific viscosity of ZnCl2 (a), CuCl2 (b), FeCl3 (c) and CrCl3 (d) aqueous solutions at different concentrations. Short dashed lines are the linear fitting results corresponding to the experimental data.
Ijms 17 00602 g003
Figure 4. Comparison of Raman spectrum of aqueous solutions with different concentrations. (a) Raman spectrum of ZnCl2 solutions; (b) Raman spectrum of CuCl2 solutions; (c) Raman spectrum of FeCl3 solutions; (d) Raman spectrum of CrCl3 solutions. Insets: magnified OH stretching vibration peak ranging from 3100 to 3600 cm−1.
Ijms 17 00602 g004
Figure 5. Changes in content of high association water (a) and low association water (b) with concentration. The left-most points in the two panels correspond to the relative content of pure water.
Ijms 17 00602 g005
Figure 6. Comparison of Raman spectrum of pure water and four electrolyte solutions at 500 mmol·L−1.
Ijms 17 00602 g006
Figure 7. RDF of pure water and four electrolyte solutions at two concentrations.
Ijms 17 00602 g007
Table 1. Fitting results of specific viscosity versus concentration for four electrolyte aqueous solutions. Bvis: viscosity coefficient; T: intercept of Equation (6).
SystemBvis (L·mmol−1)TR2
ZnCl23.3790 × 10−41.01250.9946
CuCl24.1319 × 10−41.00140.9994
FeCl36.2041 × 10−40.99640.9974
CrCl38.9294 × 10−40.99350.9946

