
Glycated Albumin versus Glycated Hemoglobin as a Glycemic Indicator in Diabetic Patients on Peritoneal Dialysis

Abstract
:
1. Introduction
2. Results
3. Discussion
4. Experimental Section
4.1. Subjects and Study Design
4.2. Peritoneal Dialysis
4.3. Hemodialysis
4.4. Study Evaluations
4.5. Statistical Analyses
Author Contributions
Conflicts of Interest
References
- United States Renal Data System. 2014 Annual Data Report: Epidemiology of Kidney Disease in the United States. Available online: http://www.usrds.org/adr.aspx (accessed on 25 January 2016).
- Masakane, I.; Nakai, S.; Ogata, S.; Kimata, N.; Hanafusa, N.; Hamano, T.; Wakai, K.; Wada, A.; Nitta, K. An overview of regular dialysis treatment in Japan (as of 31 December 2013). Ther. Apher. Dial. 2015, 19, 540–574. [Google Scholar] [CrossRef] [PubMed]
- Ricks, J.; Molnar, M.Z.; Kovesdy, C.P.; Shah, A.; Nissenson, A.R.; Williams, M.; Kalantar-Zadeh, K. Glycemic control and cardiovascular mortality in hemodialysis patients with diabetes: A 6-year cohort study. Diabetes 2012, 61, 708–715. [Google Scholar] [CrossRef] [PubMed]
- Ramirez, S.P.B.; McCullough, K.P.; Thumma, J.R.; Nelson, R.G.; Morgenstern, H.; Gillespie, B.W.; Inaba, M.; Jacobson, S.H.; Vanholder, R.; Pisoni, R.L.; et al. Hemoglobin A(1c) levels and mortality in the diabetic hemodialysis population: Findings from the Dialysis Outcomes and Practice Patterns Study (DOPPS). Diabetes Care 2012, 35, 2527–2532. [Google Scholar] [CrossRef] [PubMed]
- Rhee, C.M.; Leung, A.M.; Kovesdy, C.P.; Lynch, K.E.; Brent, G.A.; Kalantar-Zadeh, K. Updates on management of diabetes in dialysis patients. Semin. Dial. 2014, 27, 135–145. [Google Scholar] [CrossRef] [PubMed]
- Inaba, M.; Okuno, S.; Kumeda, Y.; Yamada, S.; Imanishi, Y.; Tabata, T.; Okamura, M.; Okada, S.; Yamakawa, T.; Ishimura, E.; et al. Glycated albumin is a better glycemic indicator than glycated hemoglobin values in hemodialysis patients with diabetes: Effect of anemia and erythropoietin injection. J. Am. Soc. Nephrol. 2007, 18, 896–903. [Google Scholar] [CrossRef] [PubMed]
- Peacock, T.P.; Shihabi, Z.K.; Bleyer, A.J.; Dolbare, E.L.; Byers, J.R.; Knovich, M.A.; Calles-Escandon, J.; Russell, G.B.; Freedman, B.I. Comparison of glycated albumin and hemoglobin A1c levels in diabetic subjects on hemodialysis. Kidney Int. 2008, 73, 1062–1068. [Google Scholar] [CrossRef] [PubMed]
- Abe, M.; Matsumoto, K. Glycated hemoglobin or glycated albumin for assessment of glycemic control in hemodialysis patients with diabetes? Nat. Clin. Pract. Nephrol. 2008, 4, 482–483. [Google Scholar] [CrossRef] [PubMed]
- Nakao, T.; Inaba, M.; Abe, M.; Kaizu, K.; Shima, K.; Babazono, T.; Tomo, T.; Hirakata, H.; Akizawa, T. Best practice for diabetic patients on hemodialysis 2012. Ther. Apher. Dial. 2015, 19, S40–S66. [Google Scholar] [CrossRef] [PubMed]
- Abe, M.; Kalantar-Zadeh, K. Haemodialysis induced hypoglycaemia and glycaemic disarrays. Nat. Rev. Nephrol. 2015, 11, 302–313. [Google Scholar] [CrossRef] [PubMed]
- Coelho, S.; Rodrigues, A. Hemoglobin A1c in patients on peritoneal dialysis: How should we interpret it? Ther. Apher. Dial. 2014, 18, 375–382. [Google Scholar] [CrossRef] [PubMed]
- Ly, J.; Marticorena, R.; Donnelly, S. Red blood cell survival in chronic renal failure. Am. J. Kidney Dis. 2004, 44, 715–719. [Google Scholar] [CrossRef]
- Bunn, H.F.; Gabbay, K.H.; Gallop, P.M. The glycosylation of hemoglobin: Relevance to diabetes mellitus. Science 1978, 200, 21–27. [Google Scholar] [CrossRef] [PubMed]
- Koenig, R.J.; Peterson, C.M.; Jones, R.L.; Saudek, C.; Lehrman, M.; Cerami, A. Correlation of glucose regulation and hemoglobin AIc in diabetes mellitus. N. Engl. J. Med. 1976, 295, 417–420. [Google Scholar] [CrossRef] [PubMed]
- Salahudeen, A.K.; Keavey, P.M.; Hawkins, T.; Wilkinson, R. Is anaemia during continuous ambulatory peritoneal dialysis really better than during haemodialysis? Lancet 1983, 2, 1046–1049. [Google Scholar] [CrossRef]
- Freedman, B.I.; Shenoy, R.N.; Planer, J.A.; Clay, K.D.; Shihabi, Z.K.; Burkart, J.M.; Cardona, C.Y.; Andries, L.; Peacock, T.P.; Sabio, H.; et al. Comparison of glycated albumin and hemoglobin A1c concentrations in diabetic subjects on peritoneal and hemodialysis. Perit. Dial. Int. 2010, 30, 72–79. [Google Scholar] [CrossRef] [PubMed]
- Pisoni, R.L.; Bragg-Gresham, J.L.; Young, E.W.; Akizawa, T.; Asano, Y.; Locatelli, F.; Bommer, J.; Cruz, J.M.; Kerr, P.G.; Mendelssohn, D.C.; et al. Anemia management and outcomes from 12 countries in the Dialysis Outcomes and Practice Patterns Study (DOPPS). Am. J. Kidney Dis. 2004, 44, 94–111. [Google Scholar] [CrossRef] [PubMed]
- Bry, L.; Chen, P.C.; Sacks, D.B. Effects of hemoglobin variants and chemically modified derivatives on assays for glycohemoglobin. Clin. Chem. 2001, 47, 153–163. [Google Scholar] [PubMed]
- Lee, S.T.; Weykamp, C.W.; Lee, Y.W.; Kim, J.W.; Ki, C.S. Effects of 7 hemoglobin variants on the measurement of glycohemoglobin by 14 analytical methods. Clin. Chem. 2007, 53, 2202–2205. [Google Scholar] [CrossRef] [PubMed]


| Variable | PD Group | HD Group | p Value |
|---|---|---|---|
| Number of the patients | 20 | 20 | ‒ |
| Gender (male %) | 85 | 80 | 0.687 |
| Age (years) | 59.6 ± 9.5 | 58.6 ± 7.4 | 0.712 |
| Duration of dialysis (m) | 23.6 ± 18.3 | 24.8 ± 11.8 | 0.798 |
| Body mass index (kg/m2) | 24.3 ± 2.9 | 23.9 ± 1.8 | 0.704 |
| Hemoglobin (g/dL) | 10.8 ± 1.6 | 10.8 ± 1.5 | 0.876 |
| Serum albumin (g/dL) | 3.4 ± 0.4 | 3.5 ± 0.4 | 0.404 |
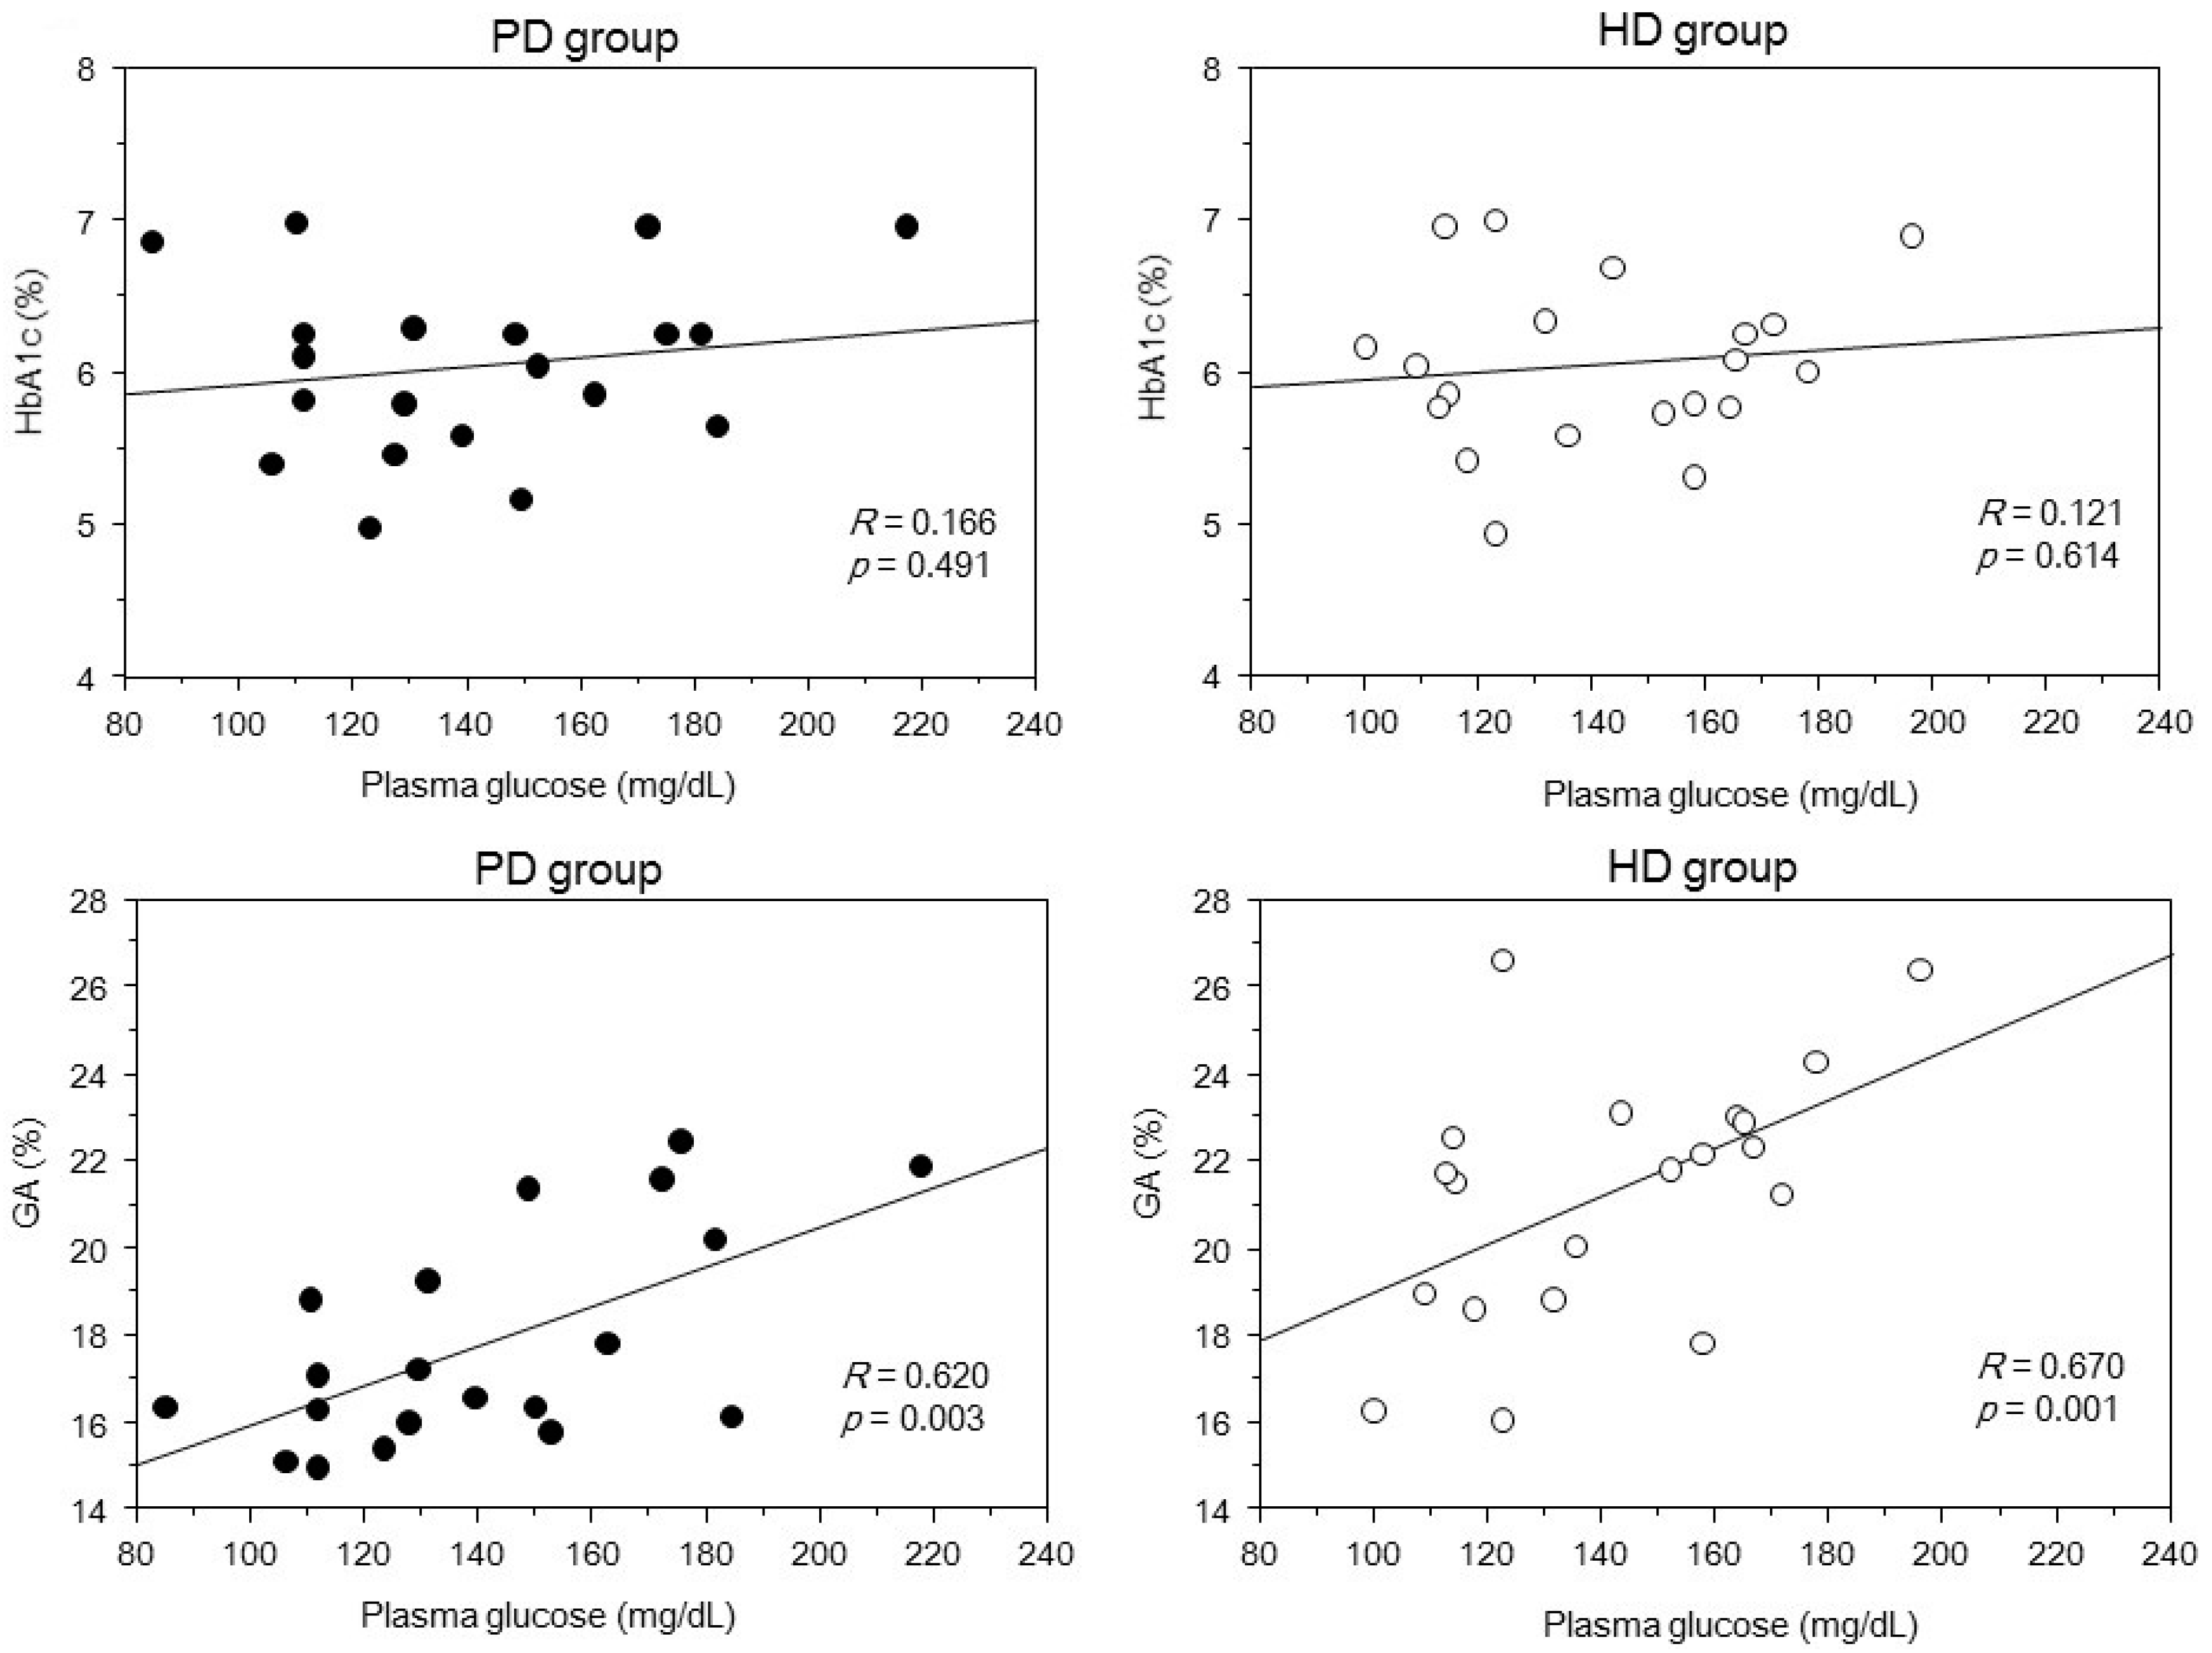
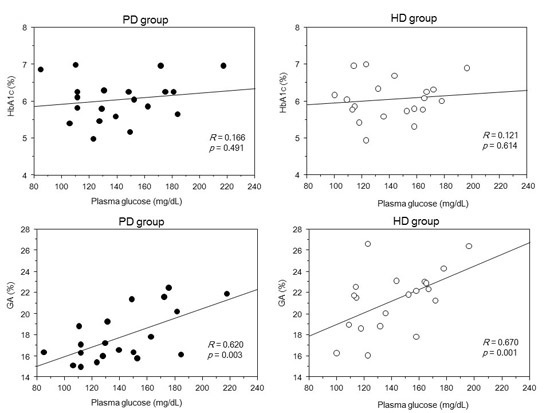
| Plasma glucose (mg/dL) | 142 ± 33 | 142 ± 27 | 0.996 |
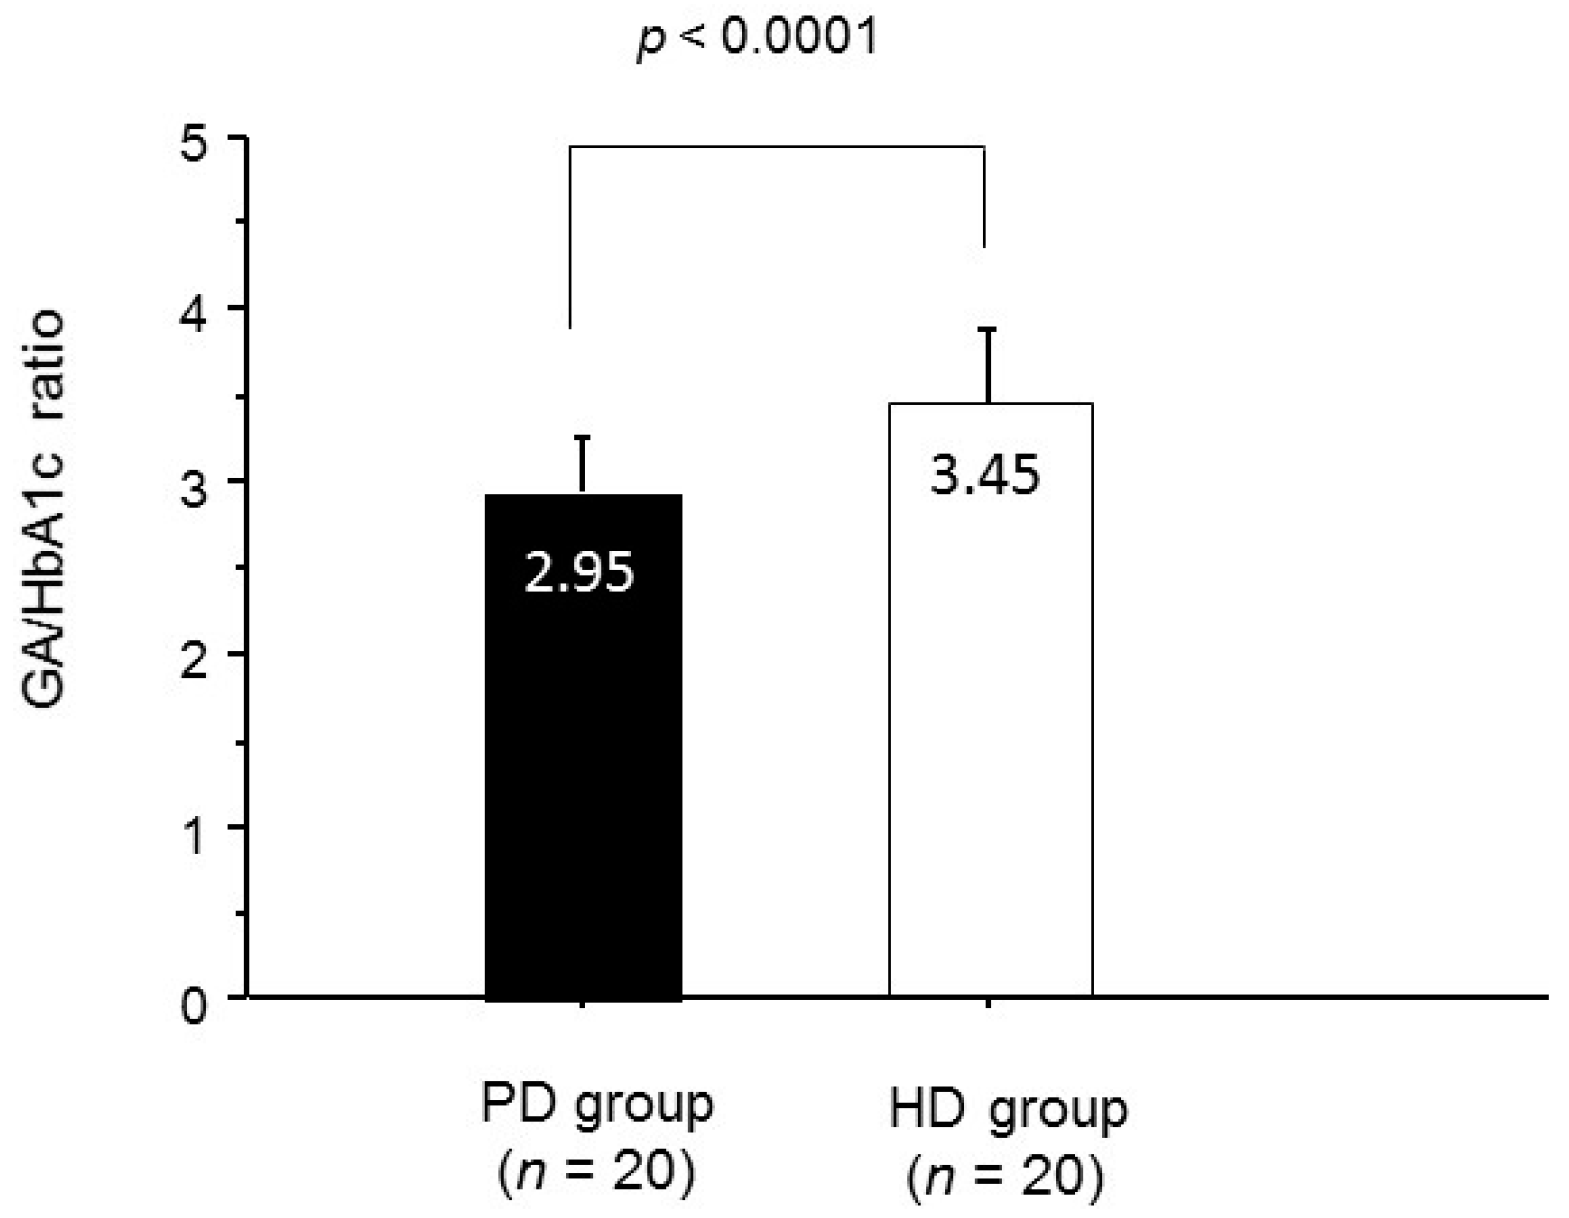
| Glycated hemoglobin (%) | 6.0 ± 0.6 | 6.1 ± 0.7 | 0.951 |
| Glycated albumin (%) | 17.8 ± 2.5 | 20.8 ± 2.8 | <0.001 |
| Darbepoetin dose (μg/month) | 143 ± 89 | 130 ± 58 | 0.596 |
| Antidiabetes therapy (n (%)) | 0.836 | ||
| Diet modification alone | 4 (20) | 4 (25) | |
| DPP-4 inhibitors | 7 (35) | 9 (45) | |
| Repaglinide | 3 (15) | 3 (15) | |
| α-GIs | 1 (5) | 2 (10) | |
| Insulin | 8 (40) | 7 (35) | |
| PET (n) | |||
| H/HA/LA/L | 2/8/8/2 | ‒ | ‒ |
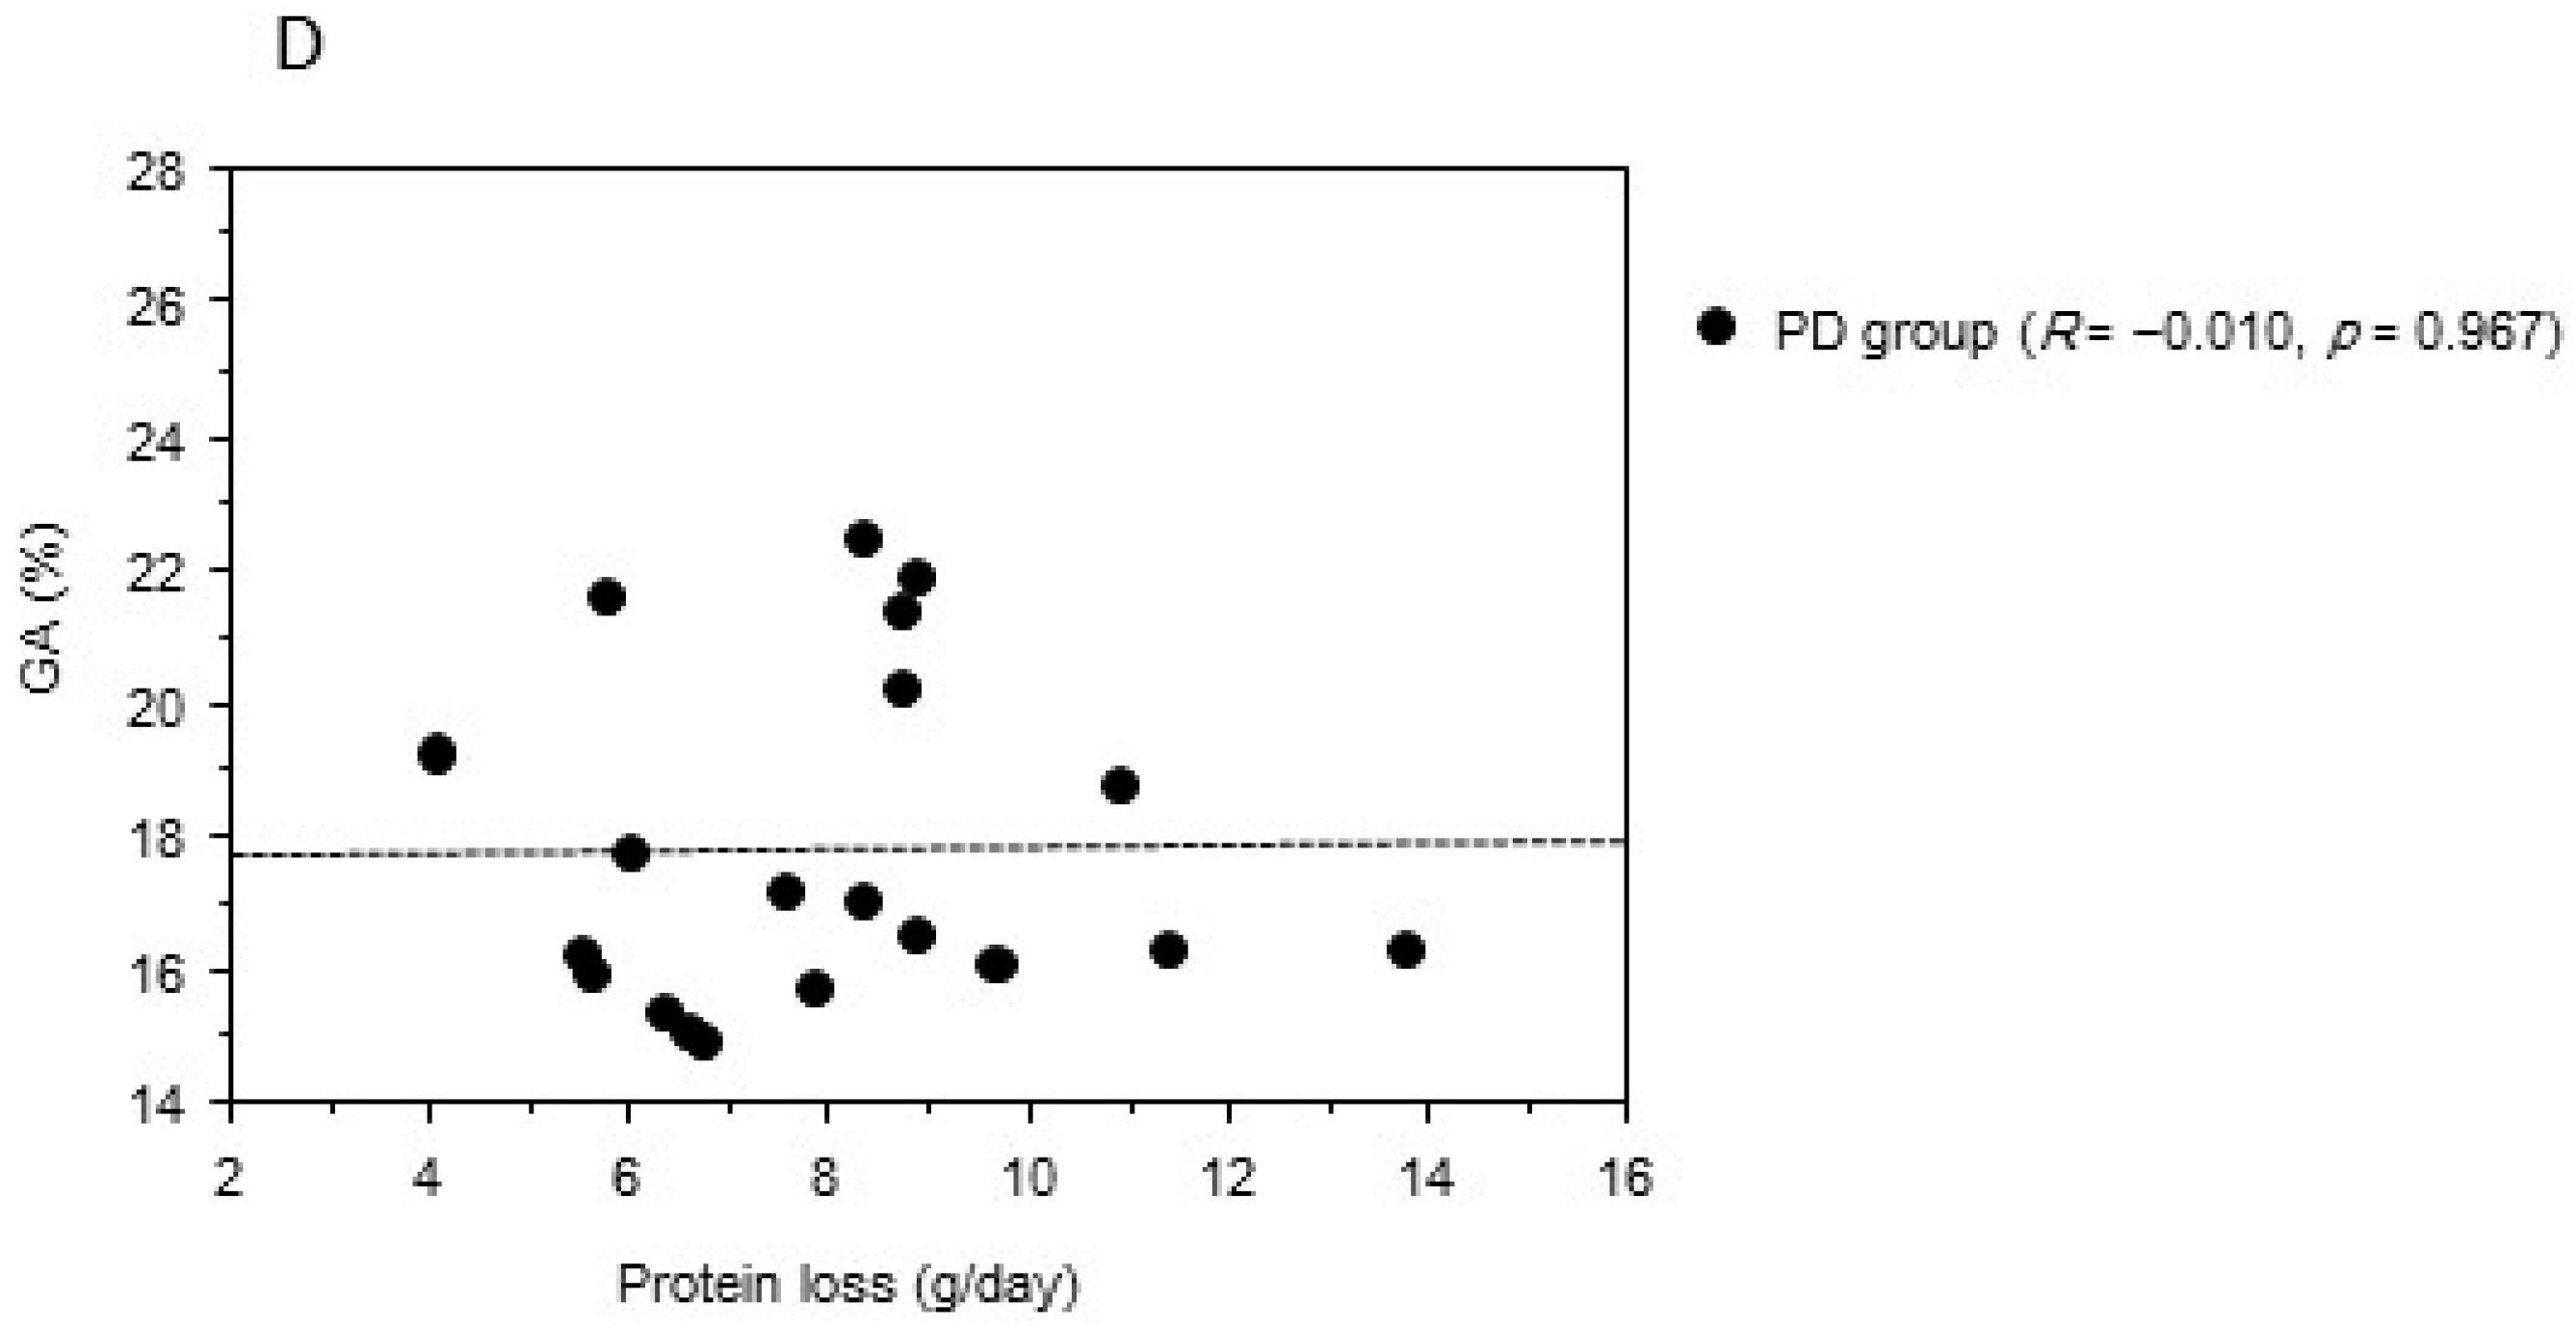
| Protein loss (g/day) | 8.0 ± 2.3 | ‒ | ‒ |
| PD Group (R2 = 0.51) | HD Group (R2 = 0.63) | |||||||||
|---|---|---|---|---|---|---|---|---|---|---|
| Variable | β | SE | 95% CI | p Value | β | SE | 95% CI | p Value | ||
| Lower | Upper | Lower | Upper | |||||||
| HbA1c | −30.8 | 21.1 | −76.6 | 14.9 | 0.168 | −15.6 | 10.2 | −37.6 | 6.2 | 0.147 |
| GA | 11.8 | 2.7 | 3.8 | 19.7 | 0.007 | 7.2 | 1.7 | 3.6 | 10.9 | 0.0008 |
| Hemoglobin | −5.6 | 6.3 | −19.2 | 8.1 | 0.389 | 1.9 | 4.7 | −8.1 | 12.1 | 0.688 |
| Serum albumin | −3.2 | 20.1 | −46.6 | 40.3 | 0.877 | −26.6 | 14.5 | −57.7 | 4.4 | 0.086 |
| ESA dose | −0.2 | 0.2 | −0.5 | 0.2 | 0.341 | −0.08 | 0.1 | −0.3 | 0.1 | 0.386 |
| Protein loss | 1.2 | 4.7 | −9.1 | 11.4 | 0.801 | |||||
© 2016 by the authors; licensee MDPI, Basel, Switzerland. This article is an open access article distributed under the terms and conditions of the Creative Commons Attribution (CC-BY) license (http://creativecommons.org/licenses/by/4.0/).
Share and Cite
Kobayashi, H.; Abe, M.; Yoshida, Y.; Suzuki, H.; Maruyama, N.; Okada, K. Glycated Albumin versus Glycated Hemoglobin as a Glycemic Indicator in Diabetic Patients on Peritoneal Dialysis. Int. J. Mol. Sci. 2016, 17, 619. https://doi.org/10.3390/ijms17050619
Kobayashi H, Abe M, Yoshida Y, Suzuki H, Maruyama N, Okada K. Glycated Albumin versus Glycated Hemoglobin as a Glycemic Indicator in Diabetic Patients on Peritoneal Dialysis. International Journal of Molecular Sciences. 2016; 17(5):619. https://doi.org/10.3390/ijms17050619
Chicago/Turabian StyleKobayashi, Hiroki, Masanori Abe, Yoshinori Yoshida, Hiroko Suzuki, Noriaki Maruyama, and Kazuyoshi Okada. 2016. "Glycated Albumin versus Glycated Hemoglobin as a Glycemic Indicator in Diabetic Patients on Peritoneal Dialysis" International Journal of Molecular Sciences 17, no. 5: 619. https://doi.org/10.3390/ijms17050619
APA StyleKobayashi, H., Abe, M., Yoshida, Y., Suzuki, H., Maruyama, N., & Okada, K. (2016). Glycated Albumin versus Glycated Hemoglobin as a Glycemic Indicator in Diabetic Patients on Peritoneal Dialysis. International Journal of Molecular Sciences, 17(5), 619. https://doi.org/10.3390/ijms17050619