Abstract
The mammalian hyaluronidase degrades hyaluronic acid by the cleavage of the β-1,4-glycosidic bond furnishing a tetrasaccharide molecule as the main product which is a highly angiogenic and potent inducer of inflammatory cytokines. Ursolic acid 1, isolated from Prismatomeris tetrandra, was identified as having the potential to develop inhibitors of hyaluronidase. A series of ursolic acid analogues were either synthesized via structure modification of ursolic acid 1 or commercially obtained. The evaluation of the inhibitory activity of these compounds on the hyaluronidase enzyme was conducted. Several structural, topological and quantum chemical descriptors for these compounds were calculated using semi empirical quantum chemical methods. A quantitative structure activity relationship study (QSAR) was performed to correlate these descriptors with the hyaluronidase inhibitory activity. The statistical characteristics provided by the best multi linear model (BML) (R2 = 0.9717, R2cv = 0.9506) indicated satisfactory stability and predictive ability of the developed model. The in silico molecular docking study which was used to determine the binding interactions revealed that the ursolic acid analog 22 had a strong affinity towards human hyaluronidase.
1. Introduction
Hyaluronic acid (HA) is a polymer of varying chain length composed of a repeating dissacharide unit, N-acetylhyaluronic acid, linked via the hexosaminidic bonds in β-(1→4) linkages [1]. It usually consists of 2000–2500 dissacharides to give a molecular mass between 106 to 107 Da and extended lengths of 2–25 µm [2]. It can be found in an extracellular matrix, especially in soft connective tissues of all vertebrates and in the capsule of some bacteria [2]. HA plays an important role in biological processes such as cellular adhesion, mobility differentiation processes that act as lubricant and shock absorber, regulates water balance and osmotic pressure [3]. It is also the structure-forming molecule in the vitreous humor of the eye, in Wharton’s jelly and in joint fluids.
Hyaluronidase degrades HA by cleaving the N-acetylglucosamidic bonds of HA via a β-elimination process to produce HA oligosaccharides, with chain lengths of four to 25 disaccharides which possess angiogenic properties [3,4]. The process of HA oligosaccharide formation favors the production of new blood vessels, thus facilitating the development of cancer tumors. Since this enzyme has been implicated in many biological functions, such as allergy, inflammation, migration of cancer cells and permeability of the vascular system, the modulation of hyaluronidases by suitable inhibitors will be useful for normal homeostasis in the body.
Prismatomeris tetrandra (Roxb.) K. Schum is also a synonym for P. malayana Ridley and P. albidiflora King [5]. P. tetrandra is popular in Malaysia as “tongkat haji samat”. This plant is distributed in South East Asia. It is traditionally used to treat wounds, bronchitis and snakebites [6]. In this study, three pentacylic triterpenoids (PT) with hyaluronidase inhibitory activity namely, ursolic acid 1, 3β,19,23-trihydroxyurs-12-en-28-oic acid 2 and 3β-acetylolean-12-en-28-oic acid 3 were isolated.
PTs are aglycones of saponins and exist abundantly in the plant kingdom. They have a wide range of activities such as cytotoxicity and anti-microbial, anti-oxidant, anti-HIV properties [7,8,9,10]. Ursolic acid 1 and several other PTs have been also reported to possess a wide range of anti-inflammatory activities. Their systemic anti-inflammatory effects might be due to their actions on the mediators signaling such as on histamine, human leukocyte elastase, cytokines, reactive oxygen species, lipid peroxidation and lipid-derived mediators [11]. Besides that, some PTs have also been reported to show hepatoprotective activity, inhibit edema in animal models and immune modulating actions in mice.
Structural modification studies on PTs have been reported for betulinic acid and ursolic acid in order to investigate their potential as anti-tumor drugs [12,13,14,15,16]. The potential of PTs and their derivatives on anti-HIV inhibition towards HIV protease and cytotoxicity on tumor cell lines have also been studied [10,17,18,19,20]. However, when compared to the other bioactivity studies, ursolic acid 1 and its derivatives have never been thoroughly explored for their anti-inflammatory properties, specifically on the inhibition activity towards hyaluronidase.
Several quantitative structure activity relationship (QSAR) studies have been conducted on PT compounds based on inhibition towards glycogen phosphorylase, and anti-cancer, immunomodulatory, and anti HIV activities [21,22,23,24]. However, the QSAR study on PTs including ursolic acid and its derivatives as anti-inflammatory agents, due to hyaluronidase inhibitory activity, has not been reported.
In this work, we report the isolation and characterization of natural PTs including ursolic acid, and also the synthesis of seven analogues of ursolic acid. In addition, all PTs together with twenty ursolic acid analogues were subjected to hyaluronidase inhibitory assay. The results were then used to build QSAR models based on the quantum chemical descriptors which were calculated from the three dimensional structure of the PTs. The computer software CODESSA 2.6 was used in this study to build the QSAR model. In order to investigate the influence of different descriptors on the hyaluronidase inhibitory ability of PTs, both the Heuristic and Best Multi Linear model (BML) were used to develop a multivariable linear model. Thus, the objective of this study was to understand the inhibition towards hyaluronidase activity by the PTs with a wide range of structures. Molecular docking was performed to predict the complex structure and determine the binding mode of interaction with hyaluronidase. The new and accurate QSAR model established in this study can be used to predict the activity. A predicted compound (PTC A) using the QSAR model developed was also proposed.
2. Results and Discussion
2.1. Isolation and Characterization of Triterpenoids 1–3
A total of three PTs were isolated from P. tetrandra. The two PTs which were obtained from the chloroform (CHCl3) fraction were identified as 3β-urs-12-en-28-oic acid 1 and 3β,19,23-trihydroxyurs-12-en-28-oic acid 2. The PTs isolated from the roots were characterized as 3β-acetylolean-12-en-28-oic acid 3.
2.2. Synthesis
Compounds 4–10 were synthesized from ursolic acid 1. Structural modifications were carried out at positions C-3 and C-28 of ursolic acid 1 (Figure 1). The modifications were carried out either by acetylation, methylation or amino group introduction or by combination of the three methods. Compounds 11–30 were purchased from Chromadex® which was obtained from natural sources i.e., plants. The structures were confirmed on the basis of their 1H NMR, 13C NMR, and ESI-MS spectroscopy data and upon comparison with literature values [25,26].
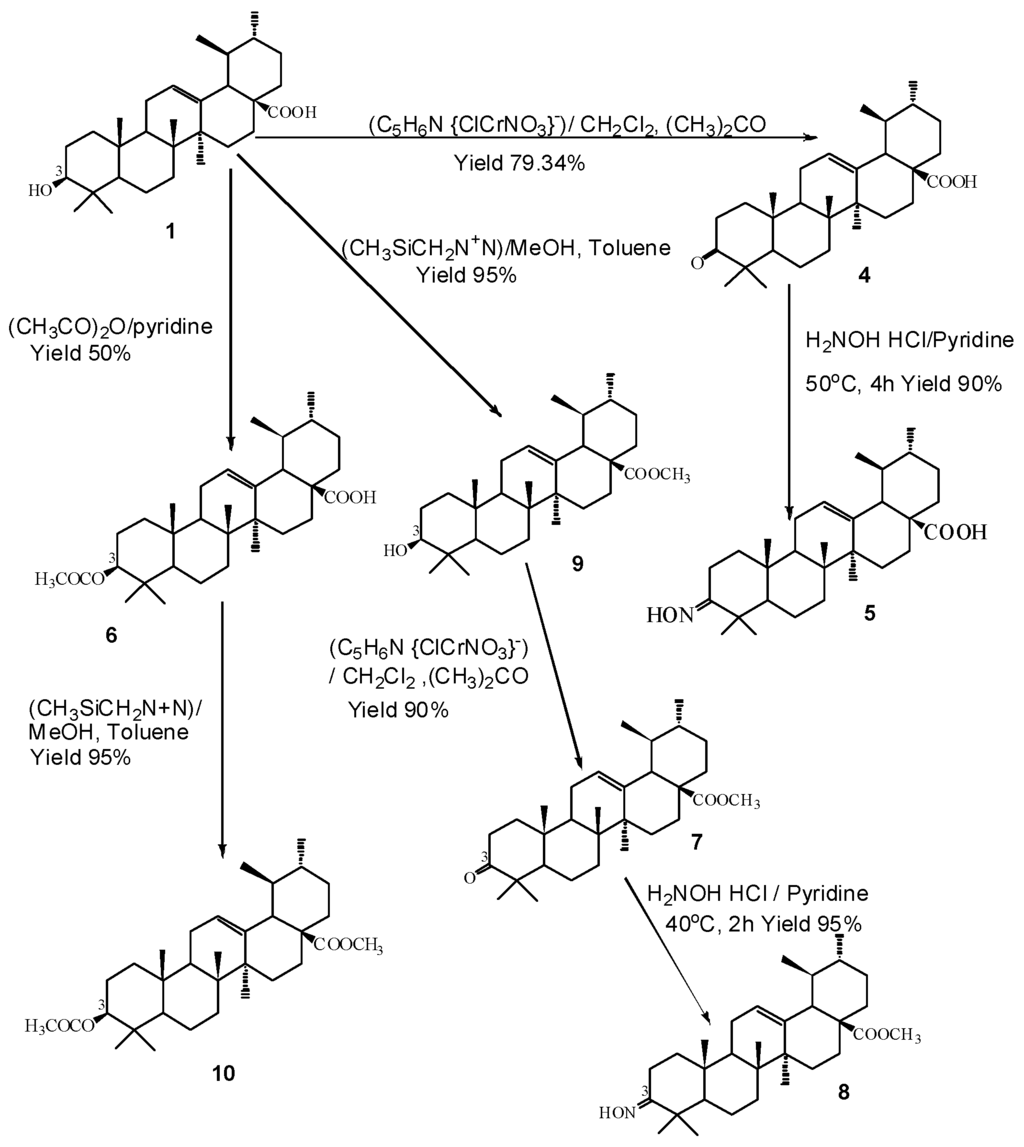
Figure 1.
Synthesis of ursolic acid 1 derivatives with different substituents at C-3. ((C5H6N {ClCrNO3}) = Pyridinium chlorochromate; CH2Cl2 = dichloromethane; (CH3)2CO = acetone; H2NOHHCl = hydroxylamine hydrochloride; (CH3CO)2 = acetic anhydride; (CH3SiCH2N+N) = trimethylsilyl diazomethane (TMS)).

2.3. Hyaluronidase Inhibitory Activity
The study was conducted on compounds 1–30. The assay was performed according to the modified Sigma protocol [27]. The IC50 values for the inhibitory activities of compounds 1–30 are presented in Table 1. The results showed that out of the 30 compounds, only 24 were found to exhibit activity below 2000 µM. Oleanolic acid methyl ester 16 (84.52 µM) and carbonexolone 22 (56.33 µM) showed higher activities compared to ursolic acid 1. Compounds 4 (162.83 µM), 5 (190.94 µM), 6 (136.92 µM), 9 (182.51 µM), 13 (206.21 µM), 14 (211.44 µM), 15 (140.91 µM), 19 (115.96 µM) and 21 (146.18 µM) showed higher activities compared to apigenin, the positive control. Compounds 25–30 on the other hand were inactive as their inhibitory activities were less than 20% at concentrations of up to 2 × 10³ µM (Table 1). All compounds were prepared at an initial concentration of 2000 µM before serial dilution. Thus, if the inhibition towards hyaluronidase at 2000 µM was less than 20%, the compound will be considered as inactive. The highest concentration was prepared less than 2000 µM to avoid the solubility problem.

Table 1.
Hyaluronidase inhibitory activity of ursolic acid 1 and its analogues at the concentration of 100–2000 µM.
 | |||||||||||||
|---|---|---|---|---|---|---|---|---|---|---|---|---|---|
| Substitutional Pattern | a IC50 | ||||||||||||
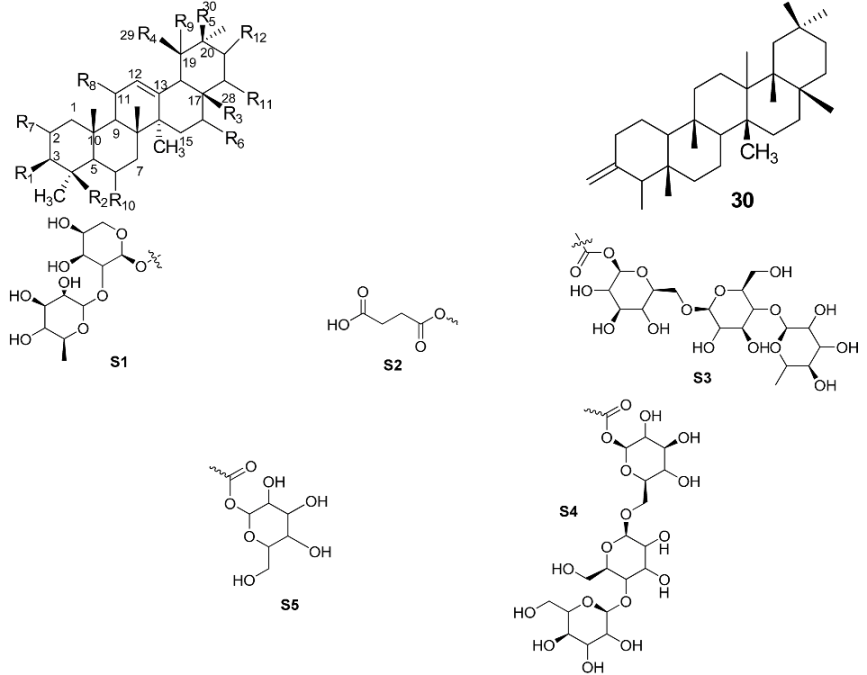
| Compounds | R1 | R2 | R3 | R4 | R5 | R6 | R7 | R8 | R9 | R10 | R11 | R12 | |
| 1 | OH | CH3 | COOH | CH3 | H | H | H | H | H | H | H | H | 103.18 ± 1.70 ** |
| 2 | OH | CH2OH | COOH | CH3 | H | H | H | H | OH | H | H | H | 286.95 ± 10.28 |
| 3 | OAc | CH3 | COOH | H | CH3 | H | H | H | H | H | H | H | 1466.5 ± 2.37 |
| 4 | =O | CH3 | COOH | CH3 | H | H | H | H | H | H | H | H | 162.83 ± 6.37 * |
| 5 | NOH | CH3 | COOH | CH3 | H | H | H | H | H | H | H | H | 190.94 ± 0.01 * |
| 6 | OAc | CH3 | COOH | CH3 | H | H | H | H | H | H | H | H | 136.92 ± 0.04 * |
| 7 | =O | CH3 | COOCH3 | CH3 | H | H | H | H | H | H | H | H | 1184.15 ± 6.63 |
| 8 | NOH | CH3 | COOCH3 | CH3 | H | H | H | H | H | H | H | H | 275.68 ± 1.42 |
| 9 | OH | CH3 | COOCH3 | CH3 | H | H | H | H | H | H | H | H | 182.51 ± 0.84 * |
| 10 | OAc | CH3 | COOCH3 | CH3 | H | H | H | H | H | H | H | H | 812.93 ± 10.29 |
| 11 | OH | CH3 | CH3 | H | COOCH3 | H | H | =O | H | H | H | H | 1750.91 ± 2.38 |
| 12 | OH | CH2OH | CH3 | CH3 | H | H | H | H | H | H | H | H | 227.97 ± 2.81 |
| 13 | OH | CH3 | CH2OH | H | CH3 | H | H | H | H | H | H | H | 206.21 ± 2.32 |
| 14 | OH | CH3 | CH3 | CH3 | H | H | H | H | H | H | H | H | 211.44 ± 3.16 * |
| 15 | OH | CH3 | COOH | H | CH3 | OH | H | H | H | H | H | H | 140.91 ± 6.71 |
| 16 | OH | CH3 | COOCH3 | H | CH3 | H | H | H | H | H | H | H | 84.52 ± 0.01 ** |
| 17 | S1 | CH2OH | COOH | H | CH3 | H | H | H | H | H | H | H | 842.54 ± 0.11 |
| 18 | OH | CH3 | CH3 | H | CH3 | H | H | H | H | H | H | H | 215.66 ± 4.27 * |
| 19 | OH | CH2OH | COOH | CH3 | H | H | OH | H | H | H | H | H | 115.96 ± 0.47 * |
| 20 | OH | CH3 | COOH | H | CH3 | H | H | H | H | H | H | H | 227.97 ± 5.99 |
| 21 | OH | CH3 | CH3 | H | COOH | H | H | =O | H | H | H | H | 146.18 ± 2.67 * |
| 22 | S2 | CH3 | CH3 | H | COOH | H | H | =O | H | H | H | H | 56.33 ± 0.01 ** |
| 23 | OH | COOH | CH3 | H | CH3 | H | H | H | H | H | H | H | 1482.56 ± 0.70 |
| 24 | OH | CH2OH | COOH | H | CH3 | H | H | H | H | H | H | H | 230.00 ± 2.17 |
| 25 | O-glucoside | CH3 | COOH | H | CH3 | OH | H | H | H | H | H | H | NA |
| 26 | OH | COOH | CH3 | CH3 | H | H | H | H | H | H | H | H | NA |
| 27 | OH | S3 | CH2OH | CH3 | H | H | OH | H | H | H | H | H | NA |
| 28 | OH | CH2OH | CH2OH | H | CH3 | OH | H | H | H | H | OH | OH | NA |
| 29 | OH | CH2OH | COOS4 | CH3 | H | H | OH | H | H | OH | H | H | NA |
| 30 | – | – | – | – | – | – | – | – | – | – | – | – | NA |
| Apigenin | – | – | – | – | – | – | – | – | – | – | – | – | 214.74 |
a NA-inhibitory activity, 20% at concentration up to 2000 µM; positive control-Apigenin. Values were presented as the mean of three independent experiments performed in triplicate; * Mean for percentage inhibition were significantly different (one-way analysis of variance, p < 0.05); ** Mean for percentage inhibition were significantly different (one-way analysis of variance, p < 0.005).
2.4. Structure Activity Relationship (SAR) of Ursolic Acid 1 and Its Analogues
Basically, the analogues are classified into two pentacyclic triterpene (PTC) skeletons; ursane (1, 2, 4, 5, 6, 7, 8, 9, 10, 12, 14, 19, 26, 27, 29) and oleanane (3, 13, 15, 16, 17, 18, 20, 23, 24, 25, 28, 30). The results in Table 1 showed that ursolic acid 1 was more active than oleanolic acid 20. However, the comparison between the analogues or derivatives with the similar skeletons such as 12 and 13, or 14 and 18, does not reveal a large difference in their activity. Thus, it showed that the geminal or vicinal arrangement of the methyl-29 and 30 did not give a large effect on the activity but with some exception. The discussion will be divided into the ursane and oleanane skeletons.
For the oleanane skeleton, the activity reduced slightly when the methylhydroxyl group was introduced at C-23 (21 vs. 25). However, the activity increased when the methyl group was introduced at C-17 (18 vs. 20). The activity was also increased when the hydroxyl group was introduced at C-16 (15 vs. 20). The C-30 ester derivatives resulted in a great loss of activity (11 vs. 21), while the carboxylation of the same carbon (C-30) increased the activity (21).
Acetylation of 3-OH decreased the inhibitory ability (3). Introduction of a sugar moiety with a glycosidic bond to 3-OH or 28-COOH would either reduce the activity drastically (17) or become inactive, whereas the addition of an oxo group to C-11 either did not improve the activity or reduced it slightly (21 vs. 22 vs. 11). Too many hydroxyl groups as in 28 also resulted in a loss of activity. Significant improvement in the activity was observed when a methylester group was introduced at C-17 (16 vs. 20, 18) or when a carboxypropanoyloxy group, S2, was introduced at C-3 (22).
The inhibitory activity of the ursane skeleton analogues decreased for the 3-oxo, 3-hydroxyimino and 3-acetylate derivatives (4, 5, 6) compared to ursolic acid 1. A similar trend was observed when the 28-OH was substituted with a methyl group (5 vs. 8, 1 vs. 9, 6 vs. 10). This observation suggested that the hydroxyl groups at C-3 and C-28 were essential for the hyaluronidase inhibitory activity. The substitution of a methyl group with a carboxyl group at C-23 decreased the inhibitory activity (14 vs. 26, NA). The introduction of a hydroxymethylene group at C-23 and the addition of a hydroxyl group at C-1 did not affect the activity very much (19 vs. 26, NA), however, the addition of a hydroxyl group at C-19 further decreased the activity (2). The position of the hydroxyl group also affected the activity as it decreased the activity for 2 (C-19) compared to 19 (C-2). The sugar moiety, as usual, would result in a loss of activity (27, 29).
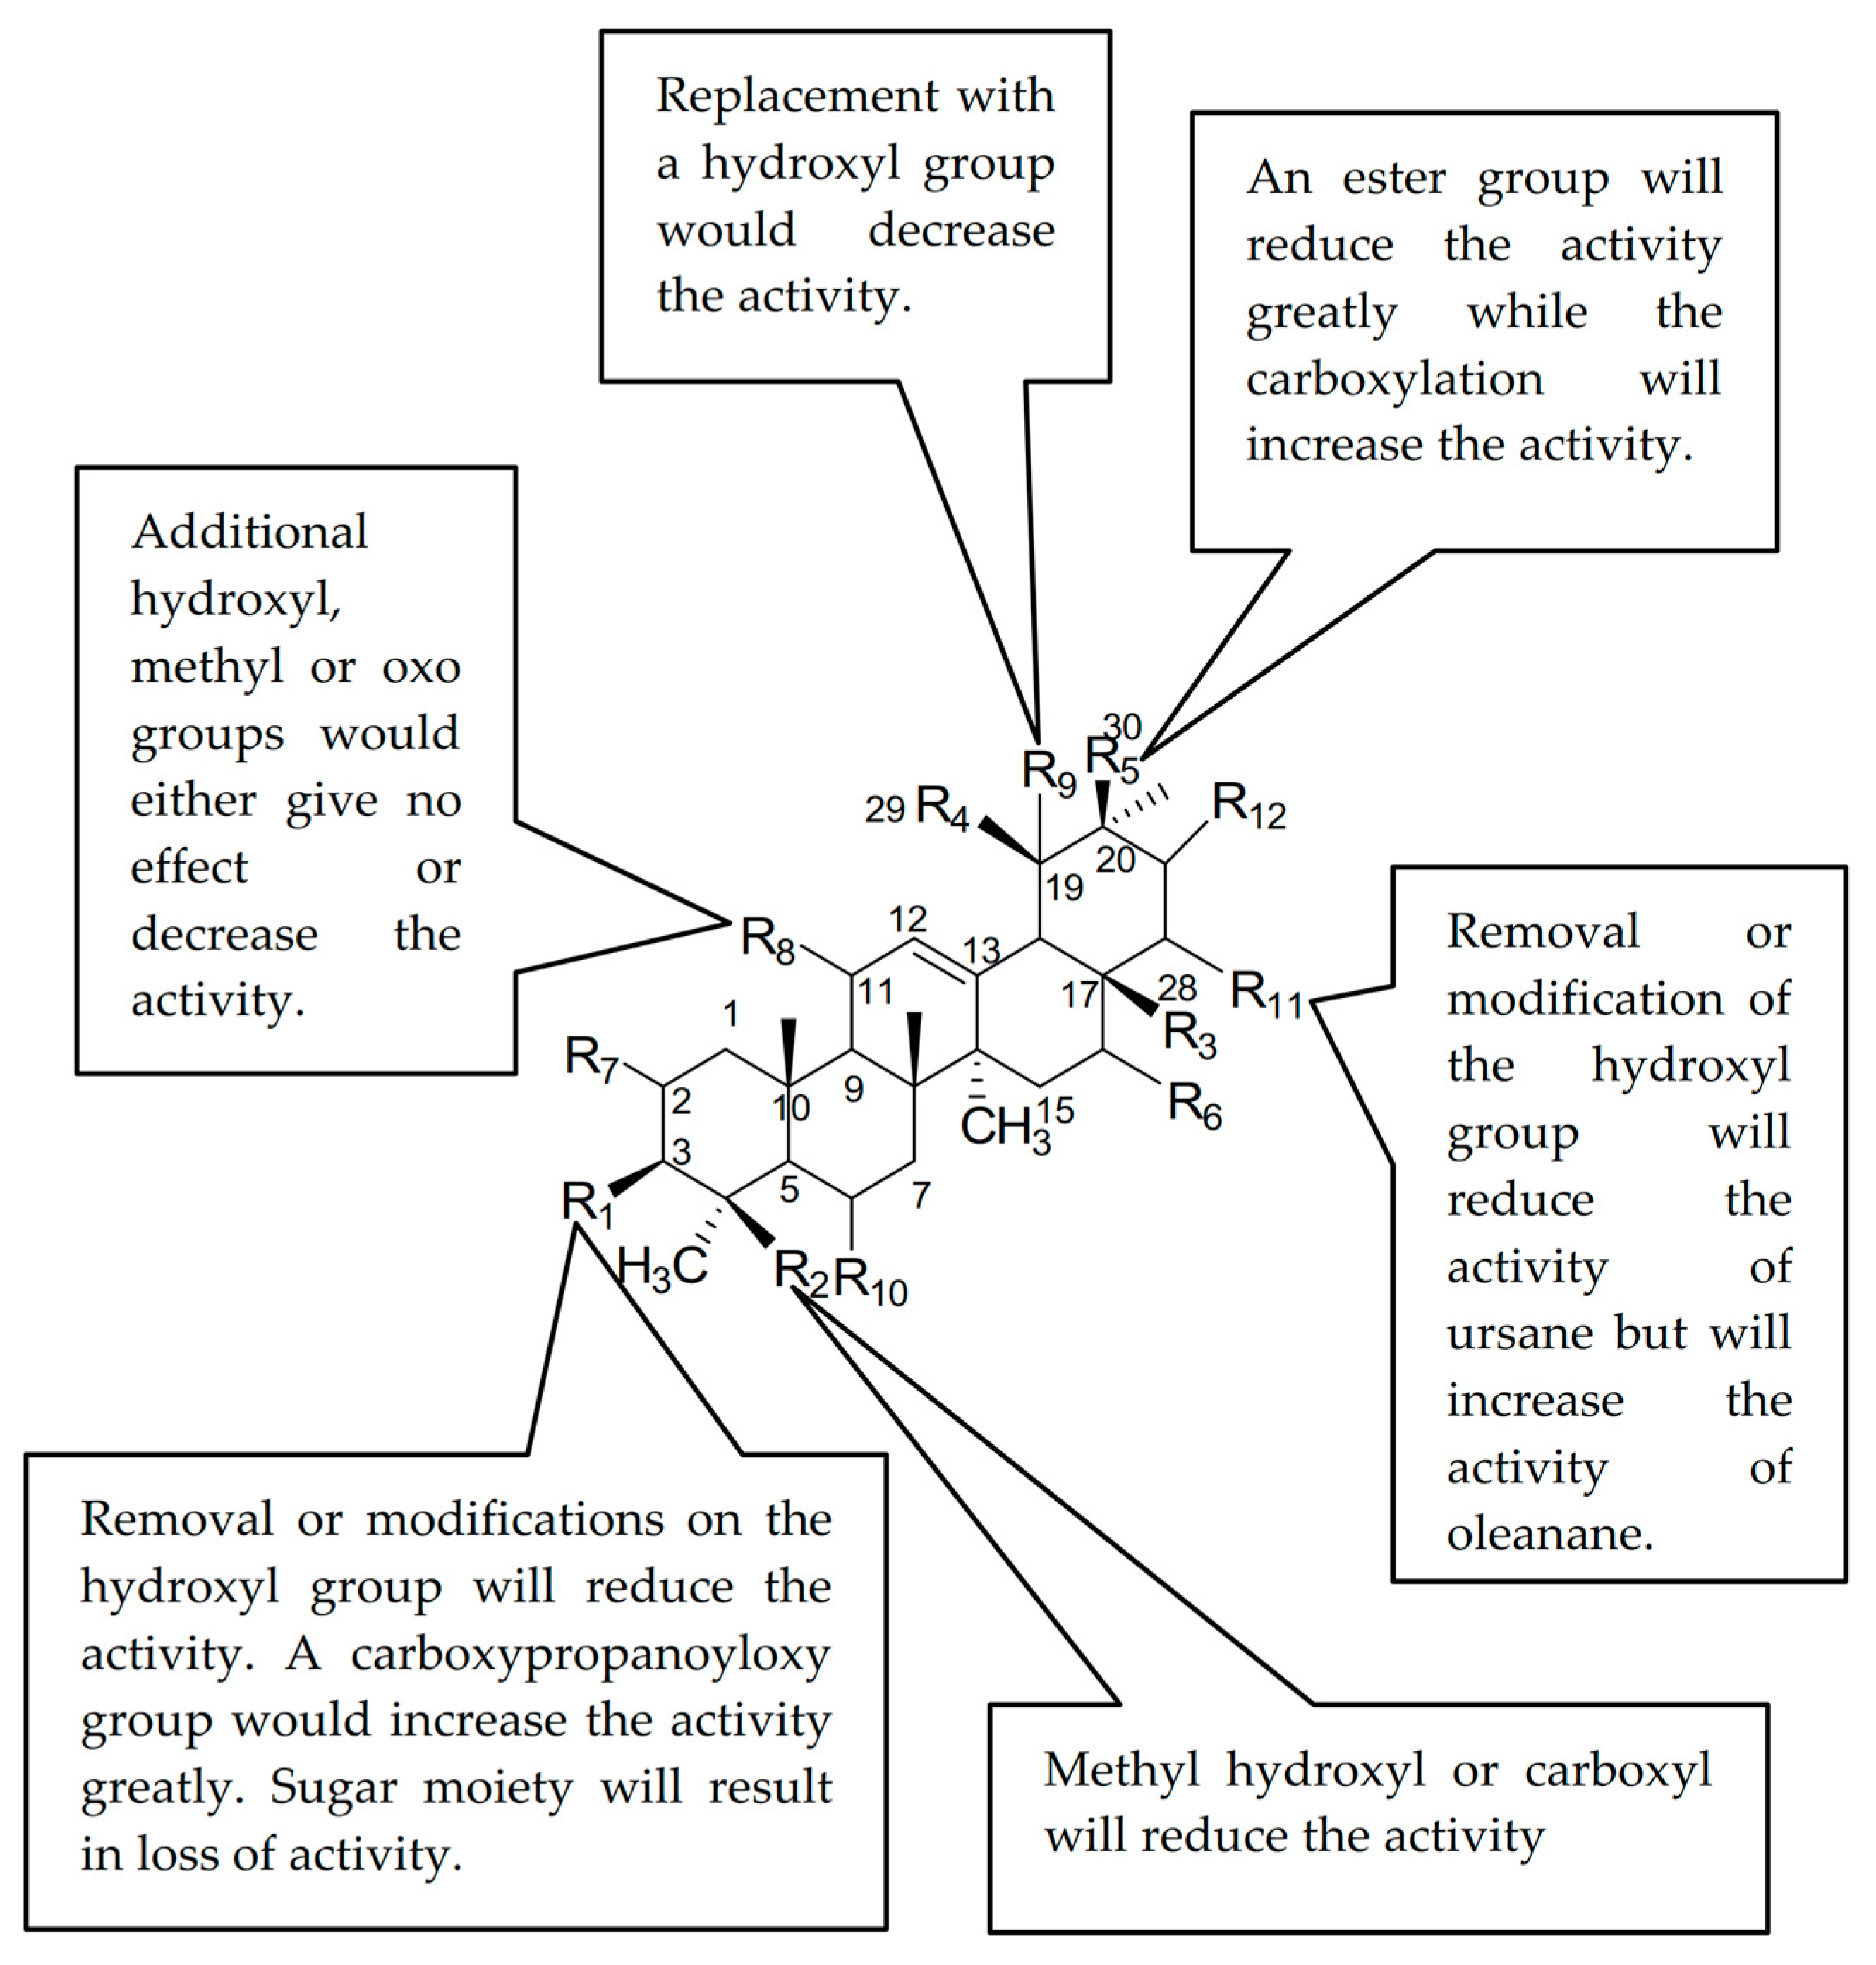
It can be concluded that the presence of 3-OH is important for both ursane and oleanane skeletons to inhibit hyaluronidase. Introducing a methyl ester group at C-17 to replace the carboxylic functional group resulted in a different effect on the hyaluronidase inhibition ability of both types of skeletons. Replacement of the 3-OH with hydroxyimino, acetyl and methyl groups lowered the activity. Addition of hydroxyl groups at C-2, C-1 and C-19 or oxo groups at C-11 and C-3, however, would either give no effect or decrease the activity. Introducing a sugar moiety at any position would result in a loss of activity. This could probably be due to the bulkiness of the structure that led to the compounds being unable to reach the active site of the target, which was in the hyaluronidase enzyme. However, the carboxypropionylox group, S2, that replaced the 3-OH, increased the activity. Figure 2 summarizes the structure activity relationship of the PTC compounds (1–30).
Even though these simplistic structure activity relations are useful for a single functional group substitutional level, it is not easy to predict the cumulative effect of several substitutions on the hyaluronidase inhibition activity using these relations. Hence, it is necessary to adopt the QSAR approach to analyze and predict the effect of substitution on the activity.
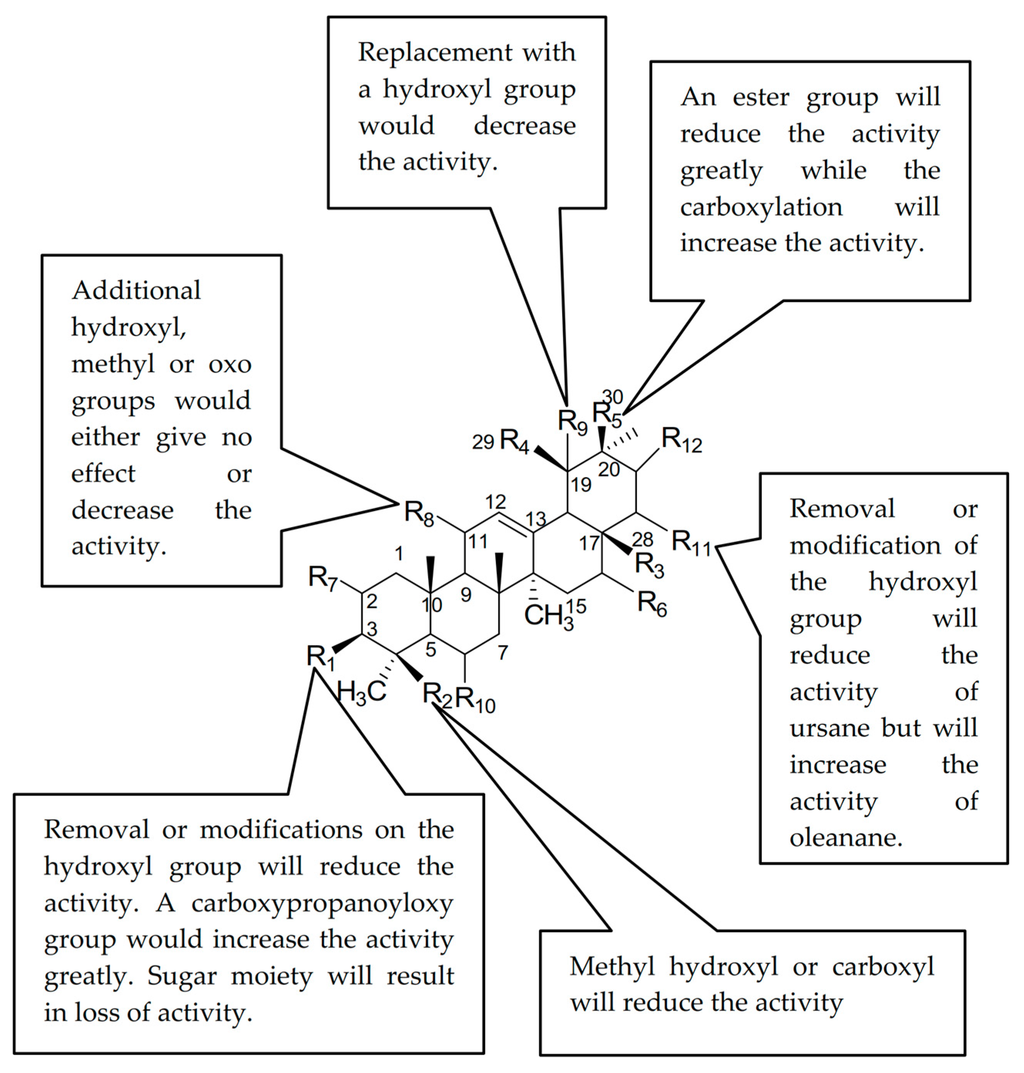
Figure 2.
Structure activity relationship of pentacyclic triterpenes (PTs).
Figure 2.
Structure activity relationship of pentacyclic triterpenes (PTs).
2.5. QSAR Model and Its Interpretation
The data set from the hyaluronidase inhibitory activity for compounds 1–24 were converted into log IC50 in order to improve the normal distribution of the experimental data points [28]. After analyzing the data set using the Heuristic method and Best Multi Linear regression method (BML), it was found that the QSAR model from the BML method was statistically robust compared to the Heuristic method.
The data was divided into the test set (8, 11, 19, 6) and the remaining data into the training set. From the data set which consisted of 20 compounds, eleven models were obtained which consisted of two to twelve descriptors as listed in Table 2. The R2 values as well as the other statistical values also improved (close to 1). This method managed to avoid over fitting of the regression equations by monitoring the increase of R2 in the equations with successive number of descriptors involved. The procedure is called the break point technique [28]. The procedure was stopped when the difference between R2 of the two consequent regression equations was less than or equal to 0.02 [28]. However, the best optimum correlation should have the ratio of the data set compounds to the descriptor at 5:1 [29]. Meaning that, there is a descriptor that represents five data points. Thus, from the data set, the optimum descriptor number was four.
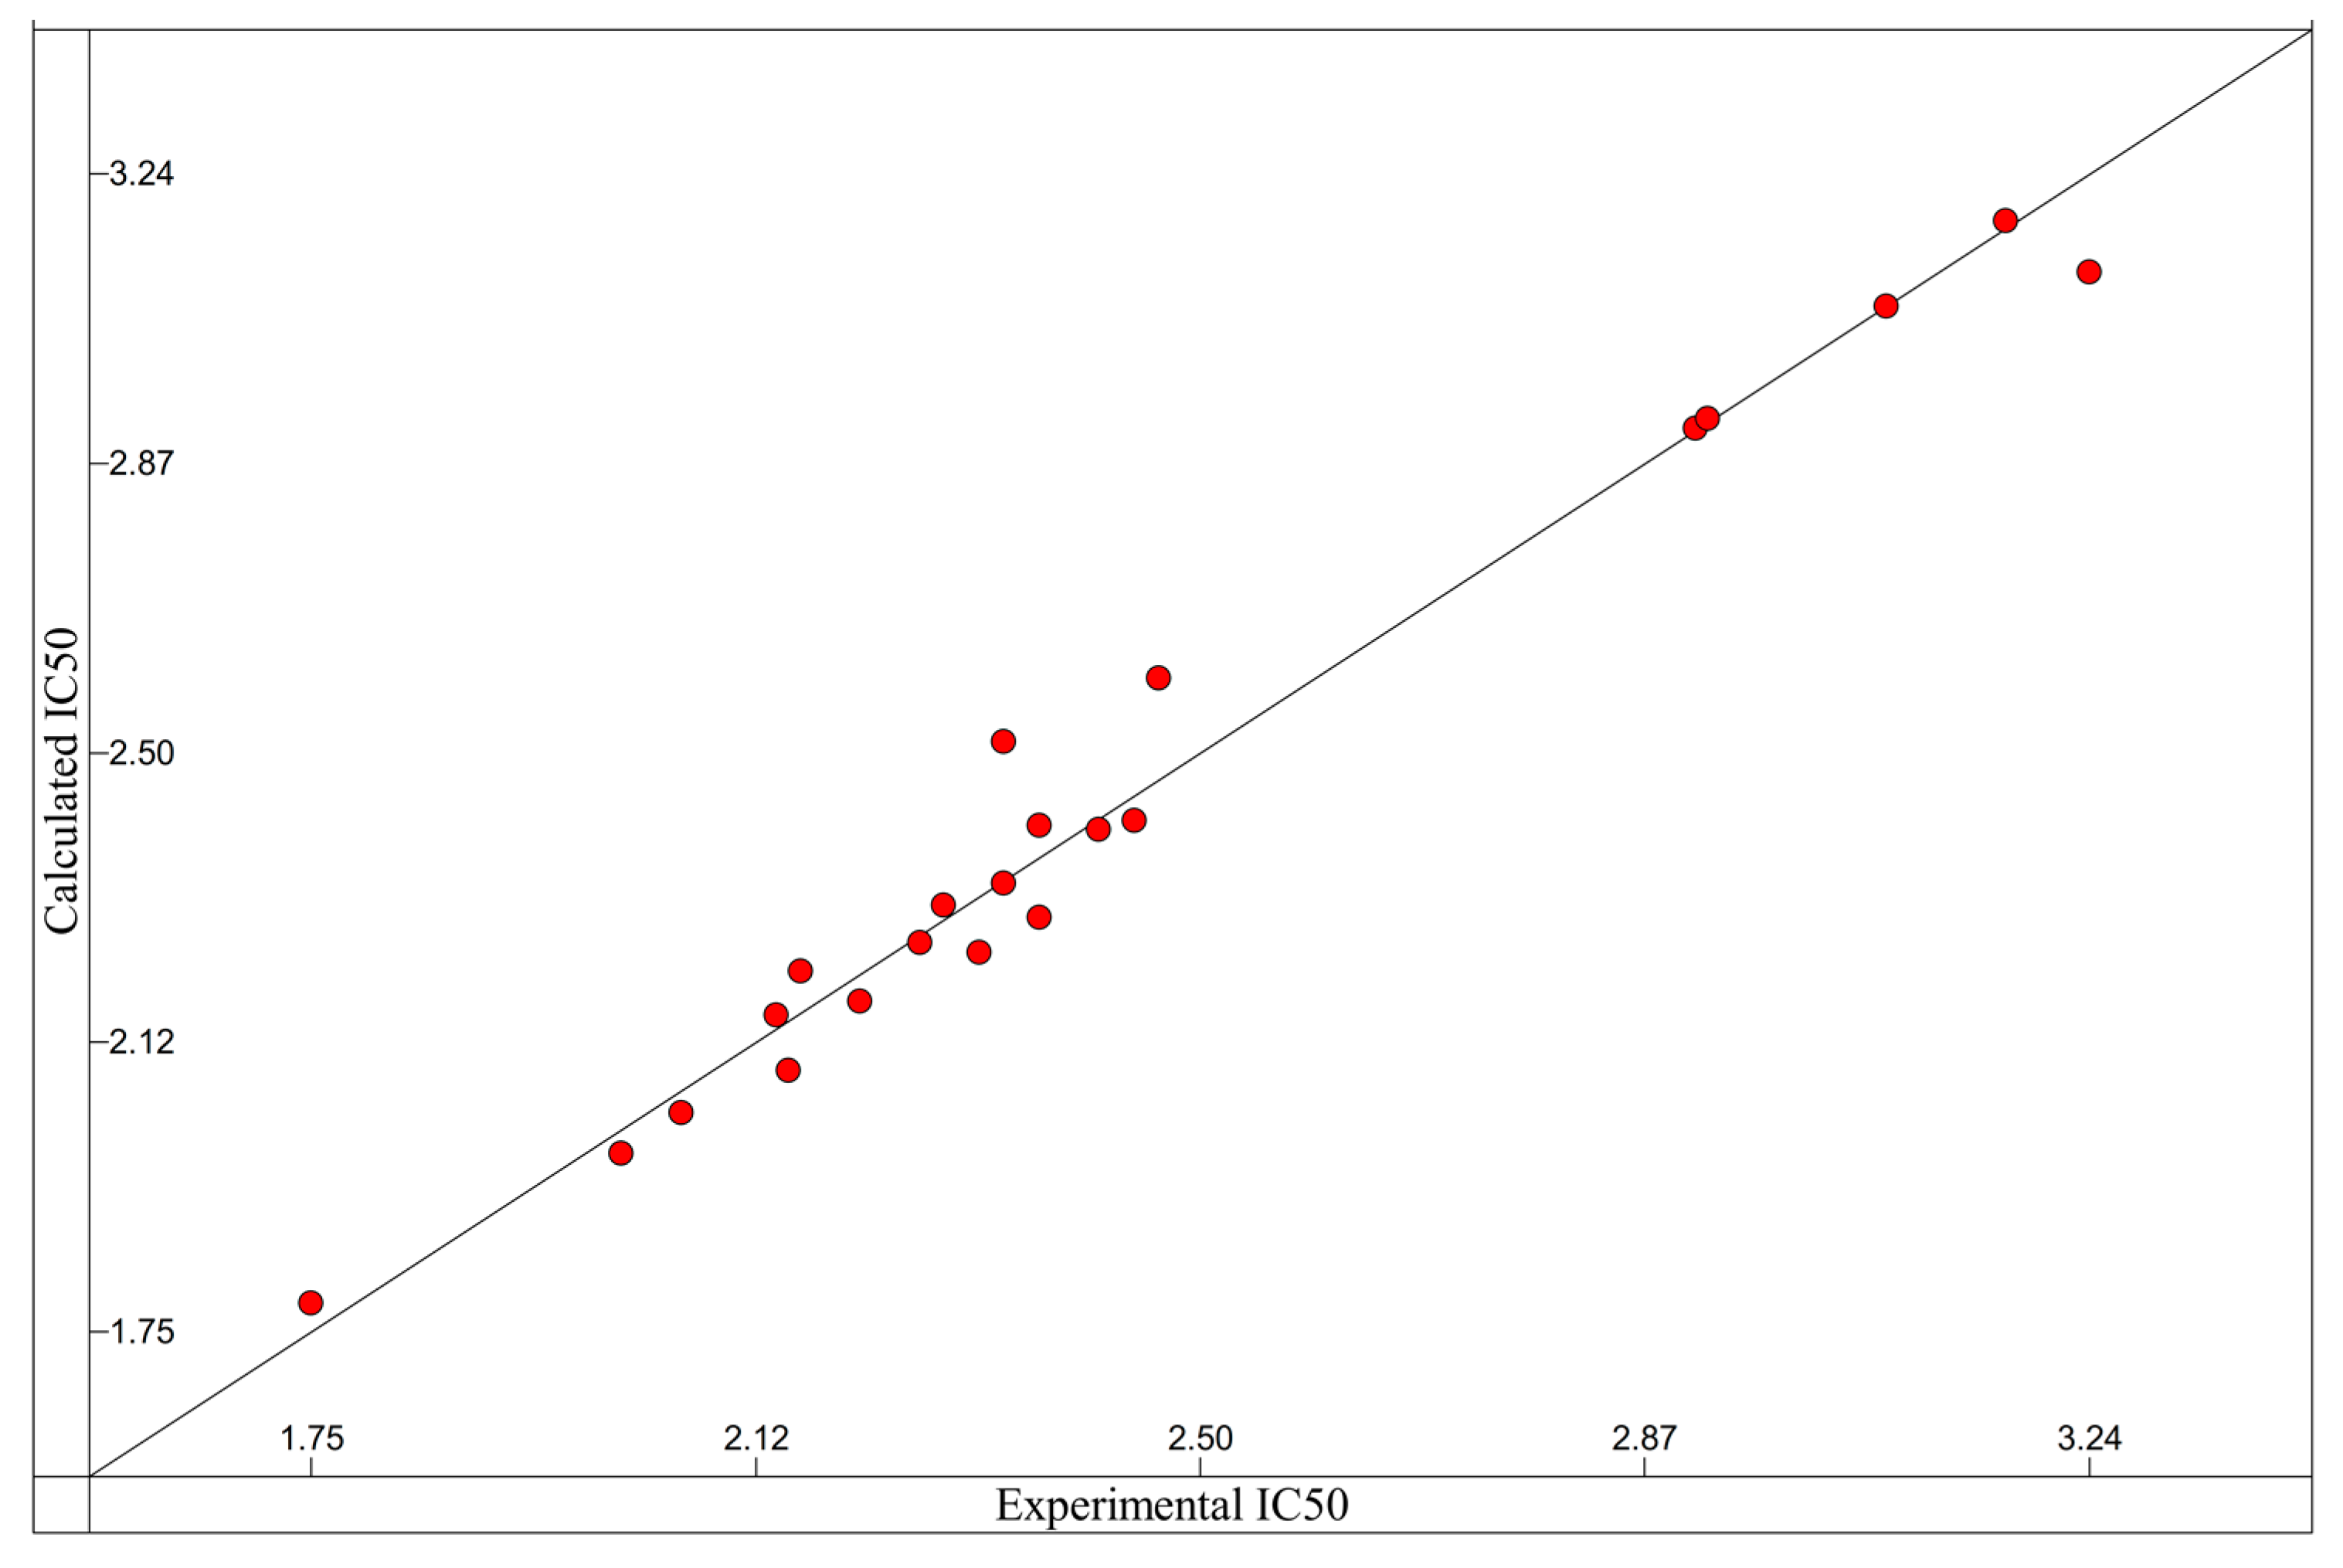
The best QSAR model was developed using four descriptors. The p value is less than 0.01 for each descriptor involved in the model generation. These descriptors were selected, as the addition of more descriptors does not lead to any significant improvement in the correlation. A plot of the experimental vs. predicted IC50 values is depicted in Figure 3 for the 20 PTs (1–5, 7, 9, 10, 13, 24).
Table 2.
The best two to twelve descriptors correlation using the (Best Multi Linear) BML method for training set data.
| Descriptor Number | Correlation Coefficient (R2) | Fisher Criteria (F) | Standard Deviation (s2) |
|---|---|---|---|
| 2 | 0.6774 | 21.13 | 0.0633 |
| 3 | 0.7992 | 19.90 | 0.0373 |
| 4 | 0.8579 | 16.80 | 0.026 |
| 5 | 0.8821 | 19.45 | 0.0167 |
| 6 | 0.9303 | 26.71 | 0.0123 |
| 7 | 0.9591 | 36.85 | 0.0065 |
| 8 | 0.9866 | 92.38 | 0.0037 |
| 9 | 0.9934 | 150.00 | 0.0021 |
| 10 | 0.9966 | 237.73 | 0.0010 |
| 11 | 0.9994 | 1020.35 | 0.0005 |
| 12 | 0.9998 | 3234.68 | 0.0002 |
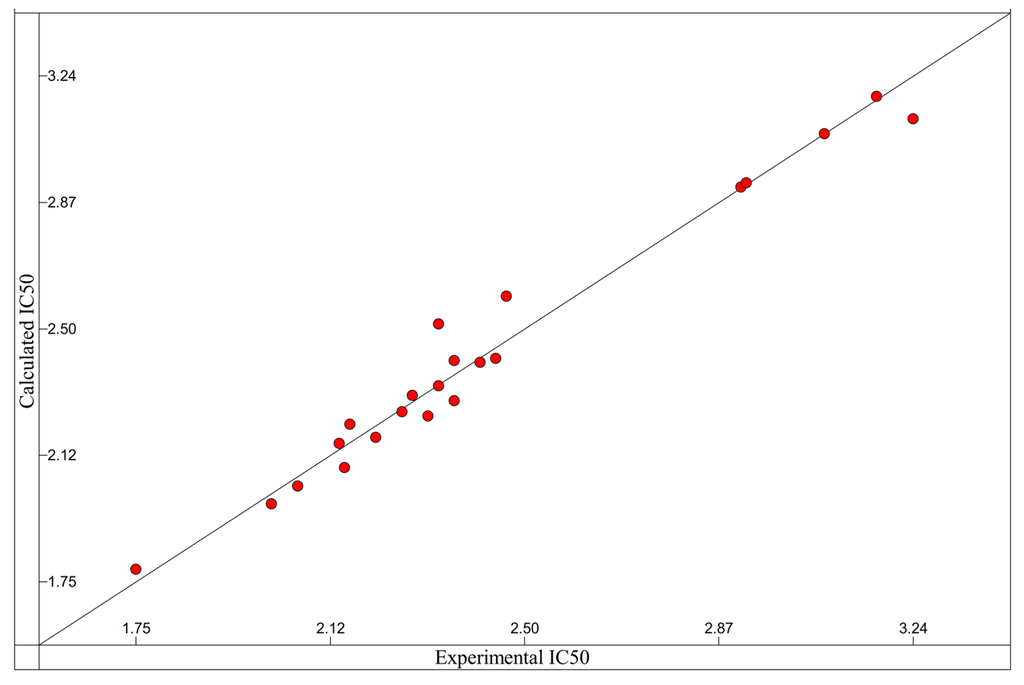
Figure 3.
Comparison of the experimental hyaluronidase activity with the activity presented by the QSAR Equation (1), n = 20, with R2 = 0.8579; s2 = 0.0246; F = 21.13; four descriptors.
Figure 3.
Comparison of the experimental hyaluronidase activity with the activity presented by the QSAR Equation (1), n = 20, with R2 = 0.8579; s2 = 0.0246; F = 21.13; four descriptors.
The QSAR equation relating the seven descriptors to the hyaluronidase inhibitory activity is given below:
Log(1/IC50) = 4.86 × 10² Qi + 1.97 × 101 Vh + 7.06 × Ec + 4.09 × 10⁻³ Enn − 1.65 × 101
n = 20, F = 21.13, s2 = 0.0246, R2 = 0.8579, R2cv = 0.7196.
The correlation coefficients (R2), cross validated correlation coefficient (R2cv), Fisher criterion values (F), regression coefficient () and standard errors for the regression coefficient (∆X) and t-test values corresponding to Equation (1) are given in Table 3. The R2 value of 0.8579 with the R2cv value of 0.7196 showed the good predictive power of the developed model.
The charge distribution-related or electronic descriptor (, ) and quantum chemical descriptor () were found to influence the activity of PTs in the QSAR equation. The t-test values indicated that the statistical significance of the selected descriptors in the QSAR model, decreased in the order: > > > .
It is known that the local electron densities or charges determine the mechanism and the rate of most chemical reactions and physico-chemical properties of compounds. The valence electrons in molecules are not fixed to any particular atom but can move around the molecule. The electrons will be more at electronegative atoms compared to electropositive ones, thus resulting in the molecules being partially negative while the others partially positive [30]. In Equation (1), two electronic descriptors were involved.
Table 3.
The best nonlinear seven descriptors selected using BML method for predicted compound (PTC) analogue training set (R2 = 0.8579, R2cv = 0.7196, F = 21.13, R2 − R2cv = 0.1383).
| Descriptor | Symbol | t-Test | X | ΔX |
|---|---|---|---|---|
| Min partial charge for a C atom (Zefirov’s PC) | 5.8487 | 4.8595 × 10² | 8.3087 × 10 | |
| Min valency of an H atom | 7.1708 | 1.9708 × 10 | 2.7483 × 100 | |
| Max bond order of a C atom | 4.3256 | 7.0647 × 100 | 1.6332 × 100 | |
| Molecular surface area | 2.4697 | 4.0917 × 10⁻³ | 1.6568 × 10⁻³ | |
| Intercept | −4.4980 | −1.6475 × 10 | 3.6628 × 100 |
Minimum partial charge for a carbon atom (Zefirov’s PC), () descriptor or partial charge is important for the ionic interactions between the drugs and its binding site on the receptors. The positive regression in the model in Equation (1) showed that the bigger the partial charge in the molecule, the higher the inhibition towards hyaluronidase.
Total molecular surface area () is a combination of the contribution of atomic partial charges to the total molecular solvent-accessible surface area. This descriptor and the minimum partial charge for a carbon atom (Zefirov’s PC) () suggest the importance of the interaction between the inhibitor molecular surface area with solvent.
Two quantum chemical descriptors were involved in the selected model. The first quantum chemical descriptor was the minimum valency of the H atom (). It describes the atomic valence state for the energies of the given atomic (H) species in the molecule and its fragments [30]. It characterizes the magnitude of the perturbation experienced by an atom in the molecular environment as compared to the isolated atom.
The maximum bond order of a C atom descriptor, , is categorized as a valency-related descriptor. This descriptor is related to the strength of the intramolecular bonding interactions and characterizes the stability, conformational flexibility and other valency-related properties of the molecules. This suggests the importance of the CO group for the interaction between the inhibitor and biological receptor.
From the predicted log IC50 values, it is clear that the QSAR equation generated through the quantum chemical method predicted that the pIC50 values were very close to the experimental values (Table 4).
Table 4.
Experimental and predicted log IC50 values of test set compounds.
| Test Set Compound | Experimental Log IC50 | Predicted Log IC50 | Differences | Percentage Differences |
|---|---|---|---|---|
| 6 | 2.01 | 1.8 | 0.2 | 8.5 |
| 8 | 2.3 | 2.1 | 0.18 | 7.5 |
| 11 | 2.9 | 2.9 | 0.05 | 1.6 |
| 19 | 3.2 | 2.5 | 0.6 | 3.9 |
2.6. Design of a New Potential Pentacylic Triterpene
After repeating for seven times in designing new compounds for this pentacylic teriterpene data set, below is the structure of the new design with the highest activity, which was indicated by the smallest pIC50 value.
Several structures have been designed continuously until Equation (1) gave the smallest value for log IC50. This new compound PTC A consist of a carboxypropionylox group, S2, a hydroxyl group at carbon-12 and a methyl group at carbon-17 which was believed to give rise to the biological activity of PTC A (Figure 4). Equation (1) provided a prediction value of pIC50 as 1.6183 for this compound, which was the smallest compared to compounds 1–23 and the other designed molecules.
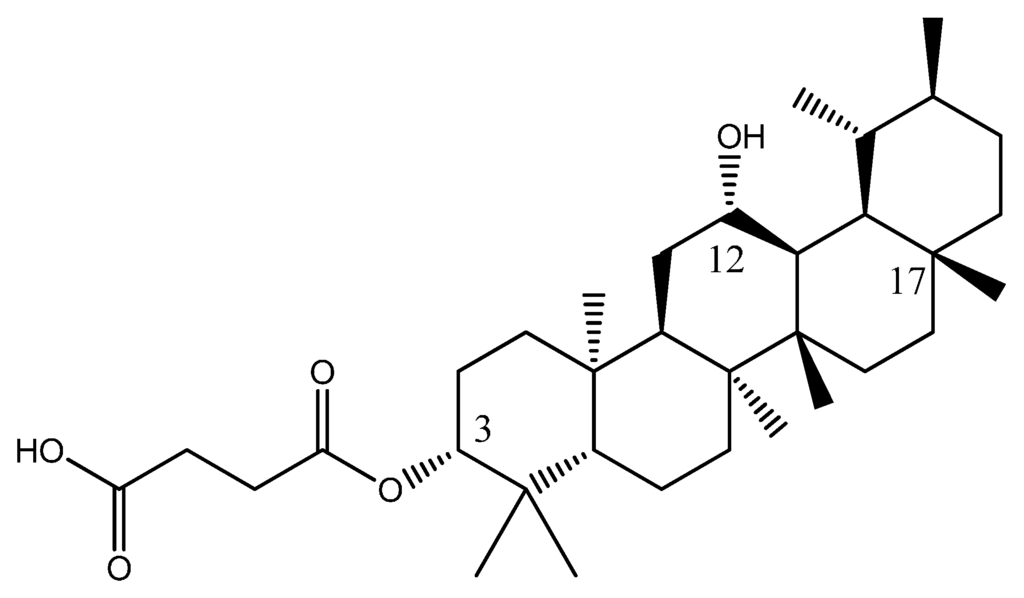
Figure 4.
Structure of new PTC A compound.
Figure 4.
Structure of new PTC A compound.

2.7. Method Validation of the Proposed Model
The most important test of the model is its ability to correctly predict the properties of other or new compounds that were not included in the QSAR model. The leave-one-out method technique is based on the difference between the squared cross-validated correlation coefficient (R2cv) and the correlation coefficient (R2) [31,32]. The corresponding R2cv for all selected models will be calculated automatically by the validation module, which was implemented in the CODESSA 2.6 package. The value of R2cv (0.7196) was found to be close to the value of R2 (0.8579). The difference was less than 0.3, which suggested good predictive ability of the selected best multi linear model [33].
The external validation is a more reliable way to establish a predictive QSAR model [34]. The correlation coefficient prediction (R2pred), which was based only on the molecules present in the test set, should be more than 0.5. The value of R2pred for the training set of this model was 0.5831, which was more than 0.5.
2.8. Possible Interactions from an in Silico Molecular Docking Study
Molecular docking study was used to clarify the binding mode and identify the interaction of inhibitors with our targeting protein, human hyaluronidase. The flexible docking result with AutoDock Vina indicated that compound 22 was more active than apigenin with the negative binding affinities range of −8.5 to −7.6, where those of apigenin was in the range of −7.8 to −7.2. The lower (negative) number indicated the stronger binding of the compound with the protein receptor. The selected docked complex was further minimized and visualized for their interactions with CHARMM force field against hyaluronidase in Discovery Studio in Figure 5. In the representation, apigenin and compound 22 in orange, and green, respectively, were superimposed to compare their interactions. A close view of the interactions has been depicted, whereas the orange and green dotted lines represented the pi–pi interactions and hydrogen bonds. The details of the van der Waals (VDW), electrostatic, binding interaction (BI) with amino acids within 4 Å vicinity of the compound and total interaction energy (IE) value are tabulated in Table 5. All the results from binding affinity with AutoDock Vina, BI with amino acid residues within 4 Å, and IE using CHARMM forcefield are in agreement with the experimental results and confirmed the stronger inhibition of compound 22 against hyaluronidase than apigenin. The residues with strong interaction energy below −4 kcal/mol for apigenin are TYR75, TRP321, SER323, TRP324, THR327, where more residue interactions with ASN61, PRO62, TYR75, SER77, GLN78, TYR84, ASP129, TRP321, TRP324 for 22 are found. Apigenin did not bind well with one of the reported binding sites. ASP129, however, the π–π interaction between apigenin with TYR75 and no hydrogen bonding were observed. Compound 22 forms two hydrogen bonding interactions with SER77 and GLY63 (SER77:HG-22:O45 and 22:H50-GLY63:O). Compound 22 bound stronger, about 50.16 kcal/mol (−191.07 to −140.91) from the total interaction energy. Detailed on the binding interaction within 4 Å from the compound is also supported at the lower BE of −88.81 and −32.09 kcal/mol for compound 22 and apigenin, respectively. The contribution of the stronger interaction of compound 22 mainly comes from the electrostatic interaction (−57.15) rather than van der Waals (−31.66 kcal/mol).

Figure 5.
Superimposed the complex structures of apigenin and 22 with human hyaluronidase (left). The interactions with residues interaction energy below −4 kcal/mol of apigenin (right, top) and 22 (right, bottom) with human hyaluronidase were illustrated. The π–π and hydrogen bonding interaction are depicted in orange and green dashed, respectively.
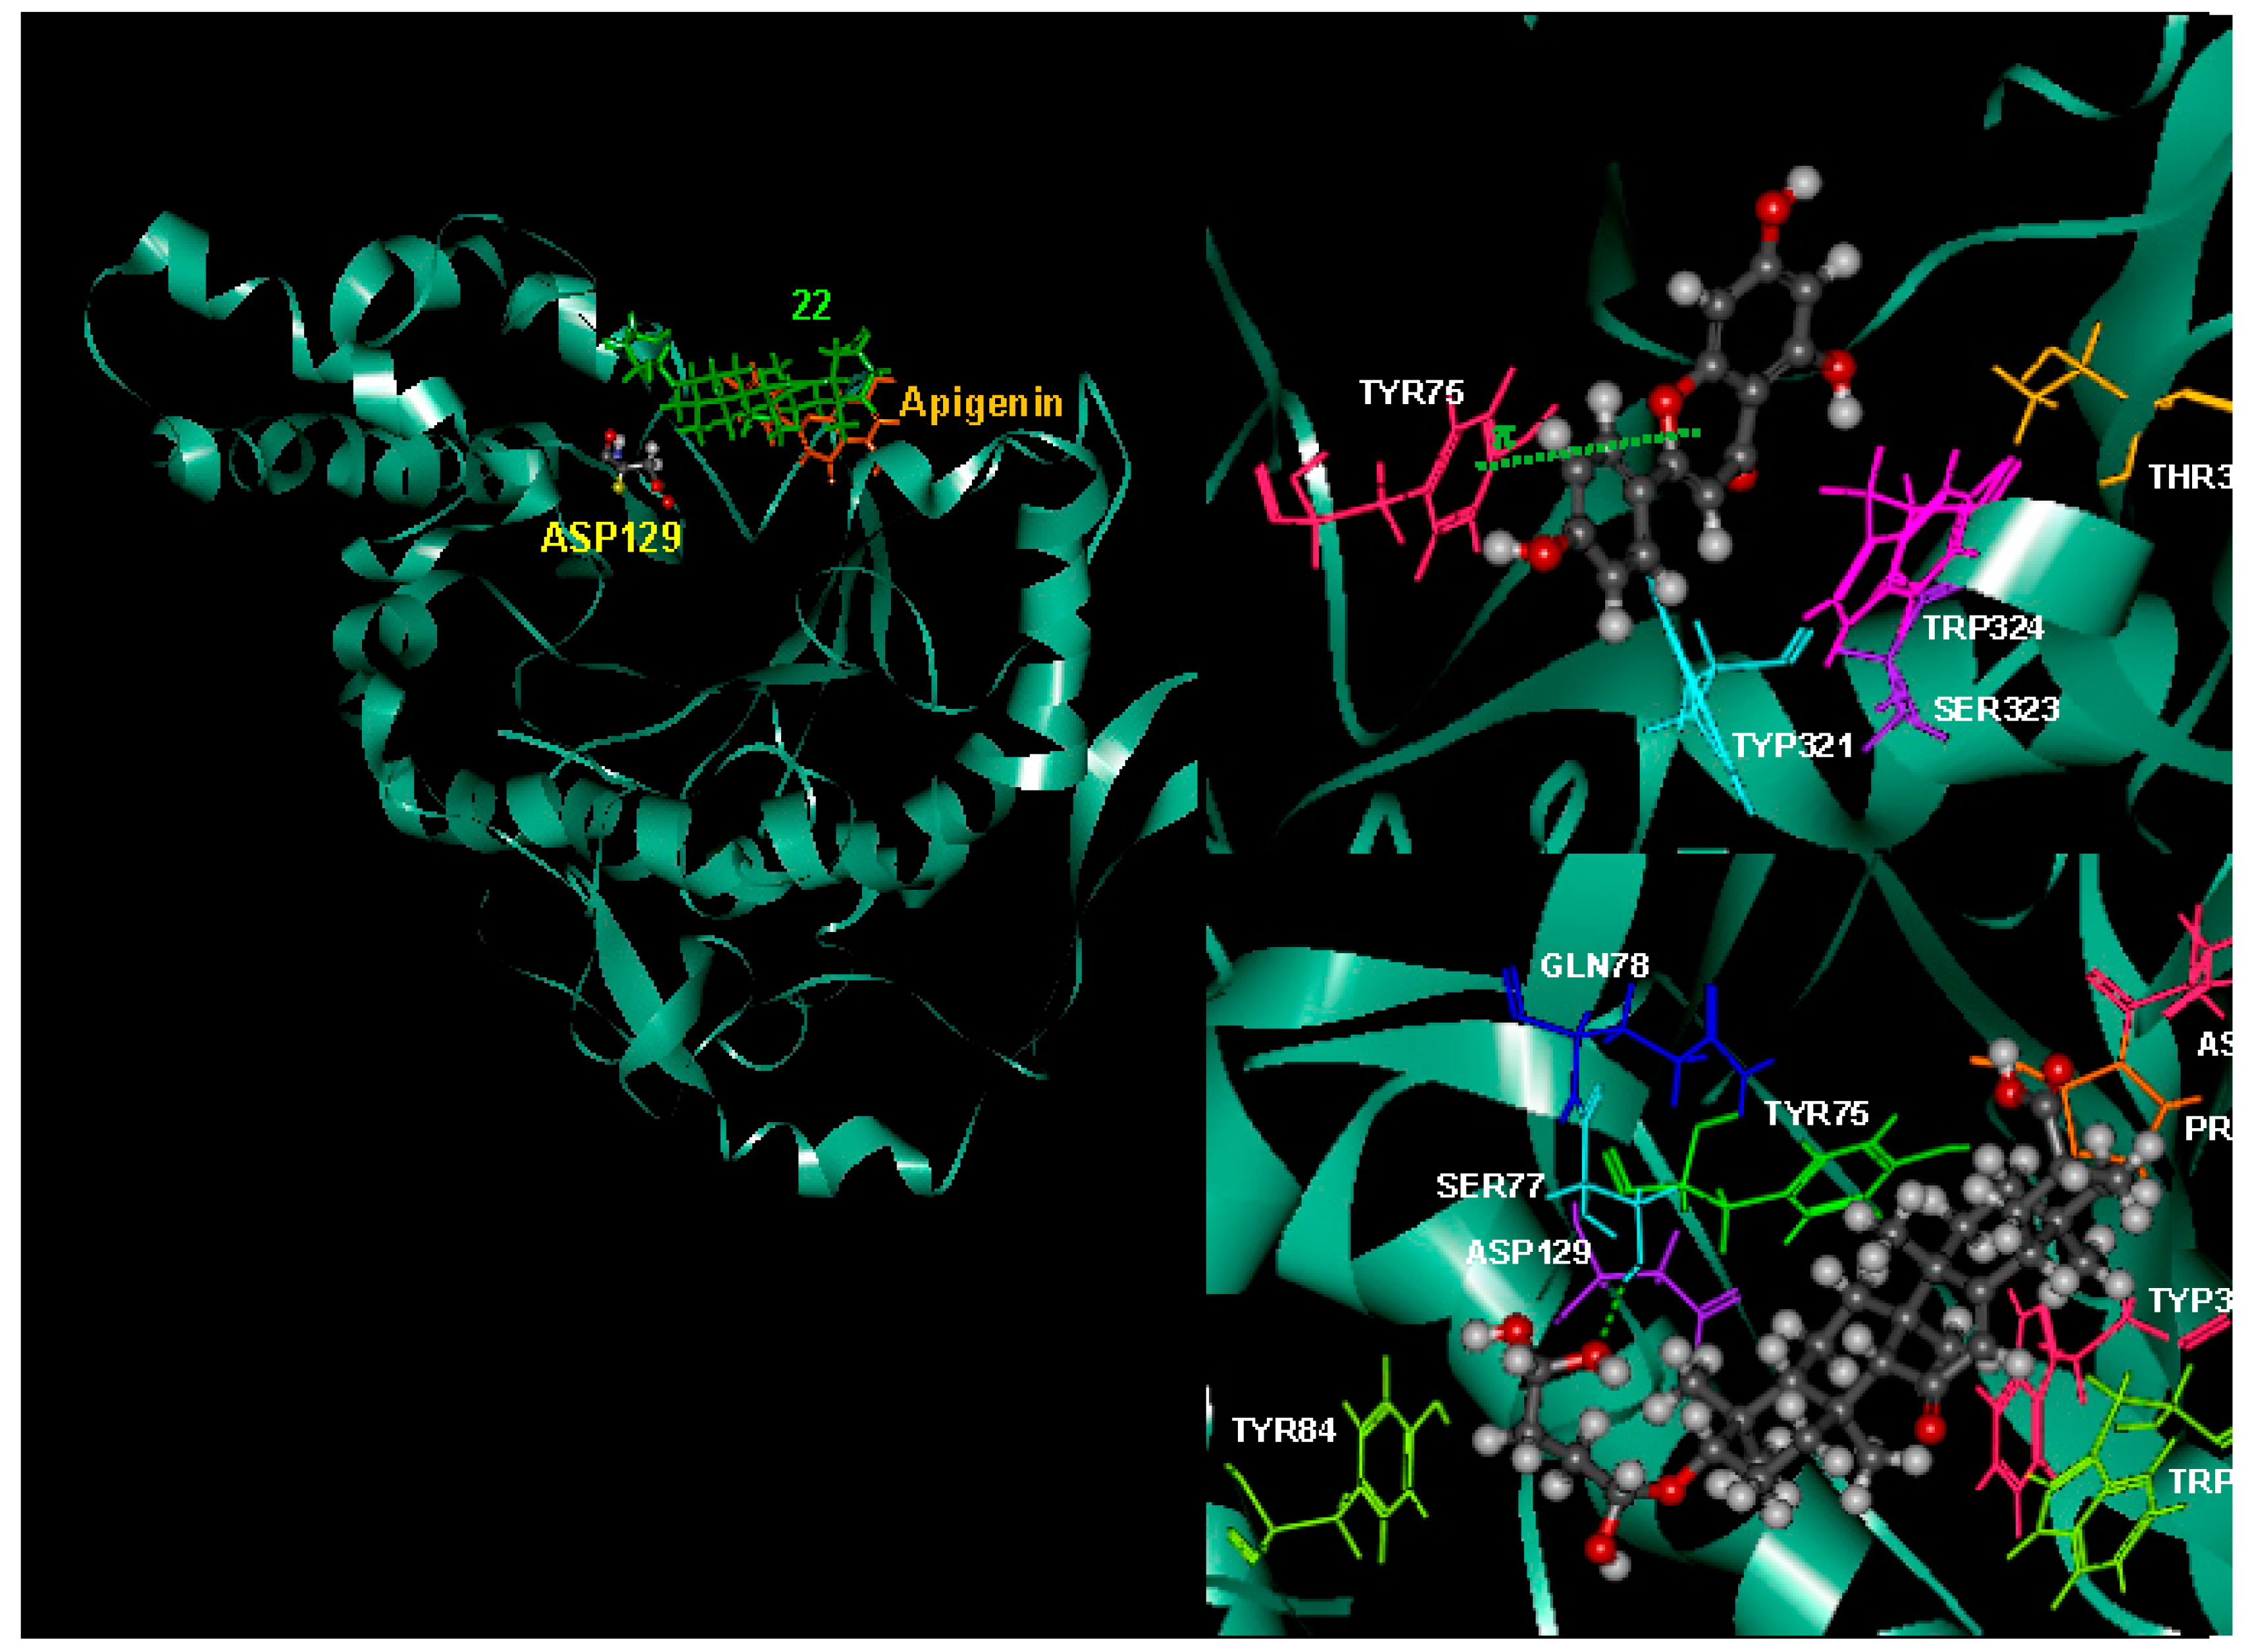
Table 5.
Contribution of the interaction energy in kcal/mol of human hyaluronidase binding residues in the 4 Å from apigenin and 22. Residues with strong interaction energy below −4 kcal/mol are highlighted.
| Residue | Interaction Energy (IE) | VDW | Electrostatic | Residue | Interaction Energy (IE) | VDW | Electrostatic |
|---|---|---|---|---|---|---|---|
| Apigenin | 22 | ||||||
| ALA38 | −1.03 | −0.64 | −0.39 | ASN39 | −1.81 | −0.77 | −1.04 |
| ASN39 | −1.57 | −2.05 | 0.48 | ASN61 | −5.72 | −0.56 | −5.16 |
| PRO62 | −2.93 | −2.23 | −0.71 | PRO62 | −4.00 | −2.89 | −1.11 |
| GLY63 | −1.34 | −1.94 | 0.60 | GLY63 | −2.94 | −1.94 | −1.00 |
| TYR75 | −4.22 | −4.04 | −0.18 | TYR75 | −15.15 | −6.08 | −9.07 |
| SER77 | −0.69 | −0.37 | −0.32 | SER76 | −3.83 | −2.84 | −1.00 |
| TRP321 | −4.33 | −1.51 | −2.82 | SER77 | −9.99 | −2.00 | −7.99 |
| VAL322 | 0.60 | −0.44 | 1.04 | GLN78 | −4.95 | −0.52 | −4.43 |
| SER323 | −4.57 | −0.69 | −3.88 | TYR82 | −2.31 | −0.72 | −1.59 |
| TRP324 | −7.40 | −3.80 | −3.60 | TYR84 | −5.56 | −3.08 | −2.48 |
| THR327 | −4.61 | −0.53 | −4.07 | ASP129 | −10.36 | −0.86 | −9.50 |
| GLU131 | −2.55 | −2.34 | −0.21 | ||||
| TRP321 | −8.18 | −1.51 | −6.67 | ||||
| TRP324 | −11.45 | −5.56 | −5.89 | ||||
| BE in 4 Å | −32.09 | −18.24 | −13.85 | BE in 4 Å | −88.81 | −31.66 | −57.15 |
| Total IE | −140.91 | −23.62 | −117.28 | Total IE | −191.07 | −39.23 | −151.84 |
3. Materials and Methods
3.1. Chemicals and Instruments
All chemicals were obtained from commercial sources (Aldrich, Merk, and Sigma, Darmstadt, Germany) and used without further purification. Solvents were used without further purification or drying, unless stated otherwise. Reactions and isolations were monitored using thin layer chromatography (TLC) (aluminum supported silica gel 60 F254 plates were used for TLC). TLC spots were visualized under ultra-violet light (254 and 365 nm). The plates were then sprayed with 10% sulphuric acid followed by heating using a hot plate to detect the presence of phenolics and terpenes, which were indicated by the presence of colourful spots. Several packing materials were used for column chromatography i.e., MCI gel CHP 20P, Sephadex LH-20, Chromatorex ODS, silica gel 60 (70–230 Mesh ASTM or equivalent to silica gel of size 0.063–0.200 mm). The infrared spectra were recorded on a Perkin Elmer Spectrum 100 Fourier Transform Infrared (FT-IR) spectrometer (Perkin Elmer, Waltham, MA, USA) equipped with a mid-infrared deuterated triglycine sulphate (DTGS) detector. NMR analyses were carried out on a Bruker DRX 300 NMR spectrometer (300 MHz for 1H NMR and 75 MHz for 13C NMR, Bruker corporation, Billerica, MA, USA) system with deuterated pyridine (C5D5N). The mass spectra were obtained using an LTQ Orbitrap Mass spectrometer (Thermo Fisher Scientific, Bremen, Germany) equipped with an electrospray ionization probe by employing either a negative or positive ion mode, whichever could afford the best limits of detection for the compounds.
3.2. Plant Material
P. tetrandra was collected from Setiu, Terengganu on the 29 January 2006 and was deposited in the herbarium of the Forest Research Institute Malaysia (FRIM) with a herbarium specimen number of FRI 50080. The sample was identified by an FRIM botanist. The plant material was dried in an oven at 40 °C, divided into different parts and ground.
3.3. Extraction and Isolation
Oven-dried leaves (2.041 kg) were ground and extracted with 5 L of methanol (MeOH) by soaking three times at room temperature. The concentrated extract (20.1 g) was suspended in H2O (14 L) and partitioned with petroleum ether (5 L, 3×) followed by chloroform (CHCl3) (5 L, 3×) and finally with ethyl acetate (EtOAc) (5 L, 3×). The CHCl3 layer (15.1 g) obtained was concentrated and chromatographed over a Diaion HP-20SS column using 100% MeOH to afford three fractions. Fractions 1 and 2 were combined and purified using a silica gel column eluting with a CHCl3-MeOH (CM) eluent system, to afford 3β,19,23-trihydroxyurs-12-en-28-oic acid 2 (20 mg, 96:4 v/v). Fraction 3 was also further fractionated and purified using silica gel column chromatography eluting with a CHCl3-MeOH (CM) eluent system to give 3β-hydroxyurs-12-en-28-oic acid (ursolic acid) 1 (1.5 g 98:2 v/v).
Sub-fraction C3 (2.79 g), which highly inhibited the activity of the hyaluronidase enzyme was further fractionated and purified using silica gel column chromatography (chloroform: methanol; 10:0 → 9:1 v/v) to give eight sub-fractions (C3-1 to C3-8). Sub-fraction 6 (C3-6) exhibited the highest inhibition against the hyaluronidase enzyme and TPA induced mouse ear oedema activity. Column chromatography of this fraction with chloroform: methanol (98:2 v/v) yielded 3β-hydroxyurs-12-en-28-oic acid (ursolic acid) 1 (1.5 g, 98:2).
The cut and oven-dried roots (2.2 kg) were ground and extracted with 5 L of MeOH by soaking three times at room temperature. The concentrated extract (100 g) was suspended in H2O and partitioned with EtOAc (5 L, 3×). The EtOAc layer after drying under reduced pressure (15.6 g) was chromatographed over silica gel and eluted using petroleum ether with increasing amounts of acetone to give eight fractions. Fraction 3 was further fractionated and purified by a silica gel column eluting with a hexane-CHCl3 eluent system to afford 3β-acetylolean-12-en-28-oic acid 3 (20 mg, 100:0 v/v).
3β-Urs-12-en-28-oic acid 1 1.5 g, 1H NMR (300 MHz, C5D5N): δ (ppm) 0.95 (1H, m, H-1α), 1.30 (1H, m, H-1β), 1.80 (2H, m, H-2), 3.50 (1H, brt, J = 8.5 Hz, H-3), 1.10 (1H, m, H-5), 1.50 (2H, m, H-6), 1.60 (2H, m, H-7), 1.55 (1H, m, H-9), 1.90 (2H, m, H-11), 5.54 (1H, s, H-12), 1.15, 2.30 (2H, m, H-15), 2.19 (2H, dt, J = 4.4, 8.6 Hz, H-16), 2.68 (1H, d, J = 11.8 Hz, H-18), 1.25 (1H, m, H-19), 1.00 (1H, m, H-20), 1.50 (2H, m, H-21), 1.75 (2H, m, H-22), 1.25 (3H, s, H-23), 1.04 (3H, s, H-24), 0.90 (3H, s, H-25), 1.08 (3H, s, H-26), 1.28 (3H, s, H-27), 1.03 (3H, d, J = 4.8 Hz, H-29), 0.99 (3H, d, J = 5.2 Hz, H-30). 13C NMR (75 MHz, C5D5N): δ (ppm) 38.9, 28.4, 77.7, 39.3, 55.6, 18.5, 33.3, 39.8, 47.9, 37.2, 23.4, 125.5, 139.1, 42.3, 27.8, 24.7, 47.9, 53.3, 39.2, 39.2, 30.8, 37.0, 28.6, 16.4, 15.5, 17.2, 23.7, 180.0, 17.3, 21.2.
3α,19α,24-Trihydroxyurs-12-en-28-oic acid 2 20.0 mg, 1H NMR (300 MHz, C5D5N): δ (ppm): 1.35 (1H, m, H-1), 1.8 (2H, m, H2), 4.50 (1H, bs, H-3), 1.80 (1H, m, H-5), 1.75 (1H, m, H-6), 1.2 (1H, m, H-7), 1.4 (1H, m, H-9), 2.2 (1H, m, H-11), 5.64 (1H, s, H-12), 2.14 (1H, m, H-15), 3.14 (2H, dt, J = 12.6, 4.0 Hz, H-16), 3.02 (1H, s, H-18), 2.3 (1H, m, H-20), 2.1 (2H, m, H-21), 2.5 (2H, m, H-22), 1.65 (3H, s, H-23), 4.13 (1H, d, J = 10.8 Hz, H-24), 3.84 (1H, d, J = 10.8 Hz, H-24), 1.0 (3H, s, H-25), 1.14 (3H, s, H-26), 1.68 (3H, s, H-27), 1.46 (3H, s, H-29), 1.16 (3H, d, J = 9.6 Hz, H-30). 13C NMR (75 MHz, C5D5N): δ (ppm) 33.8, 26.7, 69.7, 43.7, 48.1, 18.9, 33.6, 41.8, 47.5, 37.2, 24.0, 128.0, 139.7, 40.3, 29.05, 26.2, 47.5, 54.4, 72.5, 42.2, 26.2, 38.3, 23.4, 65.5, 15.8, 16.9, 24.4, 180.6, 26.9, 16.6.
3β-Acetylolean-12-en-28-oic acid 3 20 mg, 1H NMR (300 MHz, C5D5N): δ (ppm): 1.50, 1.15 (2H, m, H-1), 1.45 (2H, m, H-2), 4.73 (1H, dd, J = 5.0, 11.1 Hz), 1.00 (1H, m, H-5), 1.50 (1H, m, H-6), 1.65 (1H, m, H-7), 1.20 (1H, m, H-9), 1.85 (2H, m, H-11) , 5.5 (1H, bs, H-12), 1.40 (2H, m, H-15), 2.10 (1H, m, H-16β), 1.90 (1H, m, H-16α), 3.35 (1H, dd, J = 4.6, 13.3 Hz, H-18), 1.91 (2H, m, H-19), 1.50 (2H, m, H-21), 1.90 (2H, m, H-22), 0.94 (3H, s, H-23), 0.86 (3H, s, H-24), 0.91 (3H, s, H-25), 0.97 (3H, s, H-26), 1.30 (3H, s, H-27), 1.02 (3H, s, H-29), 1.04 (3H, s, H-30), 2.07 (3H, s, COCH3). 13C NMR (75 MHz, C5D5N): δ (ppm) 38.0, 23.5, 80.5, 37.6, 55.3, 18.2, 33.0, 39.4, 47.6, 36.9, 23.4, 123.6, 139.0, 41.7, 28.0, 23.6, 46.2, 41.0, 46.4, 30.7, 33.9, 32.8, 27.9, 16.7, 15.1, 17.1, 25.9, 180.1, 33.0, 23.5, 20.9, 170.5.
3.4. Synthesis of Ursolic Acid Analogues
Ursolic acid 1 was selected as the lead compound and seven derivatives 4–10 were prepared from the semisynthesis of it. The modification methods were carried out as described by Ma et al. [16], with a slight modification in the solvents and reagents used. The reaction scheme used for the synthesis of the ursolic acid 1 derivatives is shown in Figure 1.
3.4.1. 3-Oxo-urs-12-en-28-oic Acid (4)
Pyridinium chlochromate (PCC) (161.3 mg, 0.75 mmol) was added to a solution of ursolic acid 1 (112.3 mg, 0.25 mmol) in a acetone-dicholoromethane (5:5, 10 mL) mixture. After stirring at room temperature until the reaction was almost complete (monitored with TLC), the mixture was concentrated and partitioned with H2O and CH2Cl2. The CH2Cl2 layer was concentrated and purified by silica gel column chromatography eluting with hexane: acetone (95:5 v/v) to give 4 Yield 79.34%, white amorphous powder.
1H NMR (300 MHz, C5D5N): δ (ppm) 5.60 (1H, bs, H-12), 2.15 (2H, dt, J = 4.4, 8.6 Hz, H-16), 2.75 (1H, d, J = 11.8 Hz, H-18), 1.04 (3H, s, H-23), 0.99 (3H, s, H-24), 0.90 (3H, s, H-25), 1.02 (3H, s, H-26), 1.16 (3H, s, H-27), 1.22 (3H, s, H-29), 1.00 (3H, s, H-30). 13C NMR (75 MHz, C5D5N): δ (ppm) 38.7, 28.0, 218.0, 47.5, 54.7, 19.2, 33.7, 39.2, 46.5, 36.8, 23.3, 126.0, 140.0, 41.9, 30.4, 24.2, 46.1, 53.0, 38.9, 38.8, 32.3, 36.2, 26.1, 16.9, 14.5, 16.7, 23.3, 182.0, 20.8, 21.0.
3.4.2. 3-Hydroxyimino-urs-12-en-28-oic Acid (5)
A solution of 4 (26.2 mg, 0.34 mmol) and hydroxylamine hydrocholoride (27.6 mg, 0.40 mmol) in pyridine (5 mL) was heated for four hours at 50 °C. After cooling to room temperature, the reaction mixture was concentrated under vacuum to dryness. It was then purified over a silica gel column eluted with petroleum ether: CHCl3 (95:5 v/v) to obtain 5 Yield 90%, colorless crystal.
1H NMR (300 MHz, C5D5N): δ (ppm) 3.5 (2H, bd, J = 15.5 Hz), 2.6 (bd, J = 11.25 Hz, H-2), 5.50 (1H, bs, H-12), 2.30 (1H, m, H-18), 1.08 (3H, s, H-23), 0.92 (3H, s, H-24), 0.91 (3H, s, H-25), 0.98 (3H, s, H-26), 1.20, (3H, s, H-27), 1.40 (3H, s, H-29), 0.96 (3H, s, H-30). 13C NMR (75 MHz, C5D5N): δ (ppm) 38.9, 28.8, 164.4, 40.1, 56.4, 19.5, 33.4, 40.3, 47.6, 37.6, 23.8, 125.7, 139.4, 42.7, 25.0, 48.2, 53.7, 37.4, 39.6, 31.2, 37.4, 28.2, 21.6, 15.2, 17.5, 23.9, 180.2, 21.6, 17.7.
3.4.3. 3-Acetyl-urs-12-en-28-oic Acid (6)
Ursolic acid 1 (120.0 mg, 0.26 mmol) was treated overnight with acetic anhydride (534.0 mg, 5.32 mmol) and pyridine at room temperature and worked up with 10% HCl, NaHCO3, followed by separation using a separating funnel to get the CH2Cl2 layer. MgSO4 was added to absorb water from it. The solution was filtered and rinsed using CH2Cl2. It was purified over a silica gel column eluted using chloroform: petroleum ether (90:10 v/v) to give 6. Yield 50%, white amorphous powder.
1H NMR (300 MHz, C5D5N): δ (ppm) 4.6 (1H, dd, J = 5.06, 10.9 Hz, H-3), 5.45 (1H, bs, H-12), 2.24 (2H, m, H-16), 2.65 (1H, d, J = 11.1 Hz, H-18), 1.06 (3H, s, H-23), 0.91 (3H, s, H-24), 0.88 (3H, s, H-25), 0.99 (3H, s, H-26), 1.08 (3H, s, H-27), 1.23 (3H, s, H-29), 0.95 (3H, s, H-30), 2.09 (3H, s, COCH3). 13C NMR (75 MHz, C5D5N): δ (ppm) 38.8, 28.0, 79.1, 41.8, 54.9, 17.9, 36.5, 38.9, 47.4, 36.8, 22.9, 124.8, 138.6, 41.9, 32.7, 24.3, 47.2, 52.9, 37.8, 39.3, 30.5, 37.3, 27.6, 16.4, 15.0, 16.9, 23.3, 179.3, 16.8, 20.6, 20.9, 169.9.
3.4.4. 3-Hydroxy-urs-12-en-28-oic Acid Methyl Ester (9)
To a stirred solution of ursolic acid 1 (10.0 mg, 0.02 mmol) in approximately 10 mL of toluene: MeOH (3:2), a solution of TMSCHN2 (trimethylsilane diazomethane) in hexane was added drop wise until the yellow color persisted. The mixture was stirred at room temperature and concentrated. It was purified over a silica gel column with hexane: CHCl3 (70:30 v/v) as the eluent to give 9. Yield 95%, white amorphous powder.
1H NMR (300 MHz, C5D5N): δ (ppm) 3.51 (1H, brt, H-3), 2.62 (1H, d, J = 13.11 Hz, H-18), 1.10 (3H, s, H-23), 0.99 (3H, s, H-24), 0.92 (3H, s, H-25), 0.98 (3H, s, H-26), 1.00 (3H, s, H-27), 1.30 (3H, s, H-29), 1.20 (3H, s, H-30), 3.75 (3H, s, COOCH3). 13C NMR (75 MHz, C5D5N): δ (ppm) 39.8, 28.8, 78.0, 39.0, 55.7, 18.7, 33.3, 39.6, 47.9, 37.3, 24.5, 125.9, 138.7, 42.2, 28.7, 23.3, 51.4, 53.3, 39.3, 39.2, 30.7, 36.9, 28.1, 16.5, 15.6, 17.2, 22.9, 177.7, 21.2, 17.3.
3.4.5. 3-Oxo-urs-12-en-28-oic Acid Methyl Ester (7)
Methyl ursolate 9 was treated with PCC in the same manner as was carried out for compound 4 to obtain compound 7. The resultant was purified over a silica gel column eluted with chloroform: petroleum ether (90:10 v/v). Yield 90%, colorless crystal.
1H NMR (300 MHz, C5D5N) δ (ppm): 5.42 (1H, s, H-12), 2.49 (1H, d, J = 10.8 Hz, H-18), 0.98 (3H, s, H-23), 0.97 (3H, s, H-24), 0.90 (3H, s, H-25), 1.13 (3H, s, H-26), 1.24 (3H, s, H-27), 1.26 (3H, s, H-29), 0.96 (3H, s, H-30), 3.75 (3H, s, COOCH3). 13C NMR (75 MHz, C5D5N): δ (ppm) 39.9, 28.5, 216.3, 48.4, 55.4, 21.3, 34.5, 47.1, 42.5, 37.1, 24.6, 125.8, 138.9, 42.5, 26.8, 23.7, 47.5, 53.5, 39.4, 39.3, 32.8, 36.9, 30.9, 17.2, 15.3, 17.4, 48.7, 177.8, 19.9, 21.7, 23.9.
3.4.6. 3-Hydroxyimino-urs-12-en-28-oic Acid Methyl Ester (8)
A solution of 7 (80.0 mg, 0.17 mmol) and hydroxylamine hydrochloride (108.0 mg, 1.56 mmol) in pyridine was heated for 2 h at 50 °C. It was then cooled to room temperature and diluted with CH2Cl2 followed by washing with 10% HCl (3×). It was then dried over anhydrous Na2SO4 and concentrated under reduced pressure. It was purified over a silica gel column using CHCl3: hexane (40:60 v/v) as the eluent to give 8 Yield 95%, white amorphous powder.
1H NMR (300 MHz, C5D5N): δ (ppm) 3.50 (1H, d, J = 15.58 Hz, H-2β), 2.25 (1H, m, H-2α), 5.35 (1H, s, H-12), 2.30 (2H, m, H-16), 2.42 (1H, d, J = 10.8 Hz, H-18), 0.97 (3H, s, H-23), 0.90 (3H, s, H-24), 0.85 (3H, s, H-25), 1.12, (3H, s, H-26), 1.10 (3H, s, H-27), 1.41 (3H, s, H-29), 0.92 (3H, s, H-30), 3.68 (3H, s, COOCH3), 12.36 (1H, s, NOH). 13C NMR (75 MHz, C5D5N): δ (ppm) 39.3, 24.7, 164.2, 38.9, 56.4, 19.4, 33.2, 39.4, 47.5, 37.1, 23.7, 126.0, 138.9, 42.5, 28.5, 24.7, 48.4, 53.5, 40.0, 40.3, 30.9, 37.3, 28.1, 17.4, 15.2, 17.5, 23.9, 177, 51.6, 21.4, 17.0.
3.4.7. 3-Acetyl-urs-12-en-28-oic Acid Methyl Ester (10)
Compound 9 was treated with TMSCHN2 using the similar method, which was used for the preparation of 9 to give 10. Yield 95%, colorless crystal.
1H NMR (300 MHz, C5D5N): δ (ppm) 4.75 (1H, dd, J = 5.4, 10.8 Hz, H-3), 5.41 (1H, s, H-12), 2.49 (1H, d, J = 11.1 Hz, H-16), 1.02 (3H, s, H-23), 0.98 (3H, s, H-24), 0.94 (3H, s, H-25), 1.00 (3H, s, H-26), 1.04 (3H, s, H-27), 1.20 (3H, s, H-29), 0.96 (3H, s, H-30), 2.09 (3H, s, COCH3), 3.74 (3H, s, COOCH3). 13C NMR (75 MHz, C5D5N): δ (ppm) 38.4, 28.5, 80.8, 39.3, 55.6, 18.5, 33.3, 38.0, 47.8, 38.0, 23.0, 125.8, 138.8, 39.3, 28.5, 24.7, 51.6, 53.4, 42.4, 39.9, 30.9, 37.1, 28.3, 17.1, 15.6, 17.2, 24.0, 177.8, 17.4, 21.2, 170.7, 21.4, 24.0.
3.5. Hyaluronidase Inhibitory Assay
The assay was performed following the modified Sigma protocol [27].
3.6. Construction of a QSAR Model
All the molecular structures were built by the Chem3D Ultra package, and the structures were optimized using the MM2 force field. The lowest energy conformations obtained by molecular mechanics calculations were optimized by the quantum chemical semi empirical RM1 (Recife Model 1) method [35]. The RM1 method was selected for our calculations because the average errors in the prediction of enthalpies of formation, dipole moments, ionization potentials, and inter atomic distances, using the RM1 methods were found to be less than the average errors given by AM1, PM3 and PM5 methods. The MOPAC program [36] was used to do semi empirical molecular orbital calculations, by passing the RM1 parameters via the keyword EXTERNAL in MOPAC along the keyword AM1. The optimized structures were found to be in good agreement with the available crystal structure of 10 reported earlier [37].
An input file, which contained the data obtained from self-consistent field (SCF), thermodynamics, force and molecular structure calculations for each structure together with the activity value (log IC50) was prepared. All the data files were loaded into the CODESSA 2.6 for further calculation of topological, conventional, geometrical, electrostatic, quantum chemical and thermodynamic descriptors. More than 450 descriptors could be calculated from this program. The descriptors were further analyzed for linear dependence.
The good statistical methods that could select appropriate descriptors and the best quality correlation are essential in developing the QSAR/QSPR models. In this study, two methods were used to obtain the QSAR equation i.e., Heuristic and the Best Multi Linear regression method (BML). The Heuristic model could work fast and could be applied on a no limit data set. It could either give good correlation from the data or several best regression models. The algorithm of this method follows several steps, summarizing as it eliminates the descriptors with bad or missing values followed by the highly intercorrelated descriptors. The best multi-parameter regression models, which were developed from the remaining descriptors, will come with optimum values of statistical criteria consisting of regression correlation coefficient (R2), the cross-validation (R2cv), and the F-value. Compared to the Heuristic method, the BML method was more thorough and thus takes a longer time to complete. This method also limits the number of experimental values (150 structures) and descriptors (300 descriptors). The best two, three and etc. parameter regression models were based on the highest R2 value. The models will be constituted from the selected non-collinear descriptors. After the initial analysis, the equation from BML was selected as the best equation based on the statistical parameters such as correlation coefficient (R), standard deviation (s), and F values. The BML method builds a single correlation using all selected descriptors in order to find the best regression model.
In developing a good QSAR model, it is important to decide when to stop adding descriptors. The technique is the so-called “breaking point” which helps to control the model expansion and thus, in turn, improves the statistical quality of the model [28]. Initially, any addition of any independent variables in the QSAR model can lead to improvement in the R2 value in the consequent regression. However, if the addition of the new descriptor does not significantly improve the R2 value, then the added descriptor does not contribute any new information to the model. If the increase in R2 value is less than 0.02, then the QSAR model described by such regression equation is considered as the best model.
The obtained model was validated to test the internal stability and predictive ability by using the internal test procedure. It employed the leave-one-out method (LOD). In the calculation for the cross validation regression coefficient (R2cv), each molecule in the data set was eliminated once. The activity of the eliminated molecule was predicted by using the model developed by the remaining molecules. The cross validation regression coefficient (R2cv) can be calculated by the following formula [38];
where Yexp and Ypred were activities of molecule in the test data and is the average activity of all the molecules in the data set. The LOD method technique is based on the difference between the squared cross-validated correlation coefficient (R2cv) and correlation coefficient (R2). The small difference suggested a good predictive ability of the QSAR model.
When the data set is divided into the training and test sets, a model is generated from the training set compounds. The model should be validated through the external validation using the parameters like R2pred. It could be defined as
The value of R2pred should be more than 0.5.
3.6.1. Data Set
A total of 24 anti-inflammatory compounds were used to develop the QSAR model. Out of these compounds, compounds 1, 2 and 3 were isolated from P. tetrandra, compounds 4–10 were from the semi synthesis of ursolic acid 1, while compounds 11–30 were purchased from Chromadex. All compounds were evaluated for their inflammatory activity of the hyaluronidase enzyme, and the data was calculated as IC50 values. The data was converted into log IC50 values which were used instead of IC50 to improve the normal distribution of the experimental data points [28].
3.6.2. Descriptors
Four descriptors were found to influence the activity of PTs towards the hyaluronidase inhibitory activity. Two electronic descriptors were involved in Equation (1). The first electronic descriptor was the min partial charge for a carbon atom (Zefirov’s PC) (). It could be defined as [39]:
whereby is the atomic electronegativity given by;
whereby is the electronegativity of the isolated atoms and n is the number of atoms in the first coordination sphere of a given atom “i”.
The other electronic descriptor was the molecular surface area, .
Two chemical descriptors were involved in the selected model. Max bond order of a C atom, is defined as [30]:
whereby the first summation is performed over all occupied molecular orbitals (ni denotes the occupation number of the ith MO), and the two other summations over µ and υ, the atomic orbitals belonging to the C atoms in the molecule. MO coefficients are denoted as ciu and cjv.
The min valency of an H atom, the final quantum chemical descriptor is the max electron-electron repulsion for a C-H bond (). It could be defined as [30]:
where and are the densities of the matrix element over atomic basis and is the electron repulsion integrals on atomic basis .
3.7. Molecular Docking Study
Molecular docking was used to predict and clarify the interaction of the complex between the most active ursolic acid analogue, compound 22 in Table 1, and hyaluronidase in comparison to the positive control apigenin. Apigenin was taken from the RCSB protein data bank (PDB ID = 4HKK, [40,41] where compound 22 was further modeled from apigenin and optimized with density functional theory under b3lyp/6-311g(d,p) basis set using Gaussian09 [42]. The high resolution of the crystal structure of human hyaluronidase-1, a hyaluronan hydrolyzing enzyme involved in tumor growth and angiogenesis was obtained from the RCSB protein data bank (PDB ID = 2PE4) [41,43]. The waters and ligands were removed from the original crystal structure. Then, the initial structure was modified according to the CHARMM force field with partial charge Momany–Rone [44] and minimization of the structures was performed with RMS gradient tolerance of 0.1000 kcal/(mol × Angstrom) satisfied. Flexible docking of compound 22 and apigenin into the targets was performed using AUTODOCK VINA [45] to Asp 129 (one of the binding sites) of human hyalurodinase. A 30 × 30 × 30 Å point grid was used. The low free energy complex structures were further minimized and analyzed. Detailed interaction energy was investigated by calculating binding energies using the protocol from Discovery Studio (Accelry Inc., San Diego, CA, USA, 2.5.5). This enabled us to estimate the residue interaction energy between the hyaluronidase and compounds.
4. Conclusions
A series of structurally related PTs were developed from the semi synthesis of ursolic acid 1. Together with the isolated and commercial sources of the derivatives, a total of 30 compounds/derivatives were evaluated for their inhibition towards hyaluronidase. However, only the data from 20 compounds were used to develop the QSAR model using the quantum chemical approach together with statistical analysis.
Equation (1) provided a measure of the influence of the changes in the size, shape, intermolecular hydrogen bonding, and the binding of the H, C–O and C–H atoms of the pentacylic triterpenes investigated here on the inhibition towards hyaluronidase. This QSAR equation can be used to predict the hyaluronidase inhibitory activity of new PT compounds, thus providing an efficient approach to design and development of new bioactive PT compounds.
Acknowledgments
This work was supported financially by the Ministry of Science and Technology Malaysia (MOSTI) under project number 02-03-10-SF0110, UMRG project no. RP020C-14AFR and Forest Research Institute Malaysia. We wish to dedicate this article to our dearest colleague, the late Assoc. Prof. Dr. Khalit Mohamad who has been a great inspiration to natural product research in Malaysia and internationally.
Author Contributions
Khalijah Awang, Noel Francis Thomas and Ibrahim Ali Noorbatcha conceived and designed the experiments; Nor Hayati Abdullah and Vannajan Sanghiran Lee performed the experiments; Nor Hayati Abdullah, Vannajan Sanghiran Lee, Yasodha Sivasothy and Sook Yee Liew analyzed the data; Khalijah Awang and Vannajan Sanghiran Lee contributed reagents/materials/analysis tools; Nor Hayati Abdullah, Vannajan Sanghiran Lee, Yasodha Sivasothy and Sook Yee Liew wrote the paper.
Conflicts of Interest
The authors declare no conflict of interest.
Abbreviations
QSAR: Quantitative structure-activity relationship
BML: best multi linear model
HA: hyaluronic acid (HA)
PT: pentacylic triterpenoids
NMR: Nuclear magnetic resonance
ESI-MS: Electrospray ionization-mass spectrometry
SAR: Structure activity relationship
PTC: pentacyclic triterpene
VDW: van der Waals
BI: binding interaction
IE: interaction energy
TLC: thin layer chromatography
FT-IR: Fourier Transform Infrared
DTGS: deuterated triglycine sulphate
MeOH: methanol
CHCl3: chloroform
EtOAc: ethyl acetate
RM1: Recife Model 1
References
- Boyer, P.D. The Enzymes, 3rd ed.; Academic Press: London, UK; New York, NY, USA, 1971; Volume 5. [Google Scholar]
- El-Safory, N.S.; Fazary, A.E.; Lee, C.K. Hyaluronidases, a group of glycosidases: Current and future perspectives. Carbohydr. Polym. 2010, 81, 165–181. [Google Scholar] [CrossRef]
- Vincent, J.C.; Lenormand, H. How hyaluronan-protein complexes modulate the hyaluronidase activity: The model. Biophys. Chem. 2009, 145, 126–134. [Google Scholar] [CrossRef] [PubMed]
- Guo, X.; Liu, F.; Zhu, X.; Su, Y.; Ling, P. Expression of a novel hyaluronidase from Streptococcus zooepidemicus in Escherichia coli and its application for the preparation of HA oligosaccharides. Carbohydr. Polym. 2009, 77, 254–260. [Google Scholar] [CrossRef]
- Lemmens, R.H.M.J.; Bunyapraphatsara, N. Plant Resources of South-East Asia 12 (3), Medicinal and Poisonous Plants 3; Backhuys: Leiden, The Netherlands, 2003. [Google Scholar]
- Burkill, I.H.; Birtwistle, W.; Foxworthy, F.W.; Scrivenor, J.B.; Watson, J.G. A Dictionary of the Economic Products of the Malay Peninsula; Ministry of Agriculture and cooperatives: Kuala Lumpur, Malaysia, 1966. [Google Scholar]
- Horiuchi, K.; Shiota, S.; Hatano, T.; Yoshida, T.; Kuroda, T.; Tsuchiya, T. Antimicrobial activity of oleanolic acid from Salvia officinalis and related compounds on vancomycin-resistant enterococci (VRE). Biol. Pharm. Bull. 2007, 30, 1147–1149. [Google Scholar] [CrossRef] [PubMed]
- Topçu, G.; Ertaş, A.; Kolak, U.; Öztürk, M.; Ulubelen, A. Antioxidant activity tests on novel triterpenoids from Salvia macrochlamys. ARKIVOC 2007, 7, 195–208. [Google Scholar]
- Zhu, Y.M.; Shen, J.K.; Wang, H.K.; Cosentino, L.M.; Lee, K.H. Synthesis and anti-HIV activity of oleanolic acid derivatives. Bioorg. Med. Chem. Lett. 2001, 11, 3115–3118. [Google Scholar] [CrossRef]
- Ma, C.; Nakamura, N.; Miyashiro, H.; Hattori, M.; Shimotohno, K. Inhibitory effects of constituents from Cynomorium songaricum and related triterpene derivatives on HIV-1 protease. Chem. Pharm. Bull. 1999, 47, 141–145. [Google Scholar] [CrossRef] [PubMed]
- Safayhi, H.; Sailer, E.R. Anti-inflammatory actions of pentacyclic triterpenes. Planta Med. 1997, 63, 487–493. [Google Scholar] [CrossRef] [PubMed]
- Šarek, J.; Klinot, J.; Džubák, P.; Klinotová, E.; Nosková, V.; Křeček, V.; Kořínková, G.; Thomson, J.O.; Janošt'áková, A.; Wang, S.; et al. New lupane derived compounds with pro-apoptotic activity in cancer cells: Synthesis and structure-activity relationships. J. Med. Chem. 2003, 46, 5402–5415. [Google Scholar] [CrossRef] [PubMed]
- Kim, D.S.H.L.; Pezzuto, J.M.; Pisha, E. Synthesis of betulinic acid derivatives with activity against human melanoma. Bioorg. Med. Chem. Lett. 1998, 8, 1707–1712. [Google Scholar] [CrossRef]
- Lee, K.H.; Lin, Y.M.; Wu, T.S.; Zhang, D.C.; Yamagishi, T.; Hayashi, T.; Hall, I.H.; Chang, J.J.; Wu, R.Y.; Yang, T.H. The cytotoxic principles of Prunella vulgaris, Psychotria serpens, and Hyptis capitata: Ursolic acid and related derivatives1. Planta Med. 1988, 54, 308–311. [Google Scholar] [CrossRef] [PubMed]
- Lin, C.N.; Lu, C.M.; Cheng, M.K.; Gan, K.H.; Won, S.J. The cytotoxic principles of Solanum incanum. J. Nat. Prod. 1990, 53, 513–516. [Google Scholar] [CrossRef] [PubMed]
- Ma, C.M.; Cai, S.Q.; Cui, J.R.; Wang, R.Q.; Tu, P.F.; Hattori, M.; Daneshtalab, M. The cytotoxic activity of ursolic acid derivatives. Eur. J. Med. Chem. 2005, 40, 582–589. [Google Scholar] [CrossRef] [PubMed]
- Mayaux, J.F.; Bousseau, A.; Pauwels, R.; Huet, T.; Henin, Y.; Dereu, N.; Evers, M.; Soler, F.; Poujade, C.; de Clercq, E.; et al. Triterpene derivatives that block entry of human immunodeficiency virus type 1 into cells. Proc. Natl. Acad. Sci. USA 1994, 91, 3564–3568. [Google Scholar] [CrossRef] [PubMed]
- Evers, M.; Poujade, C.; Soler, F.; Ribeill, Y.; James, C.; Lelièvre, Y.; Gueguen, J.C.; Reisdorf, D.; Morize, I.; Pauwels, R.; et al. Betulinic acid derivatives: A new class of human immunodeficiency virus type 1 specific inhibitors with a new mode of action. J. Med. Chem. 1996, 39, 1056–1068. [Google Scholar] [CrossRef] [PubMed]
- Kashiwada, Y.; Nagao, T.; Hashimoto, A.; Ikeshiro, Y.; Okabe, H.; Cosentino, L.M.; Lee, K.H. Anti-aids agents 38. Anti-hiv activity of 3-O-acyl ursolic acid derivatives1. J. Nat. Prod. 2000, 63, 1619–1622. [Google Scholar] [CrossRef] [PubMed]
- Liu, J. Pharmacology of oleanolic acid and ursolic acid. J. Ethnopharmacol. 1995, 49, 57–68. [Google Scholar] [CrossRef]
- Kalani, K.; Yadav, D.; Khan, F.; Srivastava, S.; Suri, N. Pharmacophore, qsar, and adme based semisynthesis and in vitro evaluation of ursolic acid analogs for anticancer activity. J. Mol. Model. 2012, 18, 3389–3413. [Google Scholar] [CrossRef] [PubMed]
- Liang, Z.; Zhang, L.; Li, L.; Liu, J.; Li, H.; Zhang, L.; Chen, L.; Cheng, K.; Zheng, M.; Wen, X.; et al. Identification of pentacyclic triterpenes derivatives as potent inhibitors against glycogen phosphorylase based on 3D-QSAR studies. Eur. J. Med. Chem. 2011, 46, 2011–2021. [Google Scholar] [CrossRef] [PubMed]
- Maurya, A.; Khan, F.; Bawankule, D.U.; Yadav, D.K.; Srivastava, S.K. Qsar, docking and in vivo studies for immunomodulatory activity of isolated triterpenoids from Eucalyptus tereticornis and Gentiana kurroo. Eur. J. Pharm. Sci. 2012, 47, 152–161. [Google Scholar] [CrossRef] [PubMed]
- Su, Q.; Xu, X.; Zhou, L. QSAR model of triterpene derivatives as potent anti-HIV agents. Mol. Simul. 2008, 34, 651–659. [Google Scholar] [CrossRef]
- Seebacher, W.; Simic, N.; Weis, R.; Saf, R.; Kunert, O. Complete assignments of 1H and 13C NMR resonances of oleanolic acid, 18α-oleanolic acid, ursolic acid and their 11-oxo derivatives. Magn. Reson. Chem. 2003, 41, 636–638. [Google Scholar] [CrossRef]
- Fan, J.P.; He, C.H. Single-step preparative separation of barbinervic acid and its epimer (rotungenic acid), along with two other pentacyclic triterpene acids from the leaves of diospyros kaki using HSCCC. J. Liq. Chromatogr. Relat. Technol. 2006, 29, 815–826. [Google Scholar] [CrossRef]
- Ling, S.K.; Tanaka, T.; Kouno, I. Effects of iridoids on lipoxygenase and hyaluronidase activities and their activation by & β-glucosidase in the presence of amino acids. Biol. Pharm. Bull. 2003, 26, 352–356. [Google Scholar] [PubMed]
- Katritzky, A.R.; Pacureanu, L.M.; Slavov, S.; Dobchev, D.A.; Karelson, M. QSAR study of antiplatelet agents. Bioorg. Med. Chem. 2006, 14, 7490–7500. [Google Scholar] [CrossRef] [PubMed]
- Topliss, J.G.; Costello, R.J. Chance correlations in structure-activity studies using multiple regression analysis. J. Med. Chem. 1972, 15, 1066–1068. [Google Scholar] [CrossRef] [PubMed]
- Karelson, M. Molecular Descriptors in QSAR/QSPR; John Wiley and sons, Inc.: New York, NY, USA, 2000. [Google Scholar]
- Hawkins, D.M.; Basak, S.C.; Mills, D. Assessing model fit by cross-validation. J. Chem. Inf. Comput. Sci. 2003, 43, 579–586. [Google Scholar] [CrossRef] [PubMed]
- Paliwal, S.; Singh, S.; Pal, M. In silico ligand based design of indolylpiperidinyl derivatives as novel histamine H(1) receptor antagonists. Drug Discov. Ther. 2012, 6, 69–77. [Google Scholar] [CrossRef] [PubMed]
- Leonard, J.T.; Roy, K. Exploring molecular shape analysis of styrylquinoline derivatives as HIV-1 integrase inhibitors. Eur. J. Med. Chem. 2008, 43, 81–92. [Google Scholar] [CrossRef] [PubMed]
- Guha, R.; Jurs, P.C. Determining the validity of a QSAR model—A classification approach. J. Chem. Inf. Model. 2005, 45, 65–73. [Google Scholar] [CrossRef] [PubMed]
- Rocha, G.B.; Freire, R.O.; Simas, A.M.; Stewart, J.J. RM1: A reparameterization of AM1 for H, C, N, O, P, S, F, Cl, Br, and I. J. Comput. Chem. 2006, 27, 1101–1111. [Google Scholar] [CrossRef] [PubMed]
- Stewart, J.J.P. Mopac Manual; Seiler Research Laboratory United States Air Force Academy: Colorado Springs, CO, USA, 1990. [Google Scholar]
- Awang, K.; Abdullah, N.H.; Thomas, N.F.; Ng, S.W. Methyl 3-dehydroxy-3-oxoursolate. Acta Crystallogr. Sect. E 2009. [Google Scholar] [CrossRef] [PubMed]
- Kartizky, A.R.; Lobanov, V.S.; Karelson, M. Comprehensive Descriptors for Structural and Statistical Analysis, 2nd ed.; University of Florida: Gainesville, FL, USA, 1994. [Google Scholar]
- Zefirov, N.S.; Kirpichenok, M.A.; Izmailov, F.F.; Trofimoz, M.I. Scheme for the calculation of the electronegativities of atoms in a molecule in the framework of sanderson’s principle. Dokl Akad. Nauk SSSR 1987, 296, 883–887. [Google Scholar]
- Narwal, M.; Haikarainen, T.; Fallarero, A.; Vuorela, P.M.; Lehtiö, L. Screening and structural analysis of flavones inhibiting tankyrases. J. Med. Chem. 2013, 56, 3507–3517. [Google Scholar] [CrossRef] [PubMed]
- RCSB Protein Data Bank. Available online: http://www.rcsb.org/pdb/home/home.do (accessed on 21 December 2015).
- Frisch, M.J.; Trucks, G.W.; Schlegel, H.B.; Scuseria, G.E.; Robb, M.A.; Cheeseman, J.R.; Scalmani, G.; Barone, V.; Mennucci, B.; Petersson, G.A.; et al. Gaussian 09; Gaussian, Inc.: Wallingford, CT, USA, 2009. [Google Scholar]
- Chao, K.L.; Muthukumar, L.; Herzberg, O. Structure of human hyaluronidase-1, a hyaluronan hydrolyzing enzyme involved in tumor growth and angiogenesis. Biochemistry 2007, 46, 6911–6920. [Google Scholar] [CrossRef] [PubMed]
- Momany, F.A.; Rone, R. Validation of the general purpose QUANTA®3.2/CHARMm® force field. J. Comput. Chem. 1992, 13, 888–900. [Google Scholar] [CrossRef]
- Trott, O.; Olson, A.J. Autodock vina: Improving the speed and accuracy of docking with a new scoring function, efficient optimization and multithreading. J. Comput. Chem. 2010, 31, 455–461. [Google Scholar] [CrossRef] [PubMed]
© 2016 by the authors; licensee MDPI, Basel, Switzerland. This article is an open access article distributed under the terms and conditions of the Creative Commons by Attribution (CC-BY) license (http://creativecommons.org/licenses/by/4.0/).