
Optical Coherence Tomography and Magnetic Resonance Imaging in Multiple Sclerosis and Neuromyelitis Optica Spectrum Disorder

Abstract
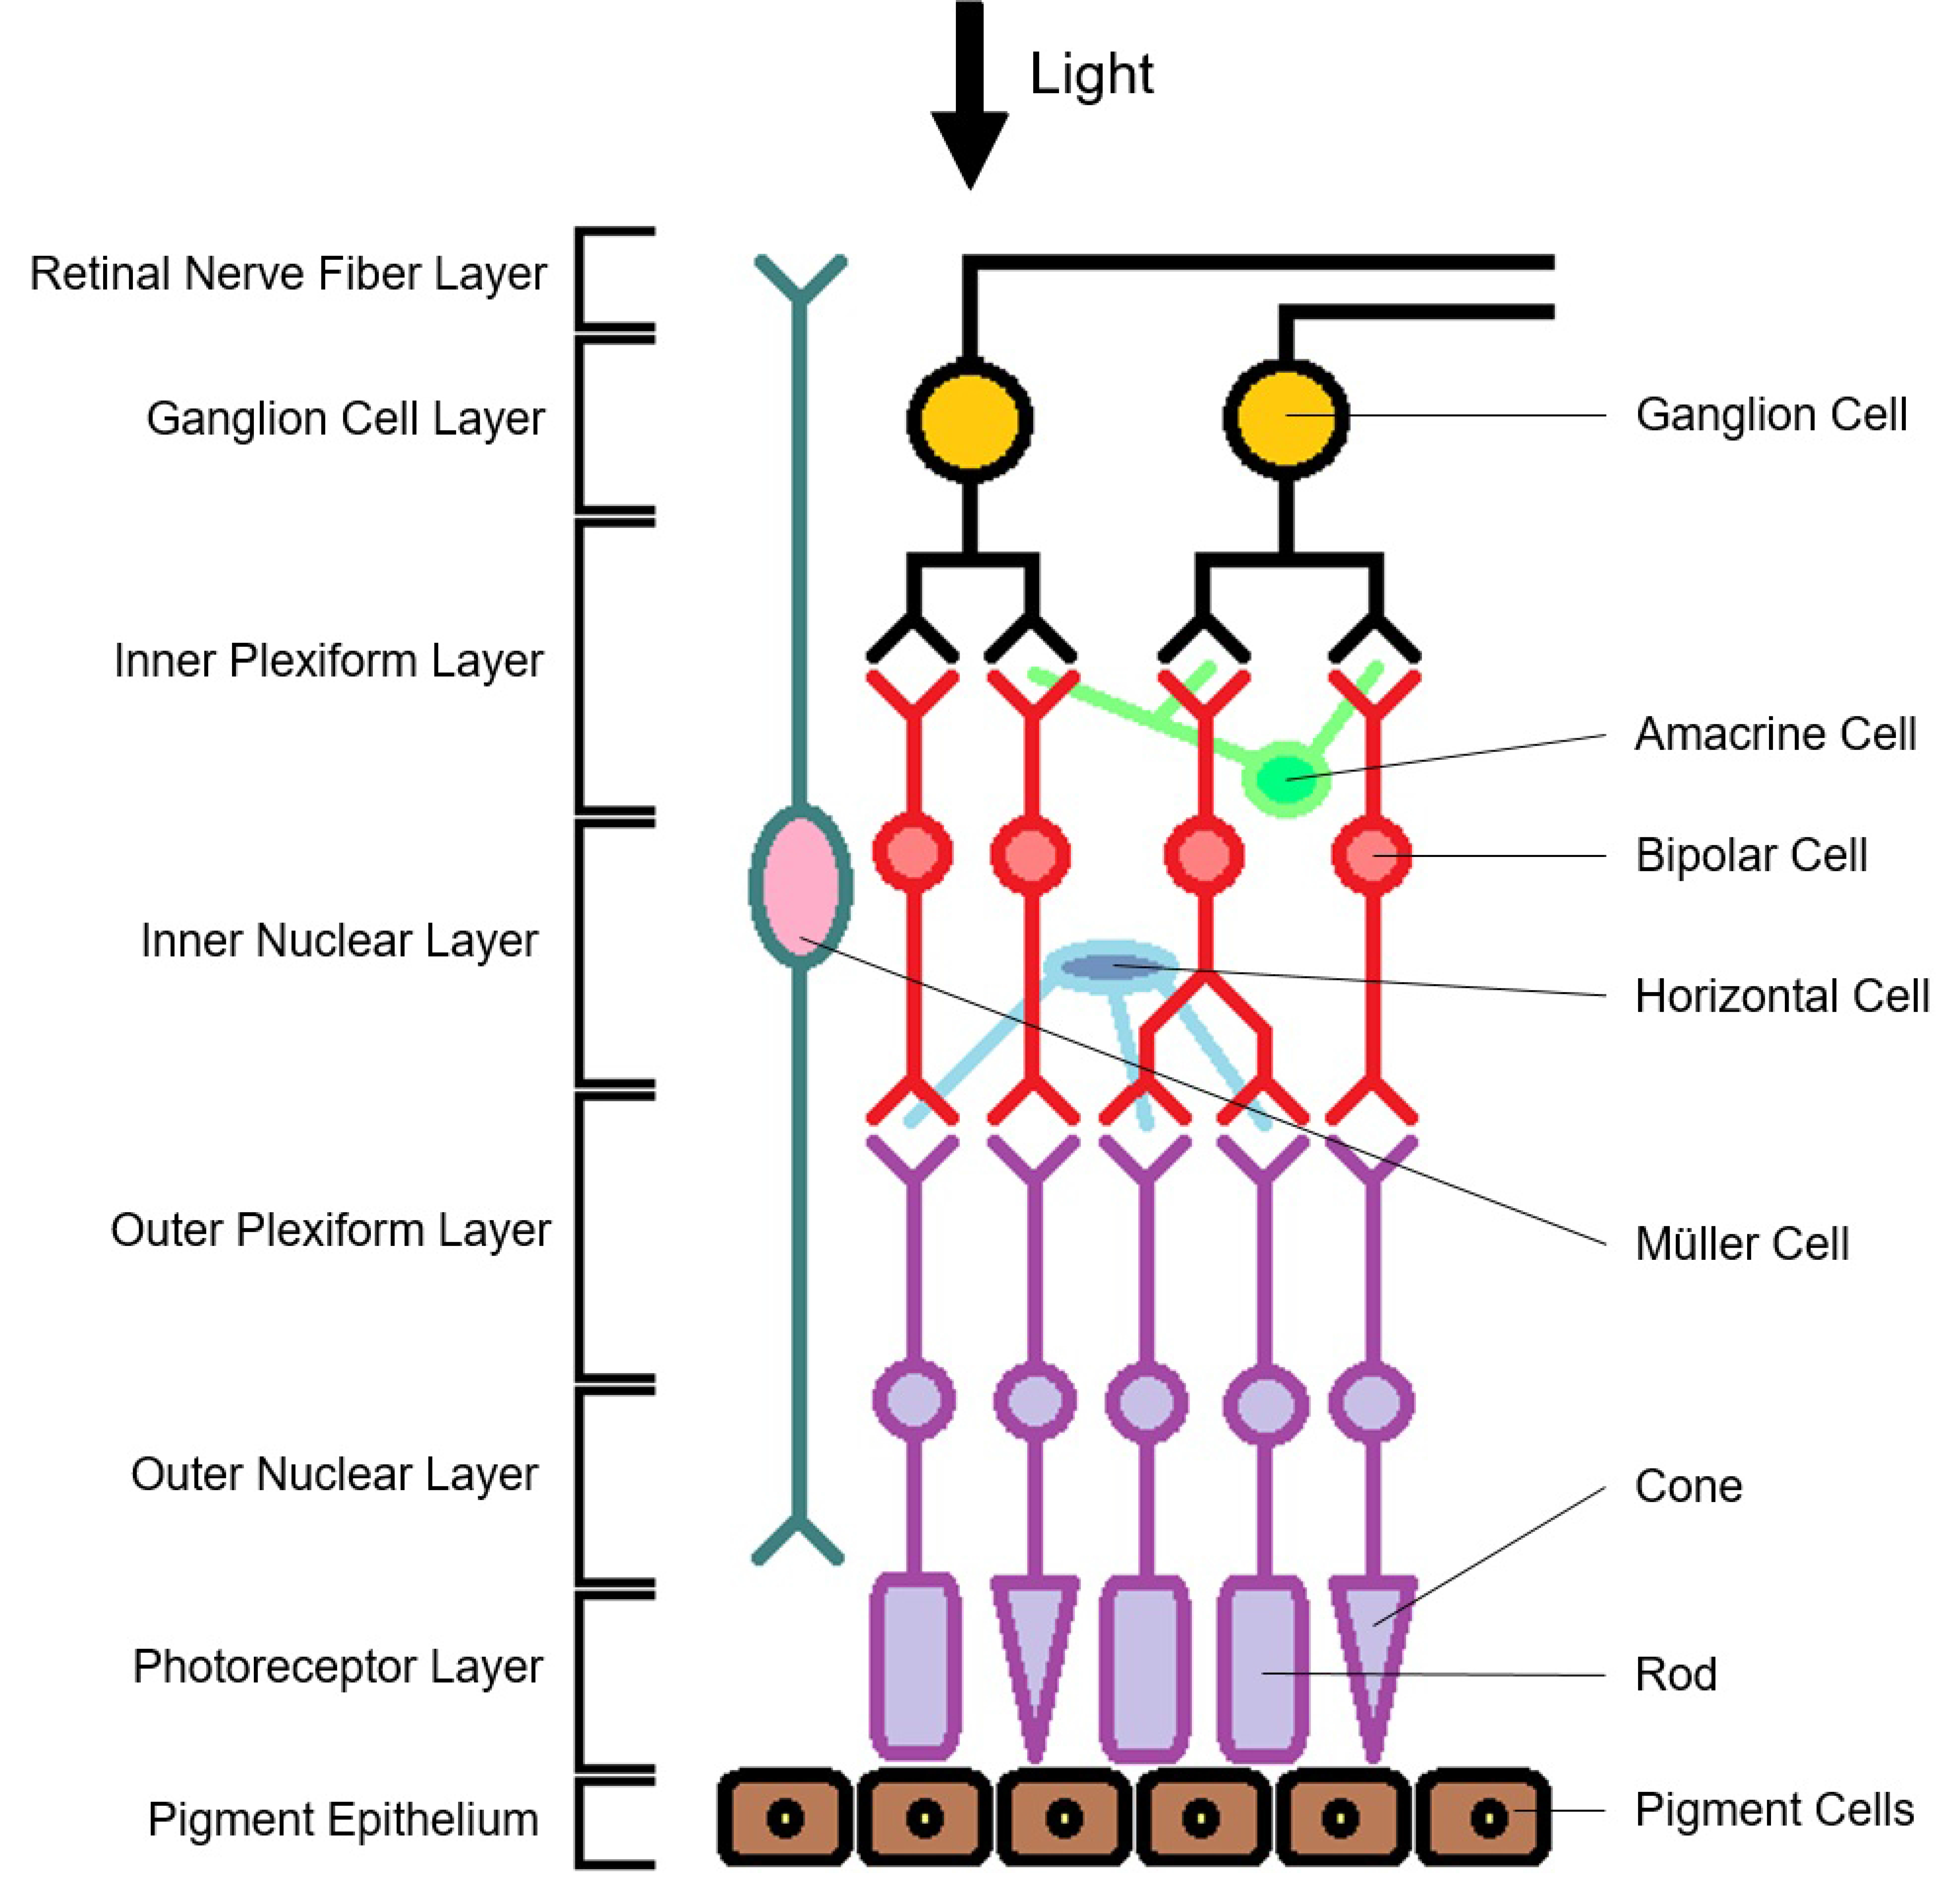
:1. Introduction
2. Global Brain Measurements
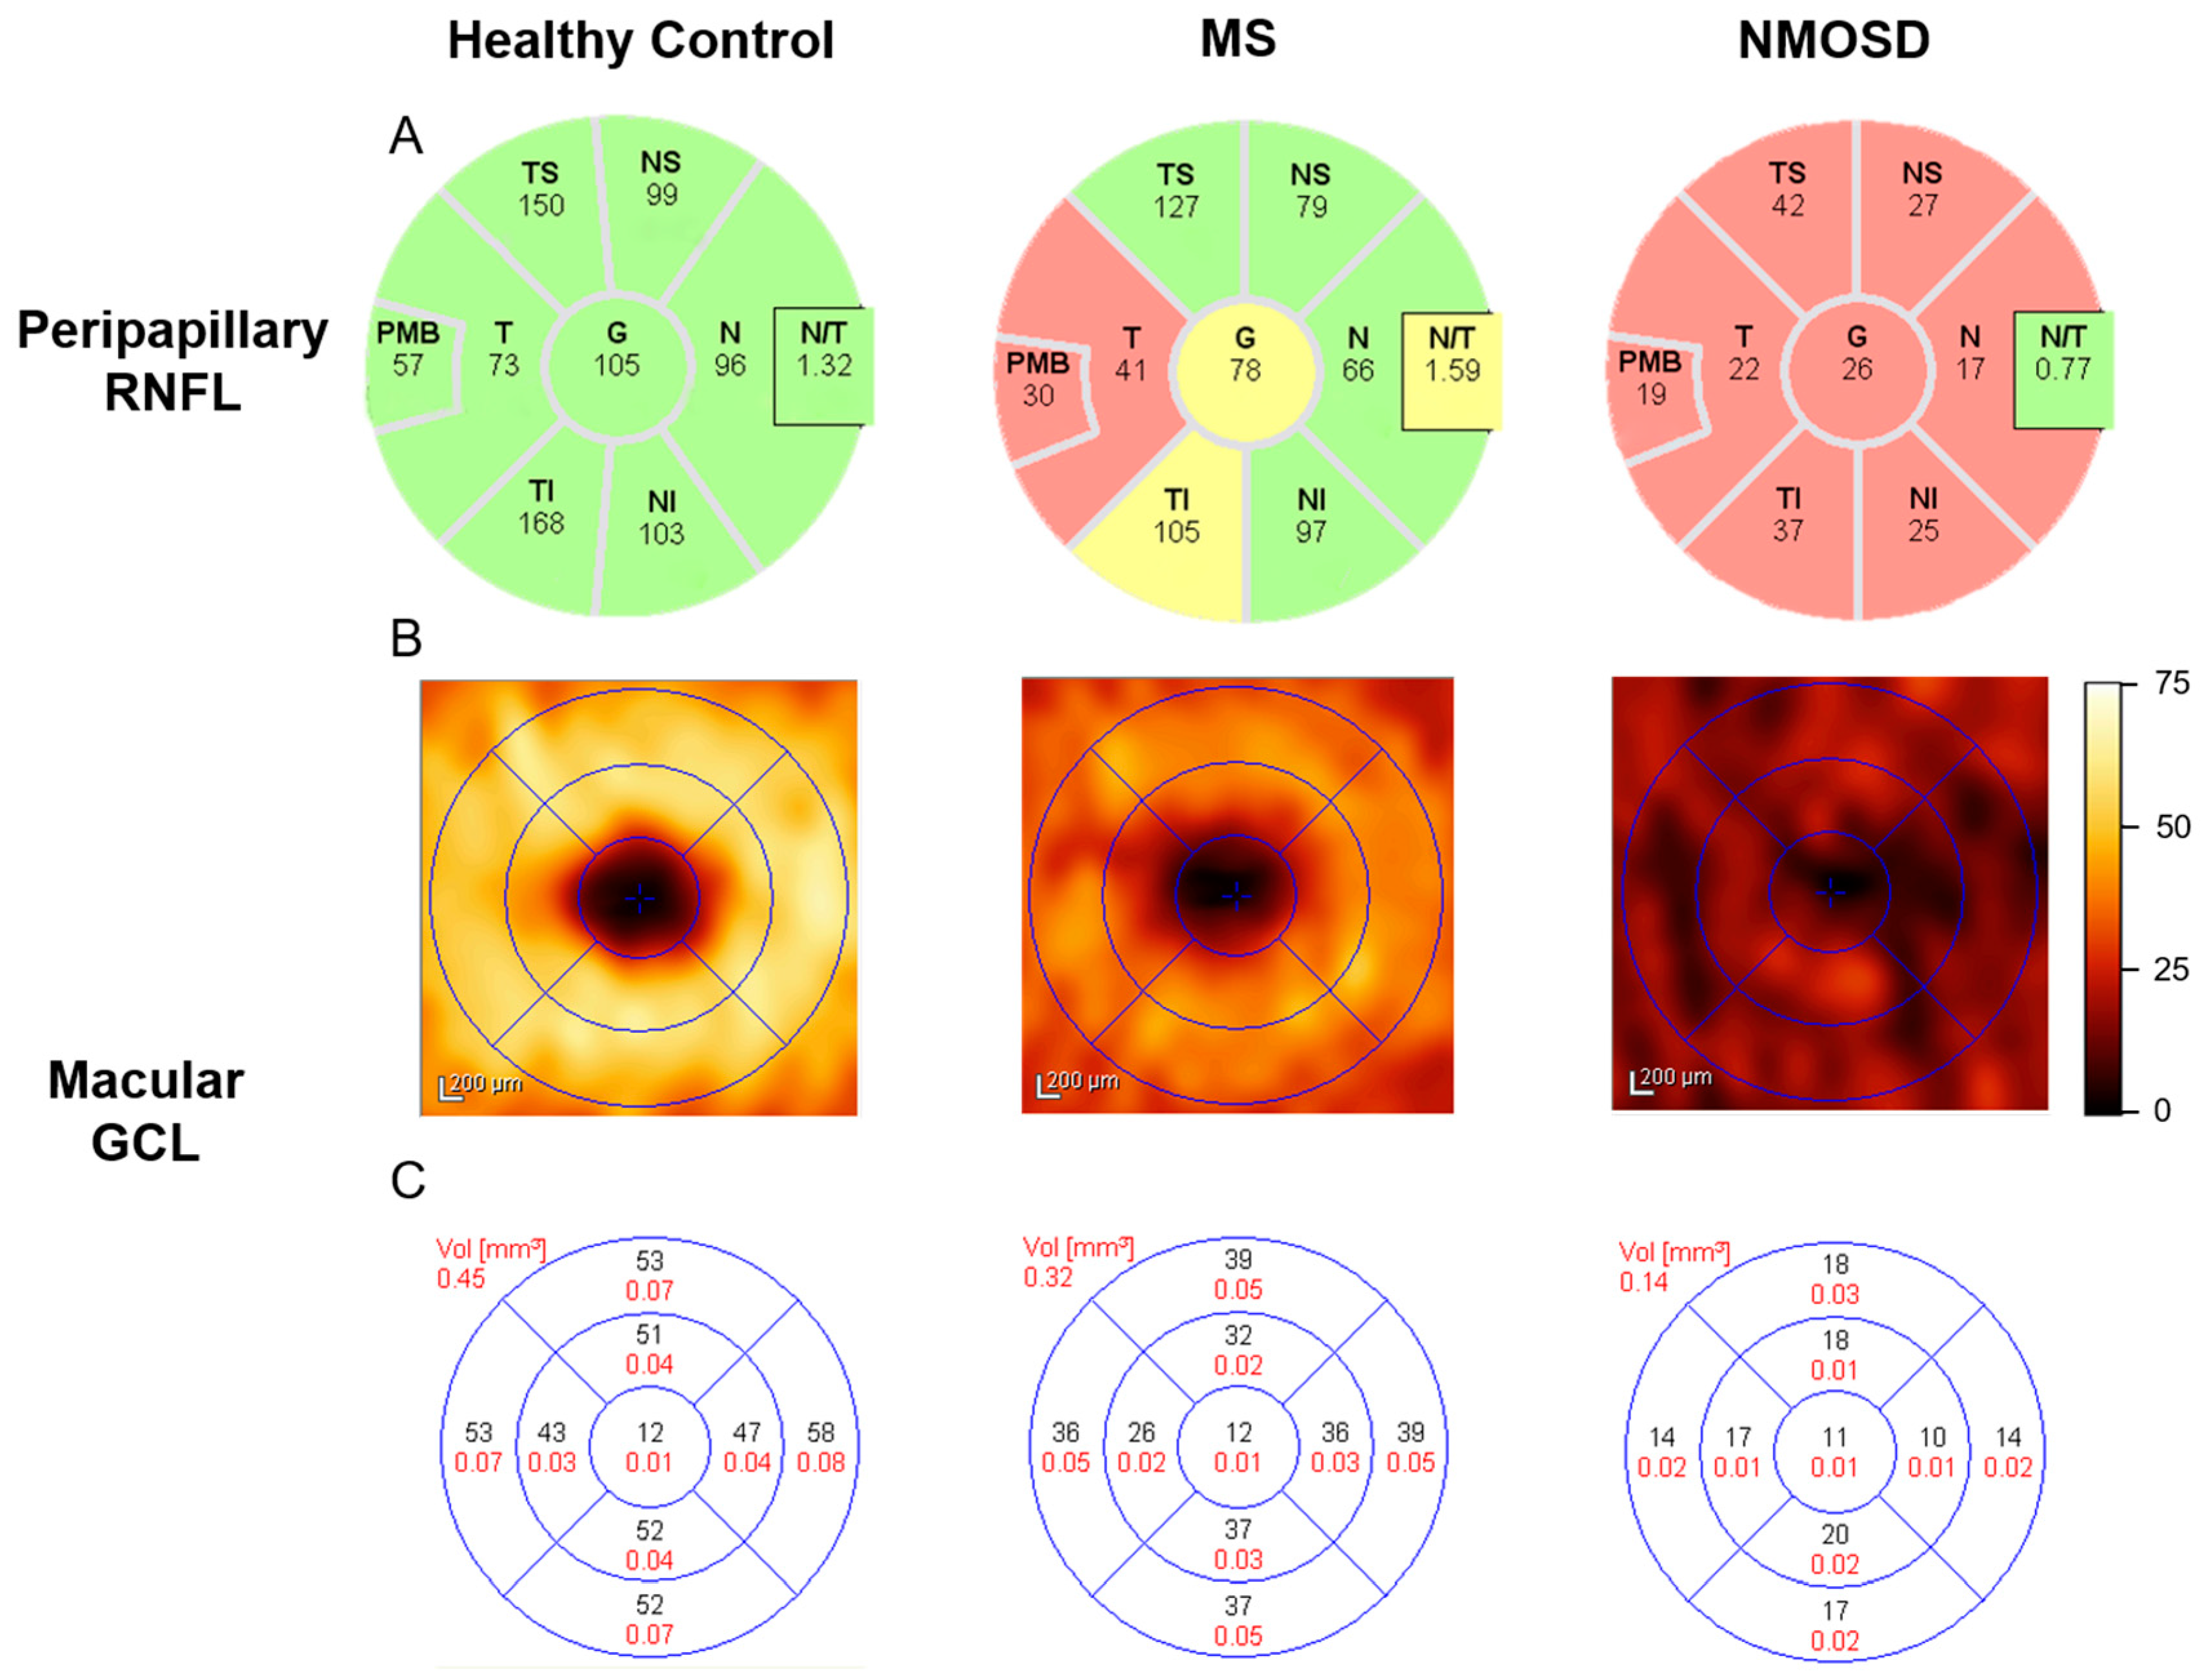
3. Optic Nerve
4. Optic Tract
5. Thalamus
6. Optic Radiation
7. Visual Cortex
8. Cerebellum, Brainstem and Deep Gray Matter
9. Conclusions
Acknowledgments
Author Contributions
Conflicts of Interest
References
- Didonna, A.; Oksenberg, J.R. Genetic determinants of risk and progression in multiple sclerosis. Clin. Chim. Acta 2015, 449, 16–22. [Google Scholar] [CrossRef] [PubMed]
- Sospedra, M.; Martin, R. Immunology of multiple sclerosis. Annu. Rev. Immunol. 2005, 23, 683–747. [Google Scholar] [CrossRef] [PubMed]
- Mahad, D.H.; Trapp, B.D.; Lassmann, H. Pathological mechanisms in progressive multiple sclerosis. Lancet Neurol. 2015, 14, 183–193. [Google Scholar] [CrossRef] [PubMed]
- Compston, A.; Coles, A. Multiple sclerosis. Lancet 2008, 372, 1502–1517. [Google Scholar] [CrossRef]
- Kingwell, E.; Marriott, J.J.; Jetté, N.; Pringsheim, T.; Makhani, N.; Morrow, S.A.; Fisk, J.D.; Evans, C.; Béland, S.G.; Kulaga, S. Incidence and prevalence of multiple sclerosis in europe: A systematic review. BMC Neurol. 2013, 13, 128. [Google Scholar] [CrossRef] [PubMed]
- Bennett, J.; de Seze, J.; Lana-Peixoto, M.; Palace, J.; Waldman, A.; Schippling, S.; Tenembaum, S.; Banwell, B.; Greenberg, B.; Levy, M. Neuromyelitis optica and multiple sclerosis: Seeing differences through optical coherence tomography. Mult. Scler. J. 2015. [Google Scholar] [CrossRef] [PubMed]
- Fujihara, K.; Palace, J. Neuroimmunology: Towards more-accurate diagnosis in neuromyelitis optica. Nat. Rev. Neurol. 2014, 10, 679–681. [Google Scholar] [CrossRef] [PubMed]
- Papadopoulos, M.C.; Verkman, A. Aquaporin 4 and neuromyelitis optica. Lancet Neurol. 2012, 11, 535–544. [Google Scholar] [CrossRef]
- Siffrin, V.; Vogt, J.; Radbruch, H.; Nitsch, R.; Zipp, F. Multiple sclerosis-candidate mechanisms underlying cns atrophy. Trends Neurosci. 2010, 33, 202–210. [Google Scholar] [CrossRef] [PubMed]
- Young, K.L.; Brandt, A.; Petzold, A.; Reitz, L.; Lintze, F.; Paul, F.; Martin, R.; Schippling, S. Loss of retinal nerve fibre layer axons indicates white but not grey matter damage in early multiple sclerosis. Eur. J. Neurol. 2013, 20, 803–811. [Google Scholar] [CrossRef] [PubMed]
- Balcer, L.J. Optic neuritis. N. Engl. J. Med. 2006, 354, 1273–1280. [Google Scholar] [CrossRef] [PubMed]
- Miller, D.; Barkhof, F.; Montalban, X.; Thompson, A.; Filippi, M. Clinically isolated syndromes suggestive of multiple sclerosis, part I: Natural history, pathogenesis, diagnosis, and prognosis. Lancet Neurol. 2005, 4, 281–288. [Google Scholar] [CrossRef]
- Toosy, A.T.; Mason, D.F.; Miller, D.H. Optic neuritis. Lancet Neurol. 2014, 13, 83–99. [Google Scholar] [CrossRef]
- Polman, C.H.; Reingold, S.C.; Banwell, B.; Clanet, M.; Cohen, J.A.; Filippi, M.; Fujihara, K.; Havrdova, E.; Hutchinson, M.; Kappos, L. Diagnostic criteria for multiple sclerosis: 2010 revisions to the McDonald criteria. Ann. Neurol. 2011, 69, 292–302. [Google Scholar] [CrossRef] [PubMed]
- Balcer, L.J.; Miller, D.H.; Reingold, S.C.; Cohen, J.A. Vision and vision-related outcome measures in multiple sclerosis. Brain 2015, 138, 11–27. [Google Scholar] [CrossRef] [PubMed]
- Drexler, W.; Fujimoto, J.G. Optical Coherence Tomography: Technology and Applications; Springer Science & Business Media: Berlin, Germany, 2008. [Google Scholar]
- Noval, S.; Contreras, I.; Munoz, S.; Oreja-Guevara, C.; Manzano, B.; Rebolleda, G. Optical coherence tomography in multiple sclerosis and neuromyelitis optica: An update. Mult. Scler. Int. 2011, 2011, 472790. [Google Scholar] [CrossRef] [PubMed]
- Burkholder, B.M.; Osborne, B.; Loguidice, M.J.; Bisker, E.; Frohman, T.C.; Conger, A.; Ratchford, J.N.; Warner, C.; Markowitz, C.E.; Jacobs, D.A. Macular volume determined by optical coherence tomography as a measure of neuronal loss in multiple sclerosis. Arch. Neurol. 2009, 66, 1366–1372. [Google Scholar] [CrossRef] [PubMed]
- Ratchford, J.; Quigg, M.; Conger, A.; Frohman, T.; Frohman, E.; Balcer, L.; Calabresi, P.; Kerr, D. Optical coherence tomography helps differentiate neuromyelitis optica and MS optic neuropathies. Neurology 2009, 73, 302–308. [Google Scholar] [CrossRef] [PubMed]
- Schneider, E.; Zimmermann, H.; Oberwahrenbrock, T.; Kaufhold, F.; Kadas, E.M.; Petzold, A.; Bilger, F.; Borisow, N.; Jarius, S.; Wildemann, B. Optical coherence tomography reveals distinct patterns of retinal damage in neuromyelitis optica and multiple sclerosis. PLoS ONE 2013, 8, e66151. [Google Scholar] [CrossRef] [PubMed]
- Lange, A.P.; Zhu, F.; Sayao, A.-L.; Sadjadi, R.; Alkabie, S.; Traboulsee, A.L.; Costello, F.; Tremlett, H. Retinal nerve fiber layer thickness in benign multiple sclerosis. Mult. Scler. J. 2013, 19, 1275–1281. [Google Scholar] [CrossRef] [PubMed]
- Oberwahrenbrock, T.; Ringelstein, M.; Jentschke, S.; Deuschle, K.; Klumbies, K.; Bellmann-Strobl, J.; Harmel, J.; Ruprecht, K.; Schippling, S.; Hartung, H.-P. Retinal ganglion cell and inner plexiform layer thinning in clinically isolated syndrome. Mult. Scler. J. 2013. [Google Scholar] [CrossRef] [PubMed]
- Syc, S.B.; Saidha, S.; Newsome, S.D.; Ratchford, J.N.; Levy, M.; Crainiceanu, C.M.; Durbin, M.K.; Oakley, J.D.; Meyer, S.A.; Frohman, E.M. Optical coherence tomography segmentation reveals ganglion cell layer pathology after optic neuritis. Brain 2012, 135, 521–533. [Google Scholar] [CrossRef] [PubMed]
- Fernandes, D.B.; Raza, A.S.; Nogueira, R.G.; Wang, D.; Callegaro, D.; Hood, D.C.; Monteiro, M.L. Evaluation of inner retinal layers in patients with multiple sclerosis or neuromyelitis optica using optical coherence tomography. Ophthalmology 2013, 120, 387–394. [Google Scholar] [CrossRef] [PubMed]
- Walter, S.D.; Ishikawa, H.; Galetta, K.M.; Sakai, R.E.; Feller, D.J.; Henderson, S.B.; Wilson, J.A.; Maguire, M.G.; Galetta, S.L.; Frohman, E. Ganglion cell loss in relation to visual disability in multiple sclerosis. Ophthalmology 2012, 119, 1250–1257. [Google Scholar] [CrossRef] [PubMed]
- Park, K.A.; Kim, J.; Oh, S.Y. Analysis of spectral domain optical coherence tomography measurements in optic neuritis: Differences in neuromyelitis optica, multiple sclerosis, isolated optic neuritis and normal healthy controls. Acta Ophthalmol. 2014, 92, e57–e65. [Google Scholar] [CrossRef] [PubMed]
- Balk, L.; Twisk, J.; Steenwijk, M.; Daams, M.; Tewarie, P.; Killestein, J.; Polman, C.; Petzold, A. A dam for retrograde axonal degeneration in multiple sclerosis? J. Neurol. Neurosurg. Psychiatry 2014, 85, 782–789. [Google Scholar] [CrossRef] [PubMed]
- Saidha, S.; Al-Louzi, O.; Ratchford, J.N.; Bhargava, P.; Oh, J.; Newsome, S.D.; Prince, J.L.; Pham, D.; Roy, S.; van Zijl, P. Optical coherence tomography reflects brain atrophy in multiple sclerosis: A four-year study. Ann. Neurol. 2015, 78, 801–813. [Google Scholar] [CrossRef] [PubMed]
- Green, A.J.; McQuaid, S.; Hauser, S.L.; Allen, I.V.; Lyness, R. Ocular pathology in multiple sclerosis: Retinal atrophy and inflammation irrespective of disease duration. Brain 2010, 133, 1591–1601. [Google Scholar] [CrossRef] [PubMed]
- Gabilondo, I.; Martínez-Lapiscina, E.H.; Fraga-Pumar, E.; Ortiz-Perez, S.; Torres-Torres, R.; Andorra, M.; Llufriu, S.; Zubizarreta, I.; Saiz, A.; Sanchez-Dalmau, B. Dynamics of retinal injury after acute optic neuritis. Ann. Neurol. 2015, 77, 517–528. [Google Scholar] [CrossRef] [PubMed]
- Gelfand, J.M.; Cree, B.A.; Nolan, R.; Arnow, S.; Green, A.J. Microcystic inner nuclear layer abnormalities and neuromyelitis optica. JAMA Neurol. 2013, 70, 629–633. [Google Scholar] [CrossRef] [PubMed]
- Burggraaff, M.C.; Trieu, J.; de Vries-Knoppert, W.A.; Balk, L.; Petzold, A. The clinical spectrum of microcystic macular edemamicrocystic macular edema. Investig. Ophthalmol. Vis. Sci. 2014, 55, 952–961. [Google Scholar] [CrossRef] [PubMed]
- Gelfand, J.M.; Nolan, R.; Schwartz, D.M.; Graves, J.; Green, A.J. Microcystic macular oedema in multiple sclerosis is associated with disease severity. Brain 2012, 135, 1786–1793. [Google Scholar] [CrossRef] [PubMed]
- Albrecht, P.; Ringelstein, M.; Müller, A.; Keser, N.; Dietlein, T.; Lappas, A.; Foerster, A.; Hartung, H.; Aktas, O.; Methner, A. Degeneration of retinal layers in multiple sclerosis subtypes quantified by optical coherence tomography. Mult. Scler. J. 2012, 18, 1422–1429. [Google Scholar] [CrossRef] [PubMed]
- Miller, T.R.; Mohan, S.; Choudhri, A.F.; Gandhi, D.; Jindal, G. Advances in multiple sclerosis and its variants: Conventional and newer imaging techniques. Radiol. Clin. N. Am. 2014, 52, 321–336. [Google Scholar] [CrossRef] [PubMed]
- Pfueller, C.F.; Paul, F. Imaging the visual pathway in neuromyelitis optica. Mult. Scler. Int. 2011, 2011, 869814. [Google Scholar] [CrossRef] [PubMed]
- Smith, S.M.; Zhang, Y.; Jenkinson, M.; Chen, J.; Matthews, P.; Federico, A.; de Stefano, N. Accurate, robust, and automated longitudinal and cross-sectional brain change analysis. Neuroimage 2002, 17, 479–489. [Google Scholar] [CrossRef] [PubMed]
- McFarland, H.; Barkhof, F.; Antel, J.; Miller, D. The role of MRI as a surrogate outcome measure in multiple sclerosis. Mult. Scler. 2002, 8, 40–51. [Google Scholar] [CrossRef] [PubMed]
- Barkhof, F.; Calabresi, P.A.; Miller, D.H.; Reingold, S.C. Imaging outcomes for neuroprotection and repair in multiple sclerosis trials. Nat. Rev. Neurol. 2009, 5, 256–266. [Google Scholar] [CrossRef] [PubMed]
- Dörr, J.; Wernecke, K.D.; Bock, M.; Gaede, G.; Wuerfel, J.T.; Pfueller, C.F.; Bellmann-Strobl, J.; Freing, A.; Brandt, A.U.; Friedemann, P. Association of retinal and macular damage with brain atrophy in multiple sclerosis. PLoS ONE 2011, 6, e18132. [Google Scholar] [CrossRef] [PubMed]
- Bakshi, R.; Thompson, A.J.; Rocca, M.A.; Pelletier, D.; Dousset, V.; Barkhof, F.; Inglese, M.; Guttmann, C.R.; Horsfield, M.A.; Filippi, M. MRI in multiple sclerosis: Current status and future prospects. Lancet Neurol. 2008, 7, 615–625. [Google Scholar] [CrossRef]
- Barnett, Y.; Sutton, I.J.; Ghadiri, M.; Masters, L.; Zivadinov, R.; Barnett, M.H. Conventional and advanced imaging in neuromyelitis optica. AJNR 2014, 35, 1458–1466. [Google Scholar] [CrossRef] [PubMed]
- Fox, R.J.; Beall, E.; Bhattacharyya, P.; Chen, J.T.; Sakaie, K. Advanced MRI in multiple sclerosis: Current status and future challenges. Neurol. Clin. 2011, 29, 357–380. [Google Scholar] [CrossRef] [PubMed]
- Arnold, D.L.; Matthews, P. MRI in the diagnosis and management of multiple sclerosis. Neurology 2002, 58, S23–S31. [Google Scholar] [CrossRef] [PubMed]
- Prinsen, H.; de Graaf, R.A.; Mason, G.F.; Pelletier, D.; Juchem, C. Reproducibility measurement of glutathione, GABA, and glutamate: Towards in vivo neurochemical profiling of multiple sclerosis with mr spectroscopy at 7T. J. Magn. Reson. Imag. 2016. [Google Scholar] [CrossRef] [PubMed]
- Laule, C.; Kozlowski, P.; Leung, E.; Li, D.K.; MacKay, A.L.; Moore, G.W. Myelin water imaging of multiple sclerosis at 7T: Correlations with histopathology. Neuroimage 2008, 40, 1575–1580. [Google Scholar] [CrossRef] [PubMed]
- Reich, D.S.; Smith, S.A.; Gordon-Lipkin, E.M.; Ozturk, A.; Caffo, B.S.; Balcer, L.J.; Calabresi, P.A. Damage to the optic radiation in multiple sclerosis is associated with retinal injury and visual disability. Arch. Neurol. 2009, 66, 998–1006. [Google Scholar] [CrossRef] [PubMed]
- Frohman, E.M.; Dwyer, M.G.; Frohman, T.; Cox, J.L.; Salter, A.; Greenberg, B.M.; Hussein, S.; Conger, A.; Calabresi, P.; Balcer, L.J. Relationship of optic nerve and brain conventional and non-conventional MRI measures and retinal nerve fiber layer thickness, as assessed by OCT and GDx: A pilot study. J. Neurol. Sci. 2009, 282, 96–105. [Google Scholar] [CrossRef] [PubMed]
- Kolbe, S.C.; Marriott, M.; van der Walt, A.; Fielding, J.; Klistorner, A.; Mitchell, P.J.; Butzkueven, H.; Kilpatrick, T.J.; Egan, G.F. Diffusion tensor imaging correlates of visual impairment in multiple sclerosis and chronic optic neuritis. Investig. Ophthalmol. Vis. Sci. 2012, 53, 825–832. [Google Scholar] [CrossRef] [PubMed]
- Hofer, S.; Karaus, A.; Frahm, J. Reconstruction and dissection of the entire human visual pathway using diffusion tensor MRI. Front. Neuroanat. 2010, 4, 15. [Google Scholar] [CrossRef] [PubMed]
- Hein, K.; Gadjanski, I.; Kretzschmar, B.; Lange, K.; Diem, R.; Sättler, M.B.; Bähr, M. An optical coherence tomography study on degeneration of retinal nerve fiber layer in rats with autoimmune optic neuritis. Investig. Ophthalmol. Vis. Sci. 2012, 53, 157–163. [Google Scholar] [CrossRef] [PubMed]
- Knier, B.; Rothhammer, V.; Heink, S.; Puk, O.; Graw, J.; Hemmer, B.; Korn, T. Neutralizing IL-17 protects the optic nerve from autoimmune pathology and prevents retinal nerve fiber layer atrophy during experimental autoimmune encephalomyelitis. J. Autoimmun. 2015, 56, 34–44. [Google Scholar] [CrossRef] [PubMed]
- Sun, S.-W.; Liang, H.-F.; Schmidt, R.E.; Cross, A.H.; Song, S.-K. Selective vulnerability of cerebral white matter in a murine model of multiple sclerosis detected using diffusion tensor imaging. Neurobiol. Dis. 2007, 28, 30–38. [Google Scholar] [CrossRef] [PubMed]
- Wu, Q.; Butzkueven, H.; Gresle, M.; Kirchhoff, F.; Friedhuber, A.; Yang, Q.; Wang, H.; Fang, K.; Lei, H.; Egan, G.F. Mr diffusion changes correlate with ultra-structurally defined axonal degeneration in murine optic nerve. Neuroimage 2007, 37, 1138–1147. [Google Scholar] [CrossRef] [PubMed]
- Horstmann, L.; Schmid, H.; Heinen, A.P.; Kurschus, F.C.; Dick, H.B.; Joachim, S.C. Inflammatory demyelination induces glia alterations and ganglion cell loss in the retina of an experimental autoimmune encephalomyelitis model. J. Neuroinflamm. 2013, 10, 120. [Google Scholar] [CrossRef] [PubMed]
- Enriquez-Algeciras, M.; Ding, D.; Chou, T.-H.; Wang, J.; Padgett, K.R.; Porciatti, V.; Bhattacharya, S.K. Evaluation of a transgenic mouse model of multiple sclerosis with noninvasive methods. Investig. Ophthalmol. Vis. Sci. 2011, 52, 2405–2411. [Google Scholar] [CrossRef] [PubMed]
- Pfueller, C.F.; Brandt, A.U.; Schubert, F.; Bock, M.; Walaszek, B.; Waiczies, H.; Schwenteck, T.; Dörr, J.; Bellmann-Strobl, J.; Mohr, C. Metabolic changes in the visual cortex are linked to retinal nerve fiber layer thinning in multiple sclerosis. PLoS ONE 2011, 6, e18019. [Google Scholar] [CrossRef] [PubMed]
- Abalo-Lojo, J.M.; Limeres, C.C.; Gómez, M.A.; Baleato-González, S.; Cadarso-Suárez, C.; Capeáns-Tomé, C.; Gonzalez, F. Retinal nerve fiber layer thickness, brain atrophy, and disability in multiple sclerosis patients. J. Neuro Ophthalmol. 2014, 34, 23–28. [Google Scholar] [CrossRef] [PubMed]
- Zimmermann, H.; Freing, A.; Kaufhold, F.; Gaede, G.; Bohn, E.; Bock, M.; Oberwahrenbrock, T.; Young, K.-L.; Dörr, J.; Wuerfel, J.T. Optic neuritis interferes with optical coherence tomography and magnetic resonance imaging correlations. Mult. Scler. J. 2013, 19, 443–450. [Google Scholar] [CrossRef] [PubMed]
- Balk, L.; Steenwijk, M.; Tewarie, P.; Daams, M.; Killestein, J.; Wattjes, M.; Vrenken, H.; Barkhof, F.; Polman, C.; Petzold, A. Bidirectional trans-synaptic axonal degeneration in the visual pathway in multiple sclerosis. J. Neurol. Neurosurg. Psychiatry 2015. [Google Scholar] [CrossRef] [PubMed]
- Saidha, S.; Sotirchos, E.S.; Oh, J.; Syc, S.B.; Seigo, M.A.; Shiee, N.; Eckstein, C.; Durbin, M.K.; Oakley, J.D.; Meyer, S.A. Relationships between retinal axonal and neuronal measures and global central nervous system pathology in multiple sclerosis. JAMA Neurol. 2013, 70, 34–43. [Google Scholar] [CrossRef] [PubMed]
- Mwanza, J.-C.; Oakley, J.D.; Budenz, D.L.; Chang, R.T.; O’Rese, J.K.; Feuer, W.J. Macular ganglion cell–inner plexiform layer: Automated detection and thickness reproducibility with spectral domain–optical coherence tomography in glaucoma. Investig. Ophthalmol. Vis. Sci. 2011, 52, 8323–8329. [Google Scholar] [CrossRef] [PubMed]
- Sepulcre, J.; Murie-Fernandez, M.; Salinas-Alaman, A.; García-Layana, A.; Bejarano, B.; Villoslada, P. Diagnostic accuracy of retinal abnormalities in predicting disease activity in MS. Neurology 2007, 68, 1488–1494. [Google Scholar] [CrossRef] [PubMed]
- Saidha, S.; Sotirchos, E.S.; Ibrahim, M.A.; Crainiceanu, C.M.; Gelfand, J.M.; Sepah, Y.J.; Ratchford, J.N.; Oh, J.; Seigo, M.A.; Newsome, S.D. Relationships of the inner nuclear layer of the retina with clinicoradiologic disease characteristics in multiple sclerosis; aretrospective study. Lancet Neurol. 2012, 11, 963. [Google Scholar] [CrossRef]
- Trip, S.A.; Schlottmann, P.G.; Jones, S.J.; Li, W.-Y.; Garway-Heath, D.F.; Thompson, A.J.; Plant, G.T.; Miller, D.H. Optic nerve atrophy and retinal nerve fibre layer thinning following optic neuritis: Evidence that axonal loss is a substrate of MRI-detected atrophy. Neuroimage 2006, 31, 286–293. [Google Scholar] [CrossRef] [PubMed]
- Trip, S.A.; Schlottmann, P.G.; Jones, S.J.; Li, W.-Y.; Garway-Heath, D.F.; Thompson, A.J.; Plant, G.T.; Miller, D. Optic nerve magnetization transfer imaging and measures of axonal loss and demyelination in optic neuritis. Mult. Scler. 2007, 13, 875–879. [Google Scholar] [CrossRef] [PubMed]
- Smith, S.A.; Williams, Z.R.; Ratchford, J.N.; Newsome, S.D.; Farrell, S.K.; Farrell, J.A.; Gifford, A.; Miller, N.R.; van Zijl, P.C.; Calabresi, P.A. Diffusion tensor imaging of the optic nerve in multiple sclerosis: Association with retinal damage and visual disability. Am. J. Neuroradiol. 2011, 32, 1662–1668. [Google Scholar] [CrossRef] [PubMed]
- Naismith, R.; Xu, J.; Tutlam, N.; Trinkaus, K.; Cross, A.; Song, S.-K. Radial diffusivity in remote optic neuritis discriminates visual outcomes. Neurology 2010, 74, 1702–1710. [Google Scholar] [CrossRef] [PubMed]
- Van Der Walt, A.; Kolbe, S.C.; Wang, Y.E.; Klistorner, A.; Shuey, N.; Ahmadi, G.; Paine, M.; Marriott, M.; Mitchell, P.; Egan, G.F. Optic nerve diffusion tensor imaging after acute optic neuritis predicts axonal and visual outcomes. PLoS ONE 2013, 8, e83825. [Google Scholar] [CrossRef] [PubMed]
- Akaishi, T.; Nakashima, I.; Takeshita, T.; Mugikura, S.; Sato, D.K.; Takahashi, T.; Nishiyama, S.; Kurosawa, K.; Misu, T.; Nakazawa, T. Lesion length of optic neuritis impacts visual prognosis in neuromyelitis optica. J. Neuroimmunol. 2016, 293, 28–33. [Google Scholar] [CrossRef] [PubMed]
- Kupersmith, M.J.; Garvin, M.K.; Wang, J.-K.; Durbin, M.; Kardon, R. Retinal ganglion cell layer thinning within one month of presentation for optic neuritis. Mult. Scler. J. 2016, 22, 641–648. [Google Scholar] [CrossRef] [PubMed]
- Klistorner, A.; Sriram, P.; Vootakuru, N.; Wang, C.; Barnett, M.H.; Garrick, R.; Parratt, J.; Levin, N.; Raz, N.; van der Walt, A. Axonal loss of retinal neurons in multiple sclerosis associated with optic radiation lesions. Neurology 2014, 82, 2165–2172. [Google Scholar] [CrossRef] [PubMed]
- Dasenbrock, H.H.; Smith, S.A.; Ozturk, A.; Farrell, S.K.; Calabresi, P.A.; Reich, D.S. Diffusion tensor imaging of the optic tracts in multiple sclerosis: Association with retinal thinning and visual disability. J. Neuroimag. 2011, 21, e41–e49. [Google Scholar] [CrossRef] [PubMed]
- Plant, G.; Kermode, A.; Turano, G.; Moseley, I.; Miller, D.; MacManus, D.; Halliday, A.; McDonald, W. Symptomatic retrochiasmal lesions in multiple sclerosis clinical features, visual evoked potentials, and magnetic resonance imaging. Neurology 1992, 42, 68. [Google Scholar] [CrossRef] [PubMed]
- Kerrison, J.B.; Flynn, T.; Green, W.R. Retinal pathologic changes in multiple sclerosis. Retina 1994, 14, 445–451. [Google Scholar] [CrossRef] [PubMed]
- Duan, Y.; Liu, Y.; Liang, P.; Jia, X.; Yu, C.; Qin, W.; Sun, H.; Liao, Z.; Ye, J.; Li, K. Comparison of grey matter atrophy between patients with neuromyelitis optica and multiple sclerosis: A voxel-based morphometry study. Eur. J. Radiol. 2012, 81, e110–e114. [Google Scholar] [CrossRef] [PubMed]
- Gabilondo, I.; Martínez-Lapiscina, E.H.; Martínez-Heras, E.; Fraga-Pumar, E.; Llufriu, S.; Ortiz, S.; Bullich, S.; Sepulveda, M.; Falcon, C.; Berenguer, J. Trans-synaptic axonal degeneration in the visual pathway in multiple sclerosis. Ann. Neurol. 2014, 75, 98–107. [Google Scholar] [CrossRef] [PubMed]
- Sinnecker, T.; Oberwahrenbrock, T.; Metz, I.; Zimmermann, H.; Pfueller, C.F.; Harms, L.; Ruprecht, K.; Ramien, C.; Hahn, K.; Brück, W. Optic radiation damage in multiple sclerosis is associated with visual dysfunction and retinal thinning—An ultrahigh-field MR pilot study. Eur. Radiol. 2015, 25, 122–131. [Google Scholar] [CrossRef] [PubMed]
- Manogaran, P.; Vavasour, I.M.; Lange, A.P.; Zhao, Y.; McMullen, K.; Rauscher, A.; Carruthers, R.; Li, D.K.; Traboulsee, A.L.; Kolind, S.H. Quantifying visual pathway axonal and myelin loss in multiple sclerosis and neuromyelitis optica. Neuroimage Clin. 2016, 11, 743–750. [Google Scholar] [CrossRef] [PubMed]
- Von Glehn, F.; Jarius, S.; Lira, R.P.C.; Ferreira, M.C.A.; von Glehn, F.H.R.; E. Castro, S.M.C.; Beltramini, G.C.; Bergo, F.P.; Farias, A.S.; Brandão, C.O. Structural brain abnormalities are related to retinal nerve fiber layer thinning and disease duration in neuromyelitis optica spectrum disorders. Mult. Scler. J. 2014, 20, 1189–1197. [Google Scholar] [CrossRef] [PubMed]


© 2016 by the authors; licensee MDPI, Basel, Switzerland. This article is an open access article distributed under the terms and conditions of the Creative Commons Attribution (CC-BY) license (http://creativecommons.org/licenses/by/4.0/).
Share and Cite
Manogaran, P.; Hanson, J.V.M.; Olbert, E.D.; Egger, C.; Wicki, C.; Gerth-Kahlert, C.; Landau, K.; Schippling, S. Optical Coherence Tomography and Magnetic Resonance Imaging in Multiple Sclerosis and Neuromyelitis Optica Spectrum Disorder. Int. J. Mol. Sci. 2016, 17, 1894. https://doi.org/10.3390/ijms17111894
Manogaran P, Hanson JVM, Olbert ED, Egger C, Wicki C, Gerth-Kahlert C, Landau K, Schippling S. Optical Coherence Tomography and Magnetic Resonance Imaging in Multiple Sclerosis and Neuromyelitis Optica Spectrum Disorder. International Journal of Molecular Sciences. 2016; 17(11):1894. https://doi.org/10.3390/ijms17111894
Chicago/Turabian StyleManogaran, Praveena, James V. M. Hanson, Elisabeth D. Olbert, Christine Egger, Carla Wicki, Christina Gerth-Kahlert, Klara Landau, and Sven Schippling. 2016. "Optical Coherence Tomography and Magnetic Resonance Imaging in Multiple Sclerosis and Neuromyelitis Optica Spectrum Disorder" International Journal of Molecular Sciences 17, no. 11: 1894. https://doi.org/10.3390/ijms17111894
APA StyleManogaran, P., Hanson, J. V. M., Olbert, E. D., Egger, C., Wicki, C., Gerth-Kahlert, C., Landau, K., & Schippling, S. (2016). Optical Coherence Tomography and Magnetic Resonance Imaging in Multiple Sclerosis and Neuromyelitis Optica Spectrum Disorder. International Journal of Molecular Sciences, 17(11), 1894. https://doi.org/10.3390/ijms17111894