
Monitoring of Intracellular Tau Aggregation Regulated by OGA/OGT Inhibitors


 ,
,
Abstract
:
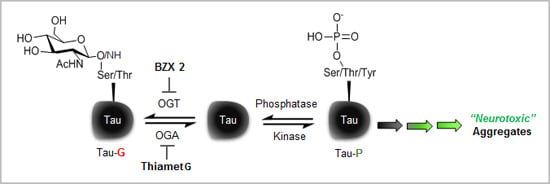
1. Introduction
2. Results and Discussion
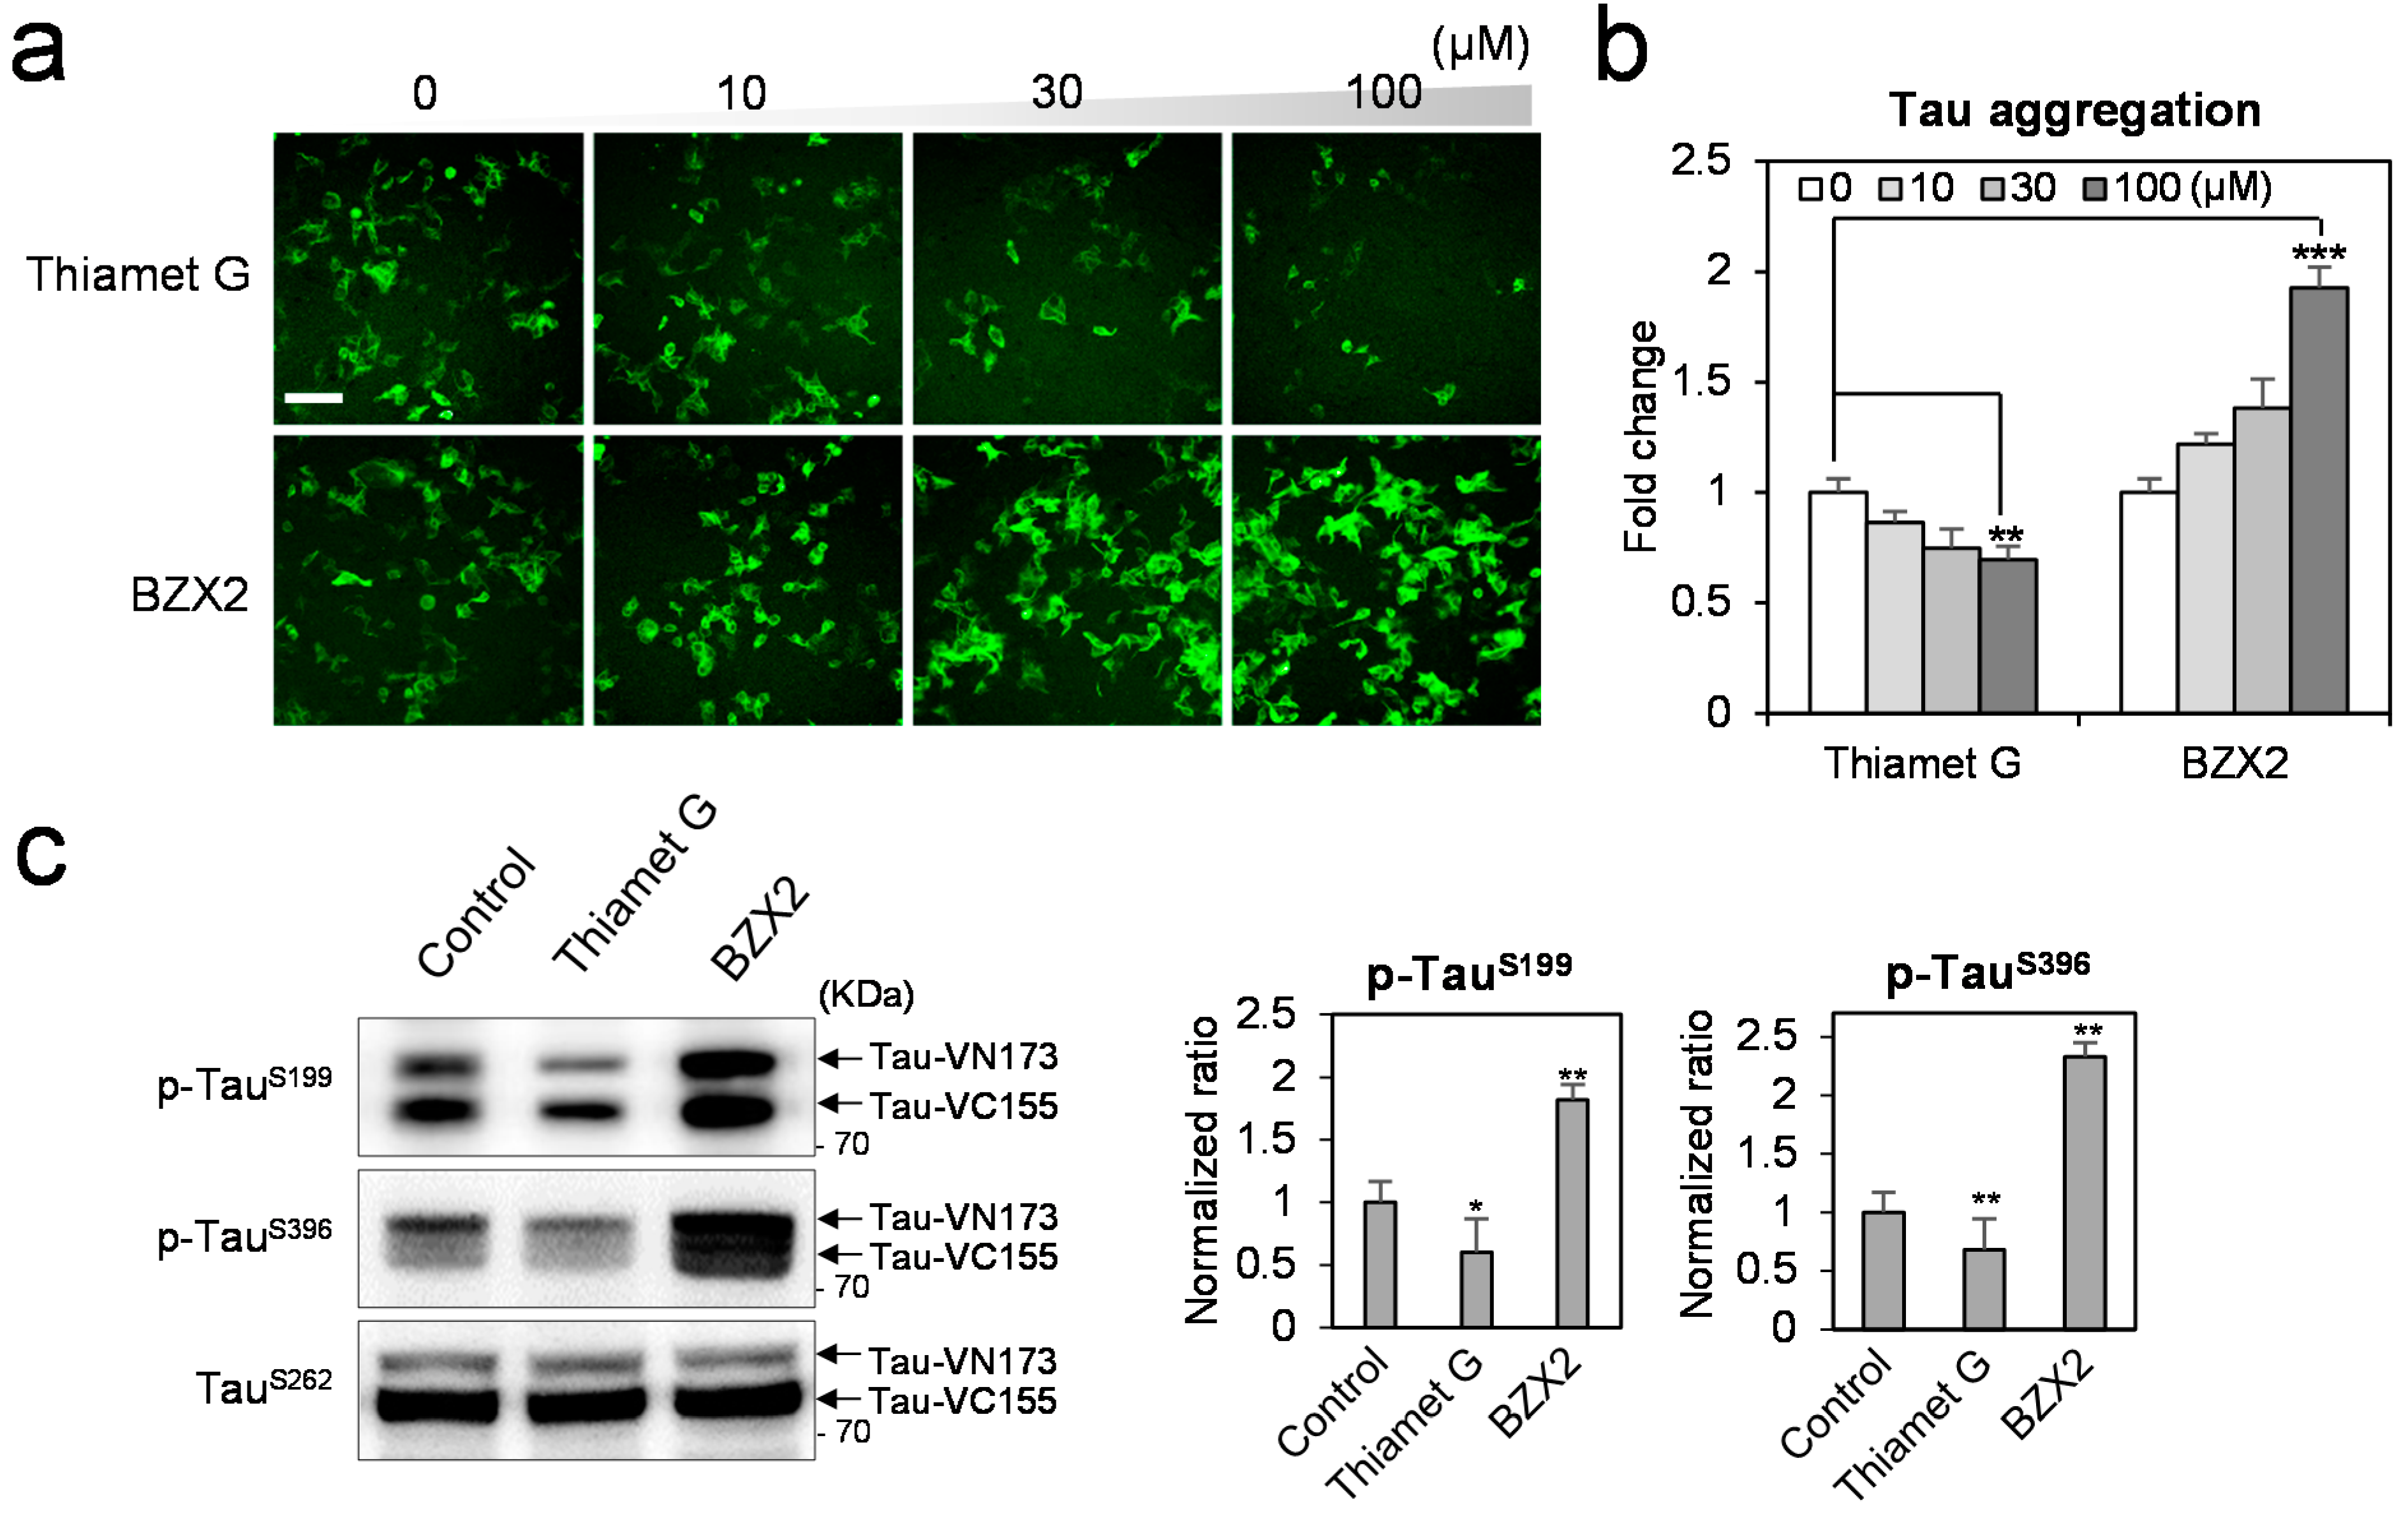
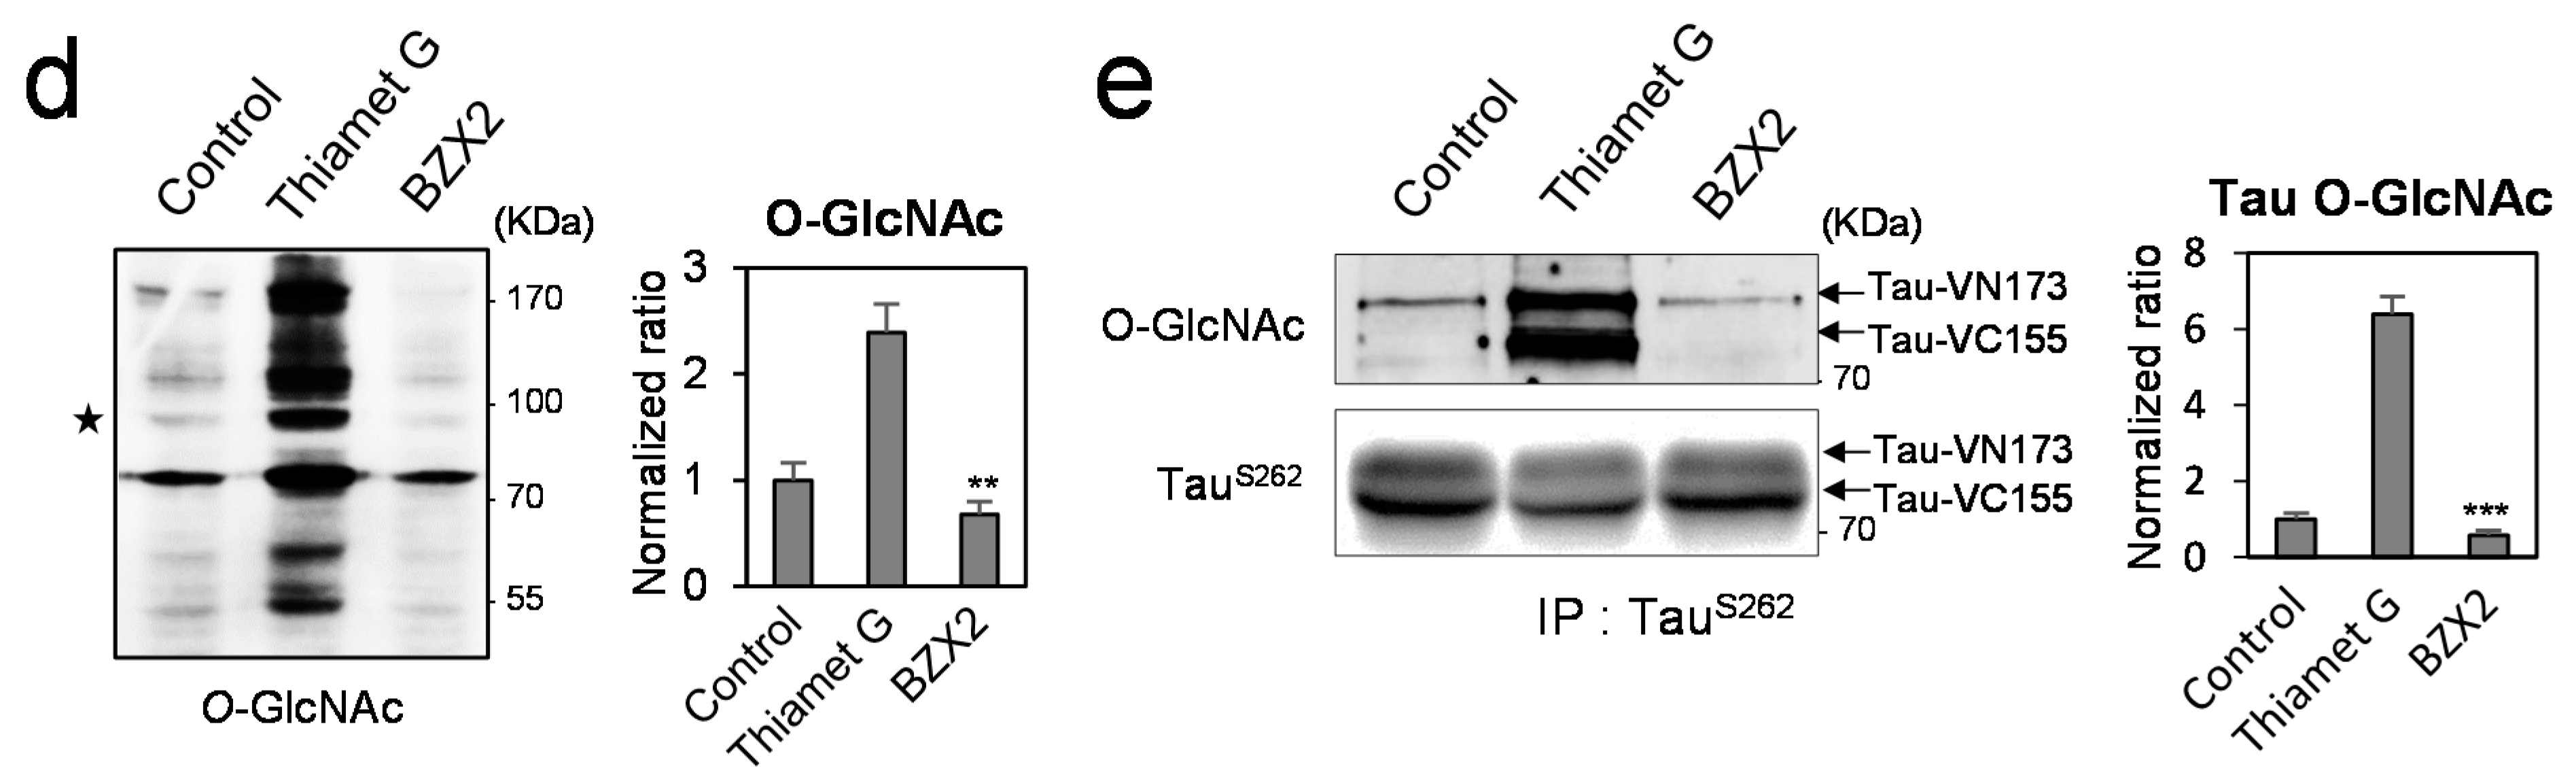
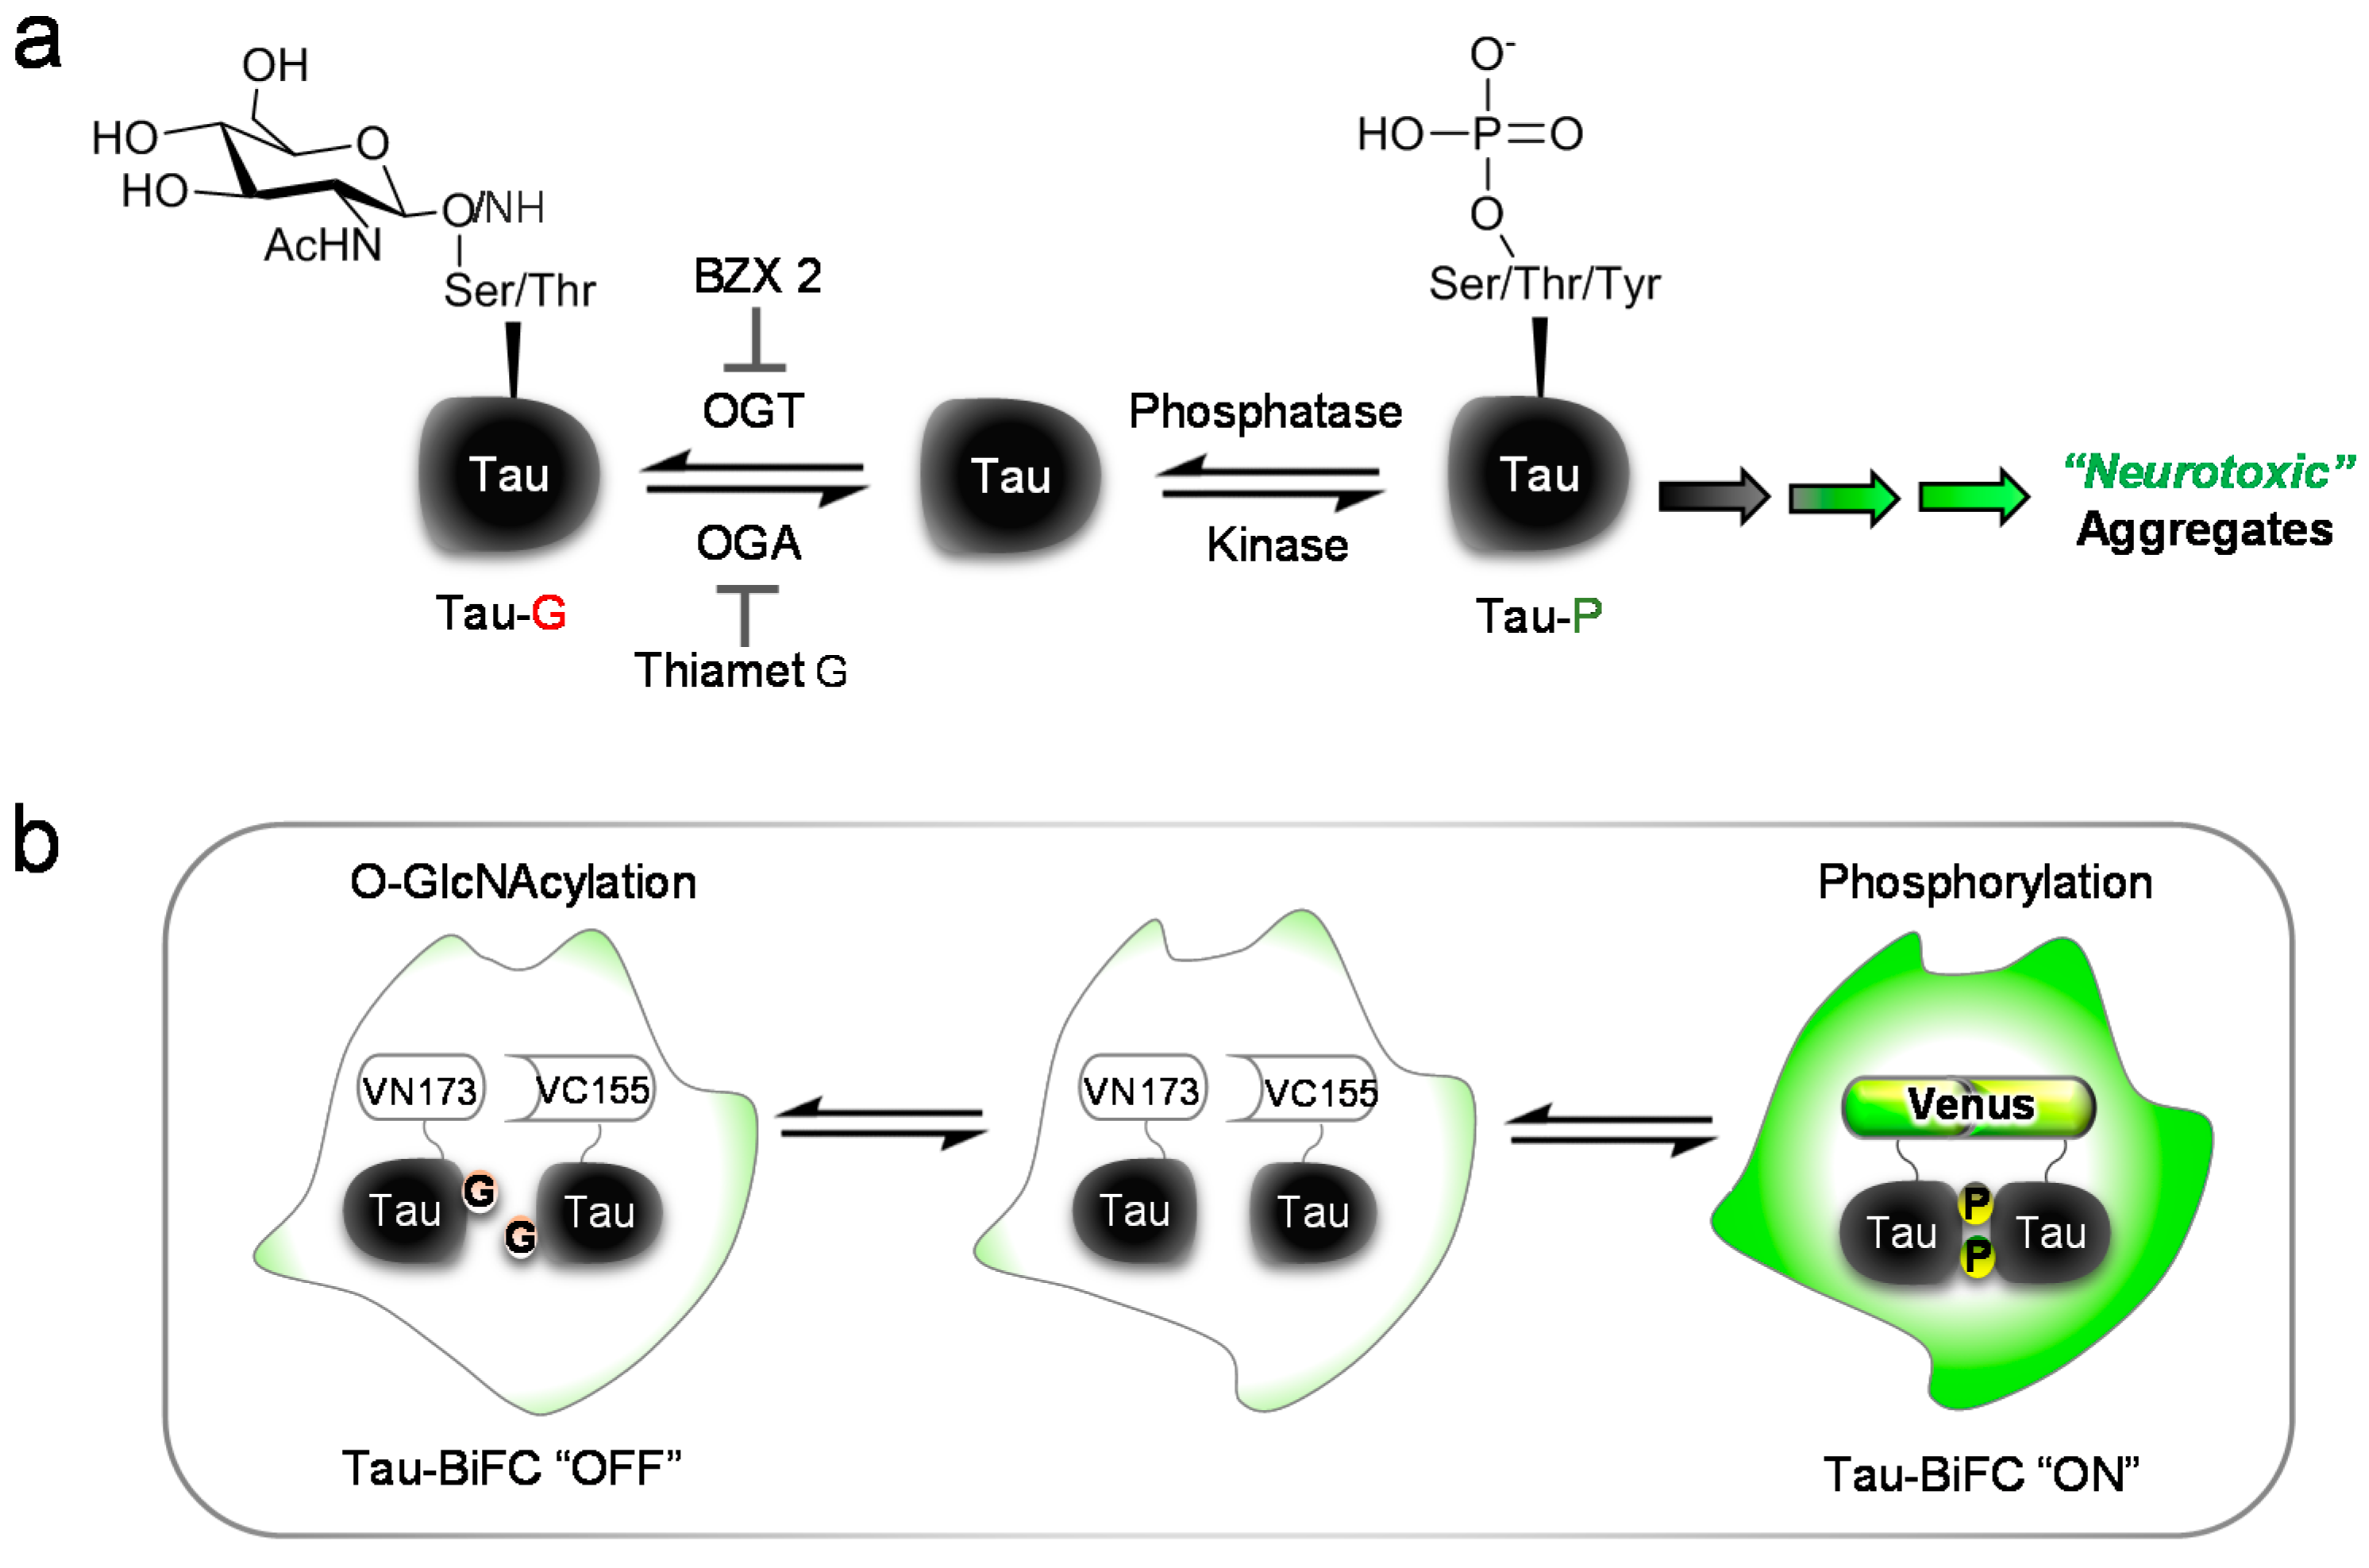
2.1. BZX2 Increases Tau-BiFC (Bimolecular Fluorescence Complementation) Fluorescence Response


2.2. Counter Regulatory Effect of OGA/OGT Inhibitors on Tau Phosphorylation
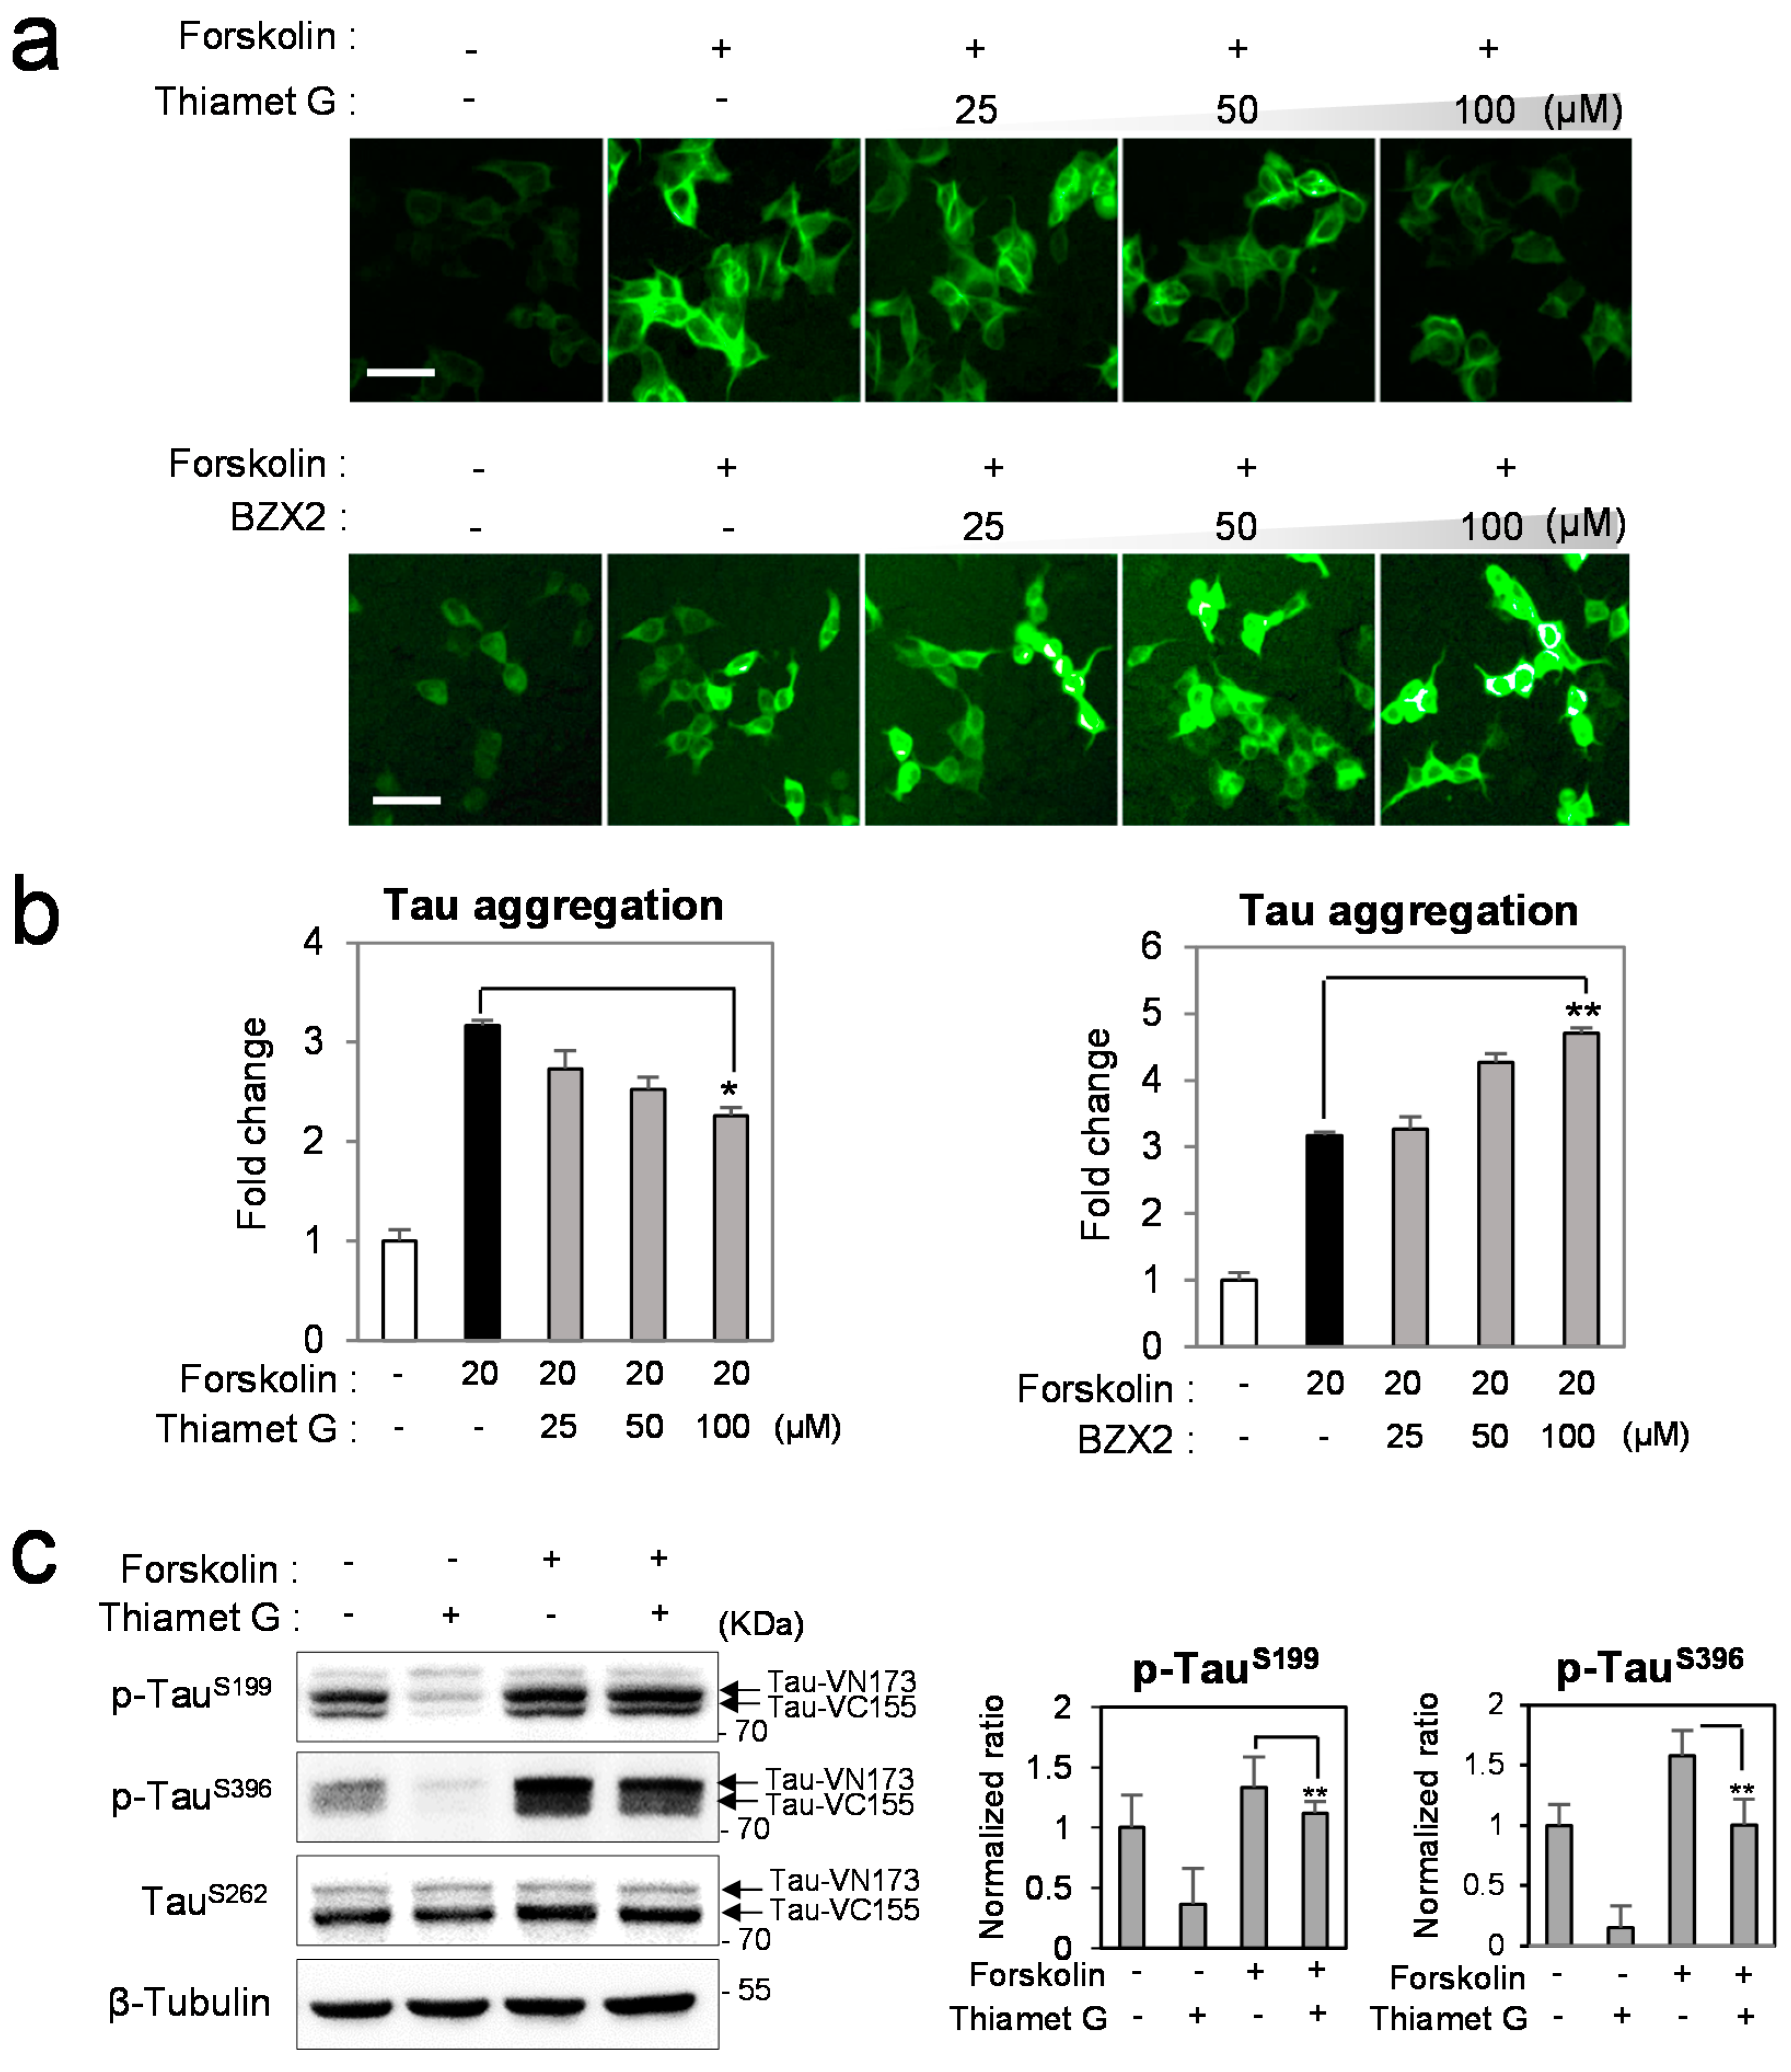

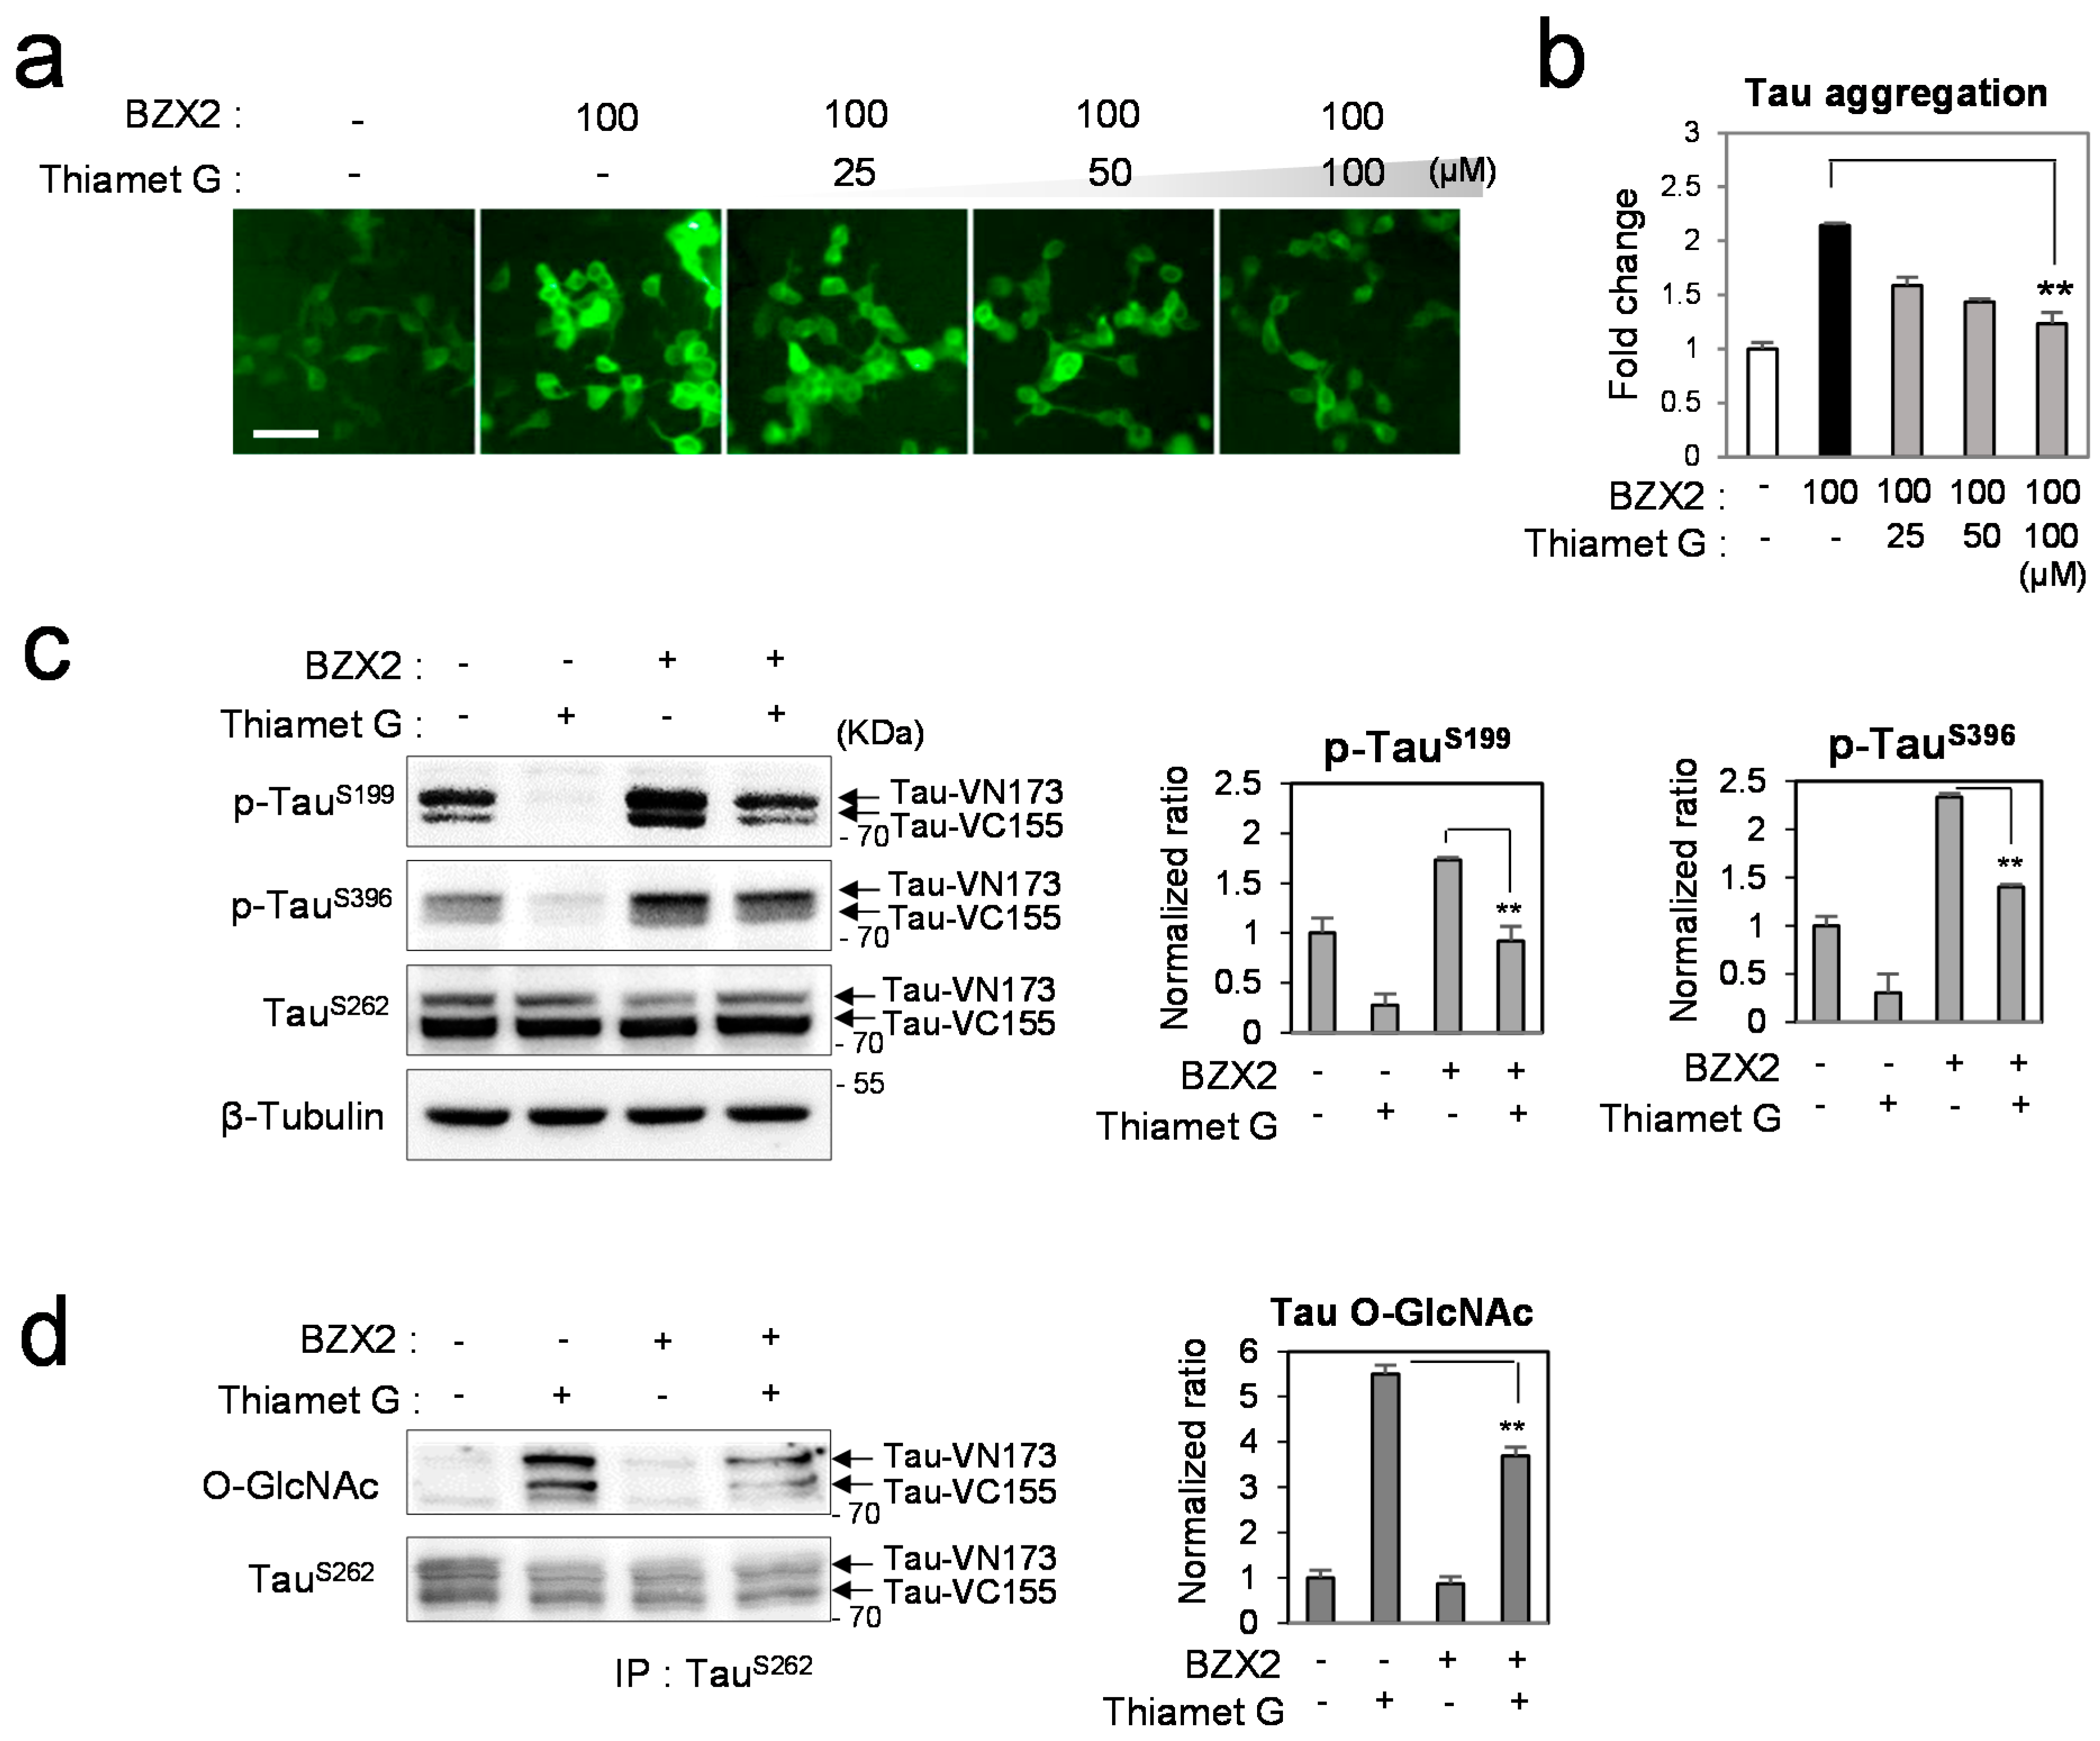
2.3. Thiamet G Decreased BZX2-Induced Tau Aggregation

2.4. Discussion
3. Experimental Section
3.1. Cell Culture
3.2. Cell Treatment and Analysis
3.3. Immunoblot Assay and Analysis
3.4. Immuno-Precipitation
4. Conclusions
Supplementary Materials
Acknowledgments
Author Contributions
Conflicts of Interest
References
- Drechsel, D.N.; Hyman, A.A.; Cobb, M.H.; Kirschner, M.W. Modulation of the dynamic instability of tubulin assembly by the microtubule-associated protein tau. Mol. Biol. Cell 1992, 3, 1141–1154. [Google Scholar] [CrossRef] [PubMed]
- Goode, B.L.; Feinstein, S.C. Identification of a novel microtubule binding and assembly domain in the developmentally regulated inter-repeat region of tau. J. Cell Biol. 1994, 124, 769–782. [Google Scholar] [CrossRef] [PubMed]
- Minoura, I.; Muto, E. Dielectric measurement of individual microtubules using the electroorientation method. Biophys. J. 2006, 90, 3739–3748. [Google Scholar] [CrossRef] [PubMed]
- Mukrasch, M.D.; Biernat, J.; von Bergen, M.; Griesinger, C.; Mandelkow, E.; Zweckstetter, M. Sites of tau important for aggregation populate β-structure and bind to microtubules and polyanions. J. Biol. Chem. 2005, 280, 24978–24986. [Google Scholar] [CrossRef] [PubMed]
- Lindwall, G.; Cole, R.D. Phosphorylation affects the ability of tau protein to promote microtubule assembly. J. Biol. Chem. 1984, 259, 5301–5305. [Google Scholar] [PubMed]
- Mazanetz, M.P.; Fischer, P.M. Untangling tau hyperphosphorylation in drug design for neurodegenerative diseases. Nat. Rev. Drug Discov. 2007, 6, 464–479. [Google Scholar] [CrossRef] [PubMed]
- Mullane, K.; Williams, M. Alzheimer’s therapeutics: Continued clinical failures question the validity of the amyloid hypothesis—But what lies beyond? Biochem. Pharmacol. 2013, 85, 289–305. [Google Scholar] [CrossRef] [PubMed]
- Liu, F.; Iqbal, K.; Grundke-Iqbal, I.; Hart, G.W.; Gong, C.-X. O-GlcNAcylation regulates phosphorylation of tau: A mechanism involved in Alzheimer’s disease. Proc. Natl. Acad. Sci. USA 2004, 101, 10804–10809. [Google Scholar] [PubMed]
- Liu, F.; Shi, J.; Tanimukai, H.; Gu, J.; Grundke-Iqbal, I.; Iqbal, K.; Gong, C.-X. Reduced O-GlcNAcylation links lower brain glucose metabolism and tau pathology in Alzheimer’s disease. Brain 2009. [Google Scholar] [CrossRef] [PubMed]
- Yuzwa, S.A.; Macauley, M.S.; Heinonen, J.E.; Shan, X.; Dennis, R.J.; He, Y.; Vocadlo, D.J. A potent mechanism-inspired O-GlcNAcase inhibitor that blocks phosphorylation of tau in vivo. Nat. Chem. Biol. 2008, 4, 483–490. [Google Scholar] [CrossRef] [PubMed]
- Yuzwa, S.A.; Shan, X.; Macauley, M.S.; Clark, T.; Skorobogatko, Y.; Vosseller, K.; Vocadlo, D.J. Increasing O-GlcNAc slows neurodegeneration and stabilizes tau against aggregation. Nat. Chem. Biol. 2012, 8, 393–399. [Google Scholar] [CrossRef] [PubMed]
- Jiang, J.; Lazarus, M.B.; Pasquina, L.; Sliz, P.; Walker, S. A neutral diphosphate mimic crosslinks the active site of human O-GlcNAc transferase. Nat. Chem. Biol. 2012, 8, 72–77. [Google Scholar] [CrossRef] [PubMed]
- Tak, H.; Haque, M.M.; Kim, M.J.; Lee, J.H.; Baik, J.-H.; Kim, Y.S.; Kim, D.J.; Grailhe, R.; Kim, Y.K. Bimolecular fluorescence complementation; lighting-up tau-tau interaction in living cells. PLoS ONE 2013, 8, e81682. [Google Scholar] [CrossRef] [PubMed]
- Han, D.H.; Na, H.K.; Choi, W.H.; Lee, J.H.; Kim, Y.K.; Won, C.; Lee, M.J. Direct cellular delivery of human proteasomes to delay tau aggregation. Nat. Commun. 2014. [Google Scholar] [CrossRef] [PubMed]
- Liu, S.J.; Zhang, J.Y.; Li, H.L.; Fang, Z.Y.; Wang, Q.; Deng, H.M.; Wang, J.Z. Tau becomes a more favorable substrate for GSK-3 when it is prephosphorylated by PKA in rat brain. J. Biol. Chem. 2004, 279, 50078–50088. [Google Scholar] [CrossRef] [PubMed]
- Arnold, C.S.; Cole, R.N.; Johnson, G.V.W.; Hart, G.W. Tau is a glycoprotein. Soc. Neurosci. Abstr. 1994, 20, 1035. [Google Scholar]
- Arnold, C.S.; Johnson, G.V.; Cole, R.N.; Dong, D.L.Y.; Lee, M.; Hart, G.W. The microtubule-associated protein tau is extensively modified with O-linked N-acetylglucosamine. J. Biol. Chem. 1996, 271, 28741–28744. [Google Scholar] [PubMed]
- Kalaria, R.N.; Harik, S.I. Reduced glucose transporter at the blood-brain barrier and in cerebral cortex in Alzheimer disease. J. Neurochem. 1989, 53, 1083–1088. [Google Scholar] [CrossRef] [PubMed]
- Kennedy, A.M.; Frackowiak, R.S.; Newman, S.K.; Bloomfield, P.M.; Seaward, J.; Roques, P.; Rossor, M.N. Deficits in cerebral glucose metabolism demonstrated by positron emission tomography in individuals at risk of familial Alzheimer’s disease. Neurosci. Lett. 1995, 186, 17–20. [Google Scholar] [CrossRef]
- Keller, J.N.; Pang, Z.; Geddes, J.W.; Begley, J.G.; Germeyer, A.; Waeg, G.; Mattson, M.P. Impairment of glucose and glutamate transport and induction of mitochondrial oxidative stress and dysfunction in synaptosomes by amyloid β-peptide: Role of the lipid peroxidation product 4-hydroxynonenal. J. Neurochem. 1997, 69, 273–284. [Google Scholar] [CrossRef] [PubMed]
- Zeidan, Q.; Hart, G.W. The intersections between O-GlcNAcylation and phosphorylation: Implications for multiple signaling pathways. J. Cell Sci. 2010, 123, 13–22. [Google Scholar] [CrossRef] [PubMed]
- Slawson, C.; Lakshmanan, T.; Knapp, S.; Hart, G.W. A mitotic GlcNAcylation/phosphorylation signaling complex alters the posttranslational state of the cytoskeletal protein vimentin. Mol. Biol. Cell 2008, 19, 4130–4140. [Google Scholar] [CrossRef] [PubMed]
- Wells, L.; Kreppel, L.K.; Comer, F.I.; Wadzinski, B.E.; Hart, G.W. O-GlcNAc transferase is in a functional complex with protein phosphatase 1 catalytic subunits. J. Biol. Chem. 2004, 279, 38466–38470. [Google Scholar] [CrossRef] [PubMed]
© 2015 by the authors; licensee MDPI, Basel, Switzerland. This article is an open access article distributed under the terms and conditions of the Creative Commons Attribution license (http://creativecommons.org/licenses/by/4.0/).
Share and Cite
Lim, S.; Haque, M.M.; Nam, G.; Ryoo, N.; Rhim, H.; Kim, Y.K. Monitoring of Intracellular Tau Aggregation Regulated by OGA/OGT Inhibitors. Int. J. Mol. Sci. 2015, 16, 20212-20224. https://doi.org/10.3390/ijms160920212
Lim S, Haque MM, Nam G, Ryoo N, Rhim H, Kim YK. Monitoring of Intracellular Tau Aggregation Regulated by OGA/OGT Inhibitors. International Journal of Molecular Sciences. 2015; 16(9):20212-20224. https://doi.org/10.3390/ijms160920212
Chicago/Turabian StyleLim, Sungsu, Md. Mamunul Haque, Ghilsoo Nam, Nayeon Ryoo, Hyewhon Rhim, and Yun Kyung Kim. 2015. "Monitoring of Intracellular Tau Aggregation Regulated by OGA/OGT Inhibitors" International Journal of Molecular Sciences 16, no. 9: 20212-20224. https://doi.org/10.3390/ijms160920212
APA StyleLim, S., Haque, M. M., Nam, G., Ryoo, N., Rhim, H., & Kim, Y. K. (2015). Monitoring of Intracellular Tau Aggregation Regulated by OGA/OGT Inhibitors. International Journal of Molecular Sciences, 16(9), 20212-20224. https://doi.org/10.3390/ijms160920212