
Expression of the SIRT2 Gene and Its Relationship with Body Size Traits in Qinchuan Cattle (Bos taurus)

Abstract
:1. Introduction
2. Results and Discussion
2.1. Molecular Cloning and Sequence of the Bovine SIRT2 Gene

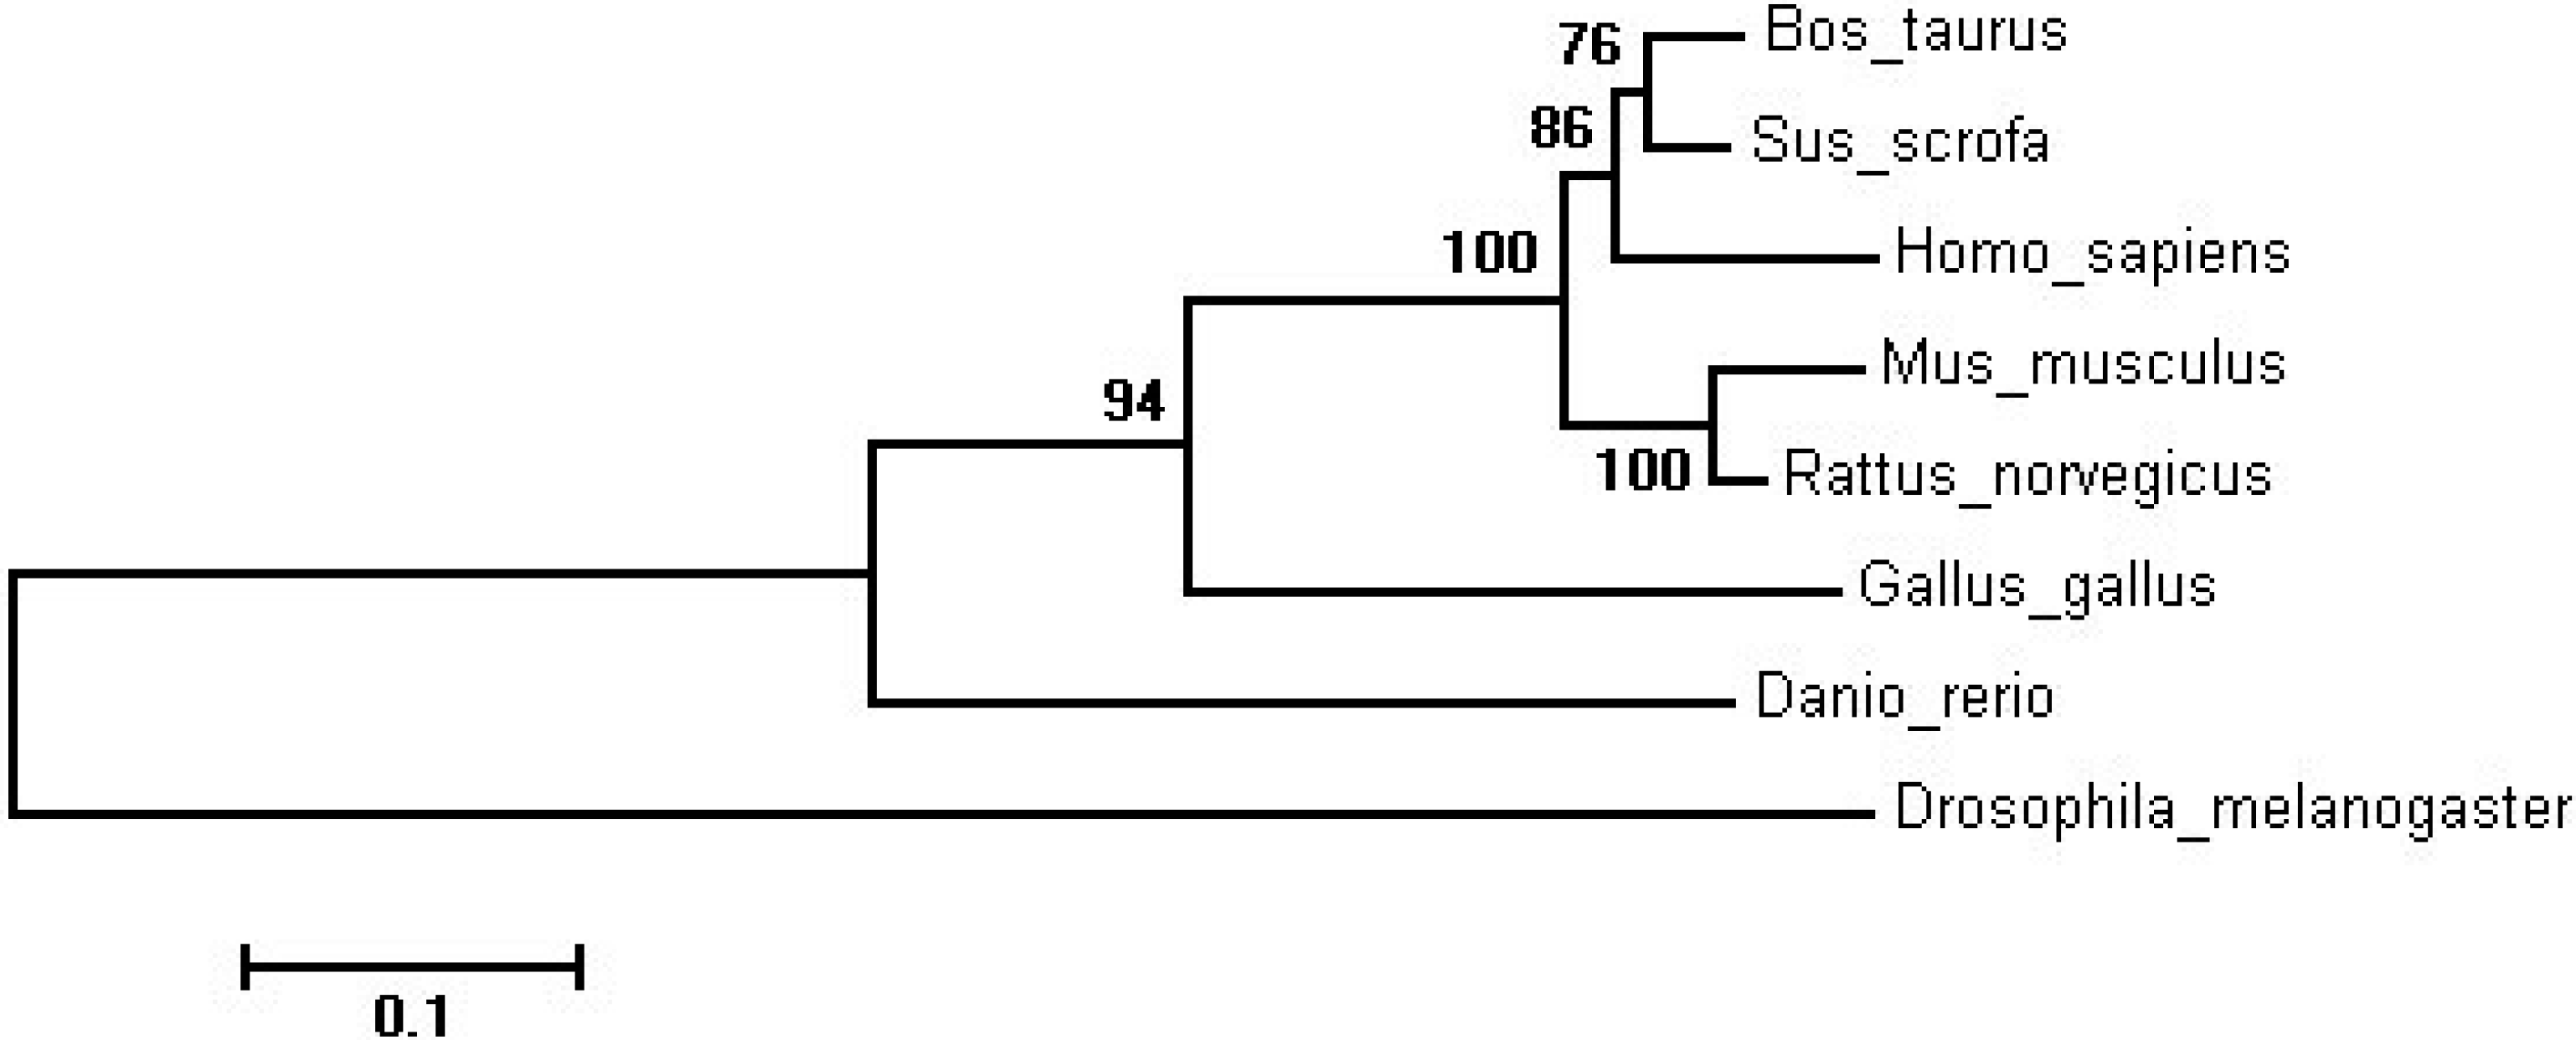
| Species | GenBank Accession | Similarity |
|---|---|---|
| Sus scrofa | NP_001107743.1 | 93.30% |
| Homo sapiens | NP_036369.2 | 88.92% |
| Mus musculus | NP_001116237.1 | 85.27% |
| Rattus norvegicus | NP_001008369.1 | 88.00% |
| Gallus gallus | NP_001088636.1 | 68.63% |
| Drosophila melanogaster | NP_001287422.1 | 49.86% |
| Danio rerio | NP_955890.1 | 61.93% |
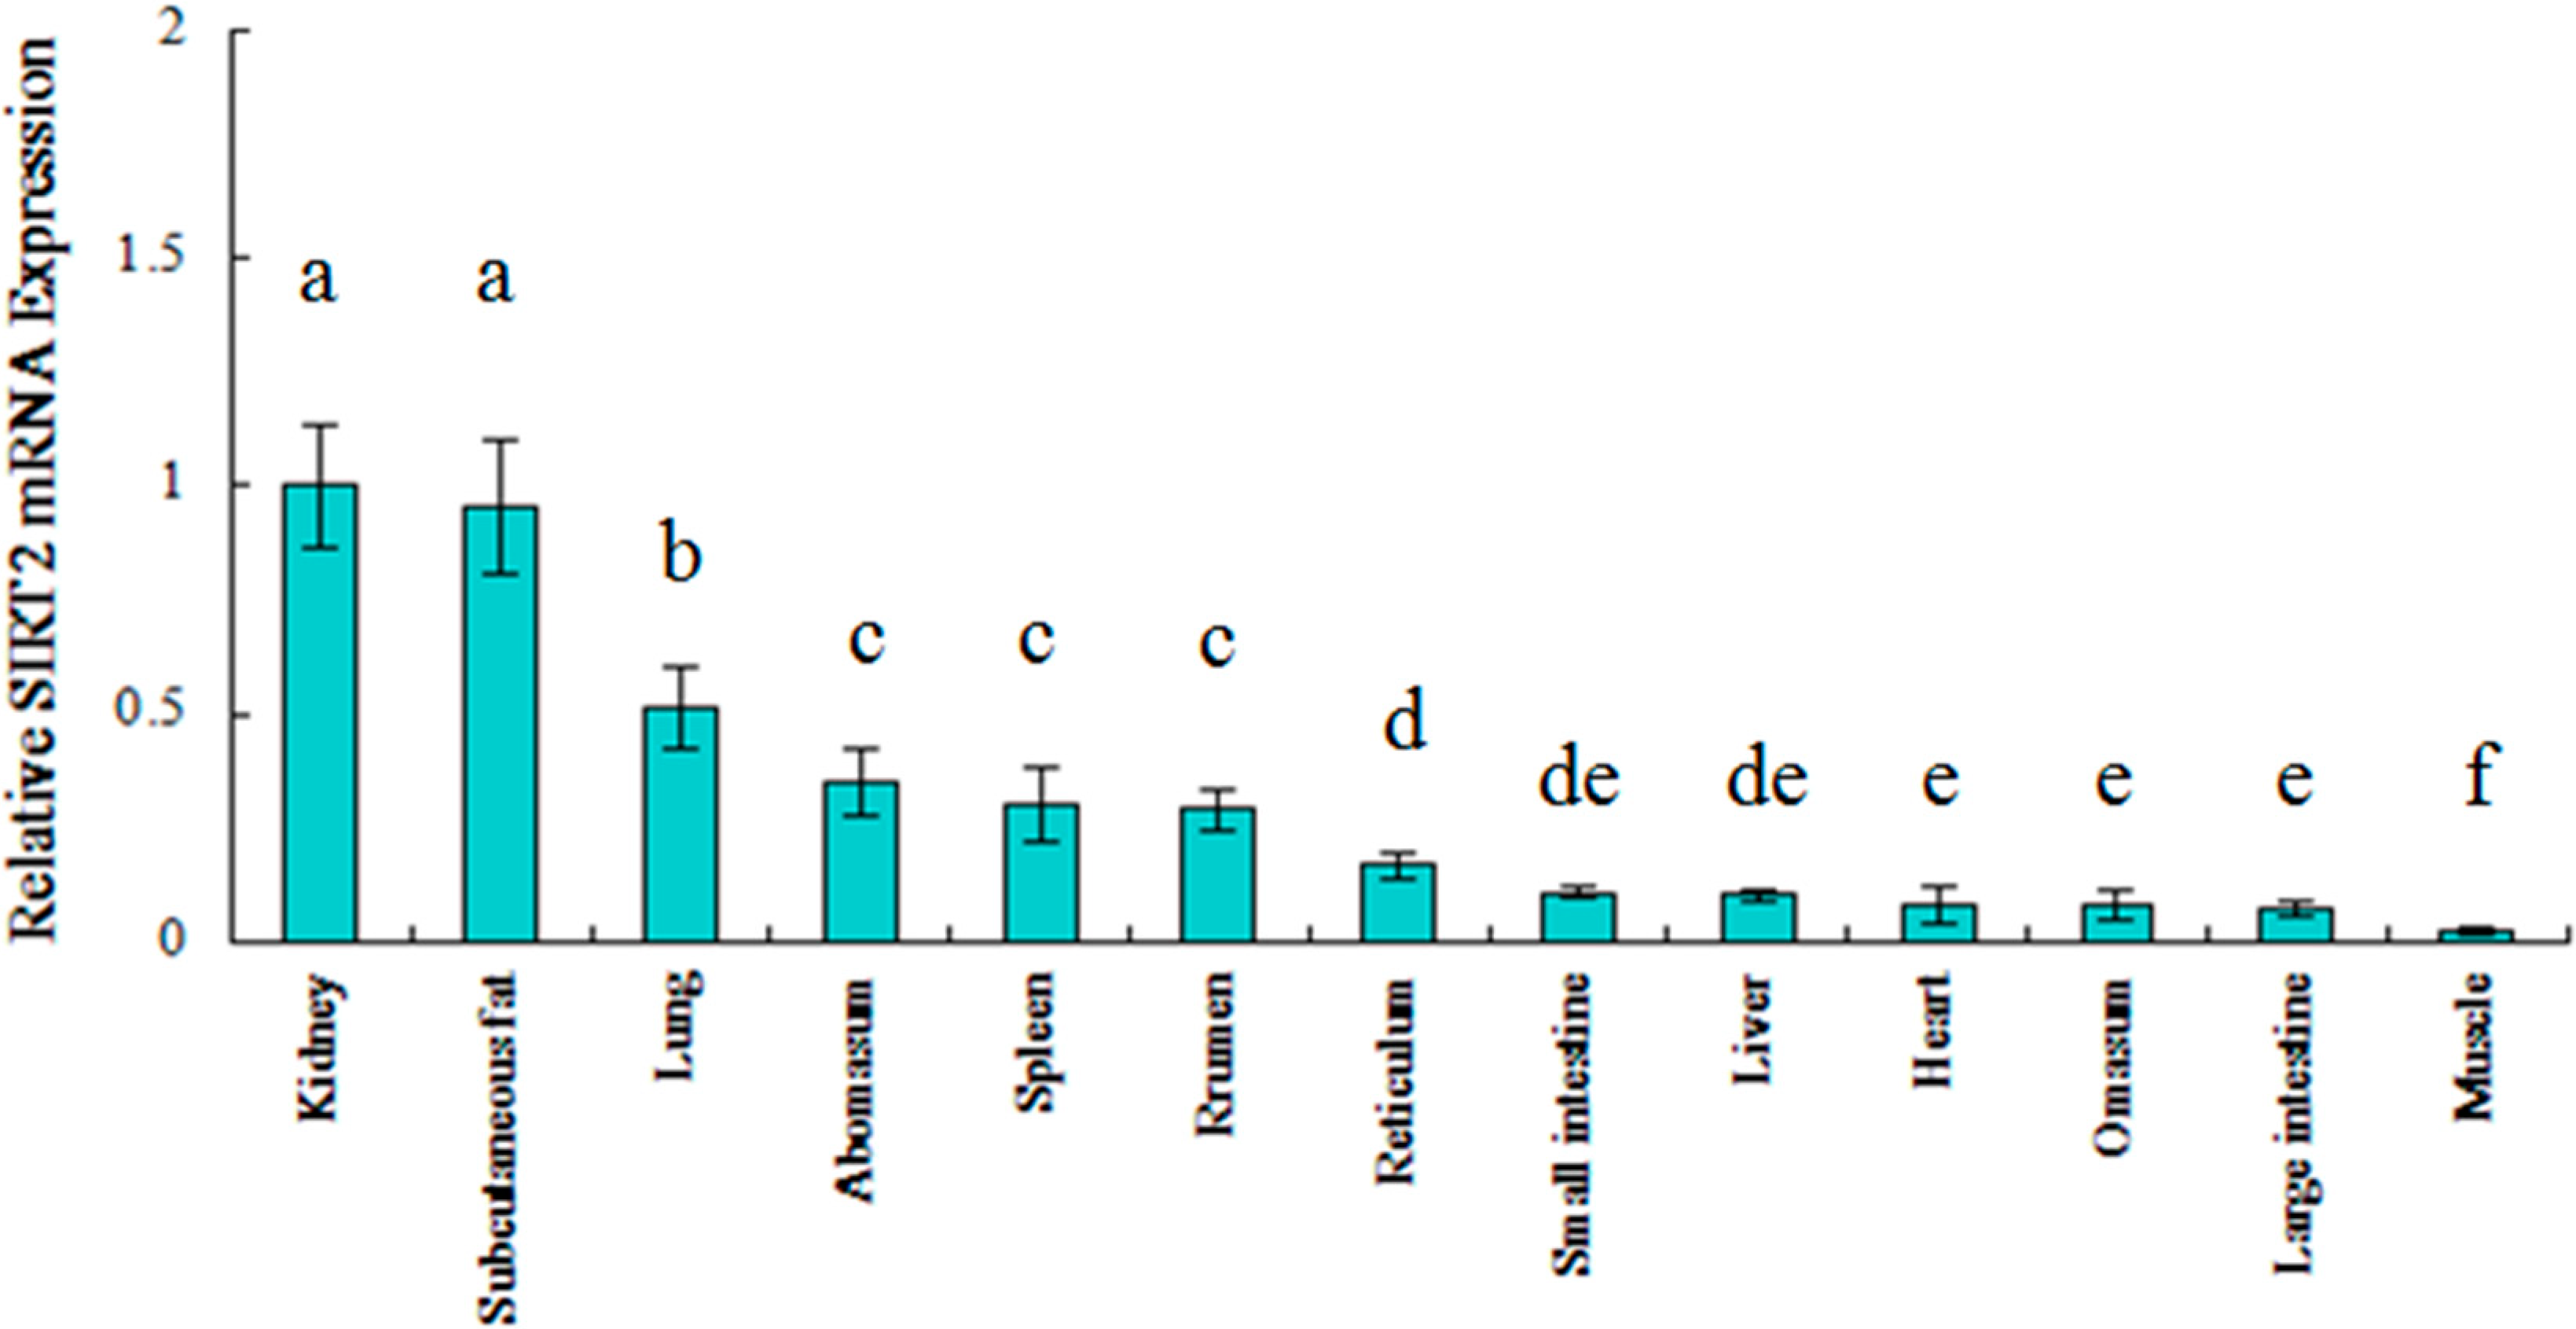
2.2. Ontogenic Expression of SIRT2 in Qinchuan Cattle
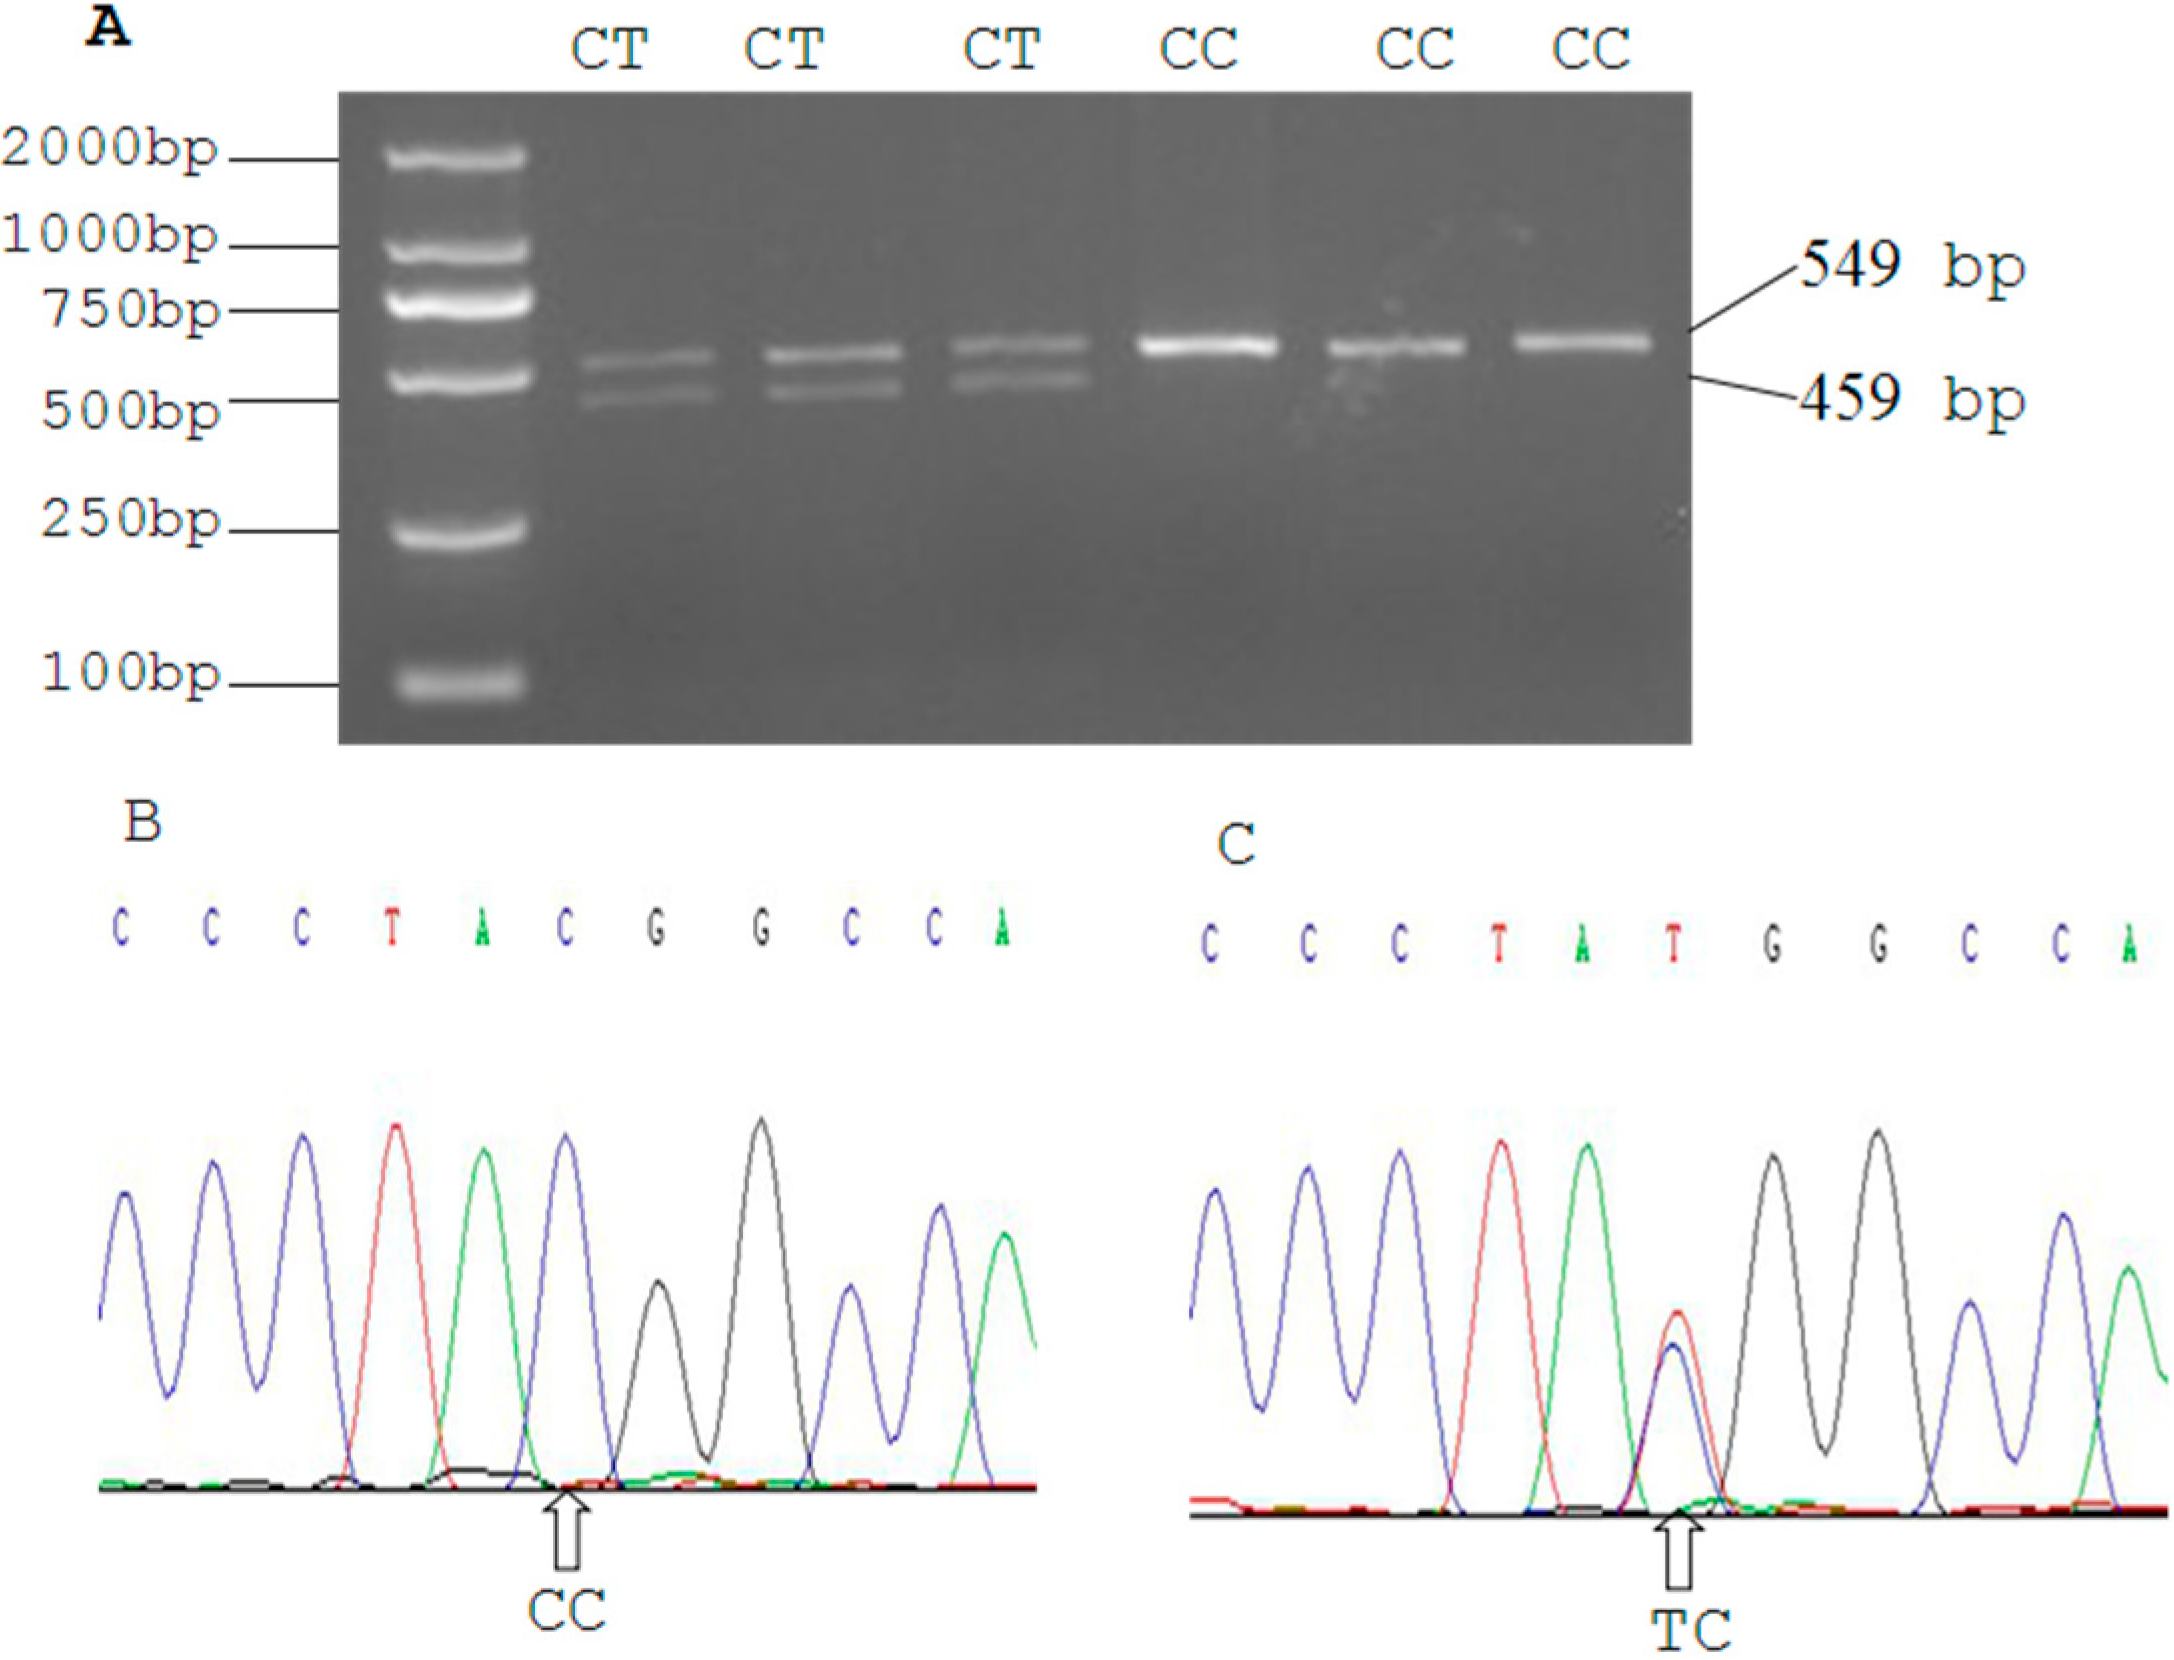
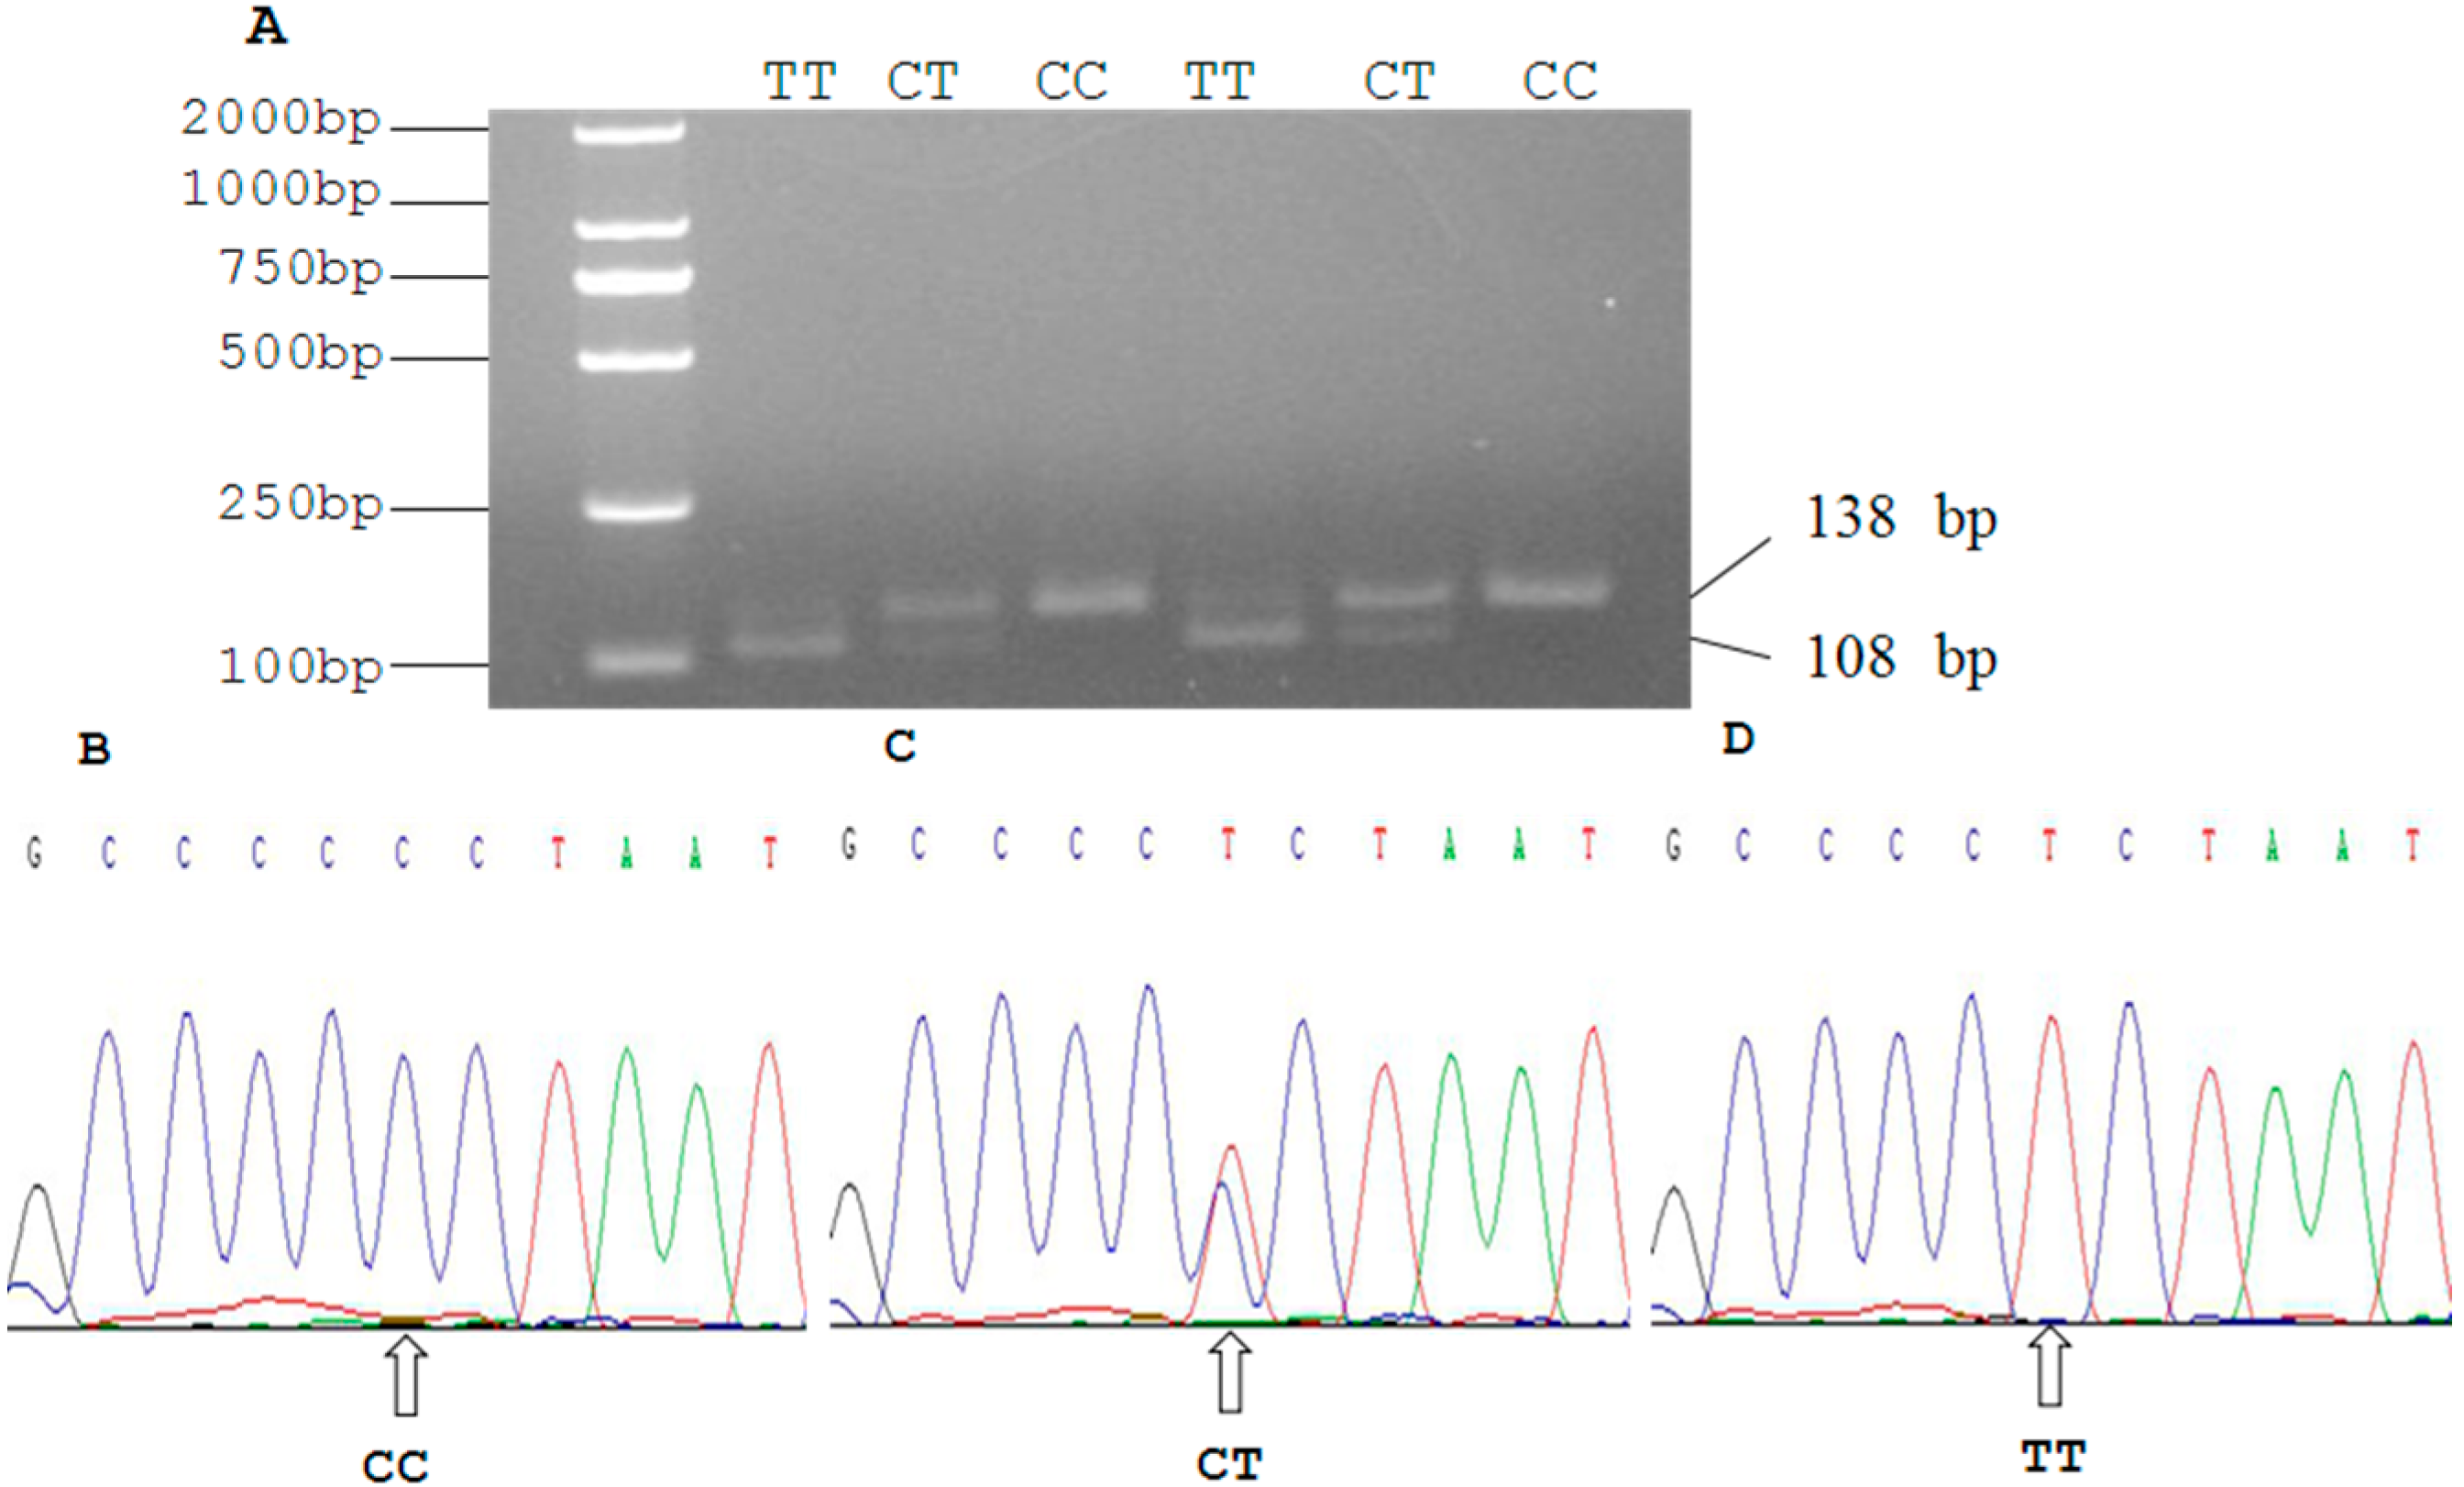
2.3. Genetic Polymorphism of Qinchuan Cattle SIRT2 and χ2 Test

| Locus | Genotypic Frequencies (N) | Total | Allelic Frequencies | χ2 (HWE) | PIC | He | Ne | |||
|---|---|---|---|---|---|---|---|---|---|---|
| CC | CT | TT | C | T | ||||||
| g.19501 C > T | 0.7991 | 0.2009 | 0 | 468 | 0.8996 | 0.1004 | 5.8328 | 0.1644 | 0.1807 | 1.2205 |
| g.19518 C > T | 0.4103 | 0.4316 | 0.1581 | 468 | 0.6261 | 0.3739 | 2.8581 | 0.3586 | 0.4682 | 1.8805 |
2.4. Effects of Single Marker on Body Size Traits
| Locus | Genotypes | BL (cm) | WH (cm) | RL (cm) | HW (cm) | CD (cm) | CC (cm) | PBW (cm) | BF (cm) | ULA (cm2) |
|---|---|---|---|---|---|---|---|---|---|---|
| g.19501 C > T | CC (374) | 132.608 ± 0.478 a | 119.222 ± 0.481 | 41.664 ± 0.201 | 38.286 ± 0.258 | 58.345 ± 0.315 | 161.993 ± 0.734 | 18.409 ± 0.142 | 0.873 ± 0.014 | 45.188 ± 0.673 |
| CT (94) | 129.210 ± 0.721 b | 117.329 ± 0.770 | 41.287 ± 0.351 | 36.968 ± 0.324 | 57.159 ± 0.447 | 158.596 ± 0.959 | 17.776 ± 0283 | 0.860 ± 0.023 | 42.343 ± 0.962 | |
| P-value | 0.0022 | 0.0593 | 0.3071 | 0.0204 | 0.1051 | 0.0193 | 0.0387 | 0.3685 | 0.0367 | |
| g.19518 C > T | CC (192) | 130.844 ± 0.672 | 118.612 ± 0.671 | 41.099 ± 0.278 b | 37.177 ± 0.359 | 57.419 ± 0.440 | 159.276 ± 1.023 | 17.849 ± 0.197 | 0.850 ± 0.019 | 44.600 ± 2.162 |
| CT (202) | 132.810 ± 0.655 | 118.381 ± 0.654 | 41.683 ± 0.271 | 38.649 ± 0.350 | 58.369 ± 0.429 | 162.552 ± 0.998 | 18.629 ± 0.193 | 0.883 ± 0.021 | 45.017 ± 2.246 | |
| TT (74) | 133.682 ± 1.082 | 120.696 ± 0.882 | 42.608 ± 0.447 a | 38.500 ± 0.578 | 59.176 ± 0.522 | 163.203 ± 1.648 | 18.459 ± 0.318 | 0.890 ± 0.031 | 43.566 ± 1.554 | |
| P-value | 0.0175 | 0.1004 | 0.0025 | 0.0031 | 0.0267 | 0.0127 | 0.0380 | 0.2007 | 0.2068 |
2.5. Linkage Disequilibrium (LD) and Haplotype Analysis
| Haplotype | g.19501 C > T | g.19518 C > T | Frequency |
|---|---|---|---|
| Hap1 | C | C | 0.621 |
| Hap2 | C | T | 0.279 |
| Hap3 | T | T | 0.095 |
| Hap4 | T | C | 0.005 |
2.6. Effects of Haplotype Combinations on Body Size Traits
| Combined Genotypes | Body Measurement | Meat Quality Trait | |||||||
|---|---|---|---|---|---|---|---|---|---|
| BL (cm) | WH (cm) | RL (cm) | HW (cm) | CD (cm) | CC (cm) | PBW (cm) | BF (cm) | ULA (cm2) | |
| Hap1/1 (188) | 131.016 ± 0.658 b | 118.332 ± 0.674 | 41.309 ± 0.281 | 37.319 ± 0.357 | 57.582 ± 0.440 | 159.297 ± 1.016 | 17.899 ± 0.197 b | 0.851 ± 0.020 | 44.054 ± 1.152 |
| Hap1/2 (168) | 133.717 ± 0.696 a,b | 119.884 ± 0.713 a | 41.851 ± 0.297 | 39.089 ± 0.377 a | 58.919 ± 0.465 | 164.354 ± 1.075 a | 18.863 ± 0.209 | 0.891 ± 0.021 | 46.341 ± 1.073 |
| Hap1/3 (34) | 125.359 ± 1.520 c | 113.779 ± 1.584 b | 40.294 ± 0.660 | 35.735 ± 0.839 b | 55.588 ± 0.881 b | 153.970 ± 2.389 b | 17.088 ± 0.464 b | 0.811 ± 0.046 | 40.579 ± 1.741 |
| Hap2/2 (18) | 138.868 ± 1.776 a | 122.333 ± 1.399 a | 43.667 ± 0.907 | 40.726 ± 0.559 a | 60.944 ± 0.824 a | 168.121 ± 2.283 a | 19.500 ± 0.638 a | 0.927 ± 0.063 | 46.266 ± 1.271 |
| Hap2/3 (56) | 132.009 ± 1.204 a,b | 119.438 ± 1.234 | 41.857 ± 0.514 | 37.788 ± 0.653 | 58.161 ± 0.806 | 161.464 ± 1.861 | 18.161 ± 0.362 | 0.898 ± 0.036 | 43.347 ± 2.271 |
| P-value | 0.0004 | 0.0005 | 0.0028 | 0.0024 | 0.0023 | 0.0084 | 0.0019 | 0.1142 | 0.0192 |
3. Experimental Section
3.1. Bioinformatic Study
3.2. Collection of RNA Samples
3.3. RNA Purification and cDNA Synthesis
3.4. SYBR Green RT-PCR Analysis of Expression Patterns
| Name | Function | Primer Sequence (5' to 3') | Tm (°C) | Product Length | Amplified Region |
|---|---|---|---|---|---|
| SIRT2 | RT-PCR | CAACCTGGAGAAATACCGTCTT | 61.0 | 166 bp | 400–565 |
| CAGTCCTTTTTCCTTCAGCAG | |||||
| β-actin | Reference | CACCAACTGGGACGACAT | 61.0 | 202 bp | 320–521 |
| ATACAGGGACAGCACAGC | |||||
| RPS9 | Reference | CCTCGACCAAGAGCTGAAG | 61.0 | 64 bp | 128–191 |
| CCTCCAGACCTCACGTTTGTTC | |||||
| GAPDH | Reference | CCAACGTGTCTGTTGTGGAT | 61.0 | 80 bp | 778–857 |
| CTGCTTCACCACCTTCTTGA | |||||
| Primer A | 3'UTR region amplification | ACCCCTGACCTCACCAAAT | 56.5 | 549 bp | 19411–19959 |
| GCACCTTTCAGCACTCTTC | |||||
| Primer B | 3'UTR region amplification | ACCCCTGACCTCACCAAAT | 62.3 | 138 bp | 19411–19548 |
| CCTGTGGCCCCCTGAGCAGTTAGAGTCTAG |
3.5. Animal Source, Data Collection and Genomic DNA Isolation
3.6. PCR Amplification and Sequencing
3.7. DNA Pooling, PCR-RFLP and DNA Sequencing
3.8. Statistical Analysis
4. Conclusions
Acknowledgments
Author Contributions
Conflicts of Interest
References
- Neugebauer, R.C.; Sippl, W.; Jung, M. Inhibitors of NAD+ dependent histone deacetylases (sirtuins). Curr. Pharm. Des. 2008, 14, 562–573. [Google Scholar] [CrossRef] [PubMed]
- Vassilopoulos, A.; Fritz, K.S.; Petersen, D.R.; Gius, D. The human sirtuin family: Evolutionary divergences and functions. Hum. Genomics 2011, 5, 485–496. [Google Scholar] [CrossRef] [PubMed]
- Peck, B.; Chen, C.Y.; Ho, K.K.; di Fruscia, P.; Myatt, S.S.; Coombes, R.C.; Fuchter, M.J.; Hsiao, C.D.; Lam, E.W. SIRT inhibitors induce cell death and p53 acetylation through targeting both SIRT1 and SIRT2. Mol. Cancer Ther. 2010, 9, 844–855. [Google Scholar] [CrossRef] [PubMed]
- Inoue, T.; Hiratsuka, M.; Osaki, M.; Oshimura, M. The molecular biology of mammalian SIRT proteins: SIRT2 in cell cycle regulation. Cell Cycle 2007, 9, 1011–1018. [Google Scholar] [CrossRef]
- Blander, G.; Guarente, L. The Sir2 family of protein deacetylases. Annu. Rev. Biochem. 2004, 73, 417–435. [Google Scholar] [CrossRef] [PubMed]
- Marmorstein, R. Structure and chemistry of the Sir2 family of NAD+-dependent histone/protein deactylases. Biochem. Soc. Trans. 2004, 32, 904–909. [Google Scholar] [CrossRef] [PubMed]
- Jing, E.; Gesta, S.; Kahn, C.R. SIRT2 regulates adipocyte differentiation through FoxO1 acetylation/deacetylation. Cell Metab. 2007, 6, 105–114. [Google Scholar] [CrossRef] [PubMed]
- Wang, F.; Tong, Q. SIRT2 suppresses adipocyte differentiation by deacetylating FOXO1 and enhancing FOXO1’s repressive interaction with PPARγ. Mol. Biol. Cell 2009, 20, 801–808. [Google Scholar] [CrossRef] [PubMed]
- Krishnan, J.; Danzer, C.; Simka, T.; Ukropec, J.; Walter, K.M.; Kumpf, S.; Mirtschink, P.; Ukropcova, B.; Gasperikova, D.; Pedrazzini, T.; et al. Dietary obesity-associated Hif1α activation in adipocytes restricts fatty acid oxidation and energy expenditure via suppression of the Sirt2-NAD+ system. Genes Dev. 2012, 26, 259–270. [Google Scholar] [CrossRef] [PubMed]
- Jiang, W.; Wang, S.; Xiao, M.; Lin, Y.; Zhou, L.; Lei, Q.; Xiong, Y.; Guan, K.L.; Zhao, S. Acetylation regulates gluconeogenesis by promoting PEPCK1 degradation via recruiting the UBR5 ubiquitin ligase. Mol. Cell 2011, 43, 33–44. [Google Scholar] [CrossRef] [PubMed]
- Ghinis-Hozum, Y.; Antaramian, A.; Villarroya, F.; Pina, E.; Mora, O. Potential role of sirtuins in livestock production. Animal 2013, 7, 101–108. [Google Scholar] [CrossRef] [PubMed]
- Adoligbe, C.; Zan, L.; Farougou, S.; Wang, H.; Ujjan, J.A. Bovine GDF10 gene polymorphism analysis and its association with body measurement traits in Chinese indigenous cattle. Mol. Biol. Rep. 2012, 39, 4067–4075. [Google Scholar] [CrossRef] [PubMed]
- Jin, D.; Tan, H.J.; Lei, T.; Gan, L.; Chen, X.D.; Long, Q.Q.; Feng, B.; Yang, Z.Q. Molecular cloning and characterization of porcine sirtuin genes. Comp. Biochem. Physiol. B Biochem. Mol. Biol. 2009, 153, 348–358. [Google Scholar] [CrossRef] [PubMed]
- Wang, F.; Nguyen, M.; Qin, F.X.; Tong, Q. SIRT2 deacetylates FOXO3a in response to oxidative stress and caloric restriction. Aging Cell 2007, 6, 505–514. [Google Scholar] [CrossRef] [PubMed]
- Frye, R.A. Characterization of five human cDNAs with homology to the yeast SIR2 gene: Sir2-like proteins (sirtuins) metabolize NAD and may have protein ADP-ribosyltransferase activity. Biochem. Biophys. Res. Commun. 1999, 260, 273–279. [Google Scholar] [CrossRef] [PubMed]
- Houtkooper, R.H.; Pirinen, E.; Auwerx, J. Sirtuins as regulators of metabolism and healthspan. Nat. Rev. Mol. Cell Biol. 2012, 13, 225–238. [Google Scholar] [PubMed]
- Li, M.; Sun, X.; Jiang, J.; Sun, Y.J.; Lan, X.Y.; Lei, C.Z.; Zhang, C.L.; Chen, H. Tetra-primer ARMS-PCR is an efficient SNP genotyping method: An example from SIRT2. Anal. Methods 2014, 6, 1835–1840. [Google Scholar] [CrossRef]
- Yie, S.M.; Li, L.H.; Xiao, R.; Librach, C.L. A single base-pair mutation in the 3'-untranslated region of HLA-G mRNA is associated with pre-eclampsia. Mol. Hum. Reprod. 2008, 14, 649–653. [Google Scholar] [CrossRef] [PubMed]
- Clop, A.; Marcq, F.; Takeda, H.; Pirottin, D.; Tordoir, X.; Bibe, B.; Bouix, J.; Caiment, F.; Elsen, J.M.; Eychenne, F.; et al. A mutation creating a potential illegitimate microRNA target site in the myostatin gene affects muscularity in sheep. Nat. Genet. 2006, 38, 813–818. [Google Scholar] [CrossRef] [PubMed]
- Ren, G.; Chen, H.; Zhang, L.Z.; Lan, X.Y.; Wei, T.B.; Li, M.J.; Jing, Y.J.; Lei, C.Z.; Wang, J.Q. A coding SNP of LHX4 gene is associated with body weight and body length in bovine. Mol. Biol. Rep. 2010, 37, 417–422. [Google Scholar] [CrossRef]
- Ardlie, K.G.; Kruglyak, L.; Seielstad, M. Patterns of linkage disequilibrium in the human genome. Nat. Rev. Genet. 2002, 3, 299–309. [Google Scholar] [CrossRef] [PubMed]
- Huang, Y.Z.; Wang, K.Y.; He, H.; Shen, Q.W.; Lei, C.Z.; Lan, X.Y.; Zhang, C.L.; Chen, H. Haplotype distribution in the GLI3 gene and their associations with growth traits in cattle. Gene 2013, 513, 141–146. [Google Scholar] [CrossRef] [PubMed]
- Huang, Y.Z.; He, H.; Sun, J.J.; Wang, J.; Li, Z.J.; Lan, X.Y.; Lei, C.Z.; Zhang, C.L.; Zhang, E.P.; Wang, J.Q.; et al. Haplotype combination of SREBP-1c gene sequence variants is associated with growth traits in cattle. Genome 2011, 45, 507–516. [Google Scholar] [CrossRef]
- Nguyen, M.T.; Andrew, C.B.; Peter, B.M.; Yutao, L.; Russell, E.L. Single nucleotide polymorphisms in the actin and crustacean hyperglycemic hormone genes and their correlation with individual growth performance in giant freshwater prawn Macrobrachium rosenbergii. Aquaculture 2010, 301, 7–15. [Google Scholar] [CrossRef]
- Camargo, G.M.; Cardoso, D.F.; Gil, F.M.; Fonseca, P.D.; Zetouni, L.; Braz, C.U.; de Freitas, A.C.; de Souza, F.R.; Aspilcueta-Borquis, R.R.; Baldi, F.; et al. First polymorphisms in JY-1 gene in cattle (Bos taurus indicus) and their association with sexual precocity and growth traits. Mol. Biol. Rep. 2012, 39, 10105–10109. [Google Scholar] [CrossRef] [PubMed]
- Alim, M.A.; Fan, Y.P.; Wu, X.P.; Xie, Y.; Zhang, Y.; Zhang, S.L.; Sun, D.X.; Zhang, Y.; Zhang, Q.; Liu, L.; et al. Genetic effects of stearoyl-coenzyme A desaturase (SCD) polymorphism on milk production traits in the Chinese dairy population. Mol. Biol. Rep. 2012, 39, 8733–8740. [Google Scholar] [CrossRef] [PubMed]
- Cinar, M.U.; Kayan, A.; Uddin, M.J.; Jonas, E.; Tesfaye, D.; Phatsara, C.; Ponsuksili, S.; Wimmers, K.; Tholen, E.; Looft, C.; et al. Association and expression quantitative trait loci (eQTL) analysis of porcine AMBP, GC and PPP1R3B genes with meat quality traits. Mol. Biol. Rep. 2012, 39, 4809–4821. [Google Scholar] [CrossRef] [PubMed]
- Gui, L.; Wang, H.; Wei, S.; Zan, L. Molecular characterization, expression profiles, and analysis of Qinchuan cattle SIRT1 gene association with meat quality and body measurement traits (Bos taurus). Mol. Biol. Rep. 2014, 41, 5237–5246. [Google Scholar] [CrossRef] [PubMed]
- Greiss, S.; Gartner, A. Sirtuin/Sir2 phylogeny, evolutionary considerations and structural conservation. Mol. Cells 2009, 28, 407–415. [Google Scholar] [CrossRef] [PubMed]
- Qiao, L.; Shao, J. SIRT1 regulates adiponectin gene expression through Foxo1-C/enhancer-binding protein α transcriptional complex. J. Biol. Chem. 2006, 281, 39915–39924. [Google Scholar] [CrossRef] [PubMed]
- Sambrock, J.; Russell, D.W. Molecular Cloning: A Laboratory Manual; Cold Spring Harbor Laboratory Press: New York, NY, USA, 2001. [Google Scholar]
- Gilbert, R.P.; Bailey, D.R.C.; Shannon, N.H. Linear body measurements of cattle before and after 20 years of selection for postweaning gain when fed two different diets. J. Anim. Sci. 1993, 71, 1712–1720. [Google Scholar] [PubMed]
- Nei, M.; Roychoudhury, A.K. Sampling variance of heterozygosity and genetic distance. Genetics 1974, 76, 379–390. [Google Scholar] [PubMed]
- Nei, M.; Li, W.H. Mathematic model for studying genetic variation in terms of restriction endonucULAses. Proc. Natl. Acad. Sci. USA 1979, 76, 5269–5273. [Google Scholar] [CrossRef] [PubMed]
- Barrett, J.C.; Fry, B.; Maller, J.; Daly, M.J. Haploview: Analysis and visualization of LD and haplotype maps. Bioinformatics 2005, 21, 263–265. [Google Scholar] [CrossRef] [PubMed]
© 2015 by the authors; licensee MDPI, Basel, Switzerland. This article is an open access article distributed under the terms and conditions of the Creative Commons Attribution license (http://creativecommons.org/licenses/by/4.0/).
Share and Cite
Gui, L.-S.; Zhang, Y.-R.; Liu, G.-Y.; Zan, L.-S. Expression of the SIRT2 Gene and Its Relationship with Body Size Traits in Qinchuan Cattle (Bos taurus). Int. J. Mol. Sci. 2015, 16, 2458-2471. https://doi.org/10.3390/ijms16022458
Gui L-S, Zhang Y-R, Liu G-Y, Zan L-S. Expression of the SIRT2 Gene and Its Relationship with Body Size Traits in Qinchuan Cattle (Bos taurus). International Journal of Molecular Sciences. 2015; 16(2):2458-2471. https://doi.org/10.3390/ijms16022458
Chicago/Turabian StyleGui, Lin-Sheng, Ya-Ran Zhang, Gui-Yao Liu, and Lin-Sen Zan. 2015. "Expression of the SIRT2 Gene and Its Relationship with Body Size Traits in Qinchuan Cattle (Bos taurus)" International Journal of Molecular Sciences 16, no. 2: 2458-2471. https://doi.org/10.3390/ijms16022458
APA StyleGui, L.-S., Zhang, Y.-R., Liu, G.-Y., & Zan, L.-S. (2015). Expression of the SIRT2 Gene and Its Relationship with Body Size Traits in Qinchuan Cattle (Bos taurus). International Journal of Molecular Sciences, 16(2), 2458-2471. https://doi.org/10.3390/ijms16022458