
Validation of PDE9A Gene Identified in GWAS Showing Strong Association with Milk Production Traits in Chinese Holstein


Abstract
: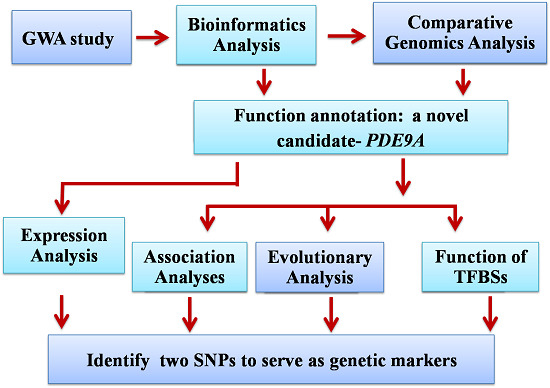
1. Introduction
2. Results and Discussion
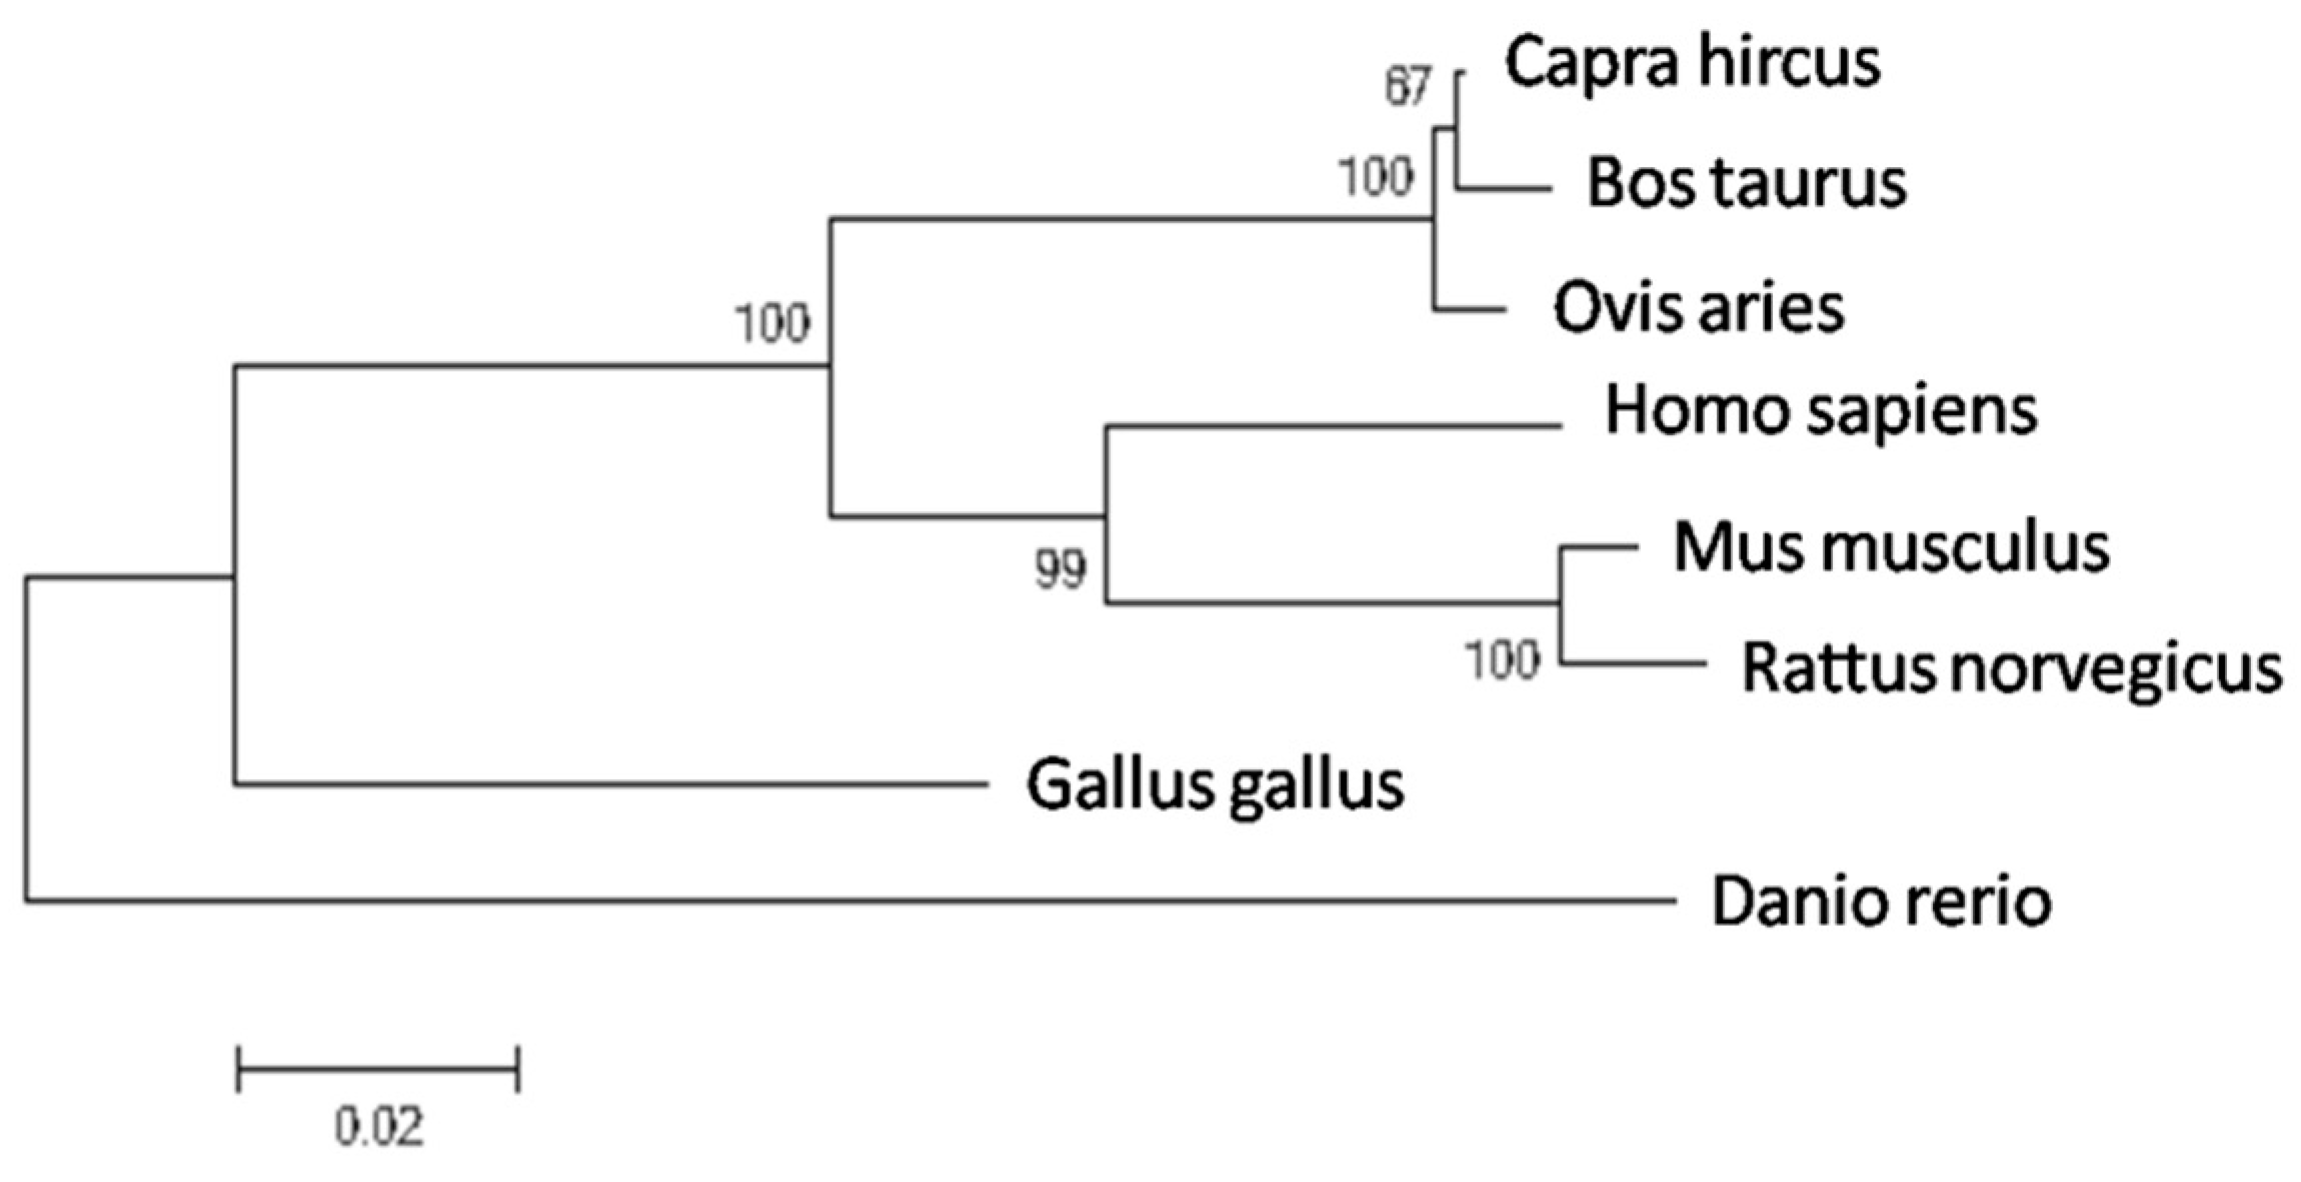
2.1. Molecular Evolutionary Analysis of the Bovine PDE9A Gene

| Species | GenBank Accession | Similarity |
|---|---|---|
| Capra hircus | XP_005675698.1 | 98.81% |
| Ovis aries | XP_004003956.1 | 98.11% |
| Mus musculus | NP_001157220.1 | 91.33% |
| Rattus norvegicus | XP_008771017.1 | 90.52% |
| Homo sapiens | NP_001001567.1 | 85.39% |
| Gallus gallus | XP_003640550.1 | 81.64% |
| Danio rerio | XP_009302929.1 | 77.81% |

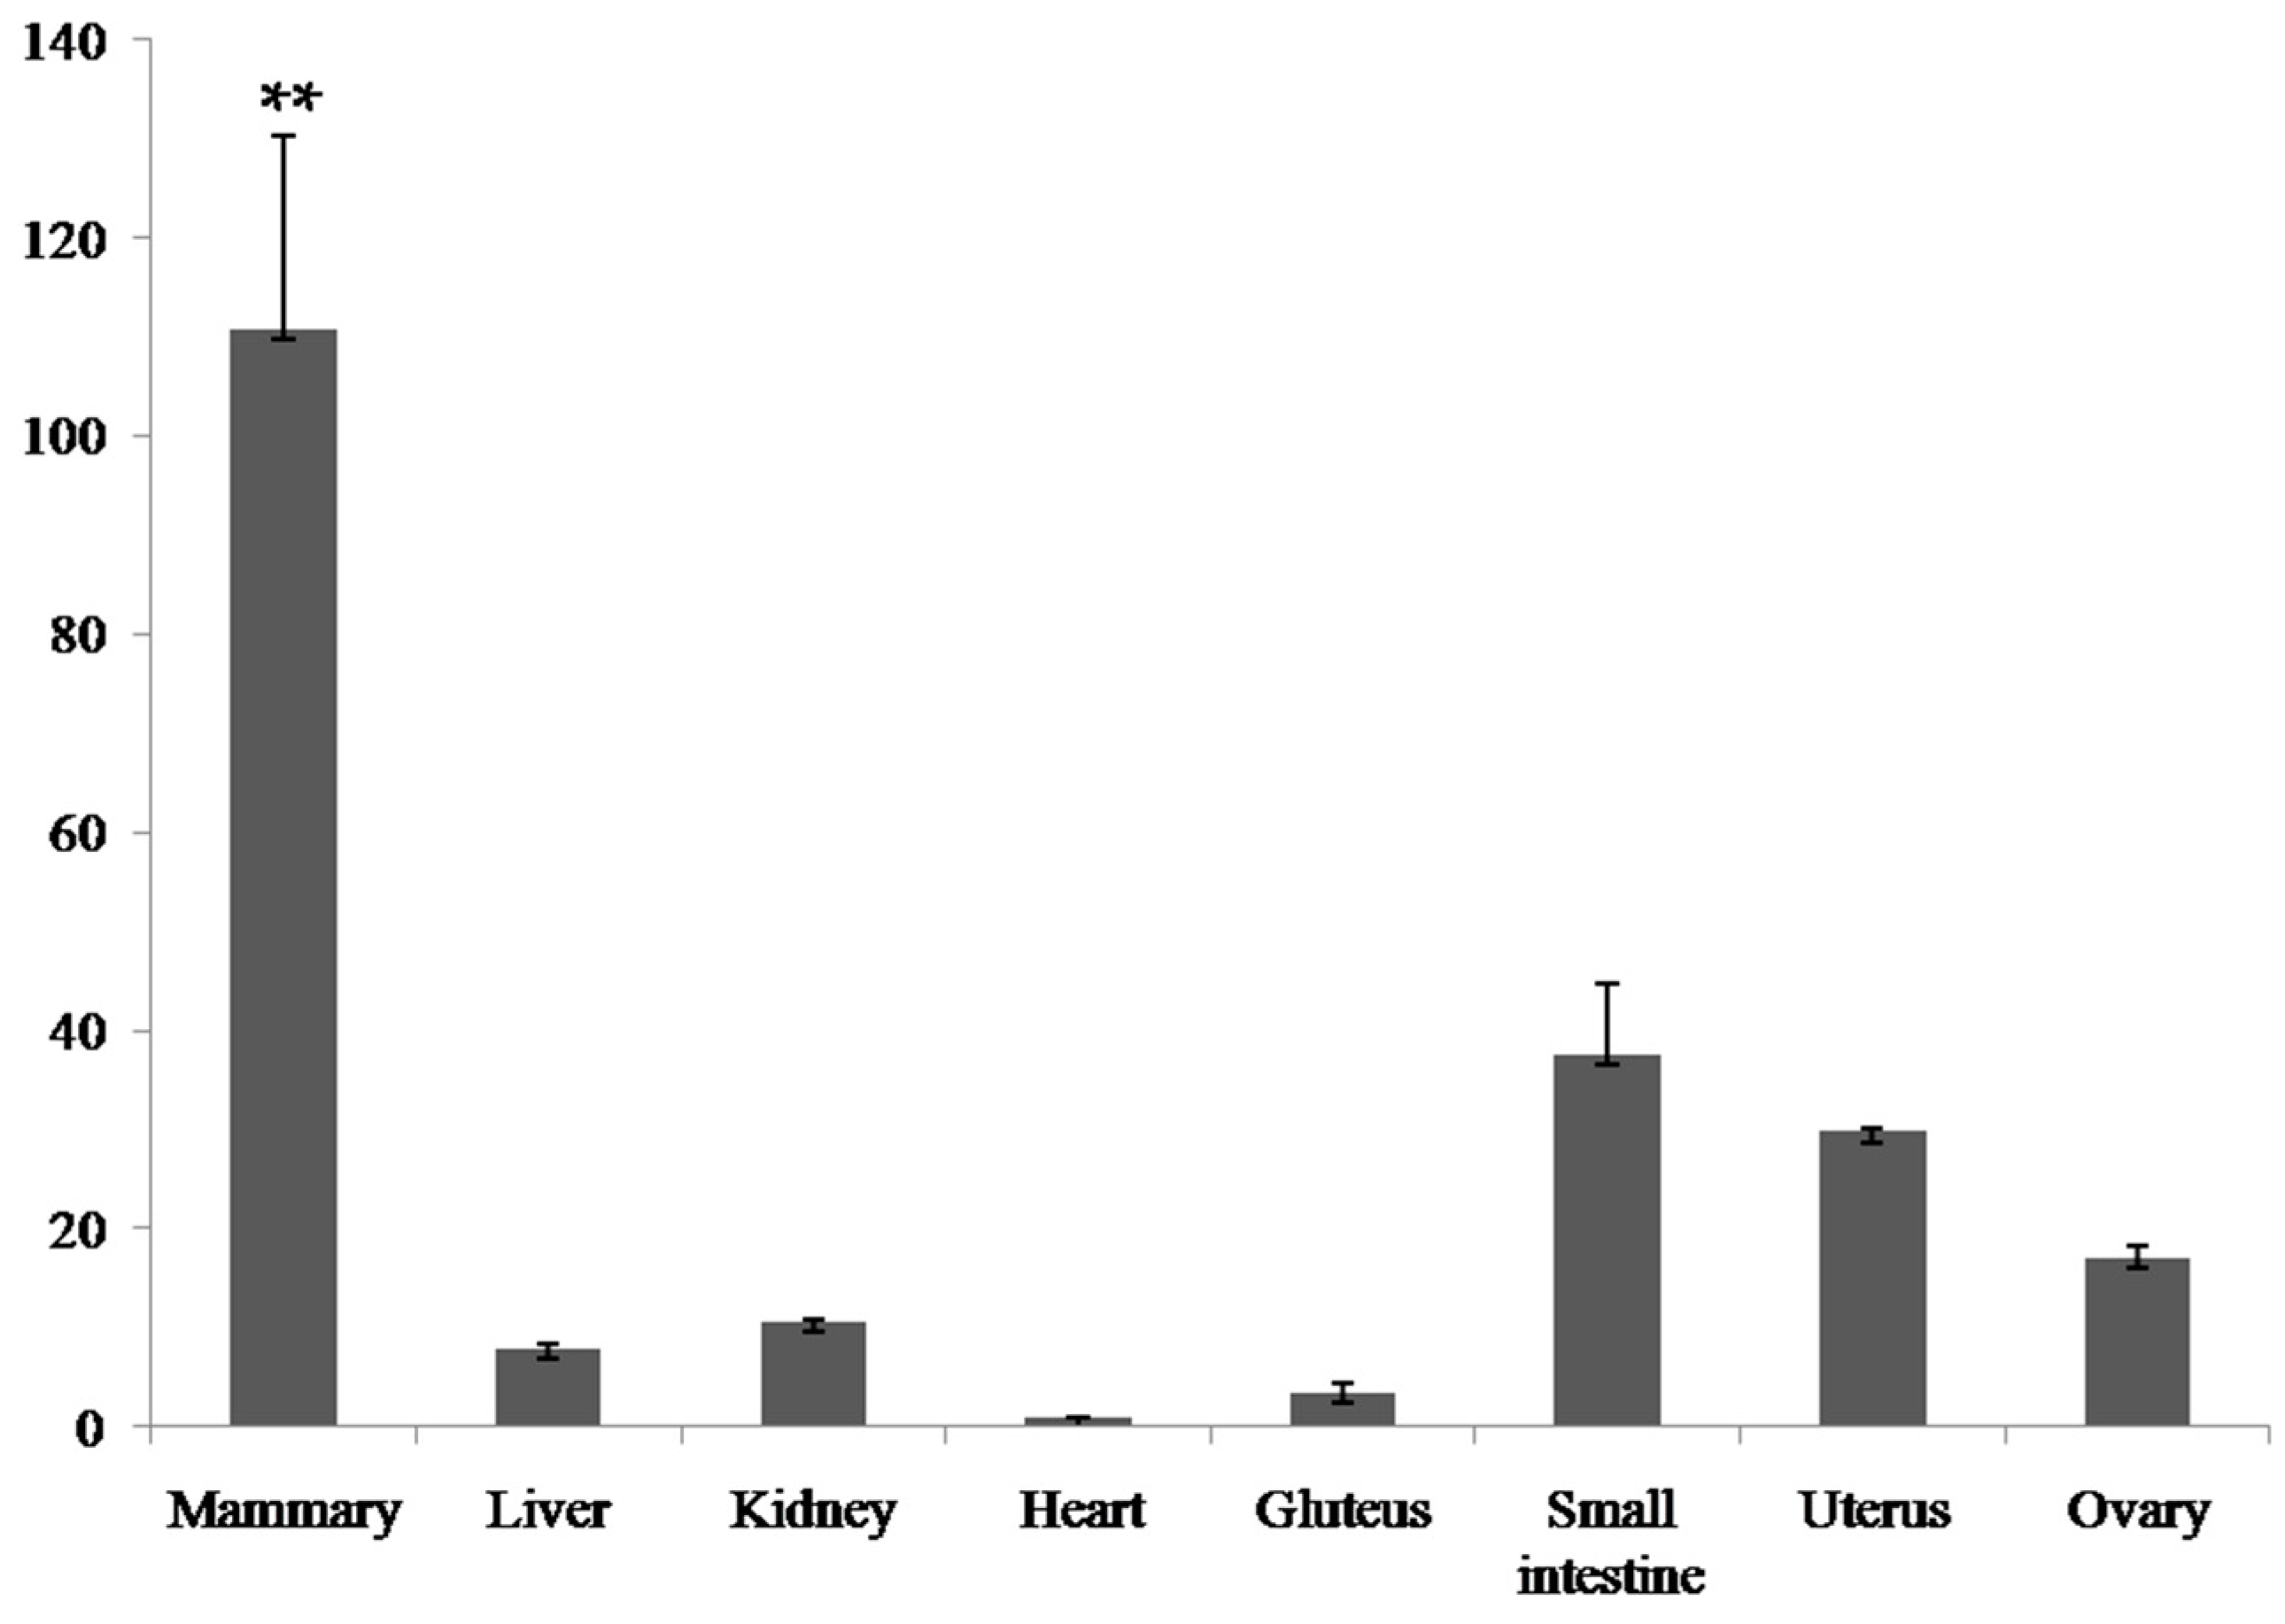
2.2. Expression Analysis of the Bovine PDE9A Gene

2.3. SNP Identification and Selection
| SNP ID | GenBank No. | Allele Substitution | Genotypes | Genotypic Frequencies | Alleles | Allelic Frequencies |
|---|---|---|---|---|---|---|
| c.-2012 T>C | rs42140305 | TT | 0.40 | T | 0.64 | |
| T>C | CT | 0.48 | ||||
| CC | 0.12 | C | 0.36 | |||
| c.-2005 A>G | rs381951806 | AA | 0.56 | A | 0.74 | |
| A>G | AG | 0.37 | ||||
| GG | 0.07 | G | 0.26 | |||
| c.-1762 T>C | rs136803034 | TT | 0.37 | T | 0.61 | |
| T>C | CT | 0.49 | ||||
| CC | 0.14 | C | 0.39 | |||
| c.-1621 T>G | rs133033048 | TT | 0.52 | T | 0.72 | |
| T>G | GT | 0.38 | ||||
| GG | 0.10 | G | 0.28 | |||
| c.-1376 G>A | rs210080144 | GG | 0.65 | G | 0.81 | |
| G>A | AG | 0.32 | ||||
| AA | 0.03 | A | 0.19 | |||
| c.-724 A>G | rs135748250 | AA | 0.38 | A | 0.64 | |
| A>G | AG | 0.52 | ||||
| GG | 0.10 | G | 0.36 |
2.4. Association Analyses
2.4.1. Single Locus-Based Regression Analyses
| SNP | Genotype | MY | FY | FP | PY | PP |
|---|---|---|---|---|---|---|
| c.-2012 T>C | CC (59) | 531.94 ± 102.58 A | 11.44 ± 4.38 | −0.05 ± 0.046 | 15.89 ± 3.06 A | −0.006 ± 0.015 |
| CT (239) | 363.53 ± 75.15 A | 3.62 ± 3.39 | −0.07 ± 0.035 | 10.82 ± 2.37 A,B | −0.002 ± 0.010 | |
| TT (198) | 192.65 ± 78.00 B | 0.91 ± 3.49 | −0.04 ± 0.036 | 7.10 ± 2.44 B | 0.012 ± 0.011 | |
| p Value | 0.0002 ** | 0.0115 | 0.5315 | 0.0009 ** | 0.2303 | |
| c.-2005 A>G | AA (275) | 242.80 ± 74.98 A | 6.24 ± 3.36 | 0.01 ± 0.023 | 9.72 ± 2.35 a | 0.003 ± 0.005 |
| AG (183) | 361.60 ± 79.38 A,B | 6.77 ± 3.50 | 0.01 ± 0.030 | 12.42 ± 2.45 a,b | 0.003 ± 0.006 | |
| GG (38) | 596.23 ± 118.54 B | 11.44 ± 5.11 | 0.01 ± 0.034 | 18.84 ± 3.58 b | −0.014 ± 0.012 | |
| p Value | 0.0015 ** | 0.4639 | 0.7746 | 0.0048 * | 0.3535 | |
| c.-1762 T>C | CC (71) | 620.74 ± 97.86 A | 15.84 ± 4.20 A,a | −0.05 ± 0.044 | 19.10 ± 2.94 A | −0.009 ± 0.015 |
| CT (240) | 432.42 ± 75.59 A | 7.81 ± 3.41 b | −0.06 ± 0.035 | 14.93 ± 2.39 A | 0.006 ± 0.010 | |
| TT (185) | 237.05 ± 77.76 B | 3.67 ± 3.47 B,b | −0.04 ± 0.036 | 9.35 ± 2.43 B | 0.012 ± 0.011 | |
| p Value | <0.0001 ** | 0.0013 ** | 0.6539 | <0.0001 ** | 0.2924 | |
| c.-1621 T>G | GG (48) | 500.63 ± 110.74 | 11.59 ± 4.68 | −0.04 ± 0.050 | 17.44 ± 1.19 A,a | 0.013 ± 0.017 |
| GT (186) | 240.61 ± 77.84 | 4.37 ± 3.48 | −0.03 ± 0.036 | 8.99 ± 1.69 B,b | 0.013 ± 0.011 | |
| TT (262) | 312.57 ± 74.72 | 6.77 ± 3.38 | −0.03 ± 0.034 | 10.39 ± 0.92 b | 0.005 ± 0.010 | |
| p Value | 0.0279 | 0.1578 | 0.9389 | 0.0077 * | 0.6157 | |
| c.-1376 G>A | AA (14) | 113.67 ± 167.77 A | −2.48 ± 6.82 A | −0.05 ± 0.075 | 3.64 ± 4.77 A | 0.007 ± 0.026 |
| AG (162) | 158.20 ± 79.24 A | 1.22 ± 3.52 A | −0.03 ± 0.036 | 4.86 ± 2.47 A | 0.003 ± 0.011 | |
| GG (320) | 459.43 ± 73.27 B | 9.06 ± 3.33 B | −0.05 ± 0.033 | 14.71 ± 2.33 B | 0.004 ± 0.010 | |
| p Value | <0.0001 ** | 0.0009 ** | 0.6907 | <0.0001 ** | 0.9834 | |
| c.-724 A>G | AA (185) | 547.23 ± 79.37 A | 10.08 ± 2.93 A | −0.07 ± 0.036 | 16.55 ± 2.49 A | −0.003 ± 0.011 |
| AG (262) | 282.30 ± 73.85 B | 5.26 ± 2.75 AB | −0.03 ± 0.034 | 9.65 ± 2.34 B | 0.009 ± 0.010 | |
| GG (49) | 36.21 ± 106.47 B | −3.01 ± 3.37 B | −0.03 ± 0.048 | 0.50 ± 3.15 C | 0.001 ± 0.016 | |
| p Value | <0.0001 ** | 0.0016 ** | 0.2956 | <0.0001 ** | 0.3851 |
| Locus | Gene Effects | MY | FY | FP | PY | PP |
|---|---|---|---|---|---|---|
| c.-2012 T>C | Additive (a) | 169.64 ** | 5.26 ** | −0.006 | 4.39 ** | −0.009 |
| Dominant (d) | 1.24 | −2.55 | −0.022 | −0.68 | −0.005 | |
| Allele substitution (α) | 47.04 ** | 4.57 ** | −0.012 | 4.21 ** | −0.010 | |
| c.-2005 A>G | Additive (a) | −176.72 ** | −2.60 | 0.013 | −4.56 ** | −0.005 |
| Dominant (d) | −57.91 | −2.07 | 0.001 | −1.86 | 0.001 | |
| Allele substitution (α) | −204.52 ** | −3.59 | 0.014 | −5.45 * | −0.005 | |
| c.-1762 T>C | Additive (a) | 191.84 ** | 6.09 ** | −0.005 | 4.87 ** | −0.011 |
| Dominant (d) | 3.53 | −1.94 | −0.018 | 0.71 | 0.004 | |
| Allele substitution (α) | 192.65 ** | 5.64 ** | 0.009 | 5.03 ** | −0.010 | |
| c.-1621 T>G | Additive (a) | 94.03 | 2.41 | −0.007 | 3.53 ** | 0.004 |
| Dominant (d) | −165.99 * | −4.81 * | 0.009 | −4.93 ** | 0.004 | |
| Allele substitution (α) | 24.31 | 0.39 | −0.003 | 1.46 ** | −0.006 | |
| c.-1376 G>A | Additive (a) | −172.88 * | −5.77 * | 0.001 | −5.54 ** | 0.001 |
| Dominant (d) | −128.34 | −2.08 | 0.021 | −4.32 | −0.003 | |
| Allele substitution (α) | −252.53 ** | −7.06 ** | 0.014 | −8.22 ** | −0.001 | |
| c.-724 A>G | Additive(a) | 255.51 ** | 1.90 ** | −0.021 | 8.03 ** | −0.002 |
| Dominant (d) | −9.42 | 2.37 | 0.017 | 1.12 | 0.010 | |
| Allele substitution (α) | 252.87 ** | 2.28 ** | −0.016 | 8.34 ** | 0.001 |
2.4.2. Haplotype Regression Analyses
| Haplotypes | c.-2012 T>C | c.-2005 A>G | c.-1762 T>C | c.-1621 T>G | c.-1376 G>A | c.-724 A>G | Frequency (%) | MY (p-Value) | FY (p-Value) | PY (p-Value) |
|---|---|---|---|---|---|---|---|---|---|---|
| CACT | C | A | C | T | 34.8 | <0.0001 ** | 0.0035 ** | <0.0001 ** | ||
| TATT | T | A | T | T | 31.9 | |||||
| TGTG | T | G | T | G | 25.7 | |||||
| Pooled Haplotypes * | T | A | C | T | 7.6 | |||||
| T | A | T | G | |||||||
| C | A | T | T | |||||||
| GA | G | A | 63.8 | <0.0001 ** | 0.0045 ** | <0.0001 ** | ||||
| AG | A | G | 19.0 | |||||||
| GG | G | G | 17.2 |
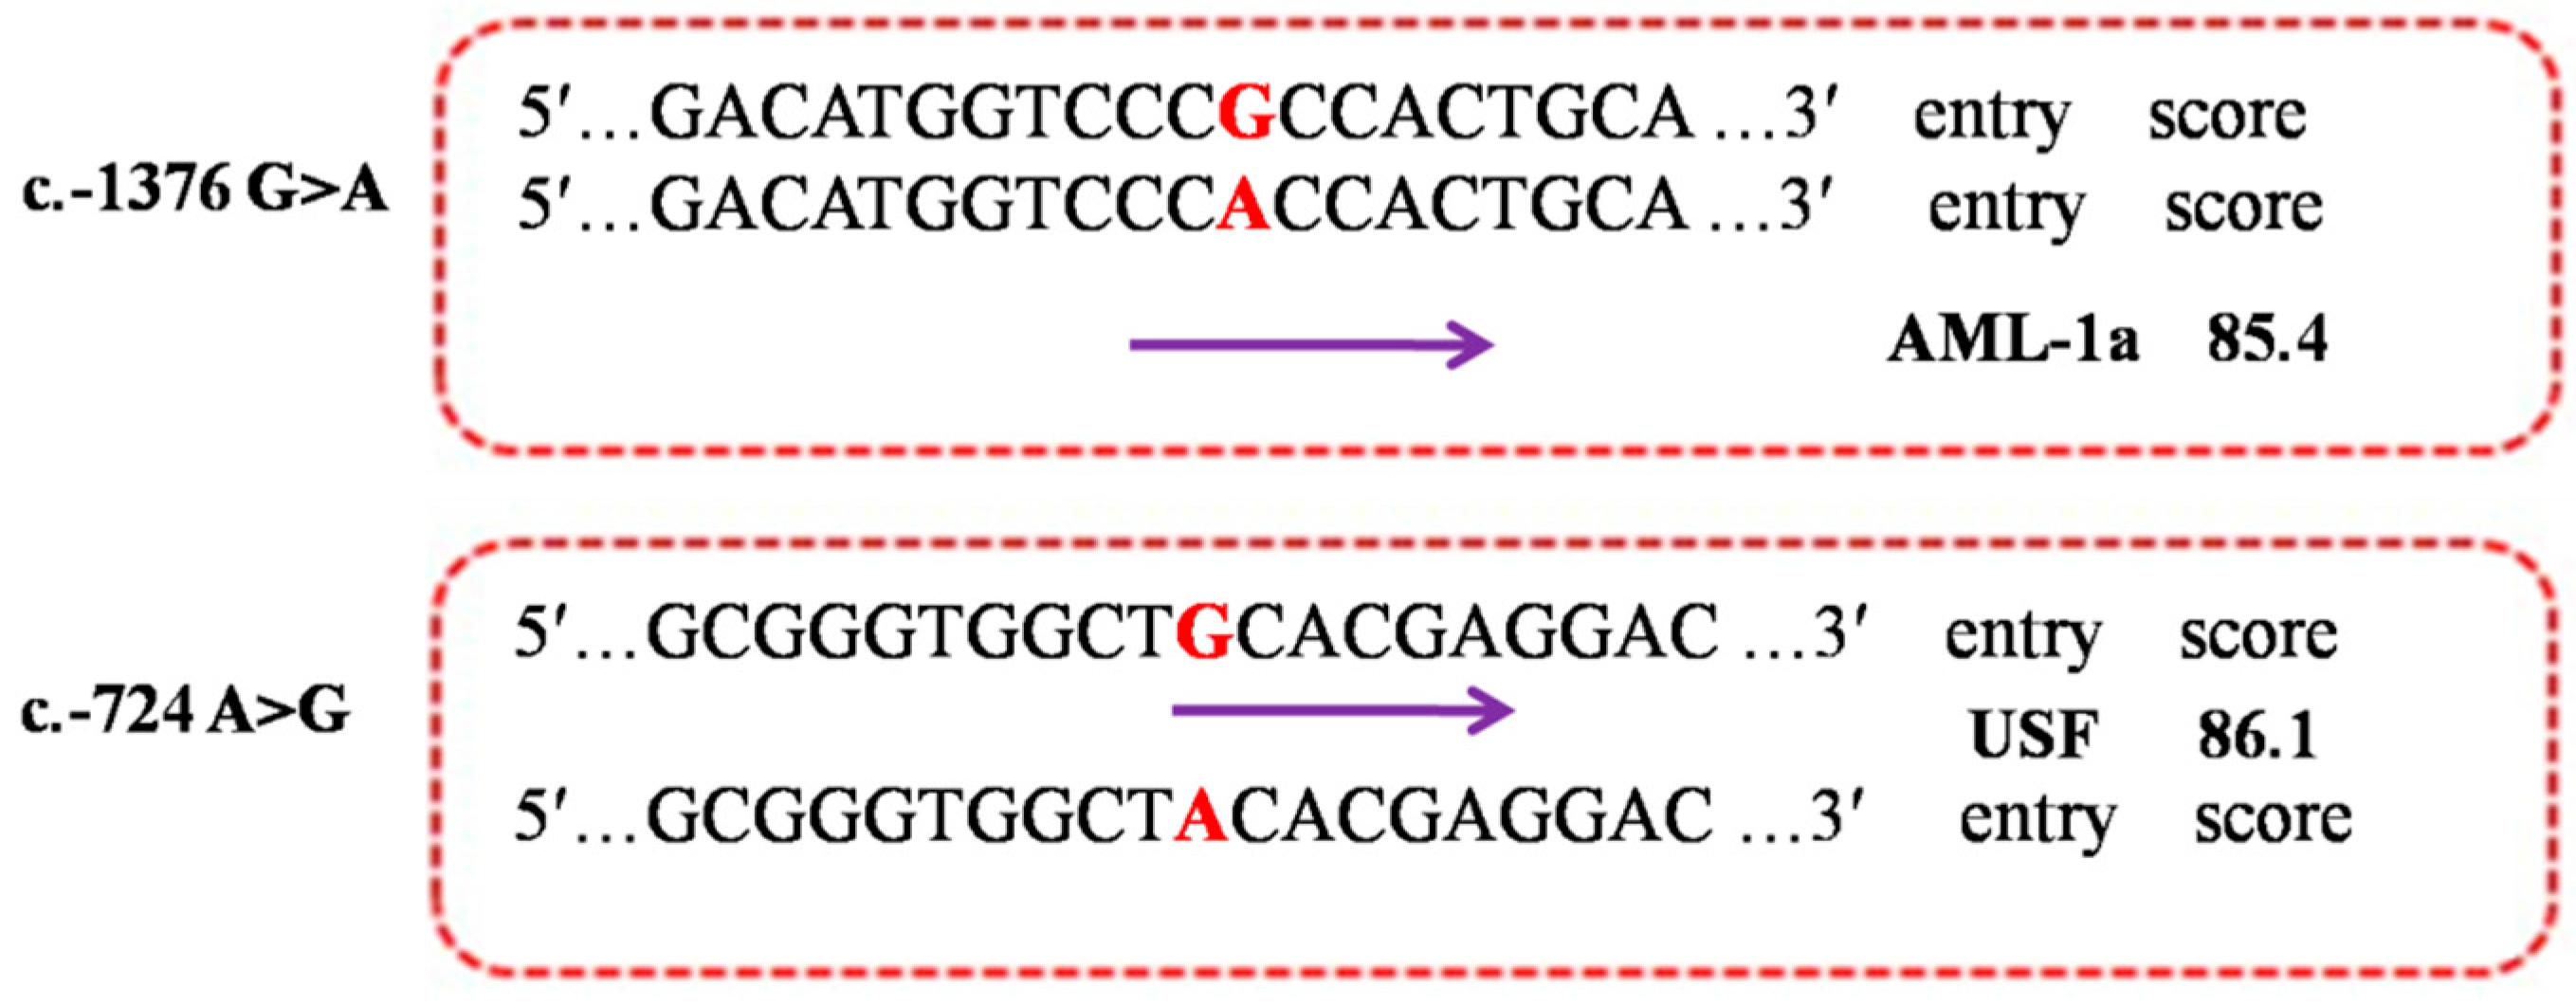
2.5. Functional Prediction of the Allele-Dependent TFBS
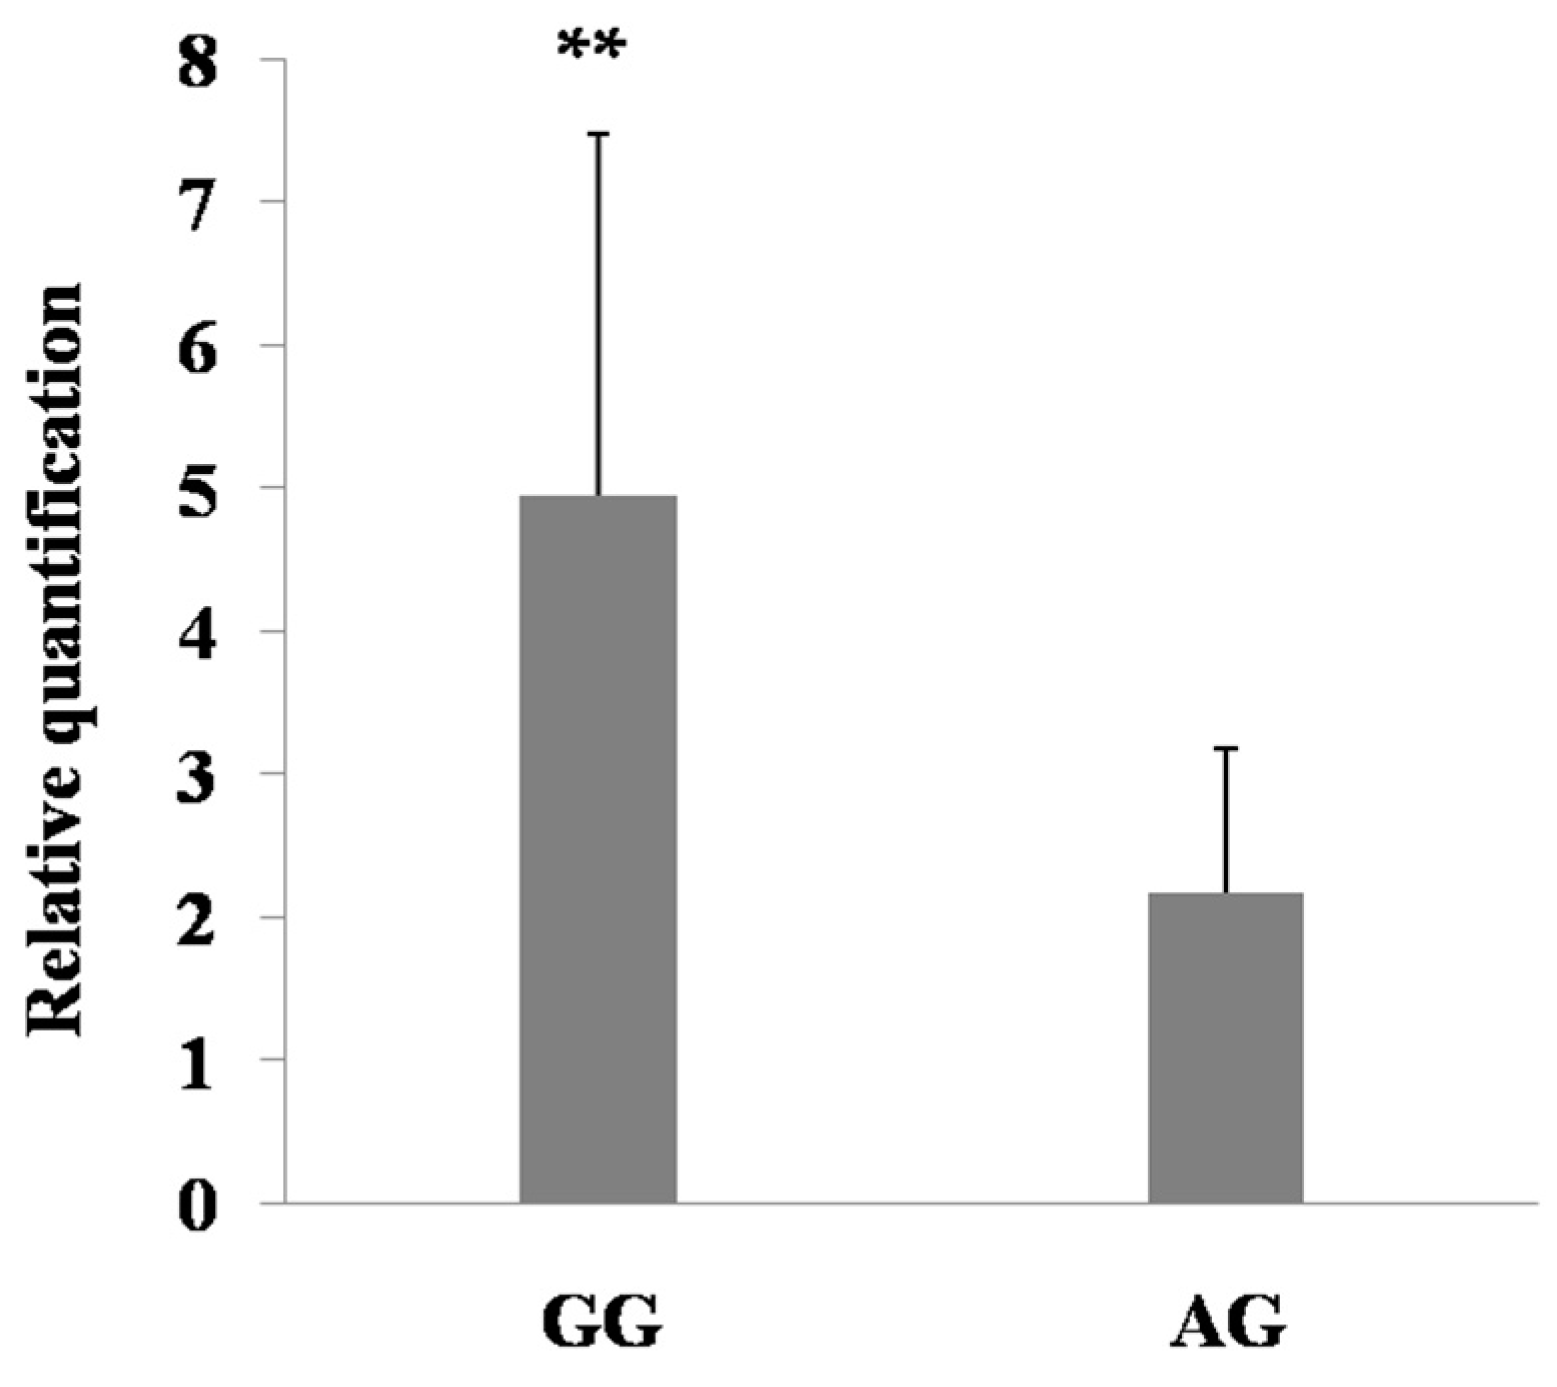
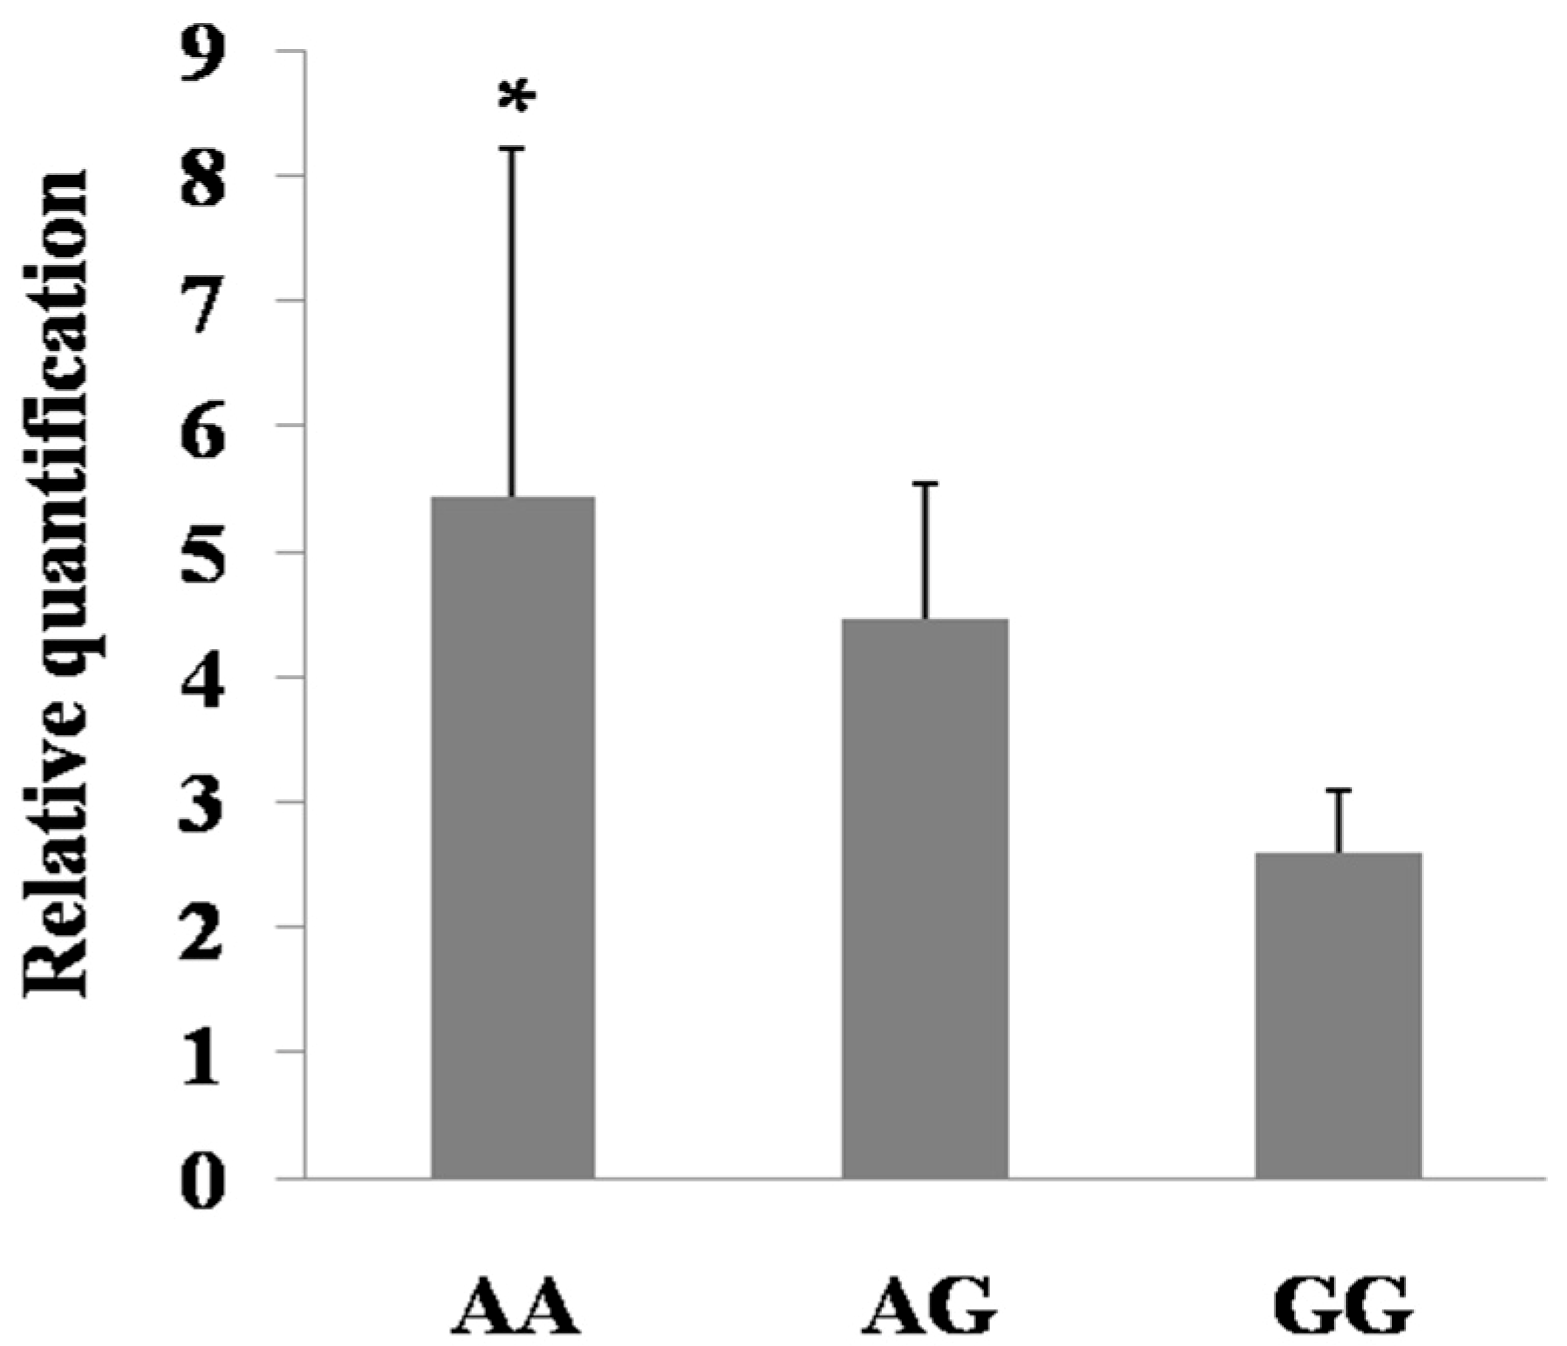
2.6. Expression Regulation of the Mutations in PDE9A Gene


3. Experimental Section
3.1. Bioinformatic Analysis of PDE9A Protein
3.2. Gene Expression Assays of PDE9A Gene
3.3. Resource Population and DNA Extraction
3.4. SNP Identification and Genotyping
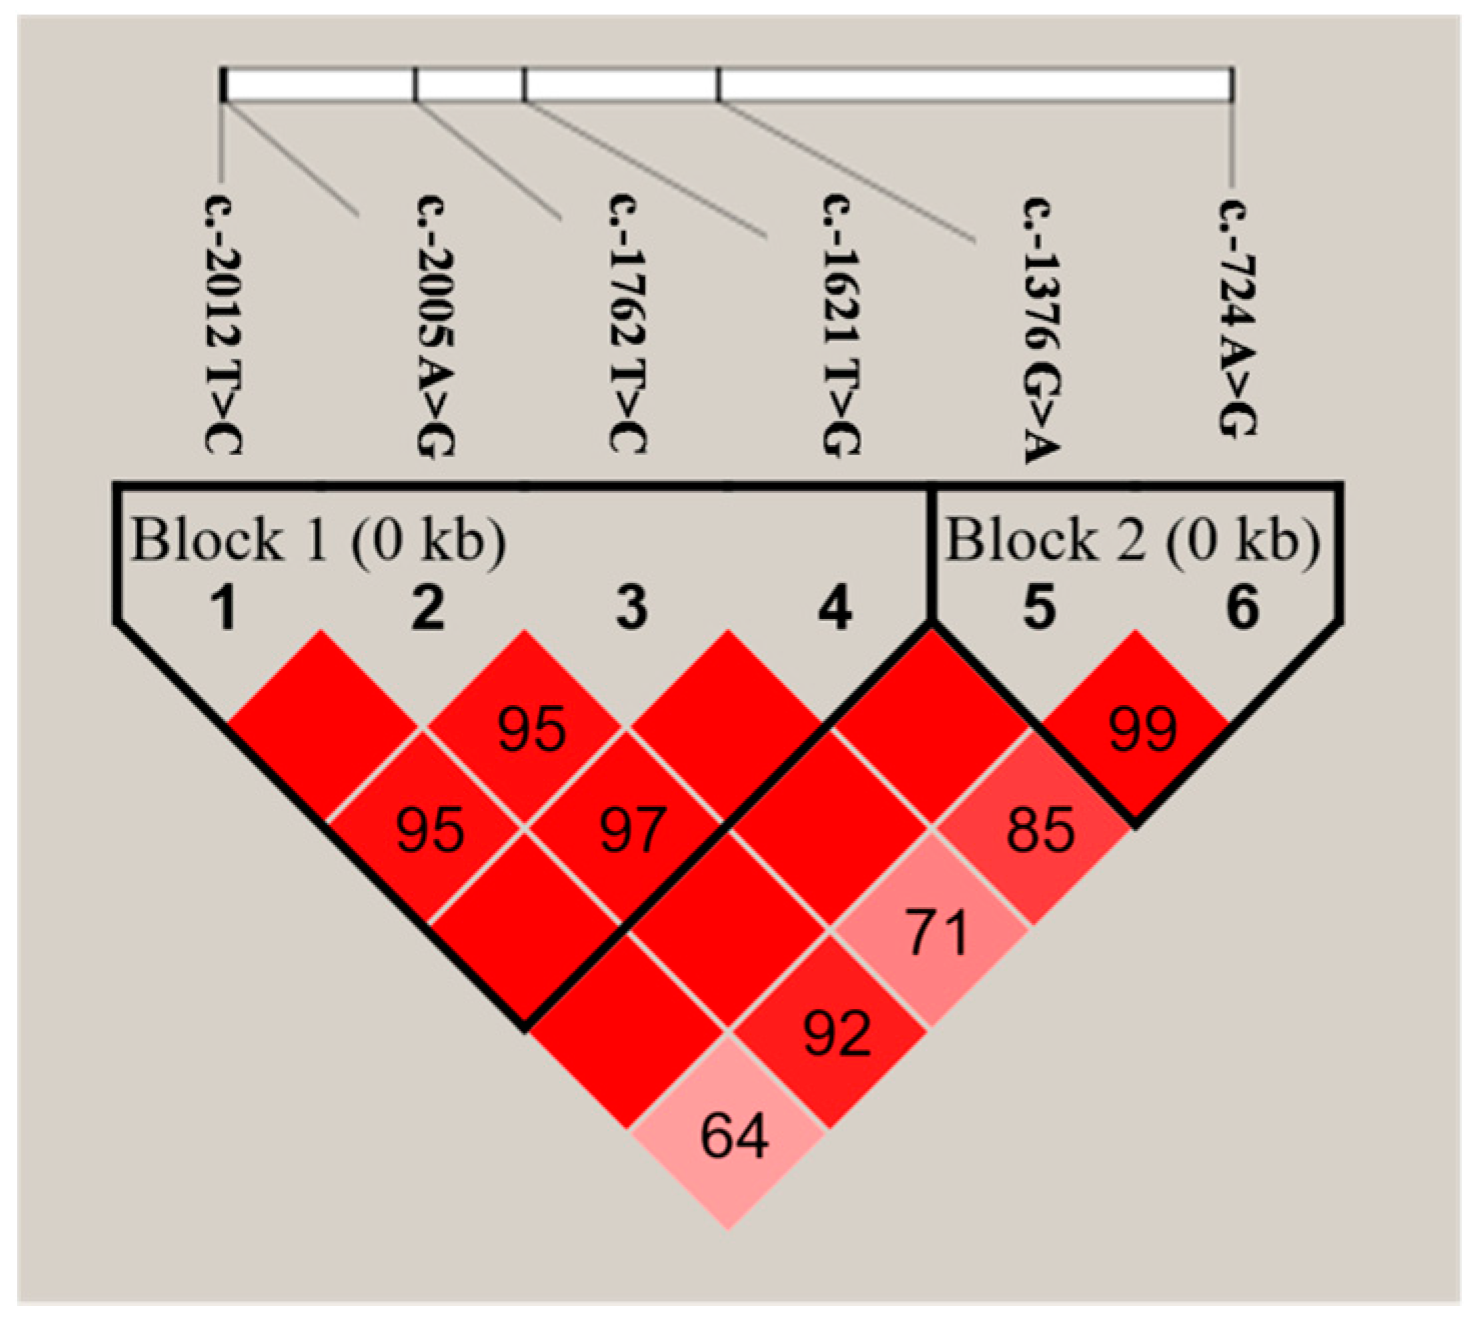
3.5. Haplotype Analysis
3.6. Association Analysis
3.7. Bioinformatics Analysis of Transcription Factor Binding Sites (TFBSs)
4. Conclusions
Supplementary Materials
Acknowledgments
Author Contributions
Conflicts of Interest
References
- Madeja, Z.; Adamowicz, T.; Chmurzynska, A.; Jankowski, T.; Melonek, J.; Switonski, M.; Strabel, T. Short communication: Effect of leptin gene polymorphisms on breeding value for milk production traits. J. Dairy Sci. 2004, 87, 3925–3927. [Google Scholar] [CrossRef]
- Sahana, G.; Guldbrandtsen, B.; Thomsen, B.; Holm, L.E.; Panitz, F.; Brondum, R.F.; Bendixen, C.; Lund, M.S. Genome-wide association study using high-density single nucleotide polymorphism arrays and whole-genome sequences for clinical mastitis traits in dairy cattle. J. Dairy Sci. 2014, 97, 7258–7275. [Google Scholar] [CrossRef] [PubMed]
- Scott, L.J.; Mohlke, K.L.; Bonnycastle, L.L.; Willer, C.J.; Li, Y.; Duren, W.L.; Erdos, M.R.; Stringham, H.M.; Chines, P.S.; Jackson, A.U.; et al. A genome wide association study of type 2 diabetes in Finns detects multiple susceptibility variants. Science 2007, 316, 1341–1345. [Google Scholar] [CrossRef] [PubMed]
- Jiang, L.; Liu, J.F.; Sun, D.X.; Ma, P.P.; Ding, X.D.; Yu, Y.; Zhang, Q. Genome wide association studies for milk production traits in Chinese Holstein population. PLoS ONE 2010, 5, e13661. [Google Scholar] [CrossRef] [PubMed]
- Kolbehdari, D.; Wang, Z.; Grant, J.R.; Murdoch, B.; Prasad, A.; Xiu, Z.; Marques, E.; Stothard, P.; Moore, S.S. A whole genome scan to map QTL for milk production traits and somatic cell score in Canadian Holstein bulls. J. Anim. Breed. Genet. 2009, 126, 216–227. [Google Scholar] [CrossRef] [PubMed]
- Boichard, D.; Grohs, C.; Bourgeois, F.; Cerqueira, F.; Faugeras, R. Detection of genes influencing economic traits in three French dairy cattle breeds. Genet. Sel. Evol. 2003, 35, 77–101. [Google Scholar] [CrossRef] [PubMed]
- Kroker, K.S.; Mathis, C.; Marti, A.; Cassel, J.C.; Rosenbrock, H.; Dorner-Ciossek, C. PDE9A inhibition rescues amyloid β-induced deficits in synaptic plasticity and cognition. Neurobiol. Aging 2014, 35, 2072–2078. [Google Scholar] [CrossRef] [PubMed]
- Francis, S.; Blount, M.; Corbin, J. Mammalian cyclic nucleotide phosphodiesterases: Molecular mechanisms and physiological functions. Physiol. Rev. 2011, 91, 651–690. [Google Scholar] [CrossRef] [PubMed]
- Conti, M.; Jin, S.L. The molecular biology of cyclic nucleotide phosphodiesterases. Prog. Nucleic Acid Res. Mol. Biol. 2000, 63, 1–38. [Google Scholar]
- Houslay, M.D. PDE4 cAMP-specific phosphodiesterases. Prog. Nucleic Acid Res. 2001, 69, 249–315. [Google Scholar]
- Aronsen, L.; Orvoll, E.; Lysaa, R.; Ravna, A.W.; Sager, G. Modulation of high affinity ATP-dependent cyclic nucleotide transporters by specific and non-specific cyclic nucleotide phosphodiesterase inhibitors. Eur. J. Pharmacol. 2014, 745, 249–253. [Google Scholar] [CrossRef] [PubMed][Green Version]
- Guipponi, M.; Scott, H.S.; Kudoh, J.; Kawasaki, K.; Shibuya, K.; Shintani, A.; Asakawa, S.; Chen, H.; Lalioti, M.D.; Rossier, C.; et al. Identification and characterisation of a novel cyclic nucleotide phosphodiesterase gene (PDE9A) that maps to 21q22.3: Alternative splicing of mRNA transcripts, genomic structure and sequence. Hum. Genet. 1998, 103, 386–392. [Google Scholar] [CrossRef] [PubMed]
- Kleiman, R.J.; Chapin, D.S.; Christoffersen, C.; Freeman, J.; Fonseca, K.R.; Geoghegan, K.F.; Grimwood, S.; Guanowsky, V.; Hajos, M.; Harms, J.F.; et al. Phosphodiesterase 9A regulates central cGMP and modulates responses to cholinergic and monoaminergic perturbation in vivo. J. Pharmacol. Exp. Ther. 2012, 341, 396–409. [Google Scholar] [CrossRef] [PubMed]
- Cases, S.; Smith, S.J.; Zheng, Y.W.; Myers, H.M.; Lear, S.R.; Sande, E.; Novak, S.; Collins, C.; Welch, C.B.; Lusis, A.J.; et al. Identification of a gene encoding an acyl CoA: Diacylglycerol acyltransferase, a key enzyme in triacylglycerol synthesis. Cell Biol. 1998, 95, 131018–131023. [Google Scholar]
- Bionaz, M.; Loor, J.J. Gene networks driving bovine milk fat synthesis during the lactation cycle. BMC Genom. 2008, 9, 366. [Google Scholar] [CrossRef] [PubMed]
- Lengi, A.J.; Corl, B.A. Identification and characterization of a novel bovine stearoyl-CoA desaturase isoform with homology to human SCD5. Lipids 2007, 42, 499–508. [Google Scholar] [CrossRef] [PubMed]
- Daly, M.J.; Rioux, J.D.; Schaffner, S.F.; Hudson, T.J.; Lander, E.S. High-resolution haplotype structure in the human genome. Nat. Genet. 2001, 29, 229–232. [Google Scholar] [CrossRef] [PubMed]
- Huang, Q.; Fu, Y.X.; Boerwinkle, E. Comparison of strategies for selecting single nucleotide polymorphisms for case/control association studies. Hum. Genet. 2003, 113, 253–257. [Google Scholar] [CrossRef] [PubMed]
- Capparelli, R.; Parlato, M.; Amoroso, M.G.; Roperto, S.; Marabelli, R.; Roperto, F.; Iannelli, D. Mannose-binding lectin haplotypes influence Brucella abortus infection in the water buffalo (Bubalus bubalis). Immunogenetics 2008, 60, 157–165. [Google Scholar] [CrossRef] [PubMed]
- Abdel-Shafy, H.; Bortfeldt, R.H.; Tetens, J.; Brockmann, G.A. Single nucleotide polymorphism and haplotype effects associated with somatic cell score in German Holstein cattle. Genet. Sel. Evol. 2013, 46, 35. [Google Scholar] [CrossRef] [PubMed]
- Wang, X.; Tomso, D.J.; Liu, X.; Bell, D.A. Single nucleotide polymorphism in transcriptional regulatory regions and expression of environmentally responsive genes. Toxicol. Appl. Pharmacol. 2005, 207, S84–S90. [Google Scholar] [CrossRef] [PubMed]
- Sirito, M.; Lin, Q.; Maity, T.; Sawadogo, M. Ubiquitous expression of the 43- and 44-kDa forms of transcription factor USF in mammalian cells. Nucleic Acids Res. 1994, 22, 427–433. [Google Scholar] [CrossRef] [PubMed]
- Patricia, G.S.; Antonio, F.P.; Mario, V. Differential configurations involving binding of USF transcription factors and Twist1 regulate Alx3 promoter activity in mesenchymal and pancreatic cells. Biochem. J. 2013, 450, 199–208. [Google Scholar] [CrossRef] [PubMed]
- Cole, J.B.; Wiggans, G.R.; Ma, L.; Sonstegard, T.S.; Lawlor, T.J. Genome-wide association analysis of thirty one production, health, reproduction and body conformation traits in contemporary U.S. Holstein cows. BMC Genom. 2011, 12, 408. [Google Scholar] [CrossRef] [PubMed]
- Harder, B.; Bennewitz, J.; Reinsch, N.; Thaller, G.; Thomsen, H.; Kuhn, C.; Schwerin, M.; Erhardt, G.; Forster, M.; Reinhardt, F.; et al. Mapping of quantitative trait loci for lactation persistency traits in German Holstein dairy cattle. J. Anim. Breed. Genet. 2006, 123, 89–96. [Google Scholar] [CrossRef] [PubMed]
- Wunder, F.; Tersteegen, A.; Rebmann, A.; Erb, C.; Fahrig, T.; Hendrix, M. Characterization of the first potent and selective PDE9 inhibitor using a cGMP reporter cell line. Mol. Pharmacol. 2005, 68, 1775–1781. [Google Scholar] [CrossRef] [PubMed]
- Reneerkens, O.A.; Rutten, K.; Steinbusch, H.W.; Blokland, A.; Prickaerts, J. Selective phosphodiesterase inhibitors: A promising target for cognition enhancement. Psychopharmacology 2009, 202, 419–443. [Google Scholar] [CrossRef] [PubMed]
- Andreeva, S.G.; Dikkes, P.; Epstein, P.M.; Rosenberg, P.A. Expression of cGMP-specific phosphodiesterase 9A mRNA in the rat brain. J. Neurosci. 2001, 21, 9068–9076. [Google Scholar] [PubMed]
- Alexandra, M.F.; Gary, A.P.; Heather, N.T. The role of cyclic nucleotide signaling pathways in cancer: Targets for prevention and treatment. Cancers 2014, 6, 436–458. [Google Scholar] [CrossRef] [PubMed]
- Cameron, C.M.; Rillema, J.A. Effects of cyclic nucleotides on lipid biosynthesis in mouse mammary gland explants. Proc. Soc. Exp. Biol. Med. 1983, 173, 306–311. [Google Scholar] [CrossRef] [PubMed]
- Gregor, P.D.; Sawadogo, M.; Roeder, R.G. The adenovirus major late transcription factor USF is a member of the helix-loop-helix group of regulatory proteins and binds to DNA as a dimer. Genes Dev. 1990, 4, 1730–1740. [Google Scholar] [CrossRef] [PubMed]
- Daetwyler, H.D.; Schenkel, F.S.; Sargolzaei, M.; Robinson, J.A. A genome scanto detect quantitative trait loci for economically important traits in Holstein cattle using two methods and a dense single nucleotide polymorphism map. J. Dairy Sci. 2008, 91, 3225–3236. [Google Scholar] [CrossRef] [PubMed]
- Martin, E.R.; Lai, E.H.; Gilbert, J.R.; Rogala, A.R.; Afshari, A.J.; Riley, J.; Finch, K.L.; Stevens, J.F.; Livak, K.J.; Slotterbeck, B.D.; et al. SNPing away at complex diseases: Analysis of single-nucleotide polymorphisms around APOE in Alzheimer disease. Am. J. Hum. Genet. 2000, 67, 383–394. [Google Scholar] [CrossRef] [PubMed]
- Nguyen, M.T.; Andrew, C.B.; Peter, B.M.; Yutao, L.; Russell, E.L. Single nucleotide polymorphisms in the actin and crustacean hyperglycemic hormone genes and their correlation with individual growth performance in giant freshwater prawn Macrobrachium rosenbergii. Aquaculture 2010, 301, 7–15. [Google Scholar] [CrossRef]
- BLAST Program. Available online: http://blast.ncbi.nlm.nih.gov/Blast.cgi (accessed on 29 July 2014).
- Kumar, S.; Nei, M.; Dudley, J.; Tamura, K. MEGA: A biologist-centric software for evolutionary analysis of DNA and protein sequences. Brief Bioinform. 2008, 9, 299–306. [Google Scholar] [CrossRef] [PubMed]
- TFSEARCH. Available online: http://www.cbrc.jp/research/db/TFSEARCH.html (accessed on 10 September 2014).
© 2015 by the authors; licensee MDPI, Basel, Switzerland. This article is an open access article distributed under the terms and conditions of the Creative Commons by Attribution (CC-BY) license (http://creativecommons.org/licenses/by/4.0/).
Share and Cite
Yang, S.-H.; Bi, X.-J.; Xie, Y.; Li, C.; Zhang, S.-L.; Zhang, Q.; Sun, D.-X. Validation of PDE9A Gene Identified in GWAS Showing Strong Association with Milk Production Traits in Chinese Holstein. Int. J. Mol. Sci. 2015, 16, 26530-26542. https://doi.org/10.3390/ijms161125976
Yang S-H, Bi X-J, Xie Y, Li C, Zhang S-L, Zhang Q, Sun D-X. Validation of PDE9A Gene Identified in GWAS Showing Strong Association with Milk Production Traits in Chinese Holstein. International Journal of Molecular Sciences. 2015; 16(11):26530-26542. https://doi.org/10.3390/ijms161125976
Chicago/Turabian StyleYang, Shao-Hua, Xiao-Jun Bi, Yan Xie, Cong Li, Sheng-Li Zhang, Qin Zhang, and Dong-Xiao Sun. 2015. "Validation of PDE9A Gene Identified in GWAS Showing Strong Association with Milk Production Traits in Chinese Holstein" International Journal of Molecular Sciences 16, no. 11: 26530-26542. https://doi.org/10.3390/ijms161125976
APA StyleYang, S.-H., Bi, X.-J., Xie, Y., Li, C., Zhang, S.-L., Zhang, Q., & Sun, D.-X. (2015). Validation of PDE9A Gene Identified in GWAS Showing Strong Association with Milk Production Traits in Chinese Holstein. International Journal of Molecular Sciences, 16(11), 26530-26542. https://doi.org/10.3390/ijms161125976