Article

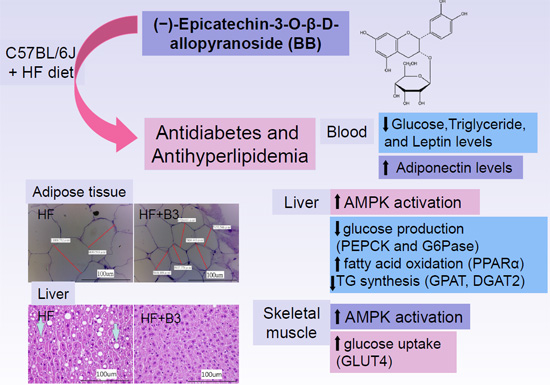
(−)-Epicatechin-3-O-β-d-allopyranoside from Davallia formosana, Prevents Diabetes and Hyperlipidemia by Regulation of Glucose Transporter 4 and AMP-Activated Protein Kinase Phosphorylation in High-Fat-Fed Mice

1
Graduate Institute of Pharmaceutical Science and Technology, College of Health Science, Central Taiwan University of Science and Technology, Taichung City 40601, Taiwan
2
Graduate Institute of Pharmaceutical Chemistry, China Medical University, Taichung City 40402, Taiwan
3
Department of Internal Medicine, Fong-Yuan Hospital, Department of Health, Executive Yuan, Fong-Yuan District, Taichung City 42055, Taiwan
4
Jen Li Biotech Company Ltd., Taiping District, Taichung City 41143, Taiwan
*
Author to whom correspondence should be addressed.
Int. J. Mol. Sci. 2015, 16(10), 24983-25001; https://doi.org/10.3390/ijms161024983
Submission received: 16 August 2015 / Revised: 30 September 2015 / Accepted: 12 October 2015 / Published: 20 October 2015
(This article belongs to the Section Biochemistry)

Abstract

:
The purpose of this experiment was to determine the antidiabetic and lipid-lowering effects of (−)-epicatechin-3-O-β-d-allopyranoside (BB) from the roots and stems of Davallia formosana in mice. Animal treatment was induced by high-fat diet (HFD) or low-fat diet (control diet, CD). After eight weeks of HFD or CD exposure, the HFD mice were treating with BB or rosiglitazone (Rosi) or fenofibrate (Feno) or water through gavage for another four weeks. However, at 12 weeks, the HFD-fed group had enhanced blood levels of glucose, triglyceride (TG), and insulin. BB treatment significantly decreased blood glucose, TG, and insulin levels. Moreover, visceral fat weights were enhanced in HFD-fed mice, accompanied by increased blood leptin concentrations and decreased adiponectin levels, which were reversed by treatment with BB. Muscular membrane protein levels of glucose transporter 4 (GLUT4) were reduced in HFD-fed mice and significantly enhanced upon administration of BB, Rosi, and Feno. Moreover, BB treatment markedly increased hepatic and skeletal muscular expression levels of phosphorylation of AMP-activated (adenosine monophosphate) protein kinase (phospho-AMPK). BB also decreased hepatic mRNA levels of phosphenolpyruvate carboxykinase (PEPCK), which are associated with a decrease in hepatic glucose production. BB-exerted hypotriglyceridemic activity may be partly associated with increased mRNA levels of peroxisome proliferator activated receptor α (PPARα), and with reduced hepatic glycerol-3-phosphate acyltransferase (GPAT) mRNA levels in the liver, which decreased triacylglycerol synthesis. Nevertheless, we demonstrated BB was a useful approach for the management of type 2 diabetes and dyslipidemia in this animal model.

Graphical Abstract

1. Introduction

It is estimated that the population of diabetes mellitus will reach 300 million by 2025. Type 2 diabetes mellitus causes high glucose levels in the blood due to enhanced liver glucose production, or “insulin resistance” (insensitive response to insulin by peripheral tissues). Type 2 diabetes mellitus represents over 90% of diabetes cases [1]. Type 2 diabetes mellitus is involved in numerous factors (such as obesity and family history) [2]. Both genetics and lifestyle play significant roles [3]. Mice were induced with a high-fat diet (HFD) to cause aberrant muscular glucose uptake faults, insulin resistance, hyperglycemia, hyperlipidemia, hyperinsulinemia, hyperleptinemia, obesity, and excess circulating free fatty acid [4].
Davallia formosana Hayata (Davalliaceae) in Taiwan’s herbal market is also known as Gu-Sui-Bu, which is substituted for Drynaria fortune and is employed to treat rheumatoid arthritis. The former name of Davalli formosana in the flora of Taiwan is Davallia orientalis C. Chr. (1932–1975) and Davallia divaricata Bl. (1975–1991). The official nomenclature has been Davallia formosana since 1994 [5]. The bioactive components of Davalli divaricata are demonstrated to be davallic acid [6] and flavan-3-ol and proanthocyanidin allosides [7].
It was observed that some of the antidiabetic agents have been shown to be favorable to osteogenesis and decreasing adipogenesis. Metformin has favorable effects on osteoblast differentiation and calcium accretion in streptozotocin-induced diabetes mellitus (DM) rats [8,9]. Moreover, extract of cinnamon bark displayed facilitated bone formation [9,10], which is associated with regulating serum insulin and adiponectin levels and improving insulin sensitivity, thus exhibiting both antihyperglycemic and antihyperlipidemic action. The effects of (−)-epicatechin-3-O-β-d-allopyranoside (BB) (Figure 1) from Davallia formosana displayed a favorable effect on bone loss; nevertheless, the effects of BB on antihyperglycemic and antihyperlipidemic action remain unknown. Therefore, we investigate the antidiabetic and lipid-lowering effects of BB in mice.
The glucose transporter 4 (GLUT4) plays a vital role in controlling whole body glucose homeostasis [11]. Insulin is secreted after a meal (included carbohydrates), and followed by stimulating glucose transport. In response to insulin and other stimuli, GLUT4 has been shown from intracellular disposition, acutely redistributing to the plasma membrane [11,12]. The upregulation of GLUT4 expression in skeletal muscle was observed in response to exercise in a mouse model to affect glucose levels in blood [11,13]. Thus, treatments that target enhancing GLUT4 proteins are vital points for the reduction of diabetes. Regarding the enhanced movement of GLUT4 from cytosol to membrane, there are some important pathways: (1) the insulin signaling pathway, and (2) the contraction- [14,15] or hypoxia-mediated stimulation of AMP-activated protein kinase (AMPK) [15,16].
Figure 1. Structure of (−)-epicatechin-3-O-β-d-allopyranoside (BB).
Ijms 16 24983 g001
AMPK plays a key role in glucose and lipid metabolism. Metformin is an agent in the management of type 2 diabetes, and acts to improve blood glucose control mainly by the inhibition of liver glucose production and increased peripheral glucose uptake [15,17]. Therefore, AMPK activation could have favorable effects in peripheral tissues in type 2 diabetes [15,17].
Thiazolidinediones (TZDs) have been used to treat type 2 diabetes, and belong to peroxisome proliferator-activated receptor γ (PPARγ) agonists. TZDs, including rosiglitazone, decrease glucose levels in the blood [18]. Rosiglitazone acts to enhance insulin sensitivity and protein levels of GLUT4 [19,20]. Fenofibrate (belongs to a PPARα activator) has been used to treat human hyperlipidemia and lower blood triglyceride levels [21,22]. PPARα is a major regulator of genes involved in lipid metabolism [23]. By regulating fatty acid oxidation and lipogenesis, the PPARα agonist leads to decreasing blood triglyceride levels [24]. TZDs and metformin both cause AMPK activation. The difference between TZDs and metformin is that TZDs could enhance adiponectin and cause AMPK activation [25,26]. The enhanced adiponectin levels are involved in reduced hepatic fat pads and ameliorated insulin resistance [26]. Therefore, we employ Rosi and Feno as positive control.
The present study employs C57BL/6J mice on a high-fat diet (HFD) to examine the glucose- and lipid-lowering activities of BB compared with rosiglitazone (Rosi) and fenofibrate. AMPK activity depends on phosphorylation of Thr 172 of α subunits [27]. This study is to monitor the hypothesis that BB could improve expression levels of phospho-AMPK, protein levels of GLUT4, and target gene mRNA levels in diabetes and hyperlipidemia in peripheral tissues following four weeks of administration of BB. Our results imply that enhanced expression levels of phospho-AMPK and protein levels of GLUT4 are key targets of BB to ameliorate diabetic and dyslipidemic events.

2. Results

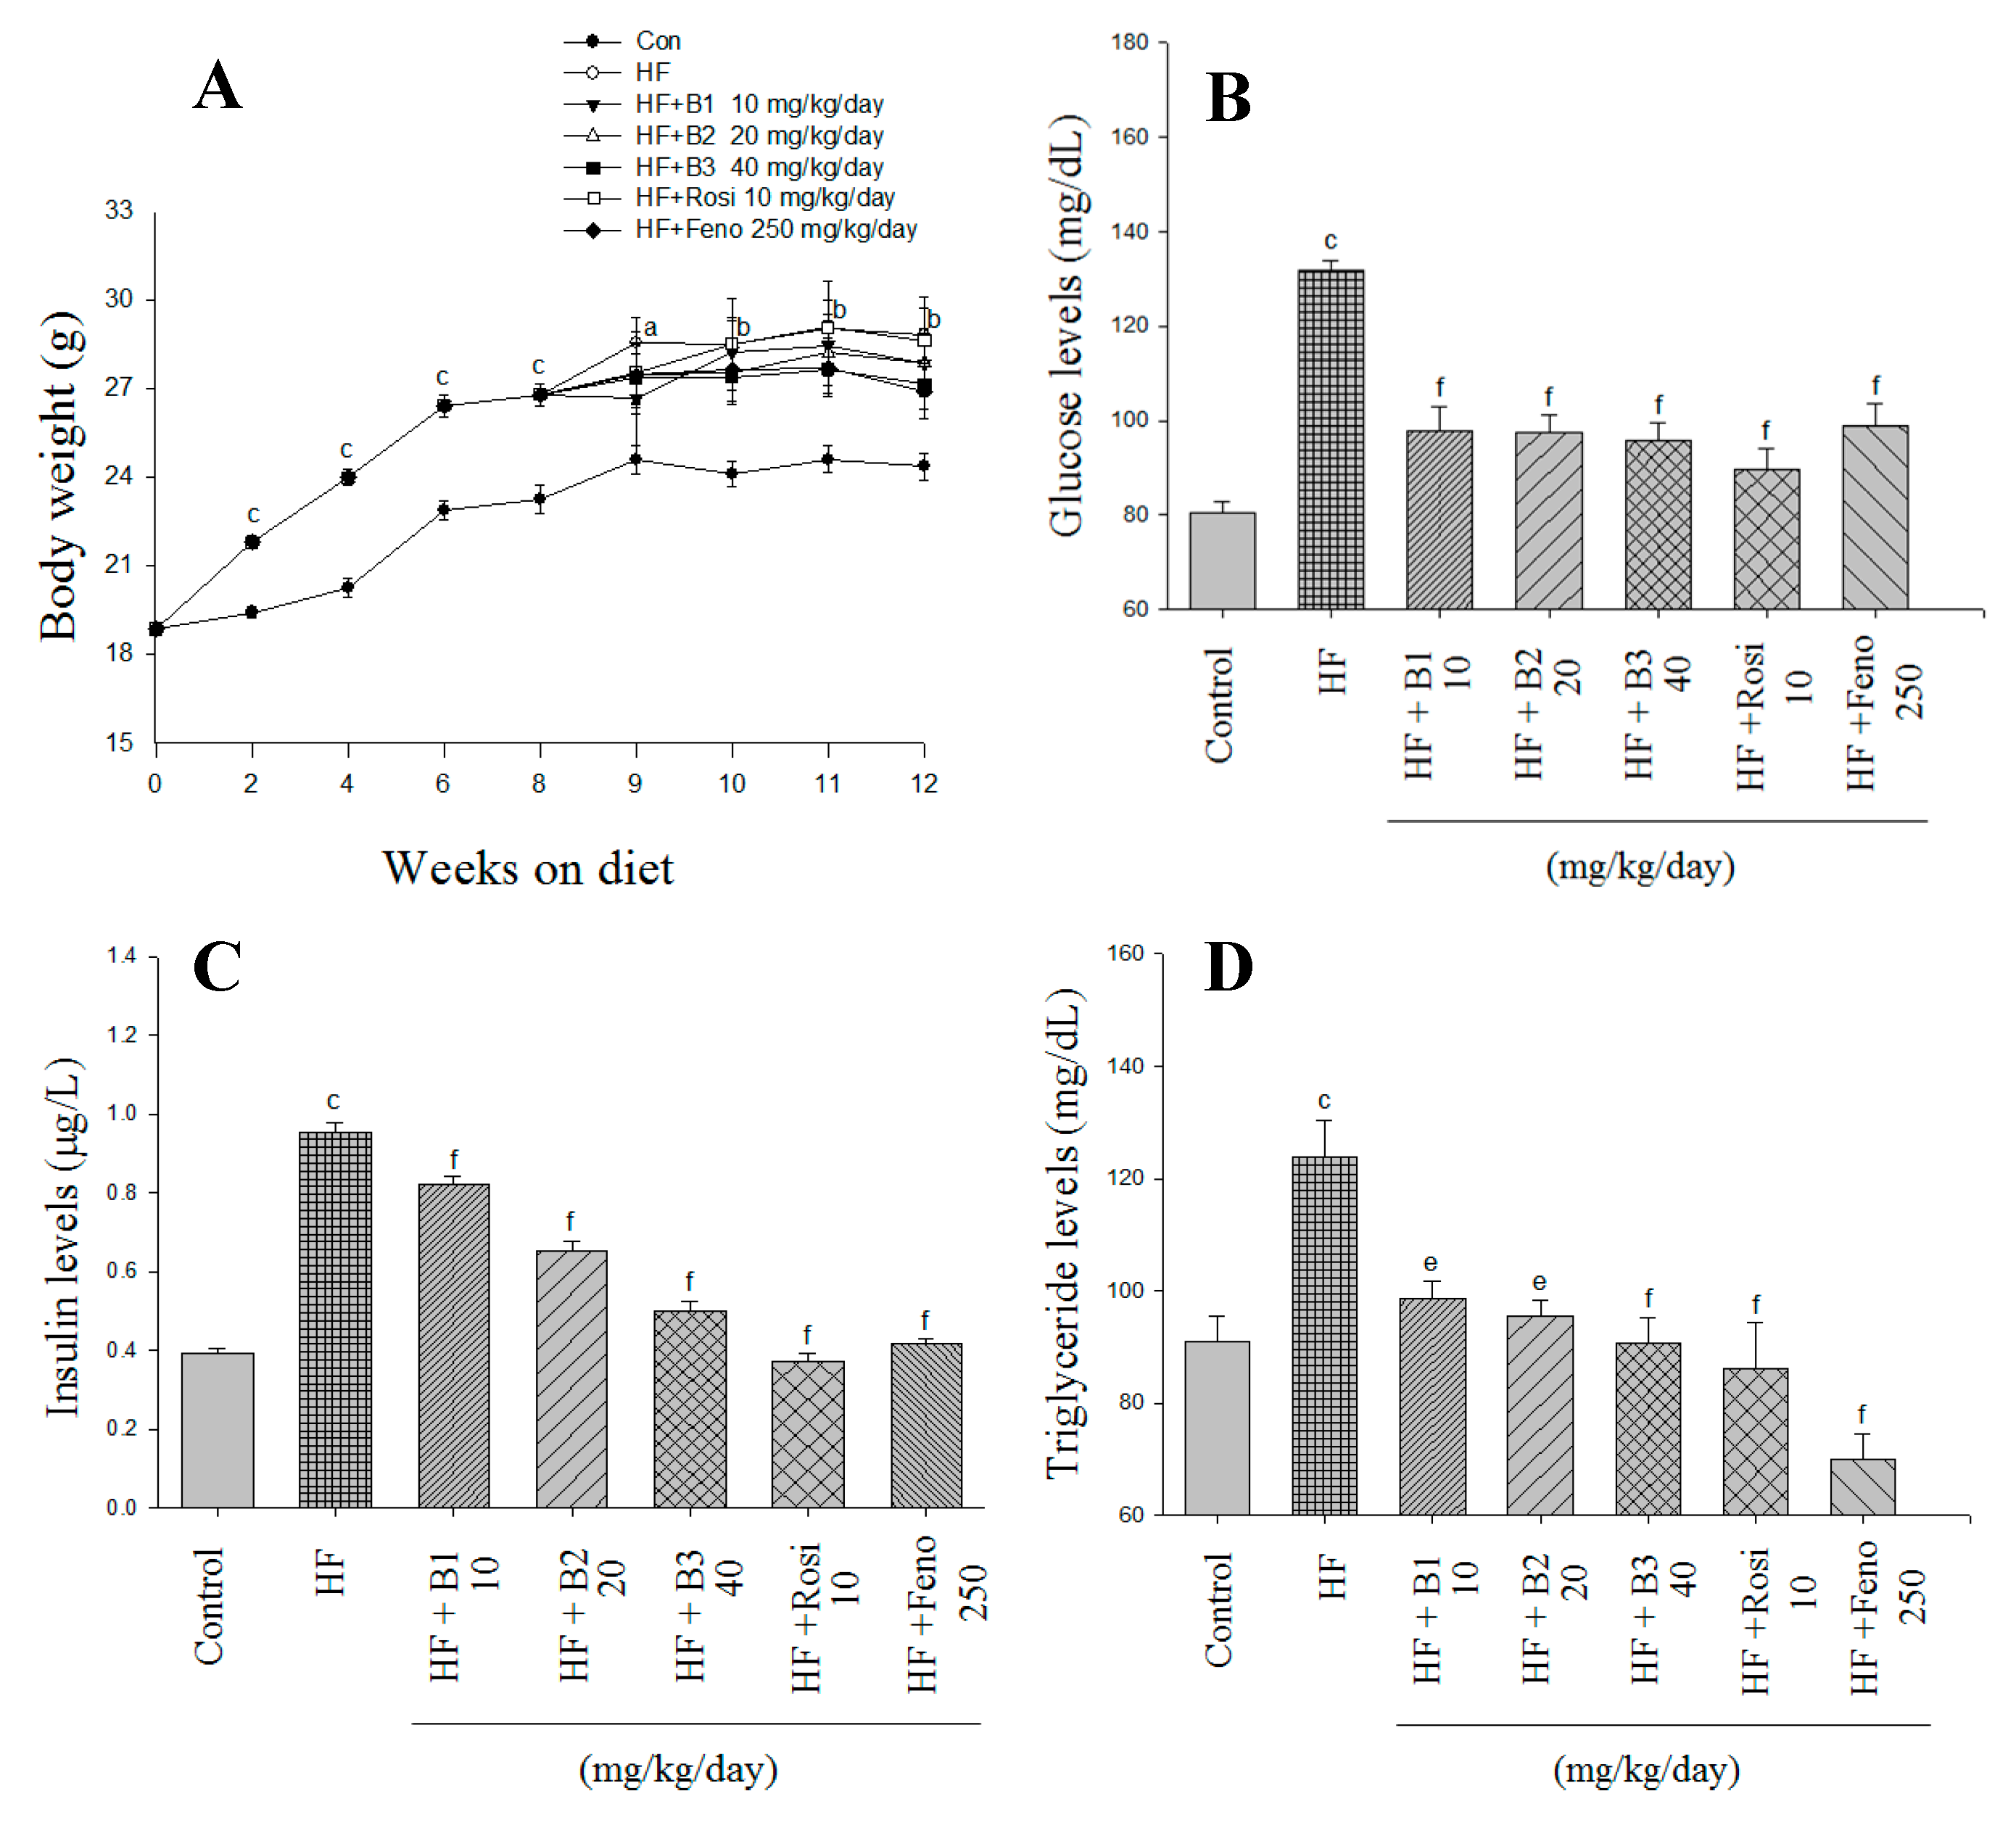
2.1. Body Weight, Weight Gain, Diet Consumption, and Weights of Tissue

At the beginning, the mean body weights of each group are similar (18.86 ± 0.12 g). After 12 weeks on HFD, mice elicit increased body weight and body weight gain (Figure 2A and Table 1). No difference was observed in body weight when a comparison was made between the B1-, B2-, B3-, Rosi-, and Feno-administered groups and the HF (high-fat control) group (Figure 2A). B3- and Feno-treated mice displayed reduced weight gain compared with HF littermates (Table 1). HF mice consume a HFD (g) much less than CON (control) mice (p < 0.001) (Table 1). Food intake of BB-, Rosi-, and Feno-treated groups is similar to that of the HF group. Mice on HFD display increased epididymal white adipose tissue (EWAT) and retroperitoneal WAT (RWAT), visceral fat, mesenteric WAT (MWAT), skeletal muscle, and brown adipose tissue (BAT) weights compared to CON mice (Table 1). All of the BB-, Rosi-, and Feno-treated groups showed reduced EAWT and RWAT and visceral fat weights. B3-treated mice exhibit increases in skeletal muscle weights (p < 0.05) while Feno-treated mice display increased liver weights (p < 0.001) (Table 1).
Figure 2. Effects of (−)-epicatechin-3-O-β-d-allopyranoside (BB) on (A) body weight; (B) blood glucose levels; (C) insulin levels; and (D) triglyceride levels at week 12. Mice were fed with a 45% high-fat diet (HF; high-fat diet control) or low-fat diet (CON) for 12 weeks. After eight weeks of induction, the HF mice were treated with vehicle, or (−)-epicatechin-3-O-β-d-allopyranoside (BB), or rosiglitazone (Rosi), or fenofibrate (Feno) accompanied with a HF diet for four weeks. All values are means ± SE (n = 9). a p < 0.05, b p < 0.01, c p < 0.001 compared with the control (CON) group; e p < 0.01, and f p < 0.001 compared with the high-fat plus vehicle (distilled water) (HF; high-fat diet control) group. (−)-epicatechin-3-O-β-d-allopyranoside (BB): B1: 10, B2: 20, B3: 40 mg/kg body wt; Rosi: rosiglitazone (10 mg/kg body wt); Feno: fenofibrate (250 mg/kg body wt). BAT, brown adipose tissue; RWAT, retroperioneal white adipose tissue; MWAT, mesenteric white adipose tissue; FFA, plasm free fatty acid; visceral fat represented epididymal WAT plus retroperitoneal WAT.
Ijms 16 24983 g002
Table 1. Effects of (−)-epicatechin-3-O-β-d-allopyranoside (BB) on absolute tissue weight, body weight gain, food intake, liver lipid, and blood parameters. All values are means ± SE (n = 9). a p < 0.05, b p < 0.01, and c p < 0.001 compared with the low-fat diet (CON) group; d p < 0.05, e p < 0.01, and f p < 0.001 compared with the high-fat plus vehicle (distilled water) (HF; high-fat diet control) group. (−)-epicatechin-3-O-β-d-allopyranoside (BB): B1: 10, B2: 20, B3: 40 mg/kg body wt; Rosi: rosiglitazone (10 mg/kg body wt); Feno: fenofibrate (250 mg/kg body wt). BAT, brown adipose tissue; RWAT, retroperioneal white adipose tissue; MWAT, mesenteric white adipose tissue; FFA, plasm free fatty acid.
ParameterCONHFHF + B1HF + B2HF + B3HF + RosiHF + Feno
Dose (mg/kg/day)0010204010250
Absolute tissue weight (g)
EWAT0.415 ± 0.0291.303 ± 0.123 c0.906 ± 0.105 d0.902 ± 0.084 d0.936 ± 0.075 d0.919 ± 0.097 d0.763 ± 0.116 f
MWAT0.139 ± 0.0240.310 ± 0.027 b0.293 ± 0.0180.267 ± 0.0210.236 ± 0.0300.302 ± 0.0290.264 ± 0.056
RWAT0.089 ± 0.0120.469 ± 0.057 c0.280 ± 0.043 d0.263 ± 0.034 f0.233 ± 0.026 f0.224 ± 0.032 f0.173 ± 0.032 f
Visceral fat0.504 ± 0.0391.772 ± 0.173 c1.273 ± 0.147 d1.199 ± 0.104 e1.198 ± 0.075 e1.143 ± 0.124 e0.936 ± 0.147 f
Skeletal muscle0.662 ± 0.0360.874 ± 0.078 a0.873 ± 0.0600.813 ± 0.0771.156 ± 0.102 d0.960 ± 0.0780.990 ± 0.078
BAT0.084 ± 0.0080.171 ± 0.014 b0.168 ± 0.0110.156 ± 0.0170.144 ± 0.0100.206 ± 0.0120.139 ± 0.011
Liver (g)0.879 ± 0.0190.884 ± 0.0350.899 ± 0.0360.866 ± 0.0360.848 ± 0.0280.886 ± 0.0311.699 ± 0.033 f
Weight gain (g)0.01 ± 0.190.89 ± 0.16 a0.40 ± 0.280.61 ± 0.43−0.05 ± 0.11 d0.38 ± 0.32−0.58 ± 0.48 d
Body weight (g)24.37 ± 0.4628.80 ± 0.93 b27.85 ± 1.0427.88 ± 1.1427.15 ± 0.8428.61 ± 1.5126.92 ± 0.96
Food intake (g/day/mouse)2.40 ± 0.042.14 ± 0.04 c2.08 ± 0.052.03 ± 0.032.02 ± 0.032.11 ± 0.062.14 ± 0.04
Liver lipids
Total lipid (mg/g)55.3 ± 4.599.1 ± 7.1 b71.9 ± 6.5 d66.1 ± 6.9 e60.2 ± 5.2 f70.1 ± 8.2 d62.4 ± 3.9 f
Triacylglycerol (μmol/g)42.1 ± 4.581.1 ± 7.8 b49.9 ± 8.0 d42.8 ± 6.5 f40.8 ± 4.6 f52.1 ± 7.7 d43.8 ± 5.6 f
Blood profiles
FFA (mEq/L)1.02 ± 0.101.48 ± 0.23 b1.11 ± 0.13 d0.95 ± 0.04 f0.86 ± 0.09 f1.08 ± 0.11 e0.91 ± 0.08 f
TC (mg/dL)104.6 ± 8.6163.8 ± 7.2 c153.5 ± 7.7144.1 ± 4.0142.9 ± 6.6111.5 ± 2.3 f104.5 ± 5.5 f
Leptin (ng/mL)1.359 ± 0.0442.133 ± 0.044 c1.662 ± 0.009 f1.372 ± 0.029 f1.321 ± 0.008 f1.661 ± 0.013 f1.206 ± 0.015 f
Adiponectin (μg/mL)2.737 ± 0.0212.153 ± 0.036 c2.895 ± 0.010 f3.277 ± 0.052 f3.628 ± 0.034 f3.058 ± 0.040 f3.101 ± 0.028 f

2.2. Glucose and Insulin Levels in Blood

After 12 weeks on HFD exposure, the HF group showed evidence of hyperglycemia and hyperinsulinenia. Treatment with B1, B2, B3, Rosi, and Feno markedly lowered the blood levels of glucose and insulin (Figure 2B,C).

2.3. Blood Lipid, Leptin, and Adiponectin Levels, and Hepatic Lipid

At 12 weeks of HFD exposure, the HF mice had enhanced circulating levels of triglycerides (TG) (Figure 2D), total cholesterol (TC), leptin, and free fatty acid, whereas there were decreased adiponectin levels (Table 1). Administration of BB, Rosi, and Feno decreased TG levels. Rosi- and Feno-treated mice had lower TC levels. The BB-, Rosi-, and Feno-administered mice displayed reduced blood concentrations of leptin, whereas they had enhanced blood levels of adiponectin. Feeding a HFD not only enhanced total lipids but also triacylglycerol levels in liver tissue. Administration of B1, B2, B3, Rosi, and Feno decreased total lipids and triacylglycerol in the liver (Table 1).
Figure 3. Pathological effects of (−)-epicatechin-3-O-β-d-allopyranoside (BB) on epididymal white adipose tissue (WAT) in the low-fat (CON), high-fat (HF; high-fat diet control), HF + B1, HF + B2, HF + B3, or HF + Rosi, and HF + Feno groups. Pictures of hematoxylin and eosin-stained sections of epididymal adipocytes (Magnification: 10 (ocular) ×20 (object lens)) from mice fed with BB. The appearance of adipocytes is polyhedral and displayed the string-like cytosol surrounded by a vacuole. Each presented is typical and representative of nine mice. (−)-Epicatechin-3-O-β-d-allopyranoside (BB): B1: 10, B2: 20, B3: 40 mg/kg body wt; Rosi: rosiglitazone (10 mg/kg body wt); Feno: fenofibrate (250 mg/kg body wt).
Ijms 16 24983 g003

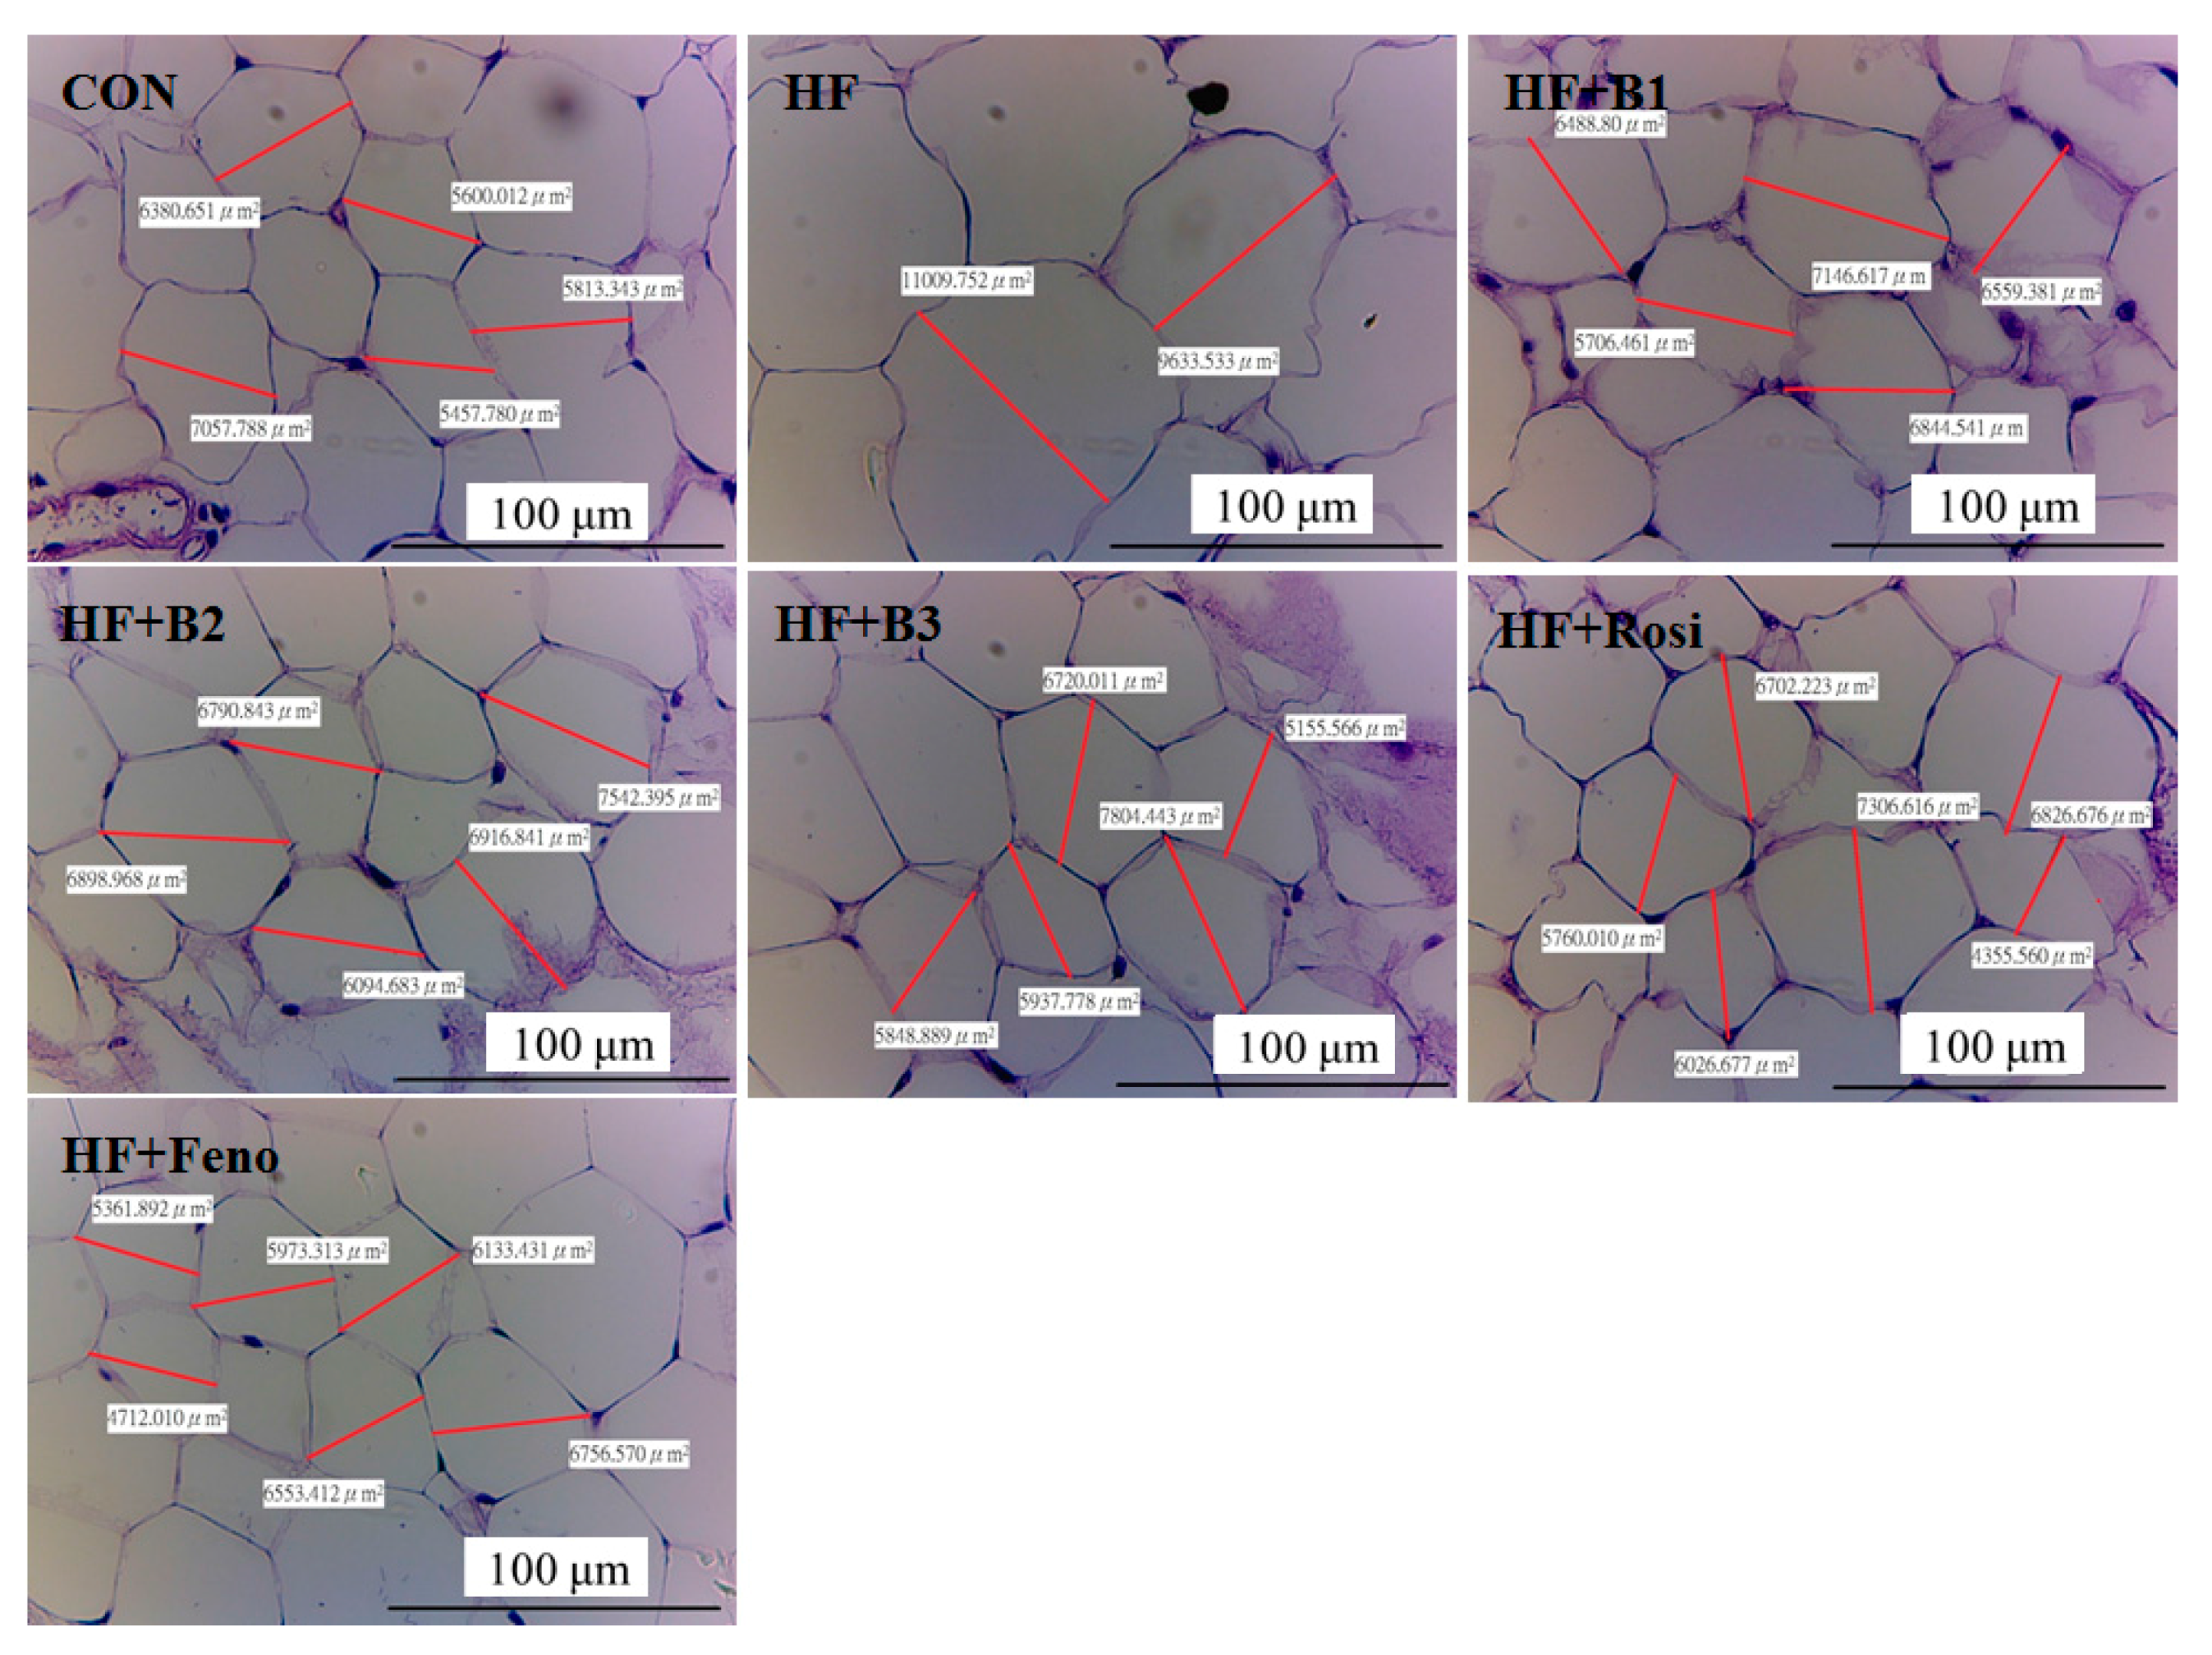
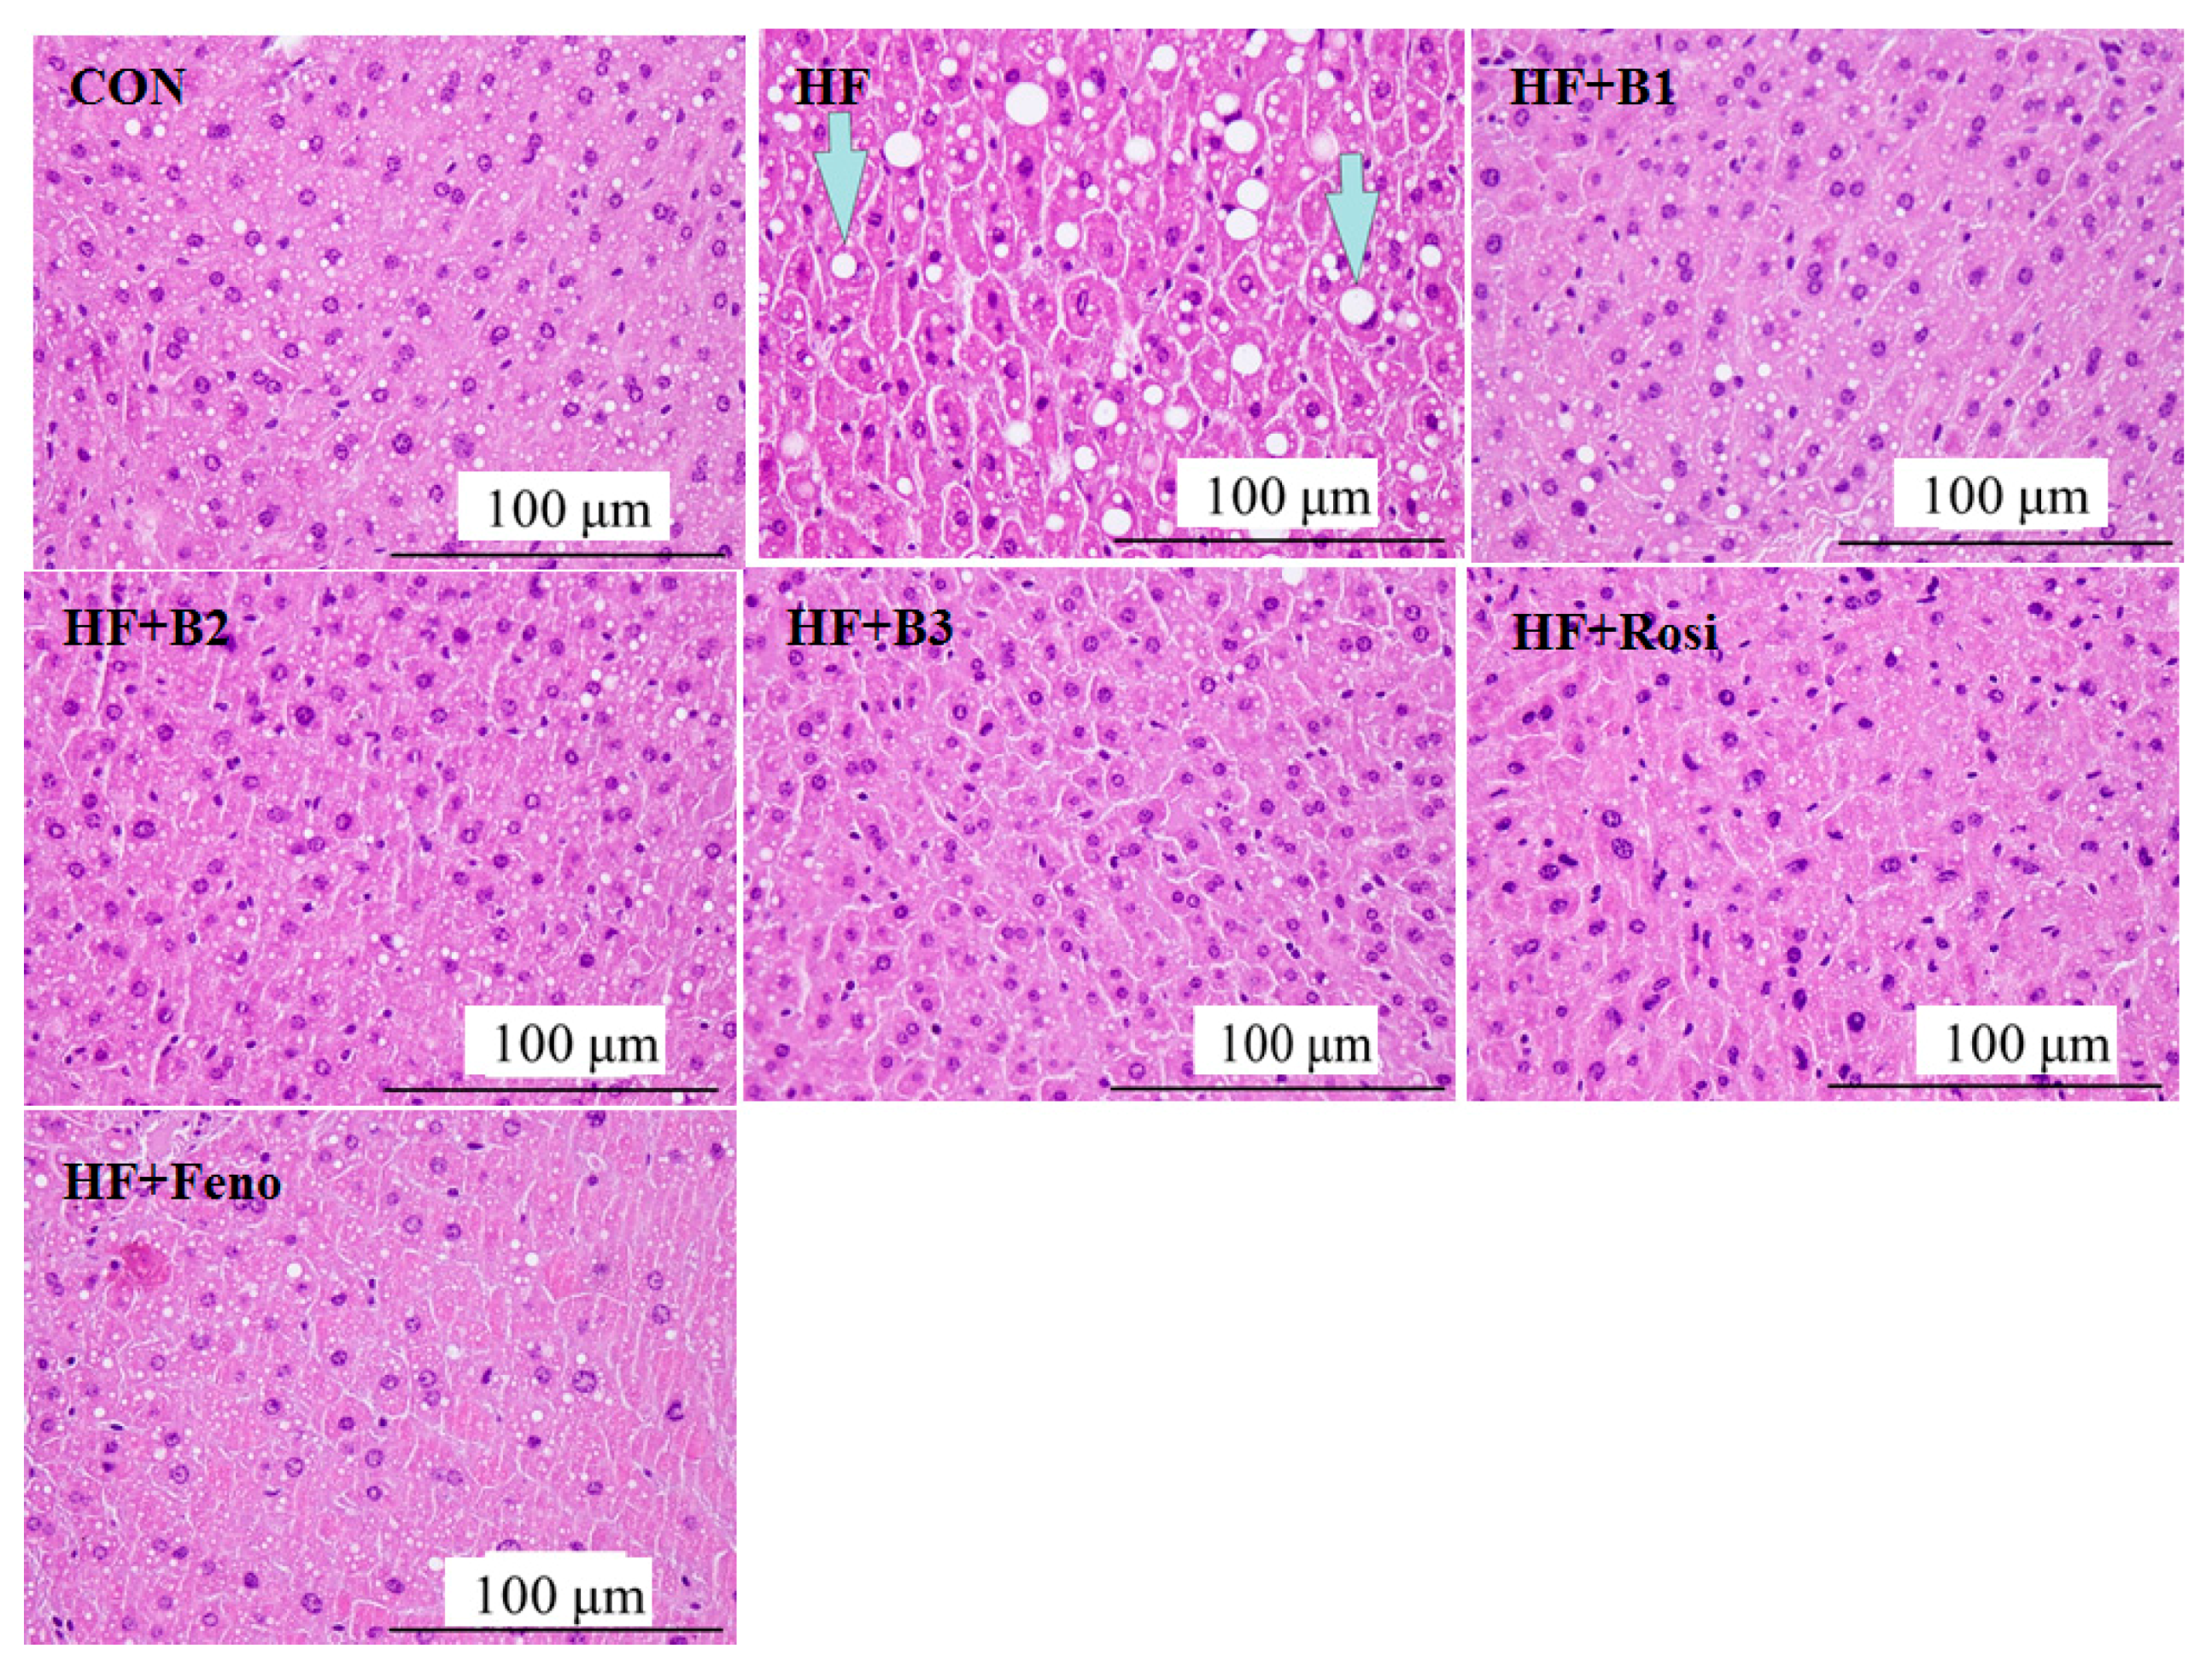
2.4. Pathological Investigation

After 12 weeks on HFD, HF mice caused the adipocytes to hypertrophy (the areas of HF mice and CON mice are 10216.4 ± 338.4 and 5347.5 ± 408.9 μm2, respectively), while mice administered with B1 (6882.8 ± 102.2 μm2), B2 (6475.5 ± 102.6 μm2), B3 (6192.7 ± 100.7 μm2), and Feno (5886.4 ± 58.7 μm2) displayed significant resistance to hypertrophy. The average data in Rosi-treated mice are 6982.3 ± 309.7 µm2 (Figure 3). Each image was carried out three times.
HFD caused significant ballooning degeneration of hepatocytes. Our findings show that HFD caused the ballooning degeneration in the liver of HF mice, which means hepatocyte death and accumulated glycogen in the center, and it was observed that the nucleolus was squeezed into the side, which is the so-called ballooning (the indicated arrow). Based on a previous report [28], the designation of histological hepatocellular ballooning findings included grade 0, none; grade 1, a few cells; grade 2, many cells. HFD caused ballooning evident in HF mice (mean score = 1.9 ± 0.2). The appearance of ballooning is lower in the B1-treated (0.7 ± 0.1), B2-treated (0.5 ± 0.2), B3-treated (0.4 ± 0.1), Rosi-treated (0.8 ± 0.2), and Feno-treated (0.6 ± 0.1) mice. Treatment with B1, B2, B3, Rosi, and Feno reduced the ballooning phenomenon (Figure 4).
Figure 4. Pathological effects of (−)-epicatechin-3-O-β-d-allopyranoside (BB) on liver tissue morphology in the low-fat (CON), high-fat (HF; high-fat diet control), HF + B1, HF + B2, HF + B3, or HF + Rosi, and HF + Feno groups. Pictures of hematoxylin and eosin-stained sections of liver tissue (Magnification: 10 (ocular) × 20 (object lens)) from mice fed with (−)-epicatechin-3-O-β-d-allopyranoside (BB). The high-fat diet (HFD) induced obesity and insulin resistance. Each presented is typical and representative of nine mice. (−)-epicatechin-3-O-β-d-allopyranoside (BB): B1: 10, B2: 20, B3: 40 mg/kg body wt; Rosi: rosiglitazone (10 mg/kg body wt); Feno: fenofibrate (250 mg/kg body wt).
Ijms 16 24983 g004

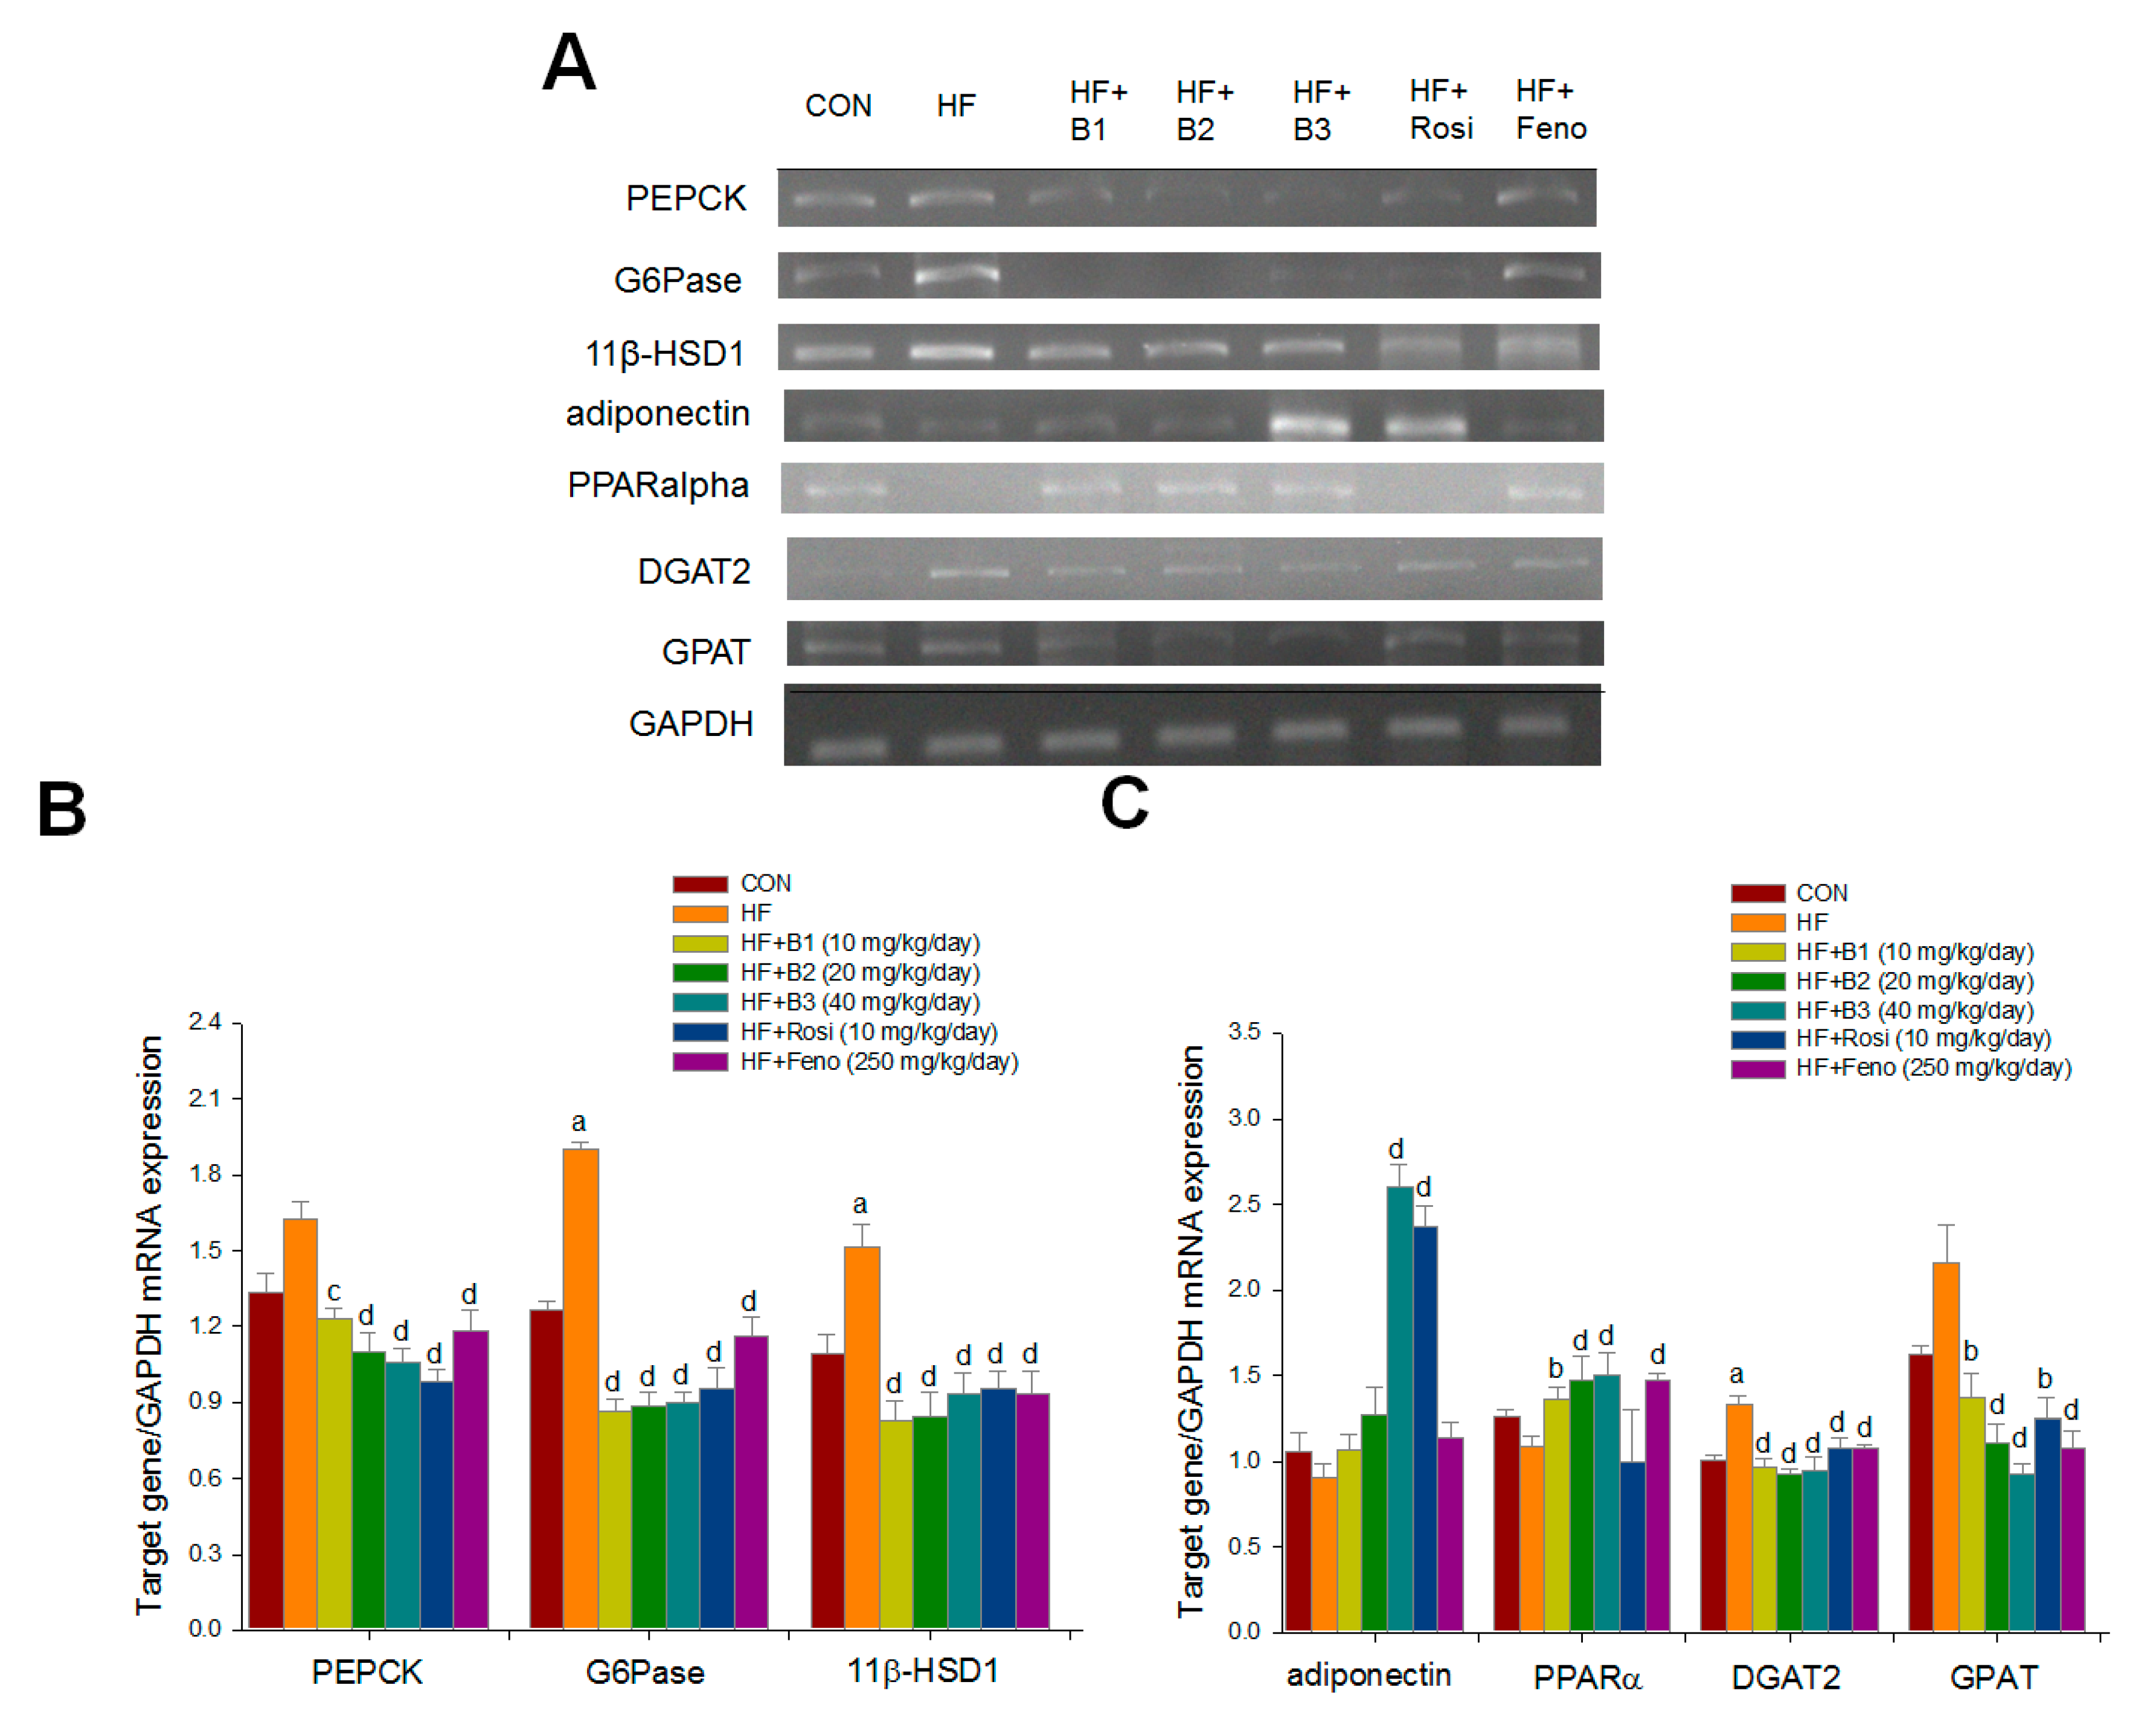
2.5. Hepatic Related Gene mRNA Levels

HFD caused an increase in the mRNA levels of glucose-6-phosphatase (G6 Pase), and 11β hydroxysteroid dehydrogenase 1 (11β-HSD1). Administration of B1, B2, B3, Rosi, and Feno led to reduced mRNA levels of phosphenolpyruvate carboxykinase (PEPCK), G6 Pase, 11β-HSD1, acyl-coenzyme A: diacylglycerol acyltransferase (DGAT2), and glycerol-3-phosphate-acyltransferase (GPAT). B3 and Rosi treatments enhanced adiponectin mRNA levels. Administration of B1, B2, B3, and Feno enhanced PPARα mRNA levels (Figure 5A–C).
Figure 5. Semi-quantative transcription-polymerase chain reaction (RT-PCR) analysis on PEPCK, glucose-6-phosphatase (G6Pase), 11β-HSD1, adiponectin, PPARα, DGAT2, and GPAT mRNA expression in liver tissue of the mice receiving (−)-epicatechin-3-O-β-d-allopyranoside (BB) by oral gavage for four weeks. (A) Representative image; (B) and (C) Mean ± SE, target gene/GAPDH mRNA expression. All values are means ± SE (n = 9). a p < 0.001 compared with the low-fat diet (CON) group; b p < 0.05, c p < 0.01, and d p < 0.001 compared with the high-fat plus vehicle (HF; high-fat diet control) group. (−)-epicatechin-3-O-β-d-allopyranoside (BB): B1: 10, B2: 20, B3: 40 mg/kg body wt; Rosi: rosiglitazone (10 mg/kg body wt); Feno: fenofibrate (250 mg/kg body wt). Total RNA (1 μg) isolated from tissue was reverse transcripted by MMLV-RT, 10 μL of RT products were used as templates for PCR. Signals were quantitated by image analysis; each value was normalized by GAPDH.
Ijms 16 24983 g005

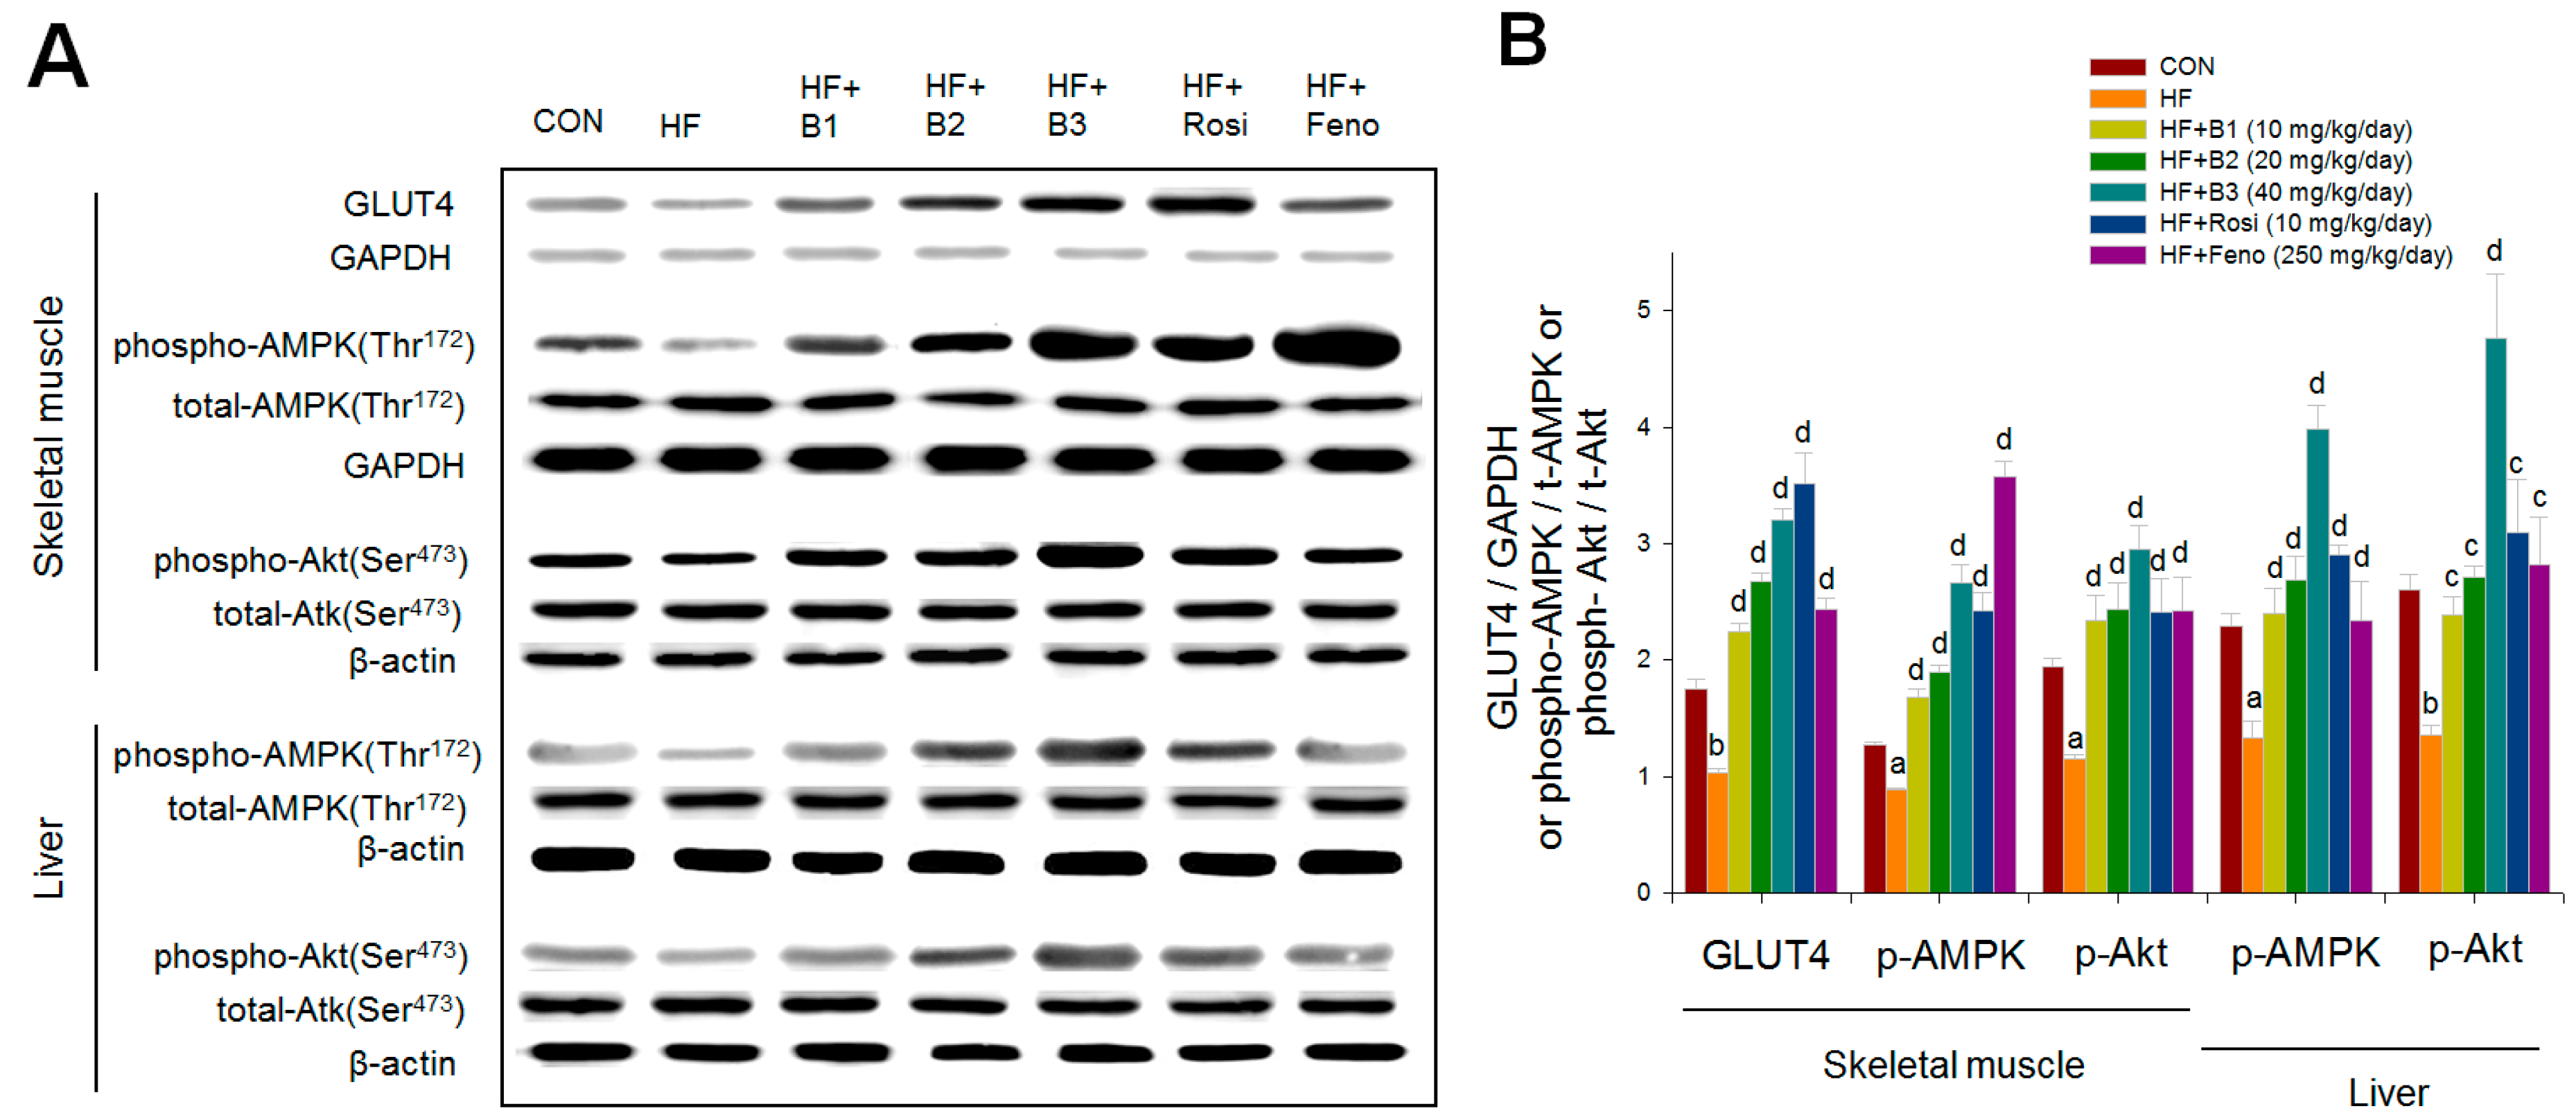
2.6. Western Blotting

HFD caused a decrease in skeletal muscular expression levels of GLUT4. Following treatment with BB, Rosi, and Feno, membrane protein levels of GLUT4 were significantly enhanced. It was observed that HFD caused a decrease in expression levels of phospho-AMPK/total AMPK in both muscle and liver. Administration of BB, Rosi, and Feno enhanced expression levels of phospho-AMPK/total AMPK in these two tissues. The expression levels of phospho-Akt/total Akt in both muscle and liver tissue were lower in HF mice compared with CON mice. B1, B2, B3, Rosi, and Feno treatments displayed increases in both tissues in the expression levels of phospho-Akt/total Akt (Figure 6A,B).
Figure 6. The protein contents of GLUT4 in skeletal muscle, and the expression levels of phospho-AMPK (Thr172)/total AMPK and phospho-Akt/total Akt in skeletal muscle and liver tissue of the mice receiving (−)-epicatechin-3-O-β-d-allopyranoside (BB) by oral gavage for four weeks. Protein was separated by 12% SDS-PAGE detected by Western blot. (A) Representative image; (B) Mean ± SE, GLUT4/GAPDH or phospho-AMPK/t-AMPK or Phospho-Akt/t-Akt expression levels. All values are means ± SE (n = 9). a p < 0.05, and b p < 0.001 compared with the low-fat diet (CON) group; c p < 0.05, and d p < 0.001 compared with the high-fat plus vehicle (HF; high-fat diet control) group. (−)-epicatechin-3-O-β-d-allopyranoside (BB): B1: 10, B2: 20, B3: 40 mg/kg body wt; Rosi: rosiglitazone (10 mg/kg body wt); Feno: fenofibrate (250 mg/kg body wt).
Ijms 16 24983 g006

3. Discussion

The aim of this study is to examine antidiabetic and antihyperlipidemic activity and molecular mechanisms of BB using high-fat diet (HFD)-fed mice. The present results indicate that HFD induced the hyperglycemia, hypertriglyceridemia, and hyperinsulinemia consistent with reported hyperglycemia, hyperlipidemia, hyperinsulinemia, hyperleptinemia, obesity, and excess circulating free fatty acid [29,30]. BB-treated HFD-fed mice had reduced blood insulin levels, concomitant with a decrease in blood glucose level, implying insulin hypersensitivity. Adiponectin has shown to enhance insulin sensitivity, and its decreased production is associated with insulin resistance [31]. Rosi has shown to be one of the thiazolinediones (TZDs) and acts as an insulin-sensitizing drug and increases blood concentrations of adiponectin in patients with type 2 diabetes [31]. In the present study, HFD elicited the hypoadiponectinemia, which was significantly increased by BB and Rosi. Collectively, these data further demonstrated that BB can provide a useful approach in enhancing insulin sensitivity. Moreover, BB treatment lowered circulating triglyceride levels, establishing that BB indeed displays antidiabetic and antihyperlipidemic activity.
Visceral obesity is demonstrated to act at the core of the metabolic syndrome’s pathogenesis including insulin resistance and hyperlipidemia, and it was observed that BB decreased fat accumulation with lowered EWAT weights as well as reduced visceral fat mass. Thus, BB is thought to have therapeutic potential to ameliorate visceral fat mass, insulin resistance, and dyslipidemia.
To examine the molecular mechanism of antidiabetic effects of BB, we investigated muscular expression levels of GLUT4. Since glucose uptake in skeletal muscle contributed to the main part of glucose disposal in peripheral tissues, skeletal muscular GLUT4 contents were monitored following BB treatment in HFD-fed mice, and were compared to Rosi, which is demonstrated to enhanced insulin sensitivity. GLUT4 is the major regulator of glucose levels in blood. The levels of GLUT4 assess the movement of the insulin-responsive GLUT4 to the plasma membrane [11]. In this study, HFD caused a decrease in muscular expression levels of GLUT4 in HFD-fed mice. We observed BB and Rosi treatments displayed 3.11-fold and 3.41-fold enhancement, respectively, in the protein contents of GLUT4, showing that increased protein contents of GLUT4 contribute to the effect of BB in increasing sensitivity to insulin and glucose uptake, thus leading to reductions in blood glucose levels.
On the other hand, Akt (PKB) has been shown to stimulate glucose uptake by influencing glucose transporter 4 (GLUT4) [32]. BB also caused enhanced expression levels of Akt phosphorylation in skeletal muscle, indicating that BB can stimulate glucose transport activity partly in the insulin-dependent manner.
Based on this, AMPK is demonstrated to be important in the metabolism of glucose and lipids, thus AMPK phosphorylation in both muscle and liver tissue by BB was studied. The antidiabetic drug metformin is used in the management of Type 2 diabetes mellitus (T2DM). Previous study demonstrated that metformin lowered glucose levels mainly by inhibiting liver glucose production and increased peripheral glucose uptake [16]. Metformin could enhance muscular activation of AMPK [16]. AMPK could induce GLUT4 redistribution to the cell membrane in an insulin-independent manner [16]. In this study, BB caused an increase in muscular expression levels of AMPK phosphorylation, presumably partly via promoting membrane translocation of GLUT4, and stimulating glucose uptake in an insulin-independent manner.
PEPCK and G6Pase are rate-limiting enzymes in the gluconeogenic process [33]. Renovation of enhanced PEPCK expression is thought to be a positive methodology in treating the diabetic state [34,35]. Metformin has been shown to activate AMPK, and this is followed by the decreased PEPCK and G6 Pase gene [36]. We also observed administration of BB-reduced mRNA levels of PEPCK and G6Pase, suggesting that BB-downregulated PEPCK and G6 Pase and inhibited hepatic glucose production could partly contribute to the effect of a decrease in blood glucose levels. Collectively, these data indicate that the lowered liver glucose production and the enhanced skeletal muscular glucose uptake offer a possible mechanism for the primary hypoglycemic effect of BB.
Moreover, the enzyme 11β-HSD1 transforms dehydrocorticosterone to corticosterone, and 11β-HSD1 knockout mice are reported to ameliorate insulin resistance [37]. We observed that BB-treated mice decreased the hepatic mRNA levels of 11β-HSD1, thus partly contributing to enhanced insulin sensitivity.
The hypolipidemic mechanisms of BB were determined through analysis of AMPK phosphorylation and targeted gene expression in liver tissue. Liver triglyceride content and blood free fatty acid were decreased in BB-treated mice. Metformin could cause hepatocyte-specific AMPK activation, and thus leads to the enhanced transcriptional activity of the PPARα on the expression and suppressed lipogenic enzyme expression [16]. DGAT2 is the endoplasmic membrane-bound enzyme responsible for catalyzing the terminal pace of triacylglycerol synthesis, and has a central role in intracellular accumulation [38,39]. DGAT2 potently stimulated TG synthesis, yielding an increase in intracellular TG, which accumulated in large cytosolic lipid droplets [40]. DGAT2 expression was stimulated by glucose and insulin [41]. DGAT2 gene expression increases during adipogenesis which is accompanied by an increase in TG synthesis [42]. Although direct evidence is lacking, it appears that DGAT2 is likely regulated by C/EBPα, a key transcriptional regulator of adipogenesis. Thus, the downregulation of DGAT2 seems to contribute to hepatic triglyceride output, resulting in decreasing blood TG levels. In this study, BB displayed increased hepatic AMPK phosphorylation. Moreover, BB protected mice from diet-induced increases in hepatic lipid contents, at least in part by increased mRNA levels of PPARα and a reduction in GPAT, which catalyzes the first step of glycerolipid synthesis and is a reasonably promising site for the influence of triacylglycerol (TAG) synthesis. As there are enhanced mRNA levels of GPAT in the liver, and alterations in the regulation of mitochondrial GPAT might lead to lipid metabolism disorder, including type 2 diabetes [43], we could not entirely decide whether mRNA inhibition of GPAT would confer that these similar results resemble GPAT inhibition. Nevertheless, BB treatment resulted in a decrease in hepatic GPAT mRNA levels, suggesting that BB is involved in GPAT and linked to TAG synthesis. These data indicating BB displayed hypolipidemic activity were possibly associated with the regulation of several hepatic genes' mRNA levels. Whether associated with fatty acid oxidation and lipogenesis, studies on the level of analysis by BB are now being undertaken.
It was found that blood levels of adiponectin were decreased in type 2 diabetes and obesity patients [44]. In addition to adiponectin-mediated enhanced glucose uptake and phosphorylation of AMPK [45], leptin-activated AMPK leads to enhanced fatty acid oxidation and reduced triacylglycerol accumulation [46]. In this study, BB treatment caused increases in blood adiponectin and decreases in blood leptin. Thus, a possible explanation is that BB-activated AMPK may be linked to leptin or adiponectin secretion (or mRNA) through AMPK activation.
The present results found that B3-treated mice had lower body weight gain. This may be due to a decrease in visceral fat mass. Nevertheless, B3 enhanced the weight of skeletal muscle and caused Akt activation. Akt activation has been shown to elicit skeletal muscle hypertrophy [47] and enhance liver fatty acid oxidation with decreased fat pads [48]. Previous study showed that Akt/mTOR-mediated skeletal muscle hypertrophy leading to increased insulin sensitivity[48] and a report with finding that mutation in the gene encoding Akt2 results in serve insulin resistance [49], establishing that BB elevated Akt activation leads to muscular hypertrophy and enhanced insulin sensitivity, opposite to weight gain.
Pathology examinations have revealed that BB treatment displayed decreased adipocyte hypertrophy, and reduced hepatic balloon degeneration. It is known that the liver is the main tissue to metabolize fat and cause the blood TG level to fluctuate. A possible explanation is that BB promoted fat movement from visceral adipose to the liver via enhanced lipid metabolism in the liver with less steatosis while decreasing the areas of adipocytes.
In summary, the present study demonstrated that administration of BB could enhance expression levels of phospho-AMPK/total-AMPK in muscle and liver and membrane protein levels of GLUT4 in diabetic and hyperlipidemic mice. The present results demonstrated that BB could be an important intervention in the alleviation of diabetes and hyperlipidemia.

4. Experimental Section

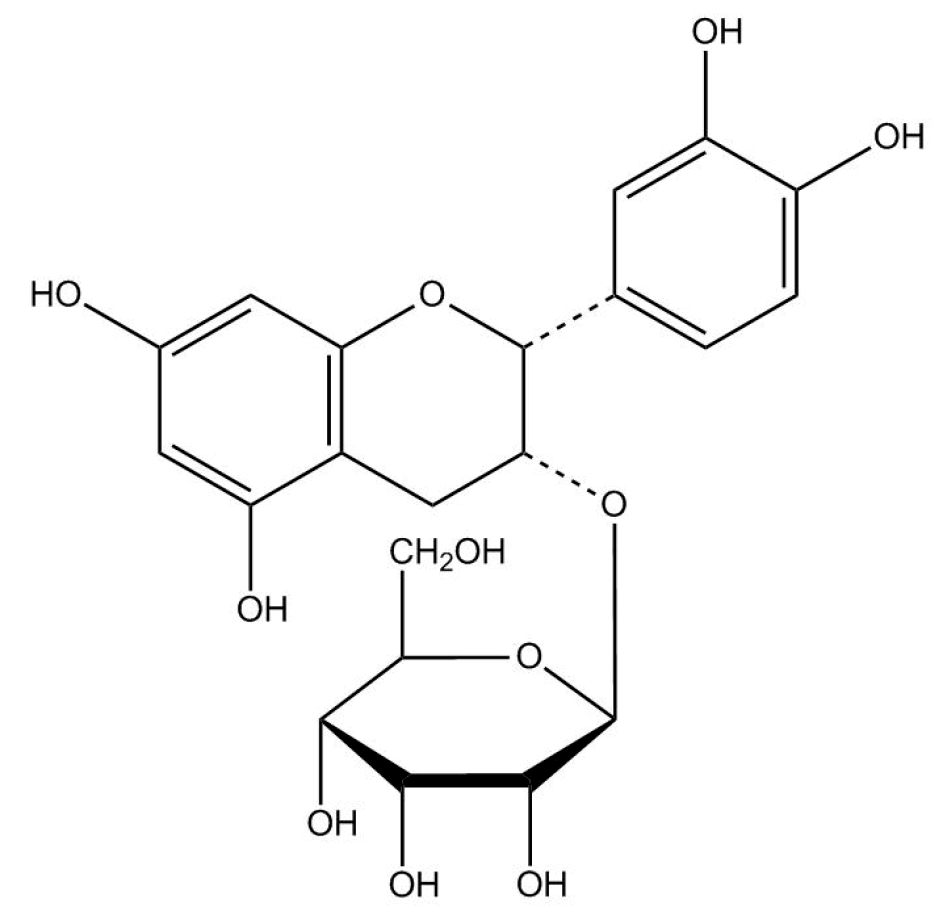
4.1. Preparation of (−)-Epicatechin-3-O-β-d-allopyranoside (BB)

4.1.1. Preparation of Extract of Davallia formosana

The pure compound of BB employed in the animal models was provided by Jin-Bin Wu. The roots and stems of Davallia formosana were obtained from a local market in Taichung, Taiwan; after identification, they were extracted with 75% ethanol and reduced pressure. The yield of the extract of D. formosana (DFE) was 9.5 wt % [50]. The ethanol extract was suspended in water and partitioned by N-butanol and concentrated; the yield of N-butanol fraction obtained from the ethanol extract is 20.2 wt % [50].
Table 2. The 13C- and 1H-NMR spectrum of (−)-epicatechin-3-O-β-d-allopyranoside (BB).
C H
C-279.19H-25.05 (d, J = 2.2 Hz)
C-373.40H-34.43 (m)
C-424.75H-4-22.74, 2.72
C-5157.85--
C-696.43H-65.86 (d, J = 2.3 Hz)
C-7157.85--
C-895.68H-85.90 (d, J = 2.3 Hz)
C-9157.13--
C-10100.21--
C-1ʹ131.67--
C-2ʹ115.57H-2ʹ7.02 (d, J = 2.1 Hz)
C-3ʹ145.50--
C-4ʹ145.72--
C-5ʹ116.29H-5ʹ6.66 (d, J = 8.2 Hz)
C-6ʹ120.34H-6ʹ6.78 (dd, J = 2.1 Hz)
Allosyl
C-1ʹʹ100.41H-11ʹʹ-
C-2ʹʹ72.28(H-2ʹʹ-6ʹʹ)-
C-3ʹʹ72.91(H-5)
C-4ʹʹ68.96
C-5ʹʹ75.33 4.74 (d, J = 8 Hz)
C-6ʹʹ63.26 3.22–3.99

4.1.2. Purification of (−)-Epicatechin-3-O-β-d-allopyranoside

The N-butanol fraction (10 g) was introduced into an HP-20 column (Diaion, NIPPON RESSUI Company, Tokyo, Japan) and eluted with water, and followed by methanol [50]. Eight fractions were obtained (Fractions 1–8). Fraction 6 (230 mg) was purified by a preparative high performance liquid chromatograph (HPLC) (Shimadzu CL-8A, Kyoto, Japan) to obtain pure compounds (136 mg) [50]. The conditions of the preparative HPLC were as previously described [50].
The pure compound was analyzed by NMR (1H, 13C; Bruker ADVANCE DPX-200, Rheinstetten, Germany), and it was identified as (−)-epicatechin-3-O-β-d-allopyranoside (BB) (Figure 1) [50]. The result of the 13C- and 1H-NMR spectrum (200 MHz, CDCl3) of BB is shown in Table 2 and some modifications from a previous described [50]. Previous studies had shown that DFE contained an amount of BB, which was the active compound of DFE; nevertheless, naringin was not found in DFE [7,50,51].

4.2. Animal and Diet Treatment

This experiment was performed and approved by the guidelines of the Institutional Animal Care and Use Committee of Central Taiwan University of Science and Technology (13 May 2014) as previously described [52,53,54,55,56,57]. Male C57BL/6J mice (total amount = 63), at the age of four weeks, were purchased from the National Laboratory Animal Breeding and Research Center (Taipei, Taiwan) [52]. After acclimatization for one week, all of the mice were divided randomly into the control (CON) group (low-fat diet (control diet, CD)) and the high-fat diet (HFD) group [52]. The CON group (n = 9) was kept on a low-fat diet (Diet 12450B, Research Diets, Inc., New Brunswick, NJ, USA), while the HFD group (n = 54, including six groups) was exposed to a 45% high-fat diet (Diet 12451, Research Diets, New Brunswick, NJ, USA) for 12 weeks [52,56,57]. The control diet contained 10% fat, whereas HFD contained 45% fat (of total energy, % kcal); and the diet compositions and energy percentages were as previously described [52,53,56,57]. After HFD exposure for eight weeks, the HFD-fed group was further randomly divided into six groups (n = 9 per group), including dosing of BB (including B1: 10, B2: 20, and B3: 40 mg/kg/day body wt) or rosiglitazone (Rosi; 1% methylcellulose 10 mg/kg body wt, from GlaxoSmithKline) or fenofibrate (Feno; 250 mg/kg/day body wt, from Sigma Chemical Co, St. Louis, MI, USA) or vehicle (equal volumes of water) by oral gavage once daily for four weeks and on HFD [52]. The CON and high-fat control (HF) mice were merely administered vehicle [52]. After dosing for four weeks, we removed food from the mice at night; and on the next day, the mice after 12 h of fasting were sacrificed. All of the individual tissues were collected and weighed, and portions were instantly frozen at −80 °C for later target gene analysis [52]. A portion of the acquired blood samples (0.8 mL) were immediately taken for glucose level analysis, and a portion for TG, TC, insulin, leptin, and adiponectin concentration analysis [52].

4.3. Measurement of Body Weight, Body Weight Gain, and Diet Consumption

Body weight, body weight gain, and diet consumption were measured as previously described [52,53,54,55,56,57].

4.4. Analysis of Blood Glucose, Blood Lipid, Insulin, Leptin, and Adiponectin

A portion of obtained blood samples from the retro-orbital sinus of fasting mice were used to measure blood glucose levels as previously described [52,56,57]. Plasma TG, total cholesterol (TC), and free fatty acids were determined as previously described [52,56,57]. Plasma insulin, leptin, and adiponectin levels were assessed using an assay kit (mouse insulin ELISA kit, Mercodia, Uppsala, Sweden; mouse leptin ELISA kit, Morinaga, Yokohama, Japan; Mouse Adiponectin ELISA kit, Crystal Chem International, Downers Grove, IL, USA) as previously described [52,56,57].

4.5. Histology

Portions of EWAT and liver tissue specimens were monitored as previously described [50,52,57]. Microscopic images were taken using a microscope (Olympus BX51, BX51, Olympus, Tokyo, Japan).

4.6. Hepatic Lipids Analysis

This part of the analysis is presented in previous studies [52,54,56,57].

4.7. Relative Quantization of mRNA Analysis

Firstly, the total RNA from the liver tissue was isolated with a Trizol reagent (Molecular Research Center, Inc., Cincinnati, OH, USA), and this experiment was determined as described previously [52,53,54,55,56,57,58]. The primers are shown in Table 3.
Table 3. Primers used in this study.
GeneAccession NumberForward Primer and Reverse PrimerPCR Product (bp)Annealing Temperature (°C)
Liver
PEPCKNM_011044.2F: CTACAACTTCGGCAAATACC33052
R: TCCAGATACCTGTCGATCTC
G6PaseNM_008061.3F: GAACAACTAAAGCCTCTGAAAC35050
R: TTGCTCGATACATAAAACACTC
11β-HSD1NM_008288.2F: AAGCAGAGCAATGGCAGCAT30050
R: GAGCAATCATAGGCTGGGTCA
AdiponectinNM_009605.4F: TCTTCTACAACCAACAGAATCA32450.5
R: GTATCATGGTAGAGAAGGAAGC
PPARαNM_011144F: CCTGAGATTAACCAGCCTTT35255
R: AGGACCTACTCTCATTGCTG
GPATBC019201.1F: CAGTCCTGAATAAGAGGT44148
R: TGGACAAAGATGGCAGCAGA
GAPDHNM_008084.3F: TGTGTCCGTCGTGGATCTGA9955
R: CCTGCTTCACCACCTTCTTGA

4.8. Western Blotting Analysis

This experiment was analyzed as previously described [52,53,54,55,56,57,58]. Finally, antibodies were detected using alkaline phosphatase linked to a goat anti-IgG rabbit secondary antibody [52,56,57] and detected by 5-bromo-4-chloro-3-indolyl-phosphate/ nitro blue tetrazolium (BCIP/NBT).

4.9. Statistical Analysis

All results were presented as the mean and standard error. Moreover, analysis of variance for data was employed and followed by Dunnett’s multiple range tests using SPSS software (SPSS Inc., Chicago, IL, USA). p < 0.05 is recognized as statistically significant.

5. Conclusions

Our findings revealed for the first time that BB lowered blood levels of glucose and insulin, concomitant with decreased blood triglyceride and lipid profiles, and ameliorated insulin resistance and dyslipidemia in mice on HFD. The skeletal muscular membrane expression level of GLUT4 was reduced in the HFD-fed group, which was reversed by BB treatment and correction of hyperglycemia. BB not only increased expression levels of phospho-AMPK/total-AMPK in skeletal muscle, but also in the liver. In addition to an increase in skeletal muscular protein levels of GLUT4 to enhance glucose uptake, a reduction in mRNA levels of PEPCK and the inhibition of hepatic glucose production leads to lowering blood glucose levels. Moreover, BB reduced the mRNA expressions of DGAT2 and GPAT (glycerolipid synthesis) while enhancing the mRNA expressions of PPARα (fatty acid oxidation) in liver tissue, which may be associated with decreasing blood TG levels. Further study will be undertaken on these levels of analysis. Nevertheless, our findings provide new insights, besides the prevention of osteoporosis, into understanding that BB could control and prevent type 2 diabetes and hyperlipidemia and hepatic fat accumulation.

Acknowledgments

The authors thank Yueh-Hsiung Kuo for providing NMR data correction.

Author Contributions

Chun-Ching Shih participated in the study design and performed most of the experiments and wrote the manuscript; Jin-Bin Wu performed the HPLC analysis; Jia-Ying Jian performed the mRNA analysis; Hui-Ya Ho performed BB pure compound production; and Cheng-Hsiu Lin performed the morphology analysis and animal study. All authors have read and approved the final manuscript.

Conflicts of Interest

The authors declare that there are no conflicts of interest.

References

  1. O’Rahilly, S.; Turner, R.C.; Matthews, D.R. Impaired pulsatile secretion of insulin in relatives of patients with non-insulin-dependent diabetes. N. Engl. J. Med. 1988, 318, 1225–1230. [Google Scholar] [CrossRef] [PubMed]
  2. Jakicic, J.M.; Jaramillo, S.A.; Balasubramanyam, A.; Bancroft, B.; Curtis, J.M.; Mathews, A.; Pereira, M.; Regensteiner, J.G.; Ribisl, P.M. Look AHEAD Study Group. Effect of a lifestyle intervention on change in cardiorespiratory fitness in adults with type 2 diabetes: Results from the Look AHEAD Study. Int. J. Obes. 2009, 33, 305–316. [Google Scholar] [CrossRef] [PubMed]
  3. Mozaffarian, D.; Kamineni, A.; Carnethon, M.; Djousse, L.; Mukamal, K.J.; Siscovick, D. Lifestyle risk factors and new-onset diabetes mellitus in older adults: The cardiovascular health study. Arch. Intern. Med. 2009, 169, 798–807. [Google Scholar] [CrossRef] [PubMed]
  4. Petro, A.E.; Cotter, J.; Cooper, D.A.; Peters, J.C.; Surwit, S.J.; Surwit, R.S. Fat, carbohydrate and calories in the development of diabetes and obesity in the C57BL/6J mouse. Metabolism 2004, 53, 454–457. [Google Scholar] [CrossRef] [PubMed]
  5. Editorial Committee of the Flora of Taiwan; Davallia, S. Flora of Taiwan, 2nd ed.; National Taiwan University: Taipei, Taiwan, 1994; p. 8. [Google Scholar]
  6. Lin, Y.Y.; Kakisawa, H.; Shiobara, Y.; Nakanishi, K. The structure of Davallic acid. Chem. Pharm. Bull. 1965, 13, 986–995. [Google Scholar] [CrossRef] [PubMed]
  7. Hwang, T.H.; Kashiwada, Y.; Nonaka, G.I.; Nishioka, I. Flavan-3-ol and proanthocyanidin allosides from Davallia divaricata. Phytochemistry 1989, 28, 891–896. [Google Scholar] [CrossRef]
  8. Molinuevo, M.S.; Schurman, L.; McCarthy, A.D.; Cortizo, A.M.; Tolosa, M.J.; Gangoiti, M.V.; Arnol, V.; Sedlinsky, C. Efect of metformin on bone marrow progenitor cell differentiation: In vivo and in vitro studies. J. Bone Miner. Res. 2010, 25, 211–221. [Google Scholar] [CrossRef] [PubMed]
  9. Wongdee, K.; Charoenphandhu, N. Osteoporosis in diabetes mellitus: Possible cellular and molecular mechanisms. World J. Diabetes 2011, 2, 41–48. [Google Scholar] [CrossRef] [PubMed]
  10. Kim, S.H.; Choung, S.Y. Antihyperglycemic and antihyperlipidemic action of Cinnamomi Cassiae (cinnamon bark) extract in C57BL/Ks db/db mice. Arch. Pharm. Res. 2010, 33, 325–333. [Google Scholar] [CrossRef] [PubMed]
  11. Huang, S.; Czech, M.P. The GLUT4 glucose transporter. Cell Metab. 2007, 5, 237–252. [Google Scholar] [CrossRef] [PubMed]
  12. Bryant, N.J.; Govers, R.; James, D.E. Regulated transport of the glucose transporter GLUT4. Nat. Rev. Mol. Cell Biol. 2002, 3, 267–277. [Google Scholar] [CrossRef] [PubMed]
  13. Holmes, B.; Dohm, G.L. Regulation of GLUT4 gene expression during exercise. Med. Sci. Sports Exerc. 2004, 36, 1202–1206. [Google Scholar] [CrossRef] [PubMed]
  14. Sriwijitkamol, A.; Coletta, D.K.; Wajcberg, E.; Balbontin, G.B.; Reyna, S.M.; Barrientes, J.; Eagan, P.A.; Jenkinson, C.P.; Cersosimo, E.; DeFronzo, R.A.; et al. Effect of acute exercise on AMPK signaling in skeletal muscle of subjects with type 2 diabetes: A time-course and dose-response study. Diabetes 2007, 56, 836–848. [Google Scholar] [CrossRef] [PubMed]
  15. Mackenzie, R.W.; Elliot, B.T. Akt/PKB activation and insulin signaling: A novel insulin signaling pathway in the treatment of type 2 diabetes. Diabetes Metab. Syndr. Obes. 2014, 7, 55–64. [Google Scholar] [CrossRef] [PubMed]
  16. Jing, M.; Cheruvu, V.K.; Ismail-Beigi, F. Stimulation of glucose transport in response to activation of distinct AMPK signaling pathways. Am. J. Physiol. Cell Physiol. 2008, 295, C1071–C1082. [Google Scholar] [CrossRef] [PubMed]
  17. Zhou, G.; Myers, R.; Li, Y.; Chen, Y.; Shen, X.; Fenyk-Melody, J.; Wu, M.; Ventre, J.; Doebber, T.; Fujii, N.; et al. Role of AMP-activated protein kinase in mechanism of metformin action. J. Clin. Investig. 2001, 108, 1167–1174. [Google Scholar] [CrossRef] [PubMed]
  18. Yu, S.; Matsusue, K.; Kashireddy, P.; Cao, W.Q.; Yeldandi, V.; Yeldandi, A.V.; Rao, M.S.; Gonzalez, F.J.; Reddy, J.K. Adipocyte-specific gene expression and adipogenic steatosis in the mouse liver due to peroxisome proliferator-activated receptor γ1 (PPARγ1) overexpression. Biol. Chem. 2003, 278, 498–505. [Google Scholar] [CrossRef] [PubMed]
  19. Yki-Jȁrvinen, H. Thiazolidines. N. Engl. J. Med. 2004, 351, 1106–1118. [Google Scholar] [CrossRef] [PubMed]
  20. Martinez, L.; Berenguer, M.; Bruce, M.C.; Le Marchand-Brustel, Y.; Govers, R. Rosiglitazone increases cell surface GLUT4 levels in 3T3-L1 adipocytes through an enhancement of endosomal recycling. Biochem. Pharmacol. 2010, 79, 1300–1309. [Google Scholar] [CrossRef] [PubMed]
  21. Damci, T.; Tatliagac, S.; Osar, Z.; Ilkova, H. Fenofibrate treatment is associated with better glycemic control and lower serum leptin and insulin levels in type 2 diabetic patients with hypertriglyceridemia. Eur. J. Intern. Med. 2003, 14, 357–360. [Google Scholar] [CrossRef]
  22. Farnier, M.; Bonnefous, F.; Debbas, N.; Irvine, A. Comparative efficacy and safety of micronised fenofibrate and simvastatin in patients with primary type Ha or IIb hyperlipidemia. Arch. Intern. Med. 1994, 154, 441–449. [Google Scholar] [CrossRef] [PubMed]
  23. Hsu, S.C.; Huang, C.J. Reduced fat mass in rats fed a high oleic acid-rich safflower oil diet is associated with changes in expression of hepatic PPARα and adipose SREBP-1c-regulated genes. J. Nutr. 2006, 136, 1779–1785. [Google Scholar] [PubMed]
  24. Srivastava, R.A.K.; Jahagirdar, R.; Azhar, S.; Sharma, S.; Bisgaier, C.L. Peroxisome proliferator-activated receptor-α selective ligand reduces adiposity, improves insulin sensitivity, and inhibits atherosclerosis in LDL receptor-deficient mice. Mol. Cell. Biochem. 2006, 285, 35–50. [Google Scholar] [CrossRef] [PubMed]
  25. Fryer, L.G.; Parbu-Patel, A.; Patel, A. The anti-diabetic drugs rosiglitazone and metformin stimulate AMP-activated protein kinase through distinct signaling pathways. J. Biol. Chem. 2002, 277, 25226–25232. [Google Scholar] [CrossRef] [PubMed]
  26. Ahmed, M.H.; Byrne, C.D. Modulation of sterol regulatory element binding proteins (SREBPs) as potential treatments for non-alcoholic fatty liver disease (NAFLD). Drug Discov. Today 2007, 12, 740–747. [Google Scholar] [CrossRef] [PubMed]
  27. Stein, S.C.; Woods, A.; Jones, N.A.; Davison, M.D.; Carling, D. The regulation of AMP-activated protein kinase by phosphorylation. Biochem. J. 2000, 345, 437–443. [Google Scholar] [CrossRef] [PubMed]
  28. Kleiner, D.E.; Brunt, E.M.; van Natta, M.; Sanyal, A.J. Design and validation of a histological scoring system for nonalcoholic fatty liver disease. Hepatology 2005, 41, 1313–1321. [Google Scholar] [CrossRef] [PubMed]
  29. Harte, R.A.; Kirk, E.A.; Rosenfeld, M.E.; LeBoeuf, R.C. Initiation of hyperinsulinemia and hyperleptinemia is diet dependent in C57BL/6 mice. Horm. Metab. Res. 1999, 31, 570–575. [Google Scholar] [CrossRef] [PubMed]
  30. Guo, S. Insulin signaling, resistance, and metabolic syndrome: Insights from mouse models into disease mechanisms. J. Endocrinol. 2014, 220, T1–T23. [Google Scholar] [CrossRef] [PubMed]
  31. Zhu, W.; Cheng, K.K.; Vanhoutte, P.M.; Lam, K.S.; Xu, A. Vascular effects of adiponectin: Molecular mechanisms and potential therapeutic intervention. Clin. Sci. 2008, 114, 361–374. [Google Scholar] [CrossRef] [PubMed]
  32. Welsh, G.I.; Hers, I.; Berwick, D.C.; Dell, G.; Wherlock, M.; Birkin, R.; Leney, S.; Tavaré, J.M. Role of protein kinase B in insulin-regulated glucose uptake. Biochem. Soc. Trans. 2005, 33, 346–349. [Google Scholar] [CrossRef] [PubMed]
  33. Barthel, A.; Schmoll, D. Novel concepts in insulin regulation of hepatic gluconeogenesis. Am. J. Physiol. Endocrinol. Metab. 2003, 285, E685–E692. [Google Scholar] [CrossRef] [PubMed]
  34. O’Brien, R.M.; Printz, R.L.; Halmi, N.; Tiesinga, J.J.; Granner, D.K. Structural and functional analysis of the human phosphoenolpyruvate carboxykinase gene promoter. Biochim. Biophys. Acta 1995, 1264, 284–288. [Google Scholar] [CrossRef]
  35. Sutherland, C.; O’Brien, R.M.; Granner, D.K. New connections in the regulation of PEPCK gene expression by insulin. Philos. Trans. R. Soc. Lond. B Biol. Sci. 1996, 351, 191–199. [Google Scholar] [CrossRef] [PubMed]
  36. Kim, Y.D.; Park, K.G.; Lee, Y.S.; Park, Y.Y.; Kim, D.K.; Nedumaran, B.; Jang, W.G.; Cho, W.J.; Ha, J.; Lee, I.K.; et al. Metformin inhibits hepatic gluconeogenesis through AMP-activated protein kinase-dependent regulation of the orphan nuclear receptor SHP. Diabetes 2008, 57, 306–314. [Google Scholar] [CrossRef] [PubMed]
  37. Koeilevtsev, Y.; Holmes, M.C.; Burchell, A.; Houston, P.M.; Schmoll, D.; Jamieson, P.; Best, R.; Brown, R.; Edwards, C.R.; Seckl, J.R.; et al. 11β-hydroxysteroid dehydrogenase type 1 knockout mice show attenuated glucocorticoid-inducible responses and resist hyperglycemia on obesity or stress. Proc. Natl. Acad. Sci. USA 1997, 94, 14924–14929. [Google Scholar] [CrossRef]
  38. Cases, S.; Smith, S.J.; Zheng, Y.W.; Myers, H.M.; Lear, S.R.; Sande, E.; Novak, S.; Collin, C.; Welch, C.B.; Lusis, A.J.; et al. Identification of a gene encoding an acyl CoA: Diacylglycerol acyltransferase, a key enzyme in triacylglycerol synthesis. Proc. Natl. Acad. Sci. USA 1998, 95, 13018–13023. [Google Scholar] [CrossRef] [PubMed]
  39. Oelkers, P.; Behari, A.; Cromley, D.; Billheimer, J.T.; Sturley, S.L. Characterization of two human genes encoding acyl coenzyme A: Cholesterol acyltransferase-related enzymes. J. Biol. Chem. 1998, 273, 26765–26771. [Google Scholar] [CrossRef] [PubMed]
  40. Stone, S.J.; Levin, M.C.; Zhou, P.; Han, J.; Walther, T.C.; Farese, R.V., Jr. The endoplasmic reticulum enzyme DGAT2 is found in mitochondria-associated membranes and has a mitochondrial targeting signal that promotes its association with mitochondria. J. Biol. Chem. 2009, 284, 5352–5361. [Google Scholar] [CrossRef] [PubMed]
  41. Meegalla, R.L.; Billheimer, J.T.; Cheng, D. Concerted elevation of acyl-coenzyme A: Diacylglycerol acyltransferase (DGAT) activity through independent stimulation of mRNA expression of DGAT1 and DGAT2 by carbohydrate and insulin. Biochem. Biophys. Res. Commun. 2002, 298, 317–323. [Google Scholar] [CrossRef]
  42. Yen, C.L.; Stone, S.J.; Koliwad, S.; Harris, C.; Farese, R.V., Jr. Thematic Review Series: Glycerolipids. DGAT enzymes and triacylglycerol biosynthesis. J. Lipid Res. 2008, 49, 2283–2301. [Google Scholar] [CrossRef] [PubMed]
  43. Lewin, T.M.; Granger, D.A.; Kim, J.H.; Coleman, R.A. Regulation of mitochondrial sn-glycerol-3-phosphate acyltransferase activity: Response to feeding status is unique in various rat tissues and is discordant with protein expression. Arch. Biochem. Biophys. 2001, 396, 119–127. [Google Scholar] [CrossRef] [PubMed]
  44. Hotta, K.; Funahashi, T.; Arita, Y.; Takahashi, M.; Matsuda, M.; Okamoto, Y.; Iwahashi, H.; Kuriyama, H.; Ouchi, N.; Maeda, K.; et al. Plasma concentrations of a novel, adipose-specific protein, adiponectin, in type 2 diabetic patients. Arterioscler. Thromb. Vasc. Biol. 2000, 20, 1595–1599. [Google Scholar] [CrossRef] [PubMed]
  45. Wu, X.; Motoshima, H.; Mahadev, K.; Stalker, T.J.; Scalia, R.; Goldstein, B.J. Involvement of AMP-activated protein kinase in glucose uptake stimulated by globular domain of adiponectin in primary rat adipocytes. Diabetes 2003, 52, 1355–1363. [Google Scholar] [CrossRef] [PubMed]
  46. Minokoshi, Y.; Kim, Y.-B.; Kahn, B.B. Leptin stimulates fatty acid oxidation directly in white adipose tissue through activation of AMP-activated protein kinase. Diabetes 2002, 51, 1375. [Google Scholar]
  47. Rommel, C.; Bodine, S.C.; Clarke, B.A.; Rossman, R.; Nunez, L.; Stitt, T.N.; Yancopoulos, G.D.; Glass, D.J. Mediation of IGF-1-induced skeletal myotube hypertrophy by PI(3)K/Akt/mTOR and PI(3)/Akt/GSK3 pathways. Nat. Cell Biol. 2001, 3, 1009–1013. [Google Scholar] [CrossRef] [PubMed]
  48. Izumiya, Y.; Hopkins, T.; Morris, C.; Sato, K.; Zeng, L.; Viereck, J.; Hamilton, J.A.; Ouchi, N.; LeBrasseur, N.K.; Walsh, K. Fast/Glycolytic muscle fiber growth reduces fat mass and improves metabolic parameters in obese mice. Cell Metab. 2008, 7, 159–172. [Google Scholar] [CrossRef] [PubMed]
  49. George, S.; Rochford, J.J.; Wolfrum, C.; Gray, S.L.; Schinner, S.; Wilson, J.C.; Soos, M.A.; Murgatroyd, P.R.; Williams, R.M.; Acerini, C.L.; et al. A family with severe insulin resistance and diabetes due to a mutation in AKT2. Science 2004, 304, 1325–1328. [Google Scholar] [CrossRef] [PubMed]
  50. Ko, Y.J.; Wu, J.B.; Ho, H.Y.; Lin, W.C. Antiosteoporotic activity of Davallia formosana. J. Ethnopharmacol. 2012, 139, 558–565. [Google Scholar] [CrossRef] [PubMed]
  51. Li, F.; Xiong, F.M.; Li, X.; Lin, H. Stimulative activity of Drynaria fortune (Kunez) J. Sm. Extracts and two of its flavonoids on the proliferation of osteoblastic like cells. Pharmazie 2006, 61, 962–965. [Google Scholar] [PubMed]
  52. Kuo, Y.H.; Lin, C.H.; Shih, C.C. Ergostatrien-3β-ol from Antrodia camphorata inhibits diabetes and hyperlipidemia in high-fat-diet treated mice via regulation of hepatic related genes, glucose transporter 4, and AMP-Activated protein kinase phosphorylation. J. Agric. Food Chem. 2015, 63, 2479–2489. [Google Scholar] [CrossRef] [PubMed]
  53. Shih, C.C.; Shlau, M.T.; Lin, C.H.; Wu, J.B. Momordica charantia ameliorates insulin resistance and dyslipidemia with altered hepatic glucose production and fatty acid synthesis and AMPK phosphorylation in high-fat-fed mice. Phytother. Res. 2014, 28, 363–371. [Google Scholar] [CrossRef] [PubMed]
  54. Shih, C.C.; Lin, C.H.; Wu, J.B. Eriobotrya japonica improves hyperlipidaemia and reverses insulin resistance in high-fat-fed mice. Phytother. Res. 2010, 24, 1769–1780. [Google Scholar] [CrossRef] [PubMed]
  55. Shih, C.C.; Ciou, J.L.; Lin, C.H.; Wu, J.B.; Ho, H.Y. Cell suspension culture of Eriobotrya japonica regulates the diabetic and hyperlipidemic signs of high-fat-fed mice. Molecules 2013, 18, 2726–2753. [Google Scholar] [CrossRef] [PubMed]
  56. Lin, C.H.; Kuo, Y.H.; Shih, C.C. Effects of Bofu-tsusho-san on diabetes and hyperlipidemia associated with AMP-activated protein kinase and glucose transporter 4 in high-fat-fed mice. Int. J. Mol. Sci. 2014, 15, 20022–20044. [Google Scholar] [CrossRef] [PubMed]
  57. Wu, J.B.; Kuo, Y.H.; Lin, C.H.; Ho, Y.H.; Shih, C.C. Tormentic acid, a major component of suspension cells of Eriobotrya japonica, suppresses high-fat diet-induced diabetes and hyperlipidemia by glucose transporter 4 and AMP-activated protein kinase phosphorylation. J. Agric. Food Chem. 2014, 62, 10717–10726. [Google Scholar] [CrossRef] [PubMed]
  58. Shih, C.C.; Lin, C.H.; Lin, W.L.; Wu, J.B. Momordica charantia extract on insulin resistance and the skeletal muscle GLUT4 protein in fructose-fed rats. J. Ethnopharmacol. 2009, 123, 82–90. [Google Scholar] [CrossRef] [PubMed]

