Heparin Assisted Photochemical Synthesis of Gold Nanoparticles and Their Performance as SERS Substrates

Abstract
:
1. Introduction
2. Results and Discussion
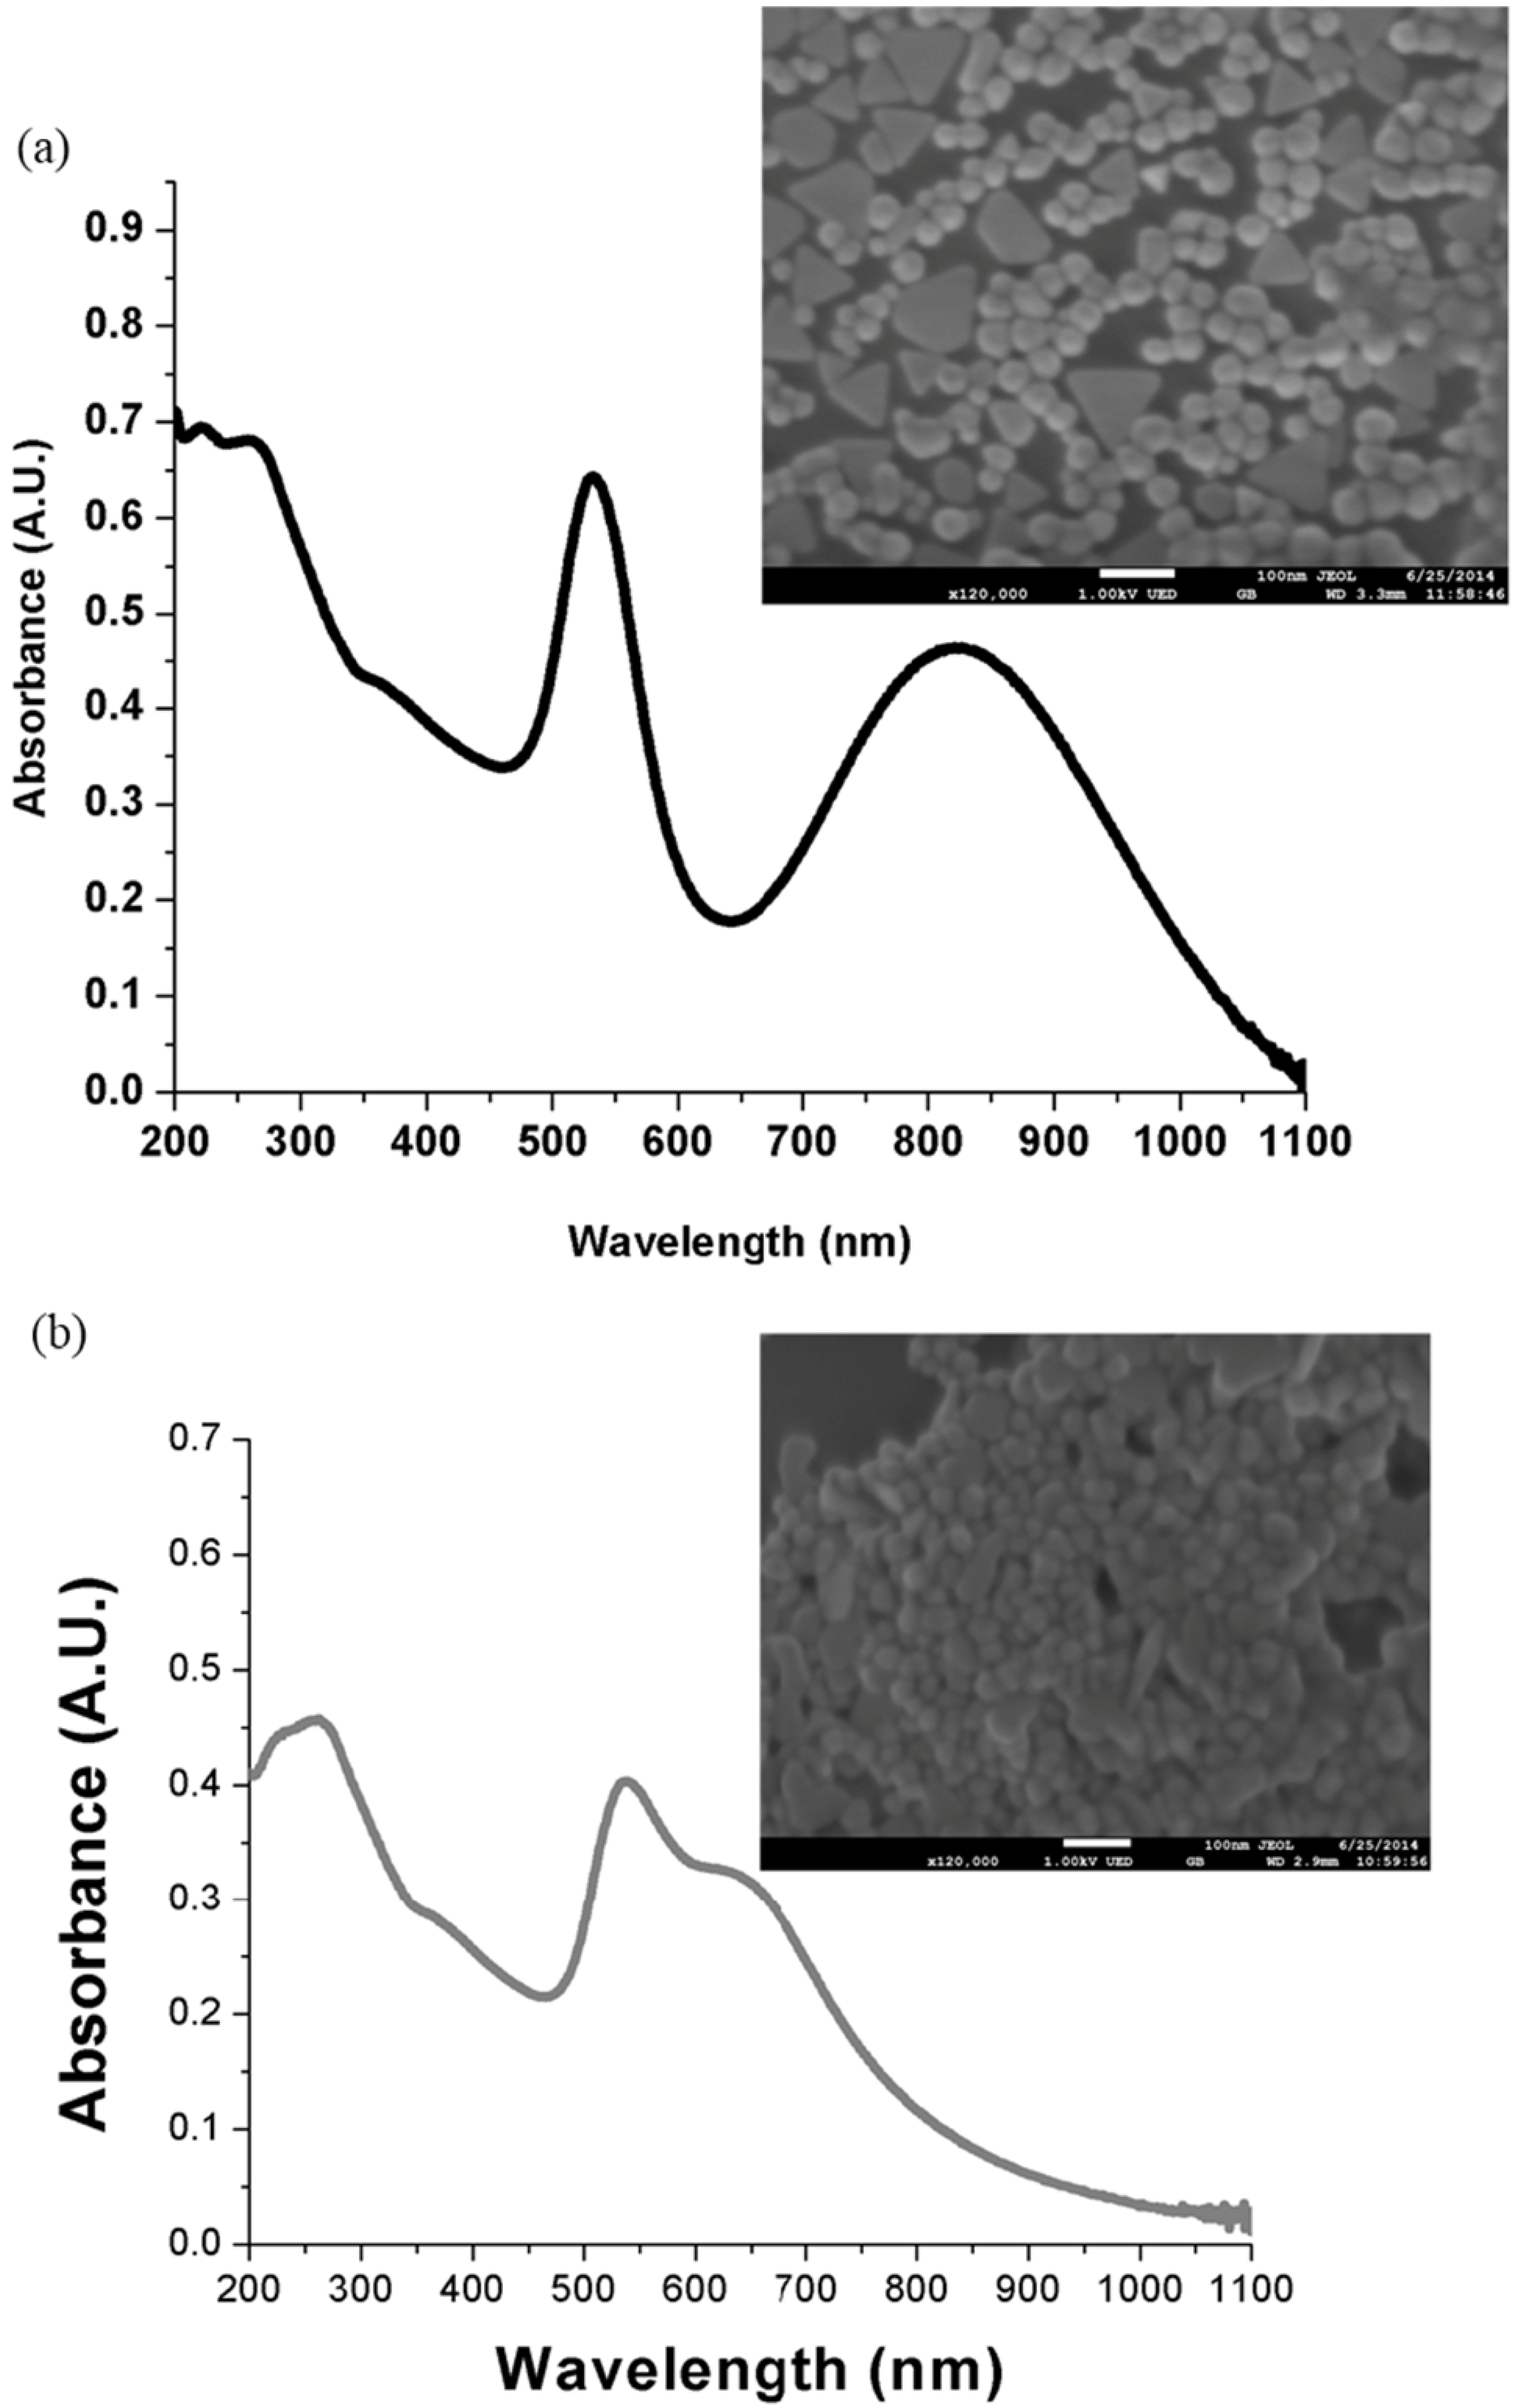
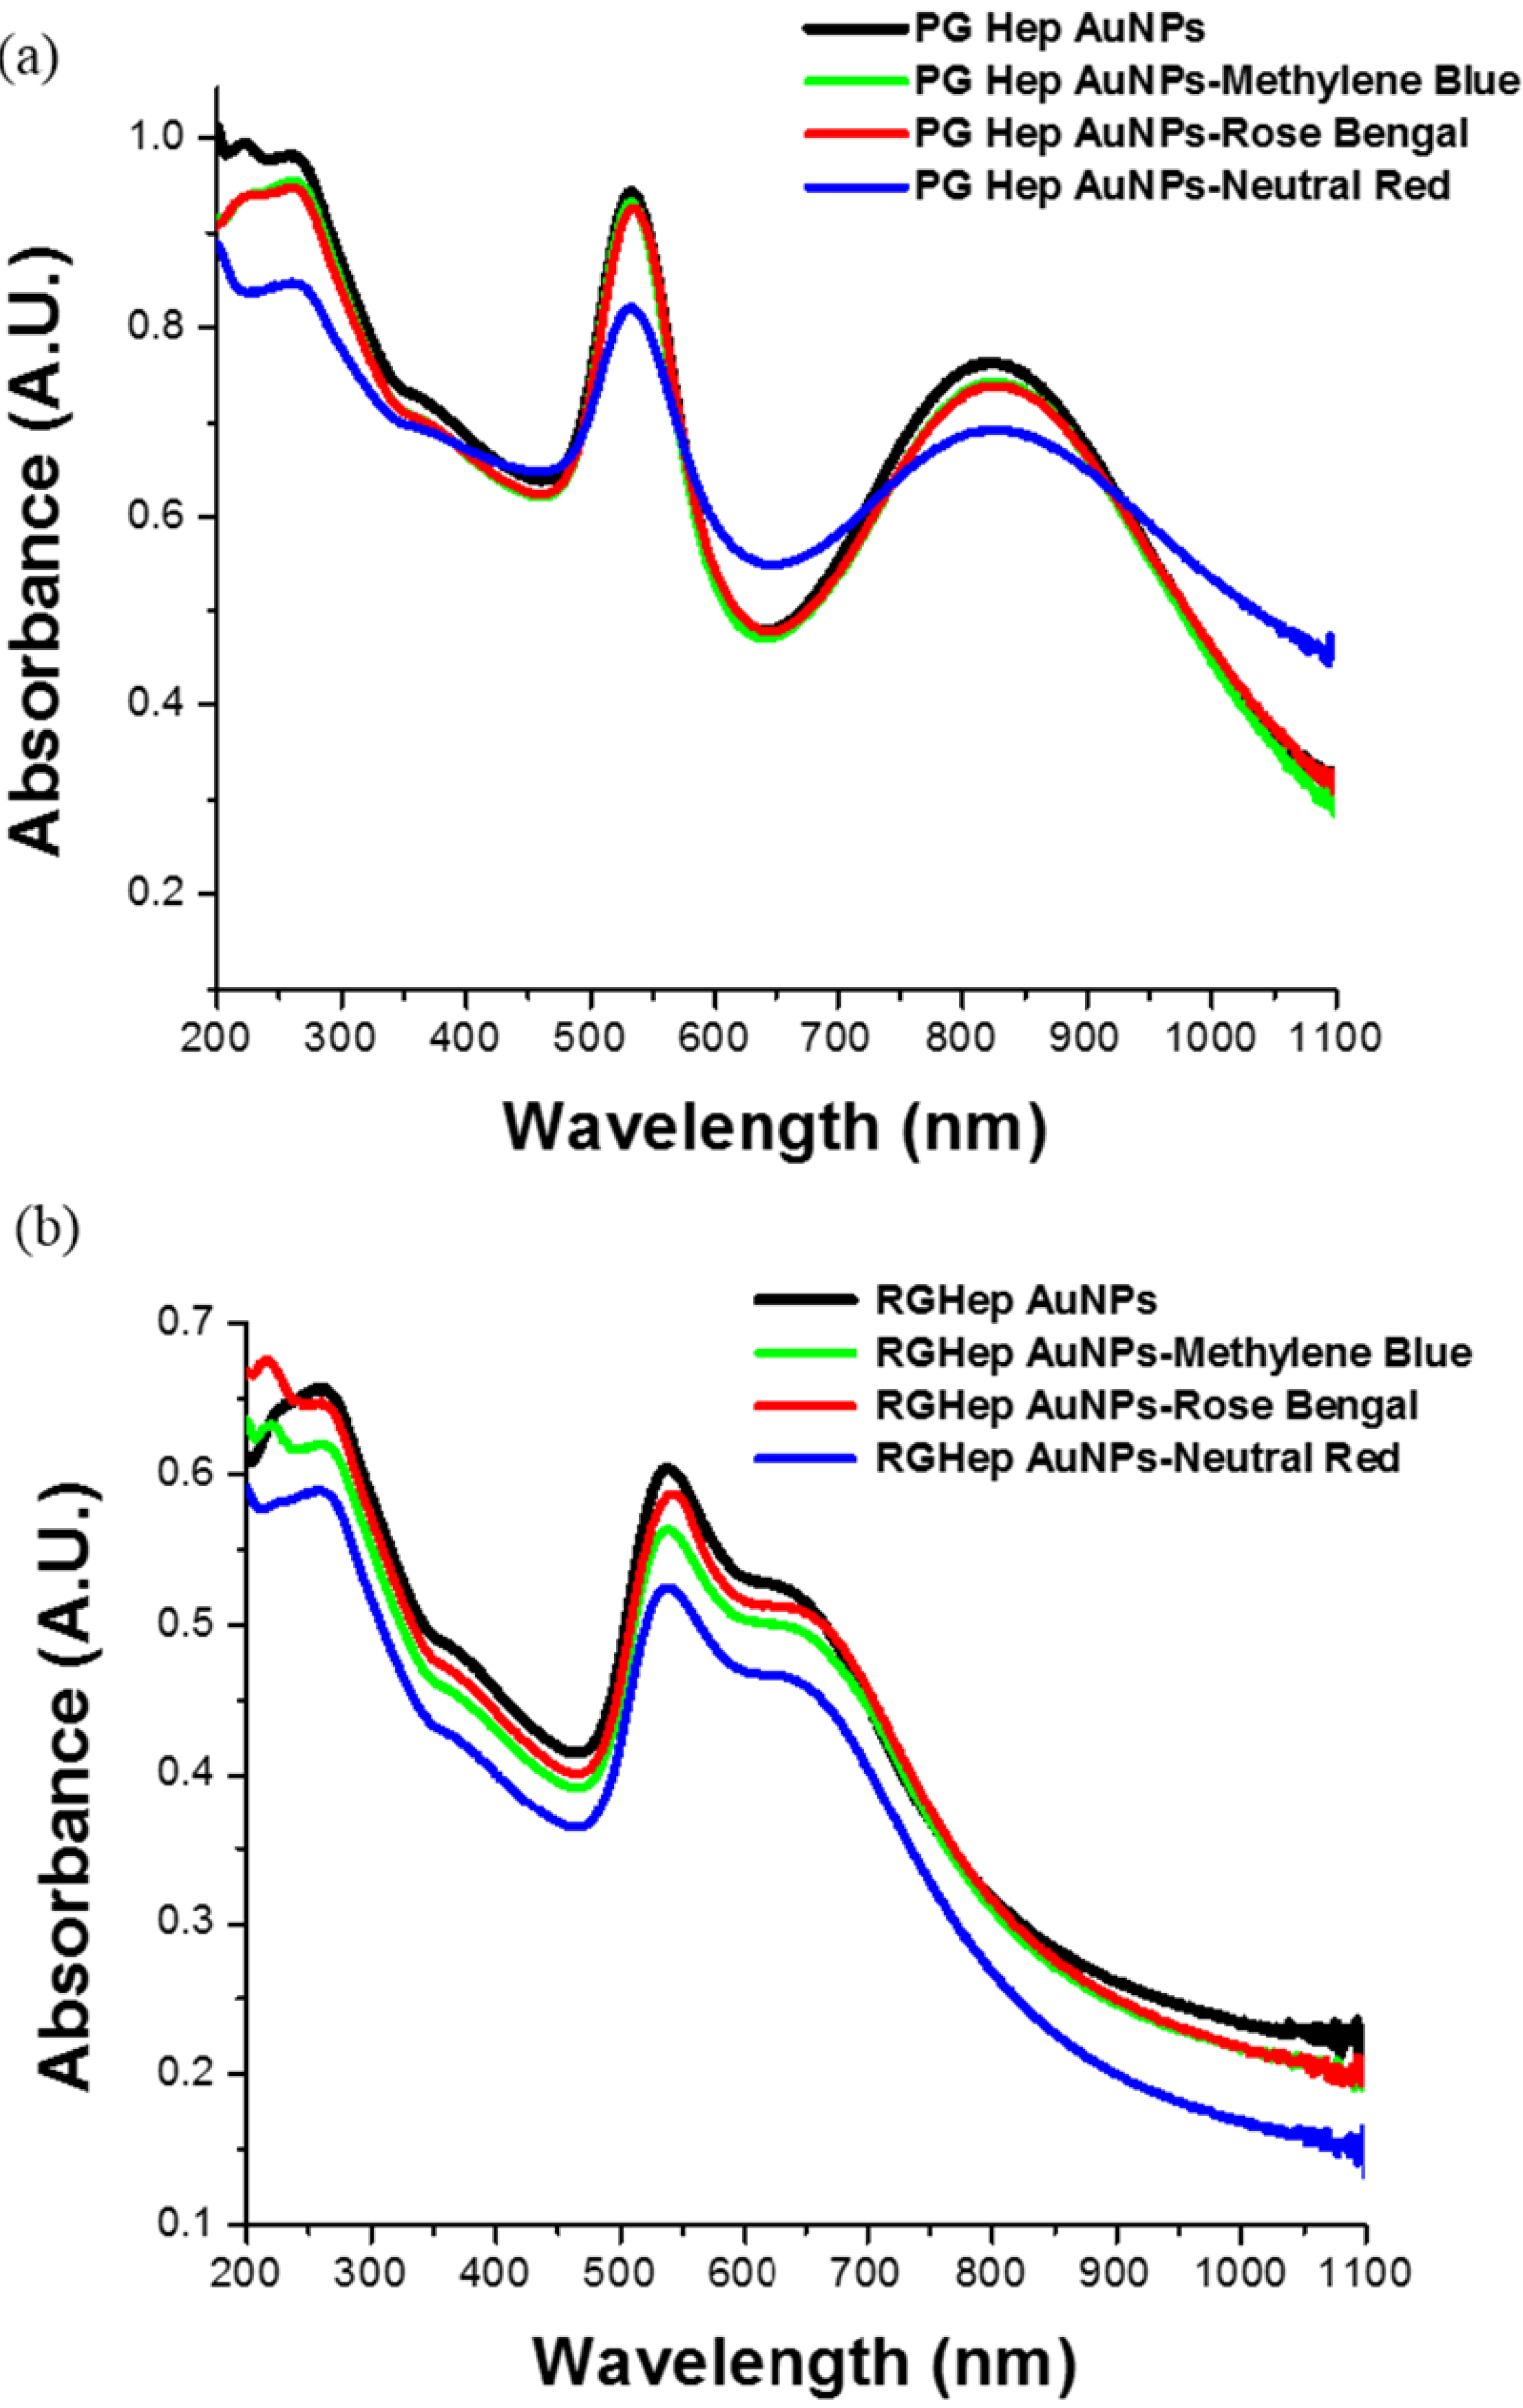
2.1. UV-Vis Spectroscopy Measurements

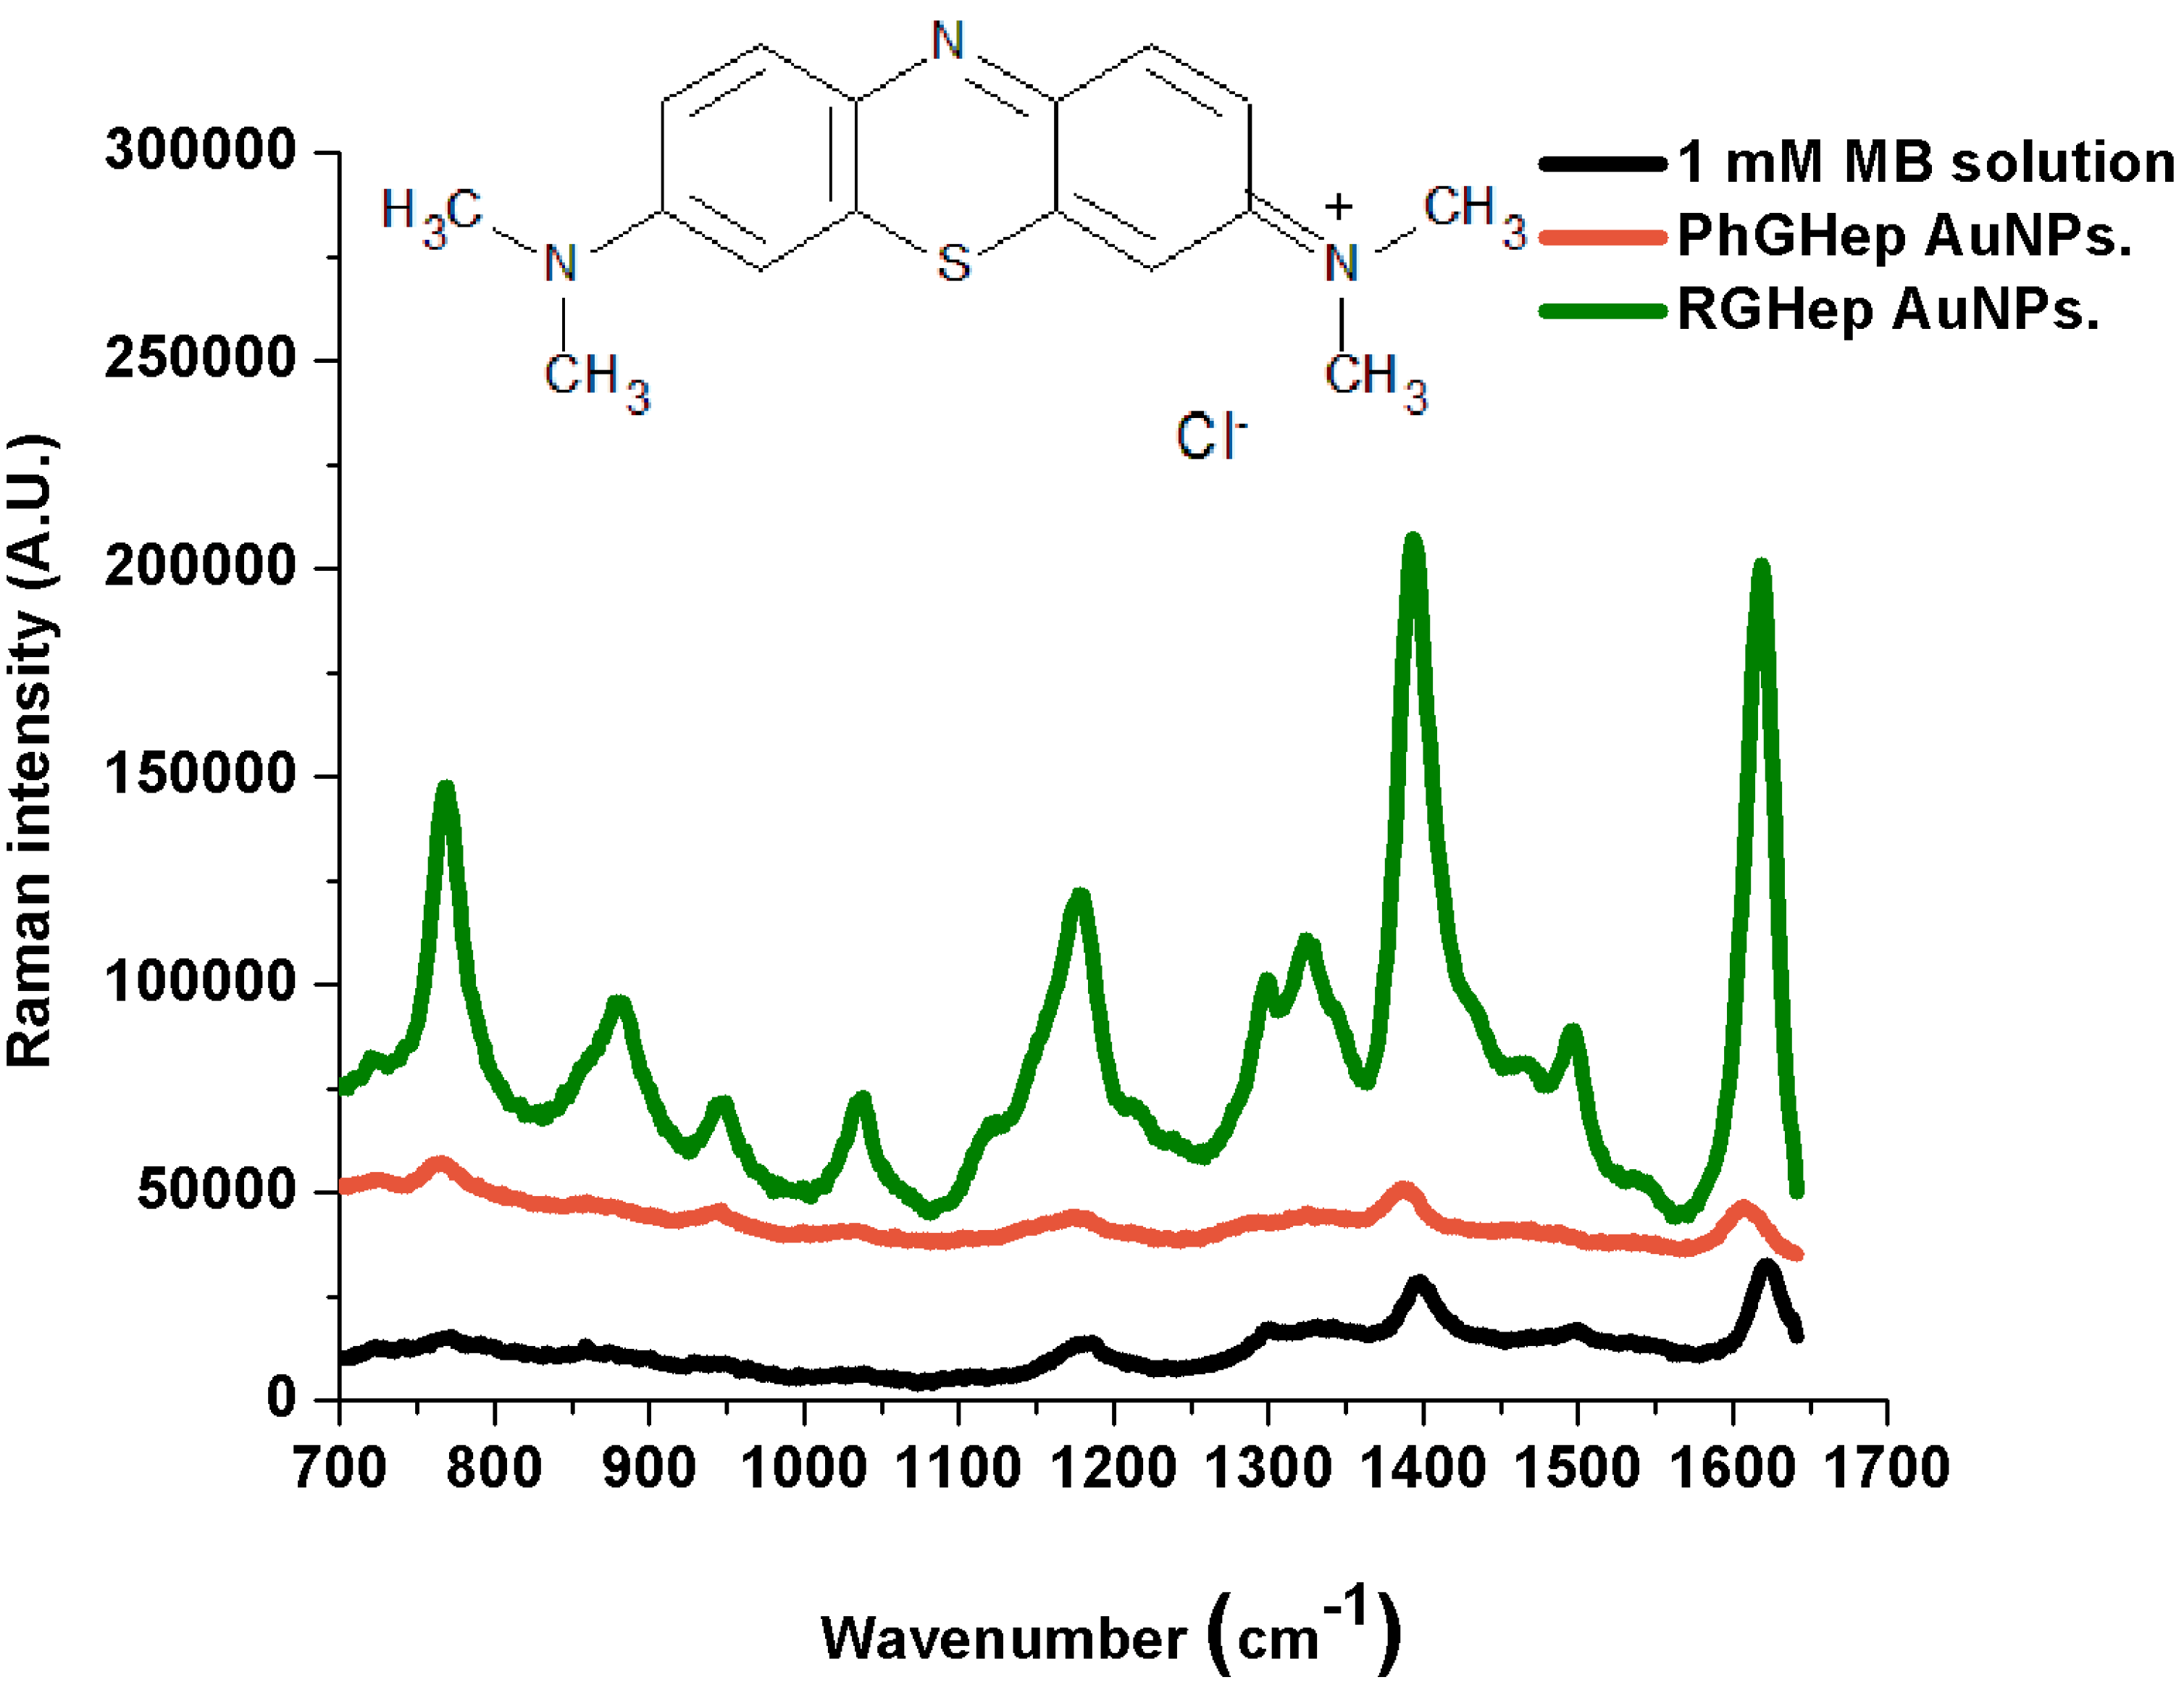
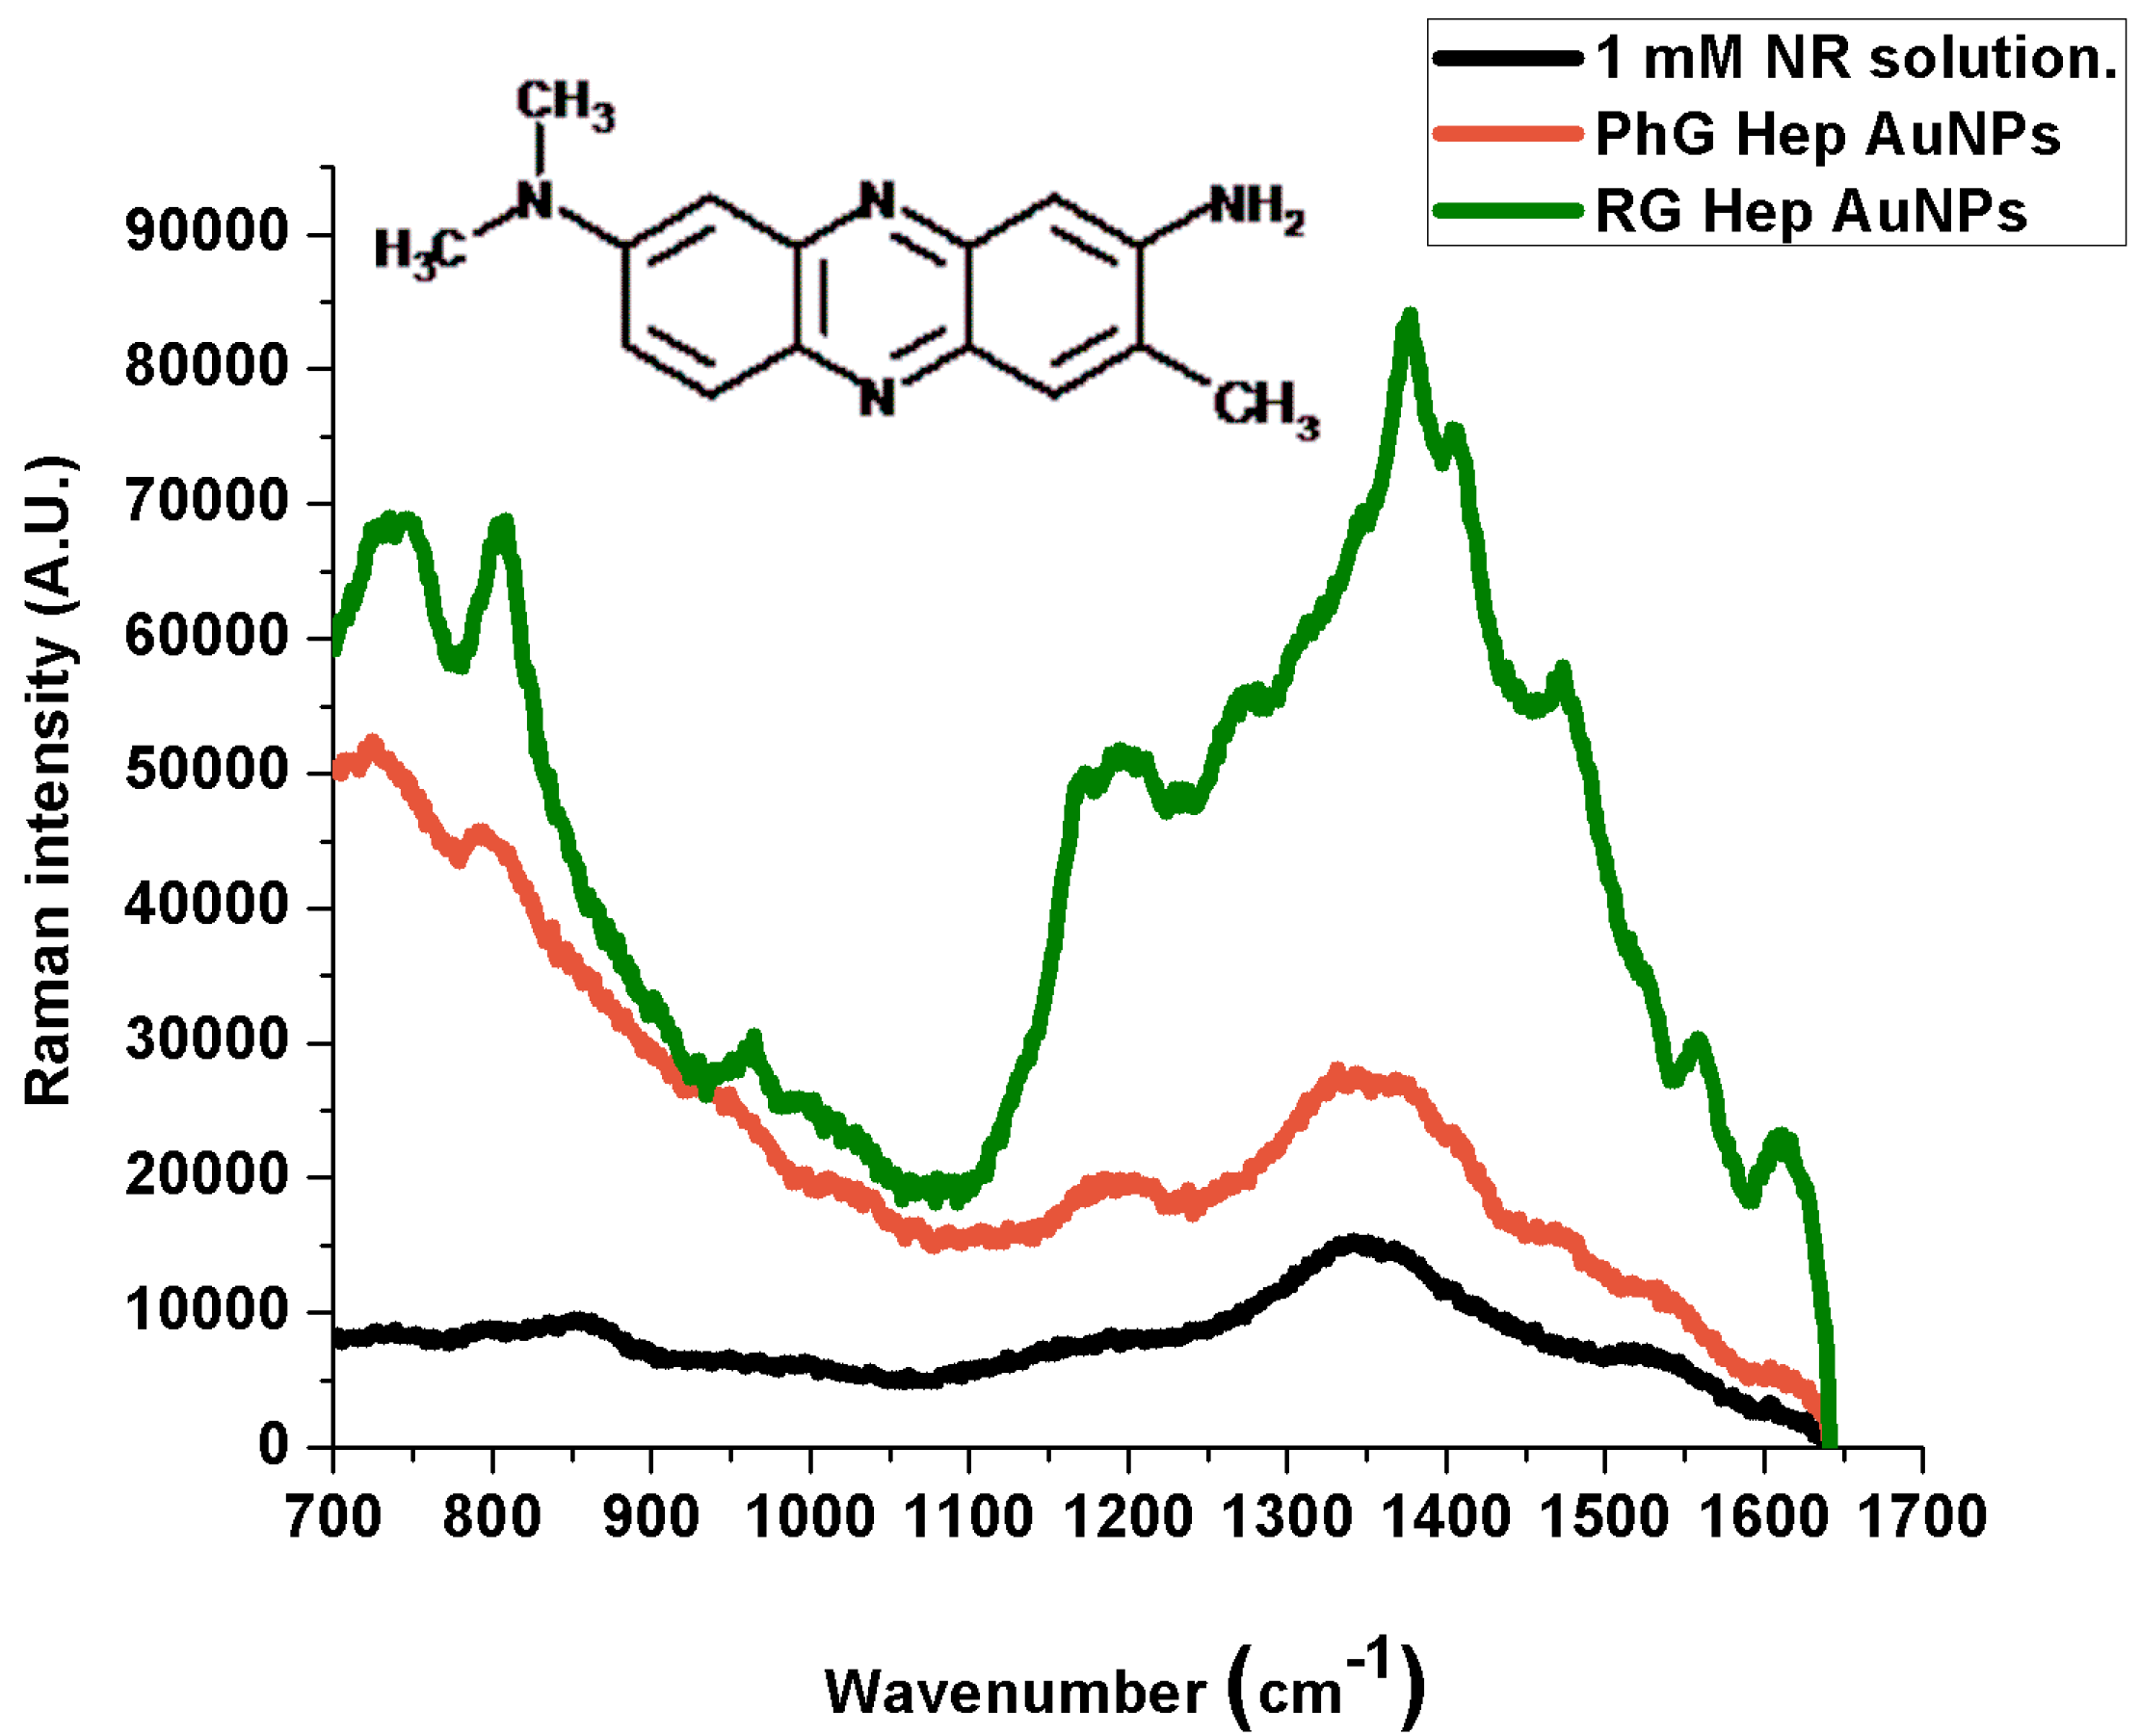
2.2. Raman Measurements

| Reported Powder Peaks (cm−1) [28] | 1 mM Aqueous Solution (cm−1) | PG-Heparin AuNPs (cm−1) | RG-Heparin AuNPs (cm−1) | Band Assignment |
|---|---|---|---|---|
| 1067 (w) | 1038 (w) | 1033 (w) | 1037 (m) | C‑H in-plane bending |
| 1121 (w) | - | - | 1122 (w) | C‑H out-of-plane-bending |
| 1181 (m) | 1185 (w) | 1181(w) | 1178 (m) | C‑N stretching |
| 1272 (w) | 1299 (w) | 1293 (w) | 1299 (m) | - |
| 1396 (m) | 1393 (m) | 1386 (m) | 1393 (s) | C‑H in-plane ring deformation |
| 1441 (w) | - | - | 1464 (w) | C‑N asymmetric stretching |
| 1544 (w) | 1541 (w) | 1537 (w) | 1541 (w) | C‑C ring stretching |
| 1618 (s) | 1620 (m) | 1607 (m) | 1619 (s) | C‑C ring stretching |
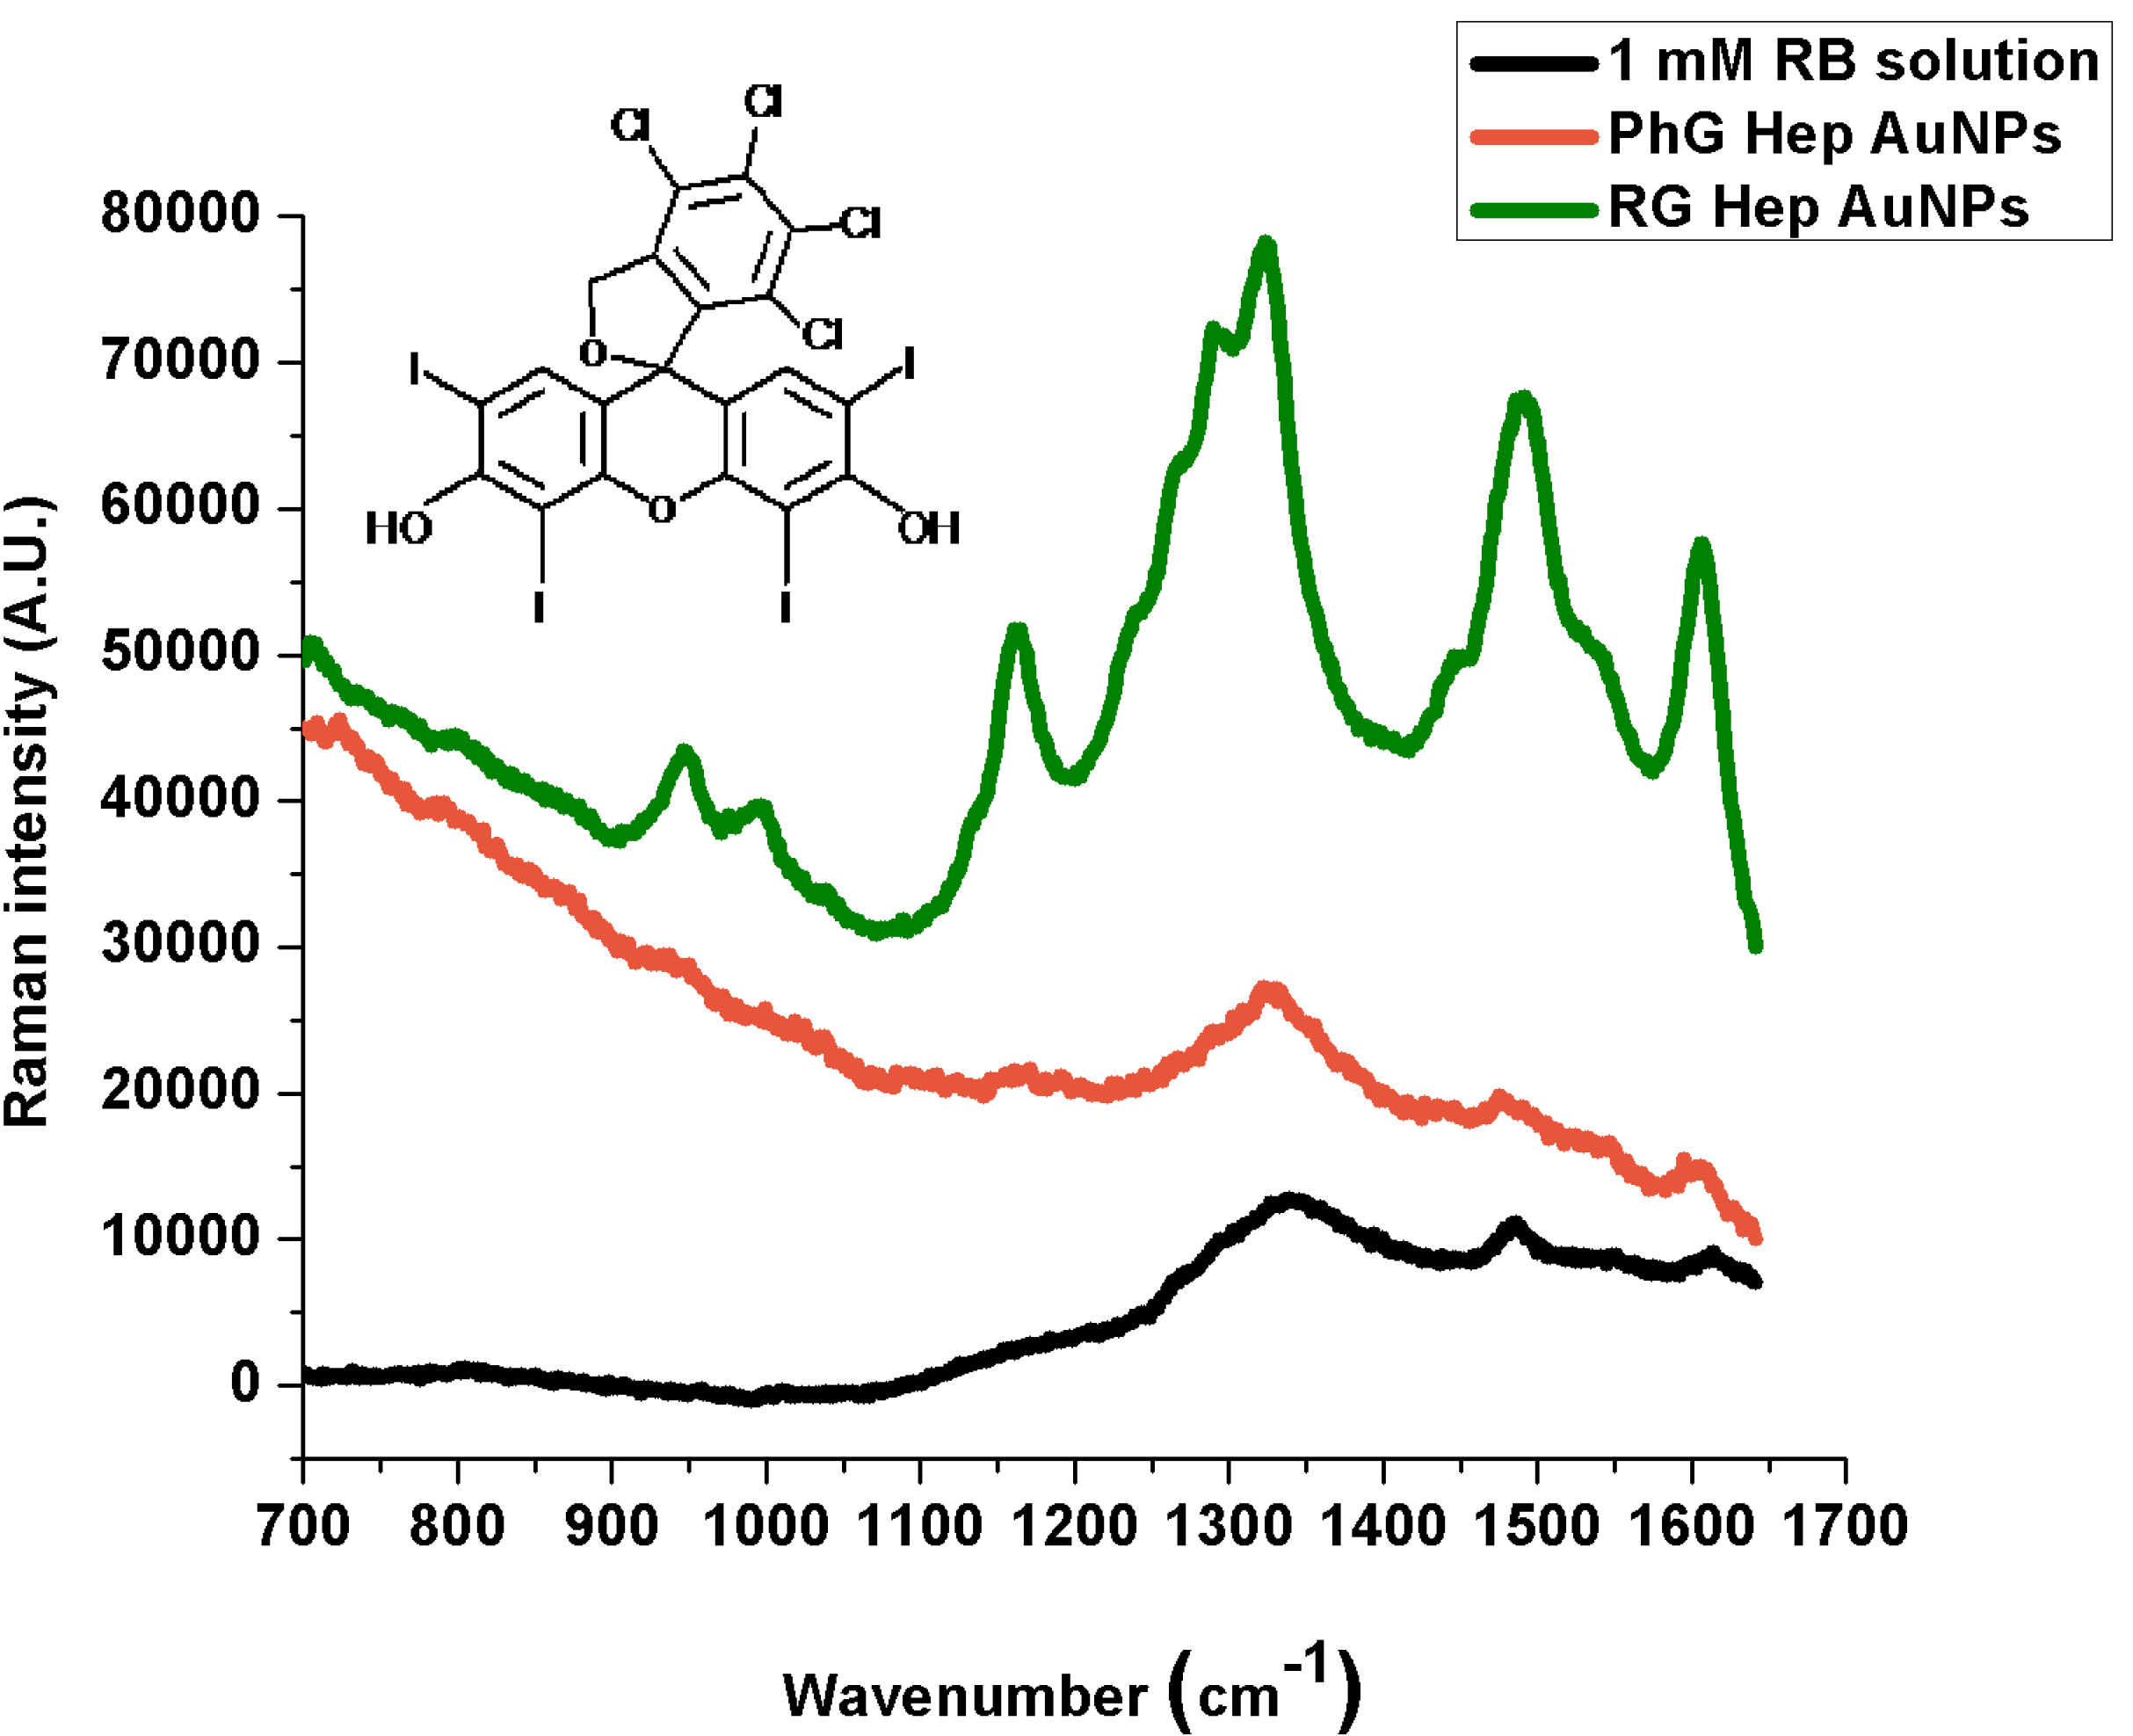
| Reported Peaks (cm−1) [29] | 1 mM Solution (cm−1) | PhG Heparin Au NPs (cm−1) | RG Heparin Au NPs (cm−1) | Band Assignment |
|---|---|---|---|---|
| 616 | - | - | - | - |
| 761 | - | 787 (w) | 793 (w) | C‑Cl stretching |
| 958 | - | 941 (vw) | 947 (w) | - |
| 1012 | - | 997 (vw) | 1000 (w) | C‑OH stretching |
| 1166 | - | 1170 (vw) | 1172 (w) | C‑O and C‑C stretching, C‑H skeletal deformation |
| 1270 | - | 1280 (vw) | 1274 (w) | CCC skeletal deformation in ring, C‑H skeletal deformation |
| 1297 | 1299 (vw) | - | 1291 (w) | CCC skeletal deformation in ring, C‑H skeletal deformation |
| 1340 | 1343 (m) | 1324 (m) | 1322 (m) | C‑C stretching in ring |
| 1491 | 1484 (w) | 1478 (vw) | 1489 (m) | C=C asymmetric stretching in ring |
| 1553 | 1551 (vw) | 1547 (vw) | 1537 (w) | C‑C stretching in ring |
| 1615 | 1613 (vw) | 1603 (w) | 1605 (s) | C=C symmetric stretching in ring |

| 1 mM Solution (cm−1) | PG Heparin Au NPs (cm−1) | RG Heparin Au NPs (cm−1) | Band Assignment |
|---|---|---|---|
| 1605 (w) | 1618 (w) | 1609 (m) | Scissor vibration of primary amines |
| 1341 (vw) | 1336 (w) | 1374 (m) | C‑N stretching vibration. |
| 1370 (w) | 1370 (w) | 1403 (w) | C‑N stretching vibration |
| 1459 (vw) | 1470 (w) | 1472 (w) | CH3 deformation vibration |
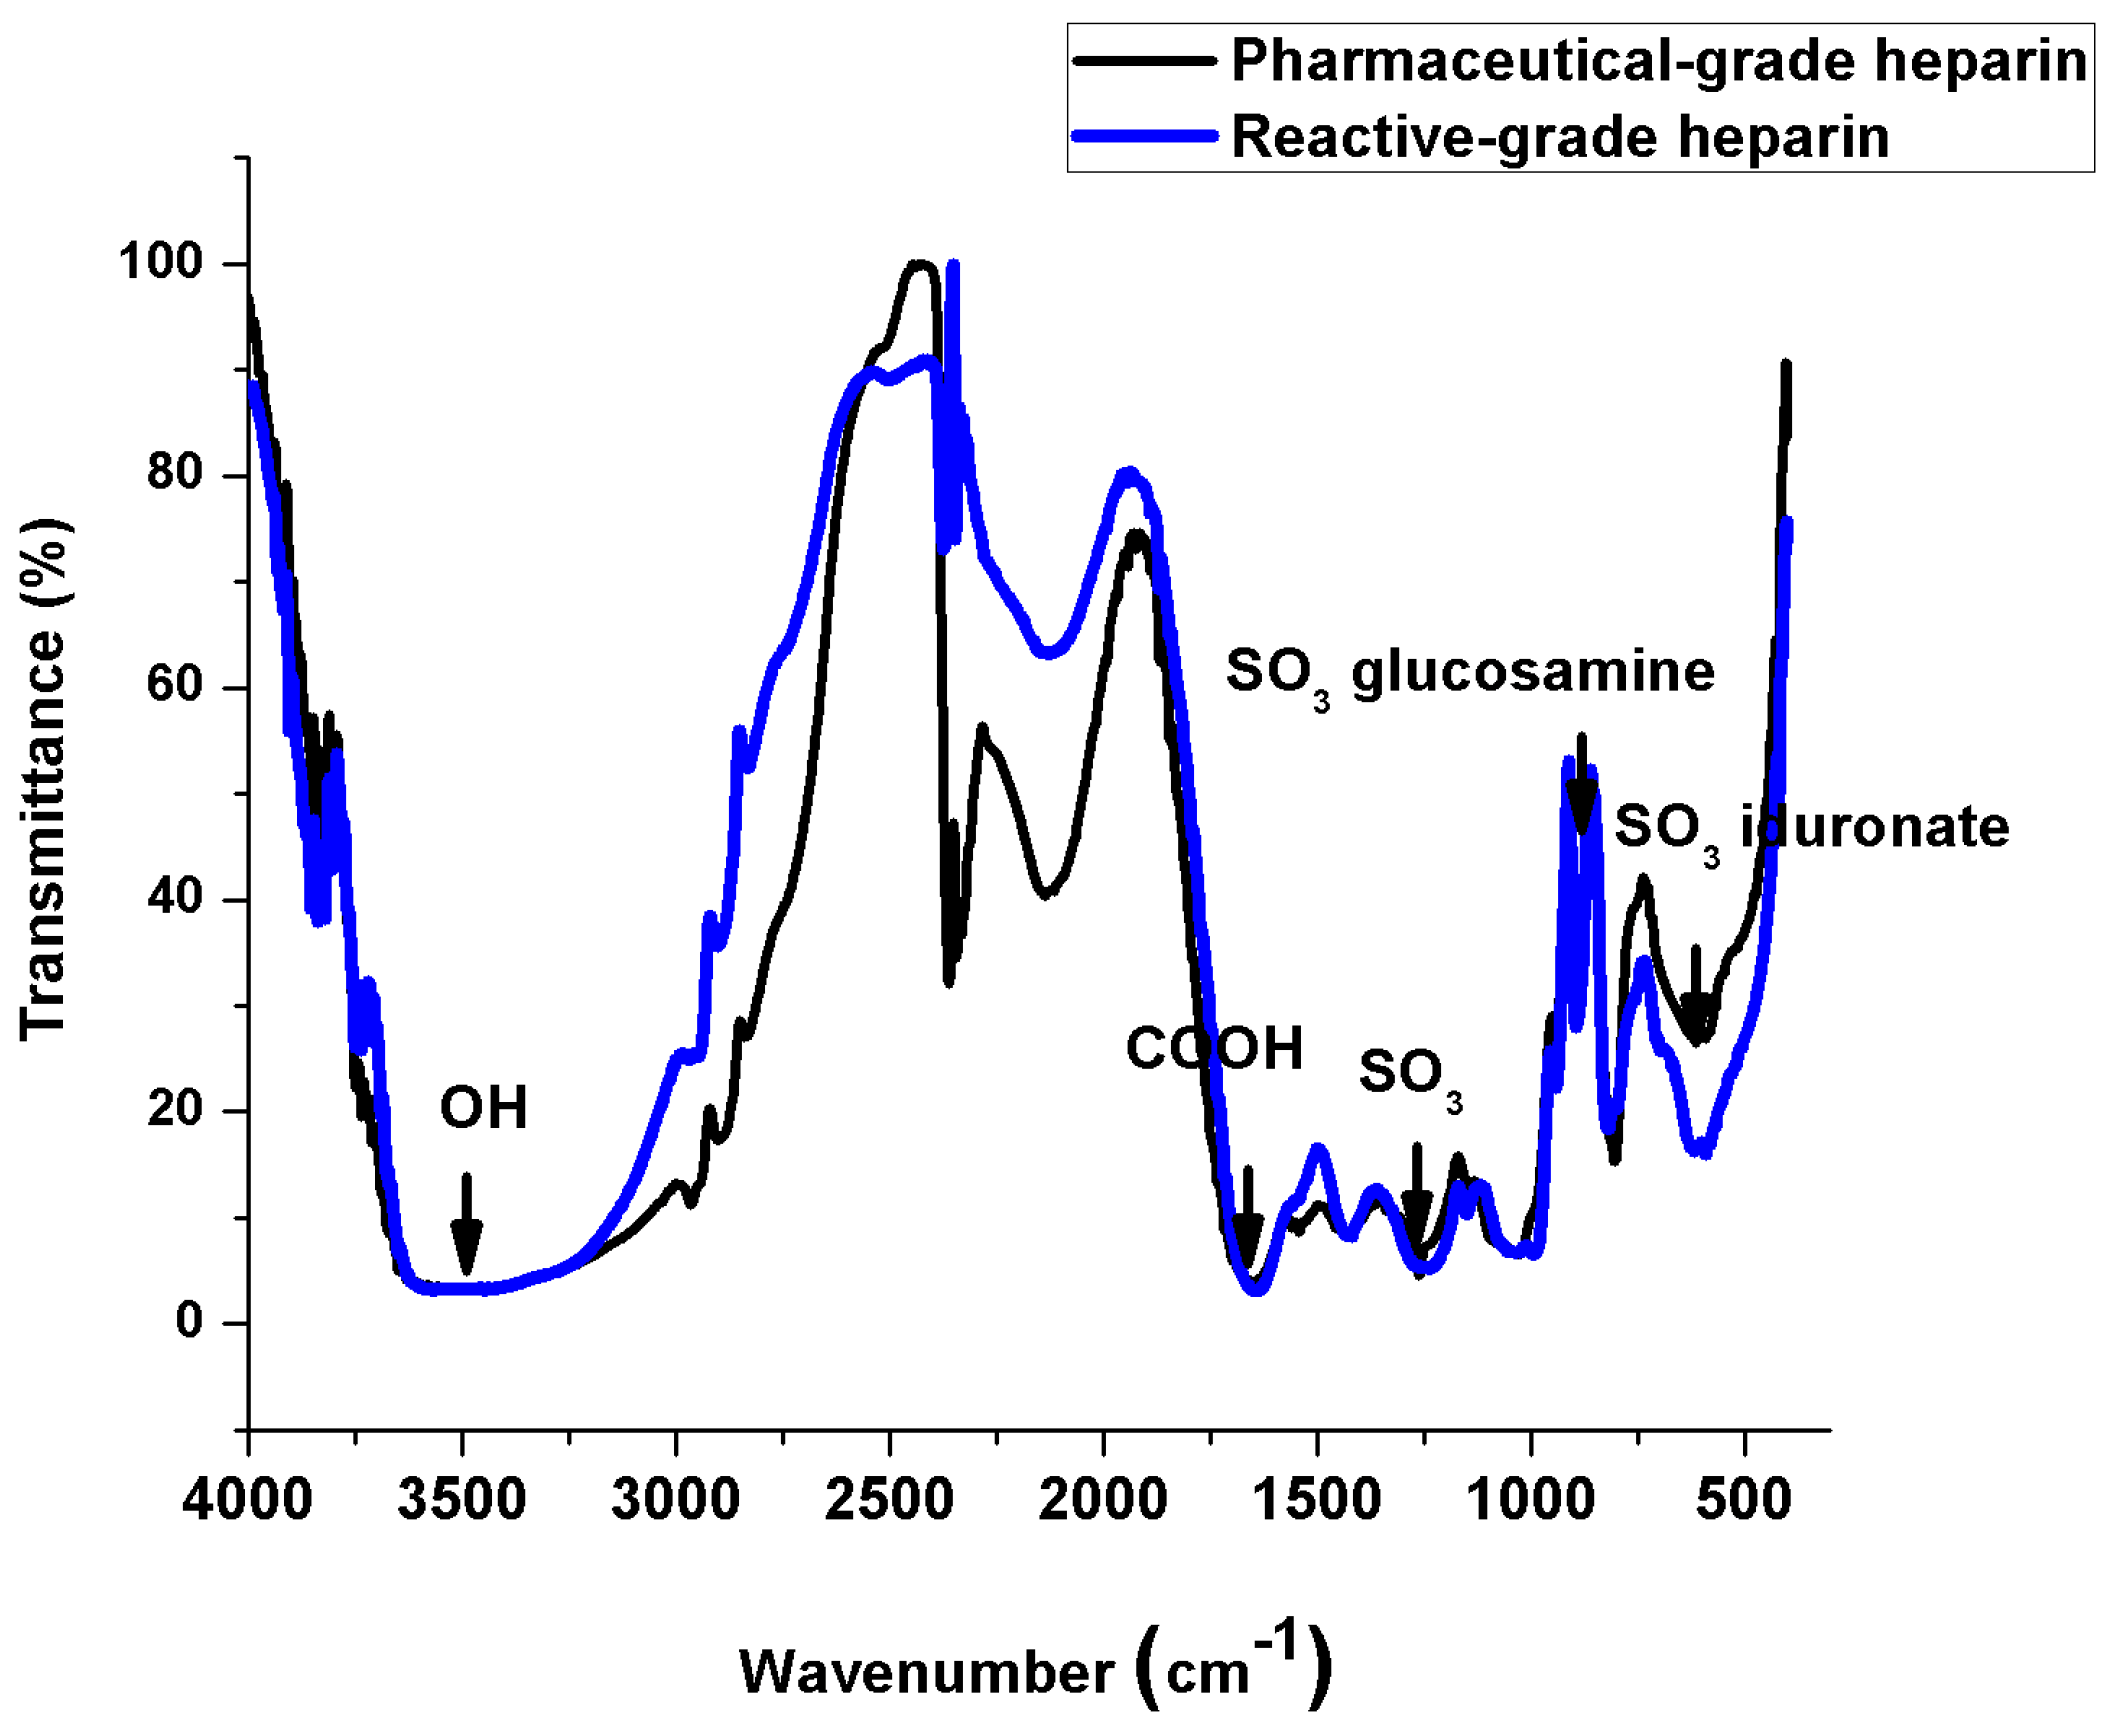
2.3. IR Spectroscopy Measurements
2.4. Measurements of pH
| Sample | pH |
|---|---|
| Pharmaceutical-grade nanoparticle synthesis | 6.78 |
| PG Hep NPs-Methylene Blue | 6.24 |
| PG Hep NPs-Neutral Red | 6.10 |
| PG Hep NPs-Rose Bengal | 5.94 |
| Reactive-grade nanoparticle synthesis | 4.86 |
| PG Hep NPs-Rose Bengal | 5.87 |
| PG Hep NP-Methylene Blue | 6.30 |
| PG Hep NPs-Neutral Red | 6.60 |
3. Experimental Section
3.1. Materials and Methods
3.2. Nanoparticle Synthesis
3.3. Sample Preparation for Characterization
4. Conclusions
Acknowledgments
Author Contributions
Conflicts of Interest
References
- Haynes, C.L.; Yonzon, C.R.; Zhang, X; van Duyne, R.P. Surface-enhanced Raman sensors: early history and the development of sensors for quantitative biowarfare agent and glucose detection. J. Raman Spectrosc. 2005, 36, 471–484. [Google Scholar] [CrossRef]
- Kneipp, K.; Kneipp, H.; Itzkan, I.; Dasari, R.R.; Feld, M.S. Surface-enhanced Raman scattering and biophysics. J. Phys. Condens. Matter. 2002, 14, R597–R624. [Google Scholar]
- Cyrankiewicz, M.; Wybranowski, T.; Kruszewski, S. Study of SERS efficiency of metallic colloidal systems. J. Phys. Conf. Ser. 2007, 79. [Google Scholar] [CrossRef]
- Ball, D.J.; Luo, Y.; Kessel, D.; Griffiths, J.; Brown, S.B.; Vernon, D.I. The induction of apoptosis by a positively charged methylene blue derivative. J. Photochem. Photobiol. B 1998, 42, 159–163. [Google Scholar] [CrossRef] [PubMed]
- Argüeso, P.; Tisdale, A.; Spurr-Michaud, S.; Sumiyoshi, M.; Gipson, I.K. Mucin characteristics of human corneal-limbal epithelial cells that exclude the rose bengal anionic dye. Investig. Ophthalmol Vis. Sci. 2006, 47, 113–119. [Google Scholar] [CrossRef]
- Repetto, G.; del Peso, A.; Zurita, J.L. Neutral red uptake assay for the estimation of cell viability/cytotoxicity. Nat. Protoc. 2008, 3, 1125–1131. [Google Scholar] [CrossRef] [PubMed]
- Gandhi, N.S.; Mancera, R.L. The structure of glycosaminoglycans and their interactions with proteins. Chem. Biol. Drug Des. 2008, 72, 455–482. [Google Scholar] [CrossRef] [PubMed]
- Del P. Rodríguez-Torres, M.; Díaz-Torres, L.A.; Salas, P.; Rodríguez-González, C.; Olmos-López, M. UV photochemical synthesis of heparin-coated gold nanoparticles. Gold Bull. 2014, 47, 21–31. [Google Scholar] [CrossRef]
- Huang, H.; Yang, X. Synthesis of polysaccharide-stabilized gold and silver nanoparticles. Carbohydr. Res. 2004, 339, 2627–2631. [Google Scholar] [CrossRef] [PubMed]
- Kemp, M.M.; Kumar, A.; Mousa, S.; Dyskin, E.; Yalcin, M.; Ajayan, P.; Lindhardt, R.J.; Mousa, S.A. Gold and silver nanoparticles with heparin derivative possess angiogenesis properties. Nanotechnology 2009, 20. [Google Scholar] [CrossRef] [PubMed]
- Gou, Y.; Yan, H. Preparation and characterization of Heparin-Stabilized Gold nanoparticles. J. Carbohydr. Chem. 2008, 27, 309–319. [Google Scholar]
- Kim, S.H.; Bonder, M.J.; Colak, L.; Bakhtyar, A.; Shah, S.I.; Kiick, K.L.; Hadjipanayis, G.C. Development of geparin-coated magnetic nanoparticles for targeted drug delivery applications. J. Appl. Phys. 2009, 105, 1–3. [Google Scholar]
- Albrecht, M.A.; Evansa, C.W.; Raston, C.L. Green chemistry and the health implications of nanoparticles. Green Chem. 2006, 8, 417–432. [Google Scholar]
- Saha, S.; Pal, A.; Kundu, S.; Basu, S.; Pal, T. Photochemical green synthesis of calcium-alginate-stabilized Ag and Au nanoparticles and their catalytic application to 4-nitrophenol Reduction. Langmuir 2010, 26, 2885–2893. [Google Scholar] [CrossRef] [PubMed]
- Pal, A. Photochemical synthesis of gold nanoparticles via controlled nucleation using a bioactive molecule. Mater. Lett. 2004, 58, 529–534. [Google Scholar] [CrossRef]
- Wei, G.; Wang, L.; Sun, L.; Song, Y.; Guo, C.; Yang, T.; Li, Z. Type I collagen mediated synthesis and assembly of UV-photoreduced gold nanoparticles and their application in surface enhanced raman scattering. J. Phys. Chem. C 2007, 111, 1976–1982. [Google Scholar] [CrossRef]
- McGilvray, K.L.; Decan, M.R.; Wang, D.; Scaiano, J.C. Facile photochemical synthesis of unprotected aqueous gold nanoparticles. J. Am. Chem. Soc. 2006, 128, 15980–15981. [Google Scholar] [CrossRef] [PubMed]
- Potara, M.; Baia, M.; Farcau, C.; Astilean, S. Chitosan-coated anisotropic silver nanoparticles as a SERS substrate for single-molecule detection. Nanotechnology 2012, 23, 1–10. [Google Scholar] [CrossRef]
- Wei, H.; Li, J.; Wang, Y.; Wang, E. Silver nanoparticles coated with adenine: preparation, self-assembly and application in surface-enhanced Raman scattering. Nanotechnology 2007, 18, 1–5. [Google Scholar]
- Bindhu, M.R.; Sathe, V.; Umadevi, M. Synthesis, characterization and SERS activity of biosynthesized silver nanoparticles. Spectrochim. Acta A 2013, 115, 409–415. [Google Scholar] [CrossRef]
- Peng, C.; Song, Y.; Wei, G.; Zhang, W.; Li, Z.; Dong, W.F. Self-assembly of λ-DNA networks/Ag nanoparticles. Hybrid architecture and active SERS substrate. J. Colloid Interface Sci. 2008, 317, 183–190. [Google Scholar]
- Michaels, A.M.; Nirmal, M.; Brus, L.E. Surface enhanced raman spectroscopy of individual rhodamine 6G molecules on large Ag nanocrystals. J. Am. Chem. Soc. 1999, 121, 9932–9939. [Google Scholar] [CrossRef]
- Plowman, B.; O’Mullane, A.P.; Selvakannan, P.R.; Bhargava, S.K. Honeycomb nanogold networks with highly active sites. Chem. Commun. 2010, 46, 9182–9184. [Google Scholar] [CrossRef]
- Kudelsky, A. Raman studies of rhodamine 6G and crystal violet sub-monolayers on electrochemically roughened silver substrates: Do dye molecules adsorb preferentially on highly SERS-active sites? Chem. Phys. Lett. 2005, 414, 271–275. [Google Scholar]
- Quester, K.; Avalos-Borja, M.; Vilchis-Nestor, A.R.; Camacho-López, M.A.; Castro-Longoria, E. SERS properties of different sized and shaped gold nanoparticles biosynthesized under different environmental conditions by neurospora crassa extract. PLoS One 2013, 8, e77486. [Google Scholar] [CrossRef]
- Suarasan, S.; Focsan, M.; Maniu, D.; Astilean, S. Gelatin-nanogold bioconjugates as effective plasmonic platforms for SERS detection and tagging. Colloids Surf. B Biointerfaces 2013, 103, 475–481. [Google Scholar] [CrossRef] [PubMed]
- Bell, S.E.J.; Stewart, A. Quantitative SERS Methods in Surface Enhanced Raman Spectroscopy Analytical, Biophysical and Life Science Applications, 1st ed.; Schlücker, S., Ed.; Wiley-VCH Verlag GmbH & Co. KGaA: Weinheim, Germany, 2010. [Google Scholar]
- De Nicolai, S.H.A.; Rodrigues, P.R.P.; Agostinho, S.M.L.; Rubim, J.C. Electrochemical and spectroelectrochemical (SERS) studies of the reduction of methylene blue on a silver electrode. J. Electroanal. Chem. 2002, 527, 103–111. [Google Scholar] [CrossRef]
- Gabudean, A.M.; Focsan, M.; Astilean, S. Gold Nanorods performing as dual-modal Nanoprobes via metal-enhanced fluorescence (MEF) and surface-enhanced raman scattering (SERS). J. Phys. Chem. C 2012, 116, 12240–12249. [Google Scholar] [CrossRef]
- Dulkeith, E.; Morteani, A.C.; Niedereichholz, T.; Klar, T.A.; Feldmann, J. Fluorescence quenching of dye molecules near gold nanoparticles: radiative and nonradiative effects. Phys. Rev. Lett. 2002, 89. [Google Scholar] [CrossRef] [PubMed]
- Baia, M.; Astilean, S.; Lliescu, T. Fundamentals of infrared and raman spectroscopy, SERS, and theoretical simulations. In Raman and SERS Investigations of Pharmaceuticals, 1st ed.; Springer-Verlag: Heidelberg, Germany, 2008; pp. 9–29. [Google Scholar]
- Oliveira, G.B.; Carvalho, L.B., Jr.; Silva, M.P.C. Properties of carbodiimide treated heparin. Biomaterials 2003, 24, 4777–4783. [Google Scholar] [CrossRef] [PubMed]
- Grant, D.; Long, W.F.; Moffat, C.F.; Williamson, F.B. Infrared spectroscopy of heparins suggests that the region 750–950 cm−1 is sensitive to changes in iduronate residue ring conformation. Biochem. J. 1991, 275, 193–197. [Google Scholar] [PubMed]
- Murugesan, S.; Xie, J.; Linhardt, R.J. Immobilization of heparin: Approaches and applications. Curr. Top. Med. Chem. 2008, 8, 80–100. [Google Scholar] [CrossRef] [PubMed]
- Liu, Z.; Li, S.; Hu, C.; Zhang, W.; Zhong, H.; Guo, Z. pH-dependent surface-enhanced Raman scattering of aromatic molecules on graphene oxide. J. Raman Spectrosc. 2013, 44, 75–80. [Google Scholar] [CrossRef]
- Dhotel, A.; Chen, Z.; Delbreilh, L.; Youssef, B.; Saiter, J.M.; Tan, L. Molecular motions in functional self-assembled nanostructures. Int. J. Mol. Sci. 2013, 14, 2303–2333. [Google Scholar] [CrossRef] [PubMed]
- Ganbold, E.O.; Park, J.H.; Dembereldorj, U.; Ock, K.S.; Joo, S.W. Charge-dependent adsorption of rhodamine 6G on gold nanoparticle surfaces: fluorescence and Raman study. J. Raman Spectrosc. 2011, 42, 1614–1619. [Google Scholar] [CrossRef]
© 2014 by the authors; licensee MDPI, Basel, Switzerland. This article is an open access article distributed under the terms and conditions of the Creative Commons Attribution license (http://creativecommons.org/licenses/by/4.0/).
Share and Cite
Del Pilar Rodríguez-Torres, M.; Díaz-Torres, L.A.; Romero-Servin, S. Heparin Assisted Photochemical Synthesis of Gold Nanoparticles and Their Performance as SERS Substrates. Int. J. Mol. Sci. 2014, 15, 19239-19252. https://doi.org/10.3390/ijms151019239
Del Pilar Rodríguez-Torres M, Díaz-Torres LA, Romero-Servin S. Heparin Assisted Photochemical Synthesis of Gold Nanoparticles and Their Performance as SERS Substrates. International Journal of Molecular Sciences. 2014; 15(10):19239-19252. https://doi.org/10.3390/ijms151019239
Chicago/Turabian StyleDel Pilar Rodríguez-Torres, Maria, Luis Armando Díaz-Torres, and Sergio Romero-Servin. 2014. "Heparin Assisted Photochemical Synthesis of Gold Nanoparticles and Their Performance as SERS Substrates" International Journal of Molecular Sciences 15, no. 10: 19239-19252. https://doi.org/10.3390/ijms151019239
APA StyleDel Pilar Rodríguez-Torres, M., Díaz-Torres, L. A., & Romero-Servin, S. (2014). Heparin Assisted Photochemical Synthesis of Gold Nanoparticles and Their Performance as SERS Substrates. International Journal of Molecular Sciences, 15(10), 19239-19252. https://doi.org/10.3390/ijms151019239