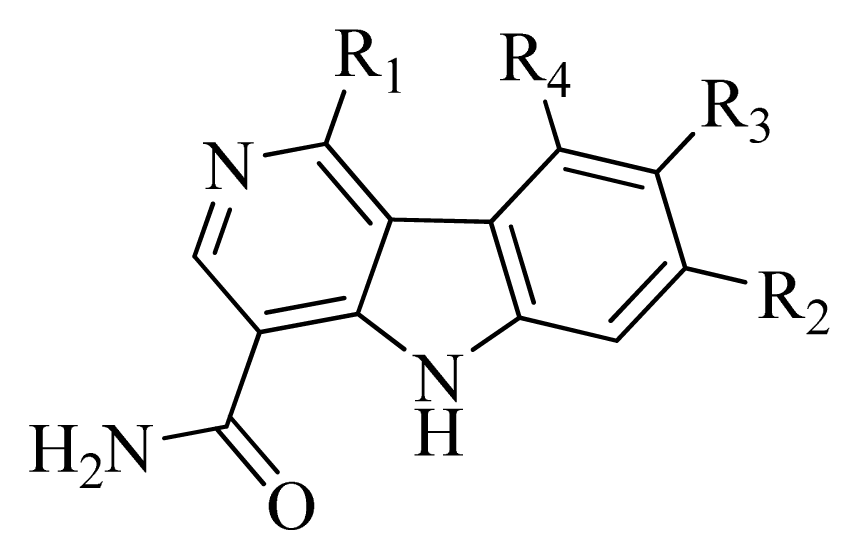
Three Dimensional Quantitative Structure-Activity Relationship of 5H-Pyrido[4,3-b]indol-4-carboxamide JAK2 Inhibitors

Abstract
:1. Introduction
2. Results and Discussion
2.1. Comparative Molecular Field Analysis (CoMFA) and Comparative Molecular Similarity Indices Analysis (CoMSIA) Results
2.2. Y-Randomization Test
2.3. Predictive Ability of Quantitative Structure-Activity Relationship (QSAR) Models
2.4. Contour Analysis
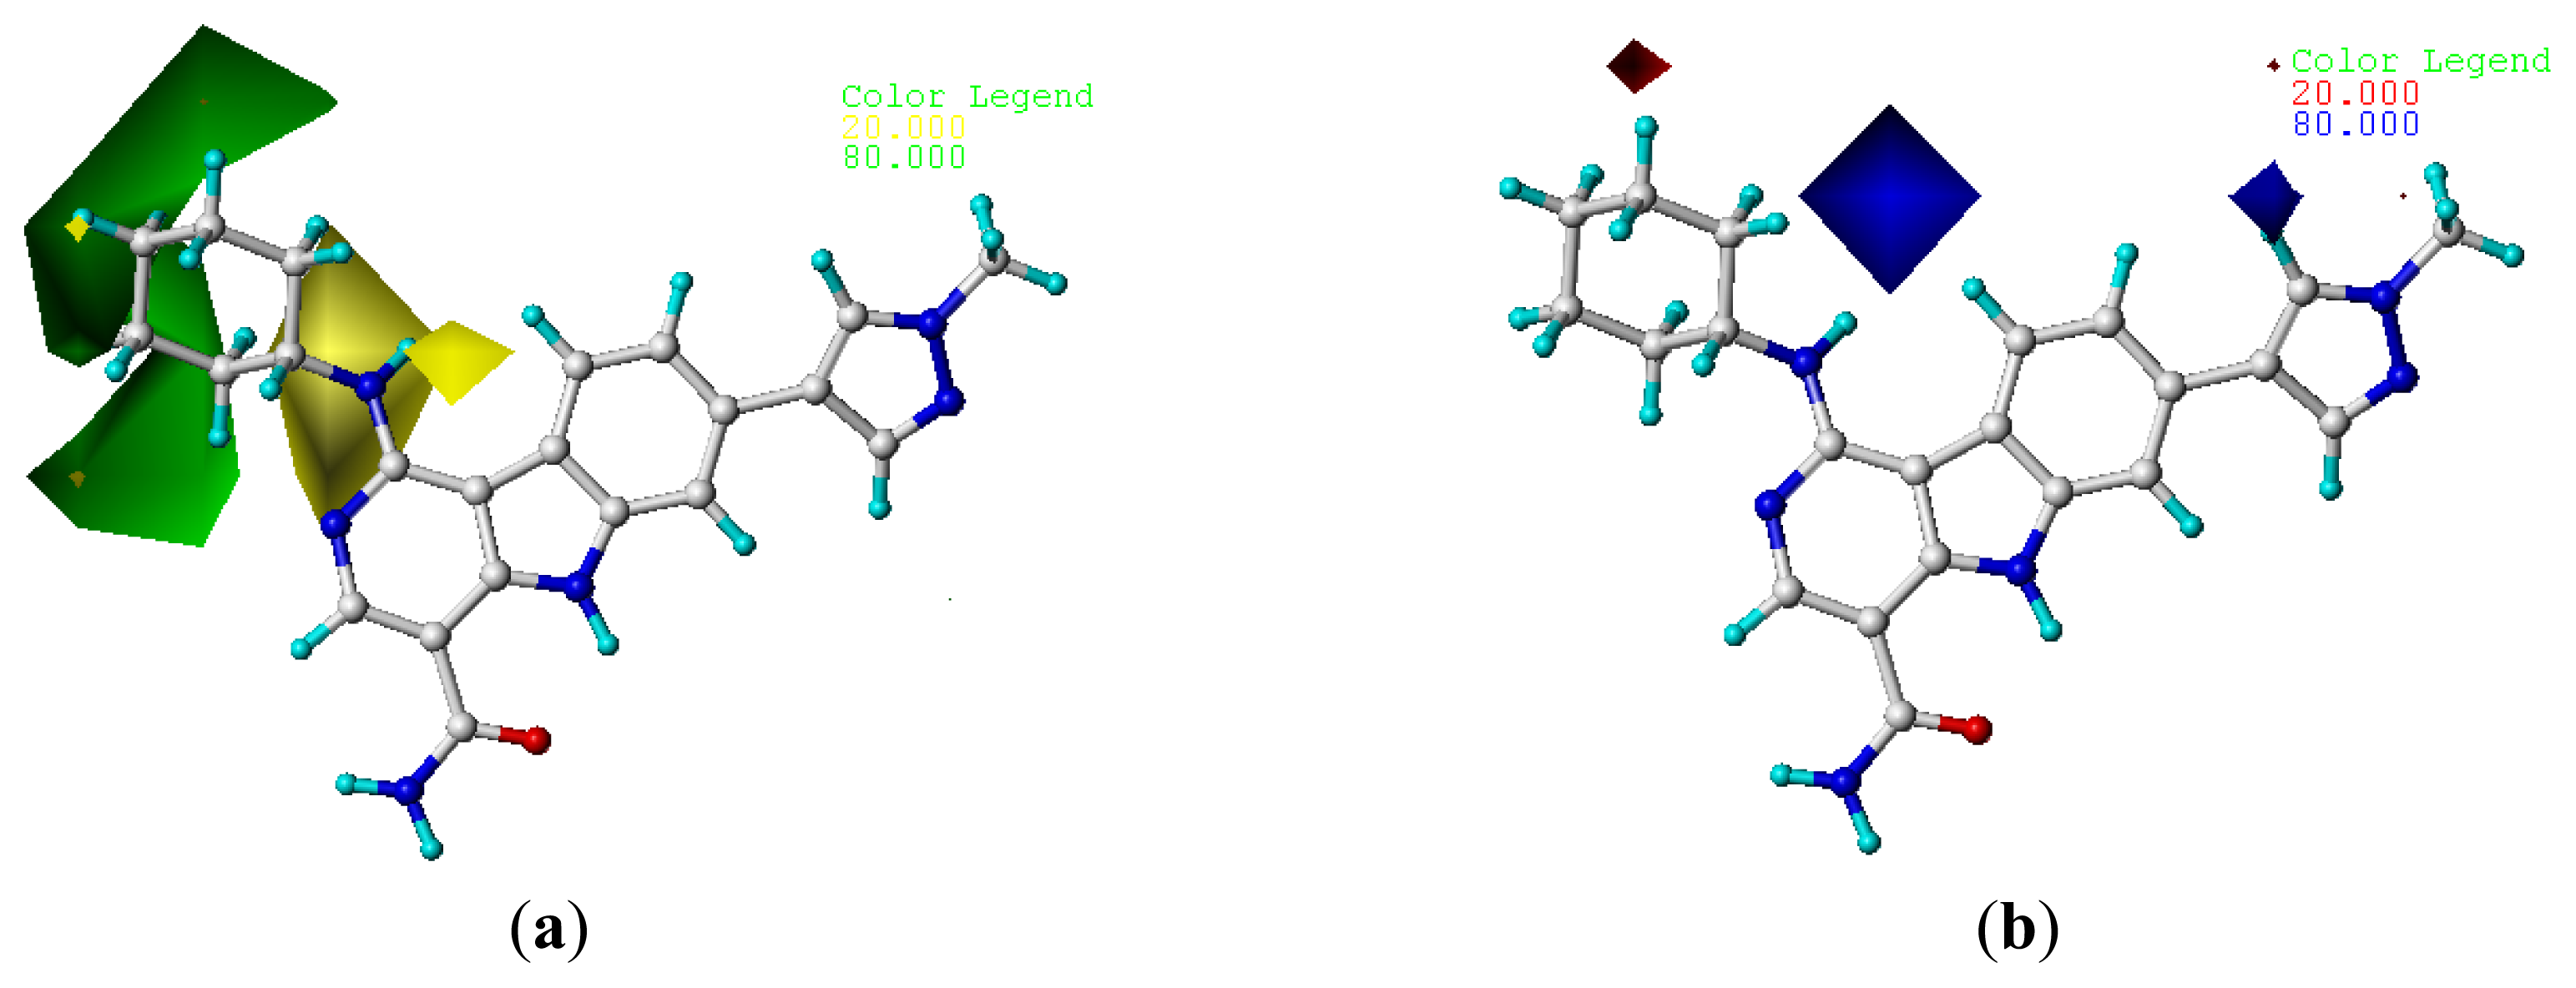
2.4.1. CoMFA Contour Maps
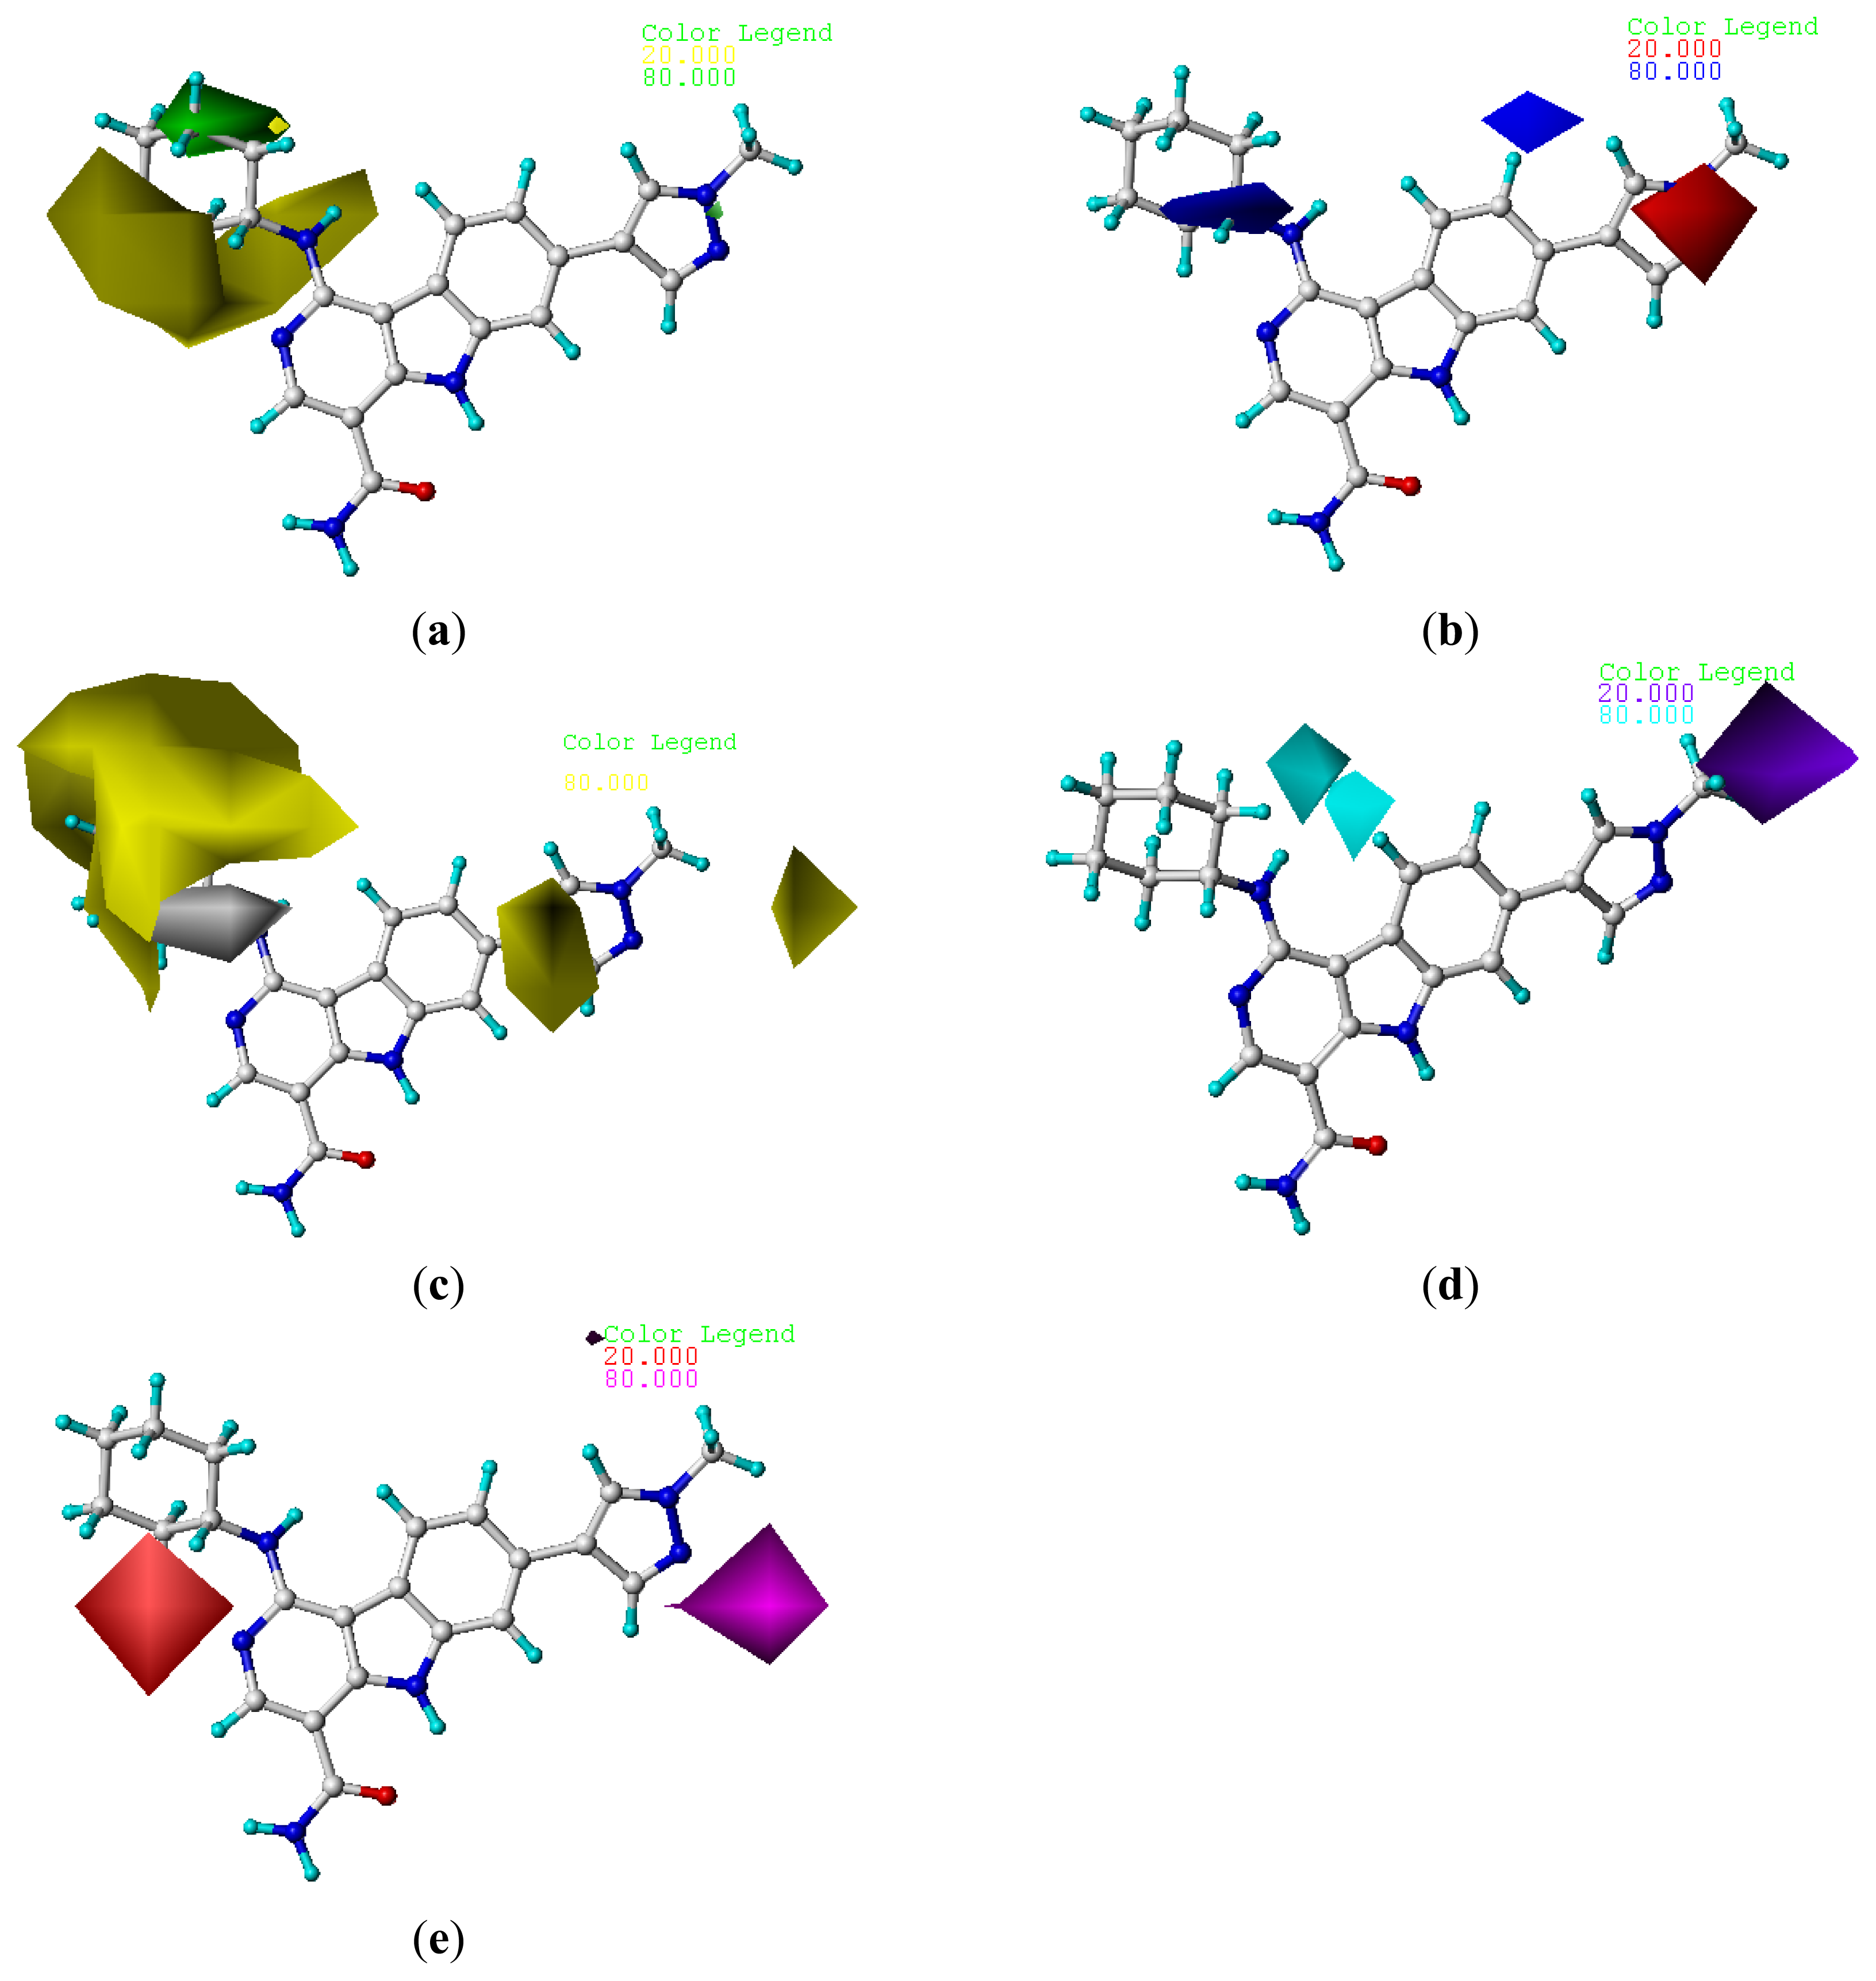
2.4.2. CoMSIA Contour Maps
2.5. Design of New Inhibitors
3. Experimental Section
3.1. General
3.2. Data Set
3.3. Molecular Modeling
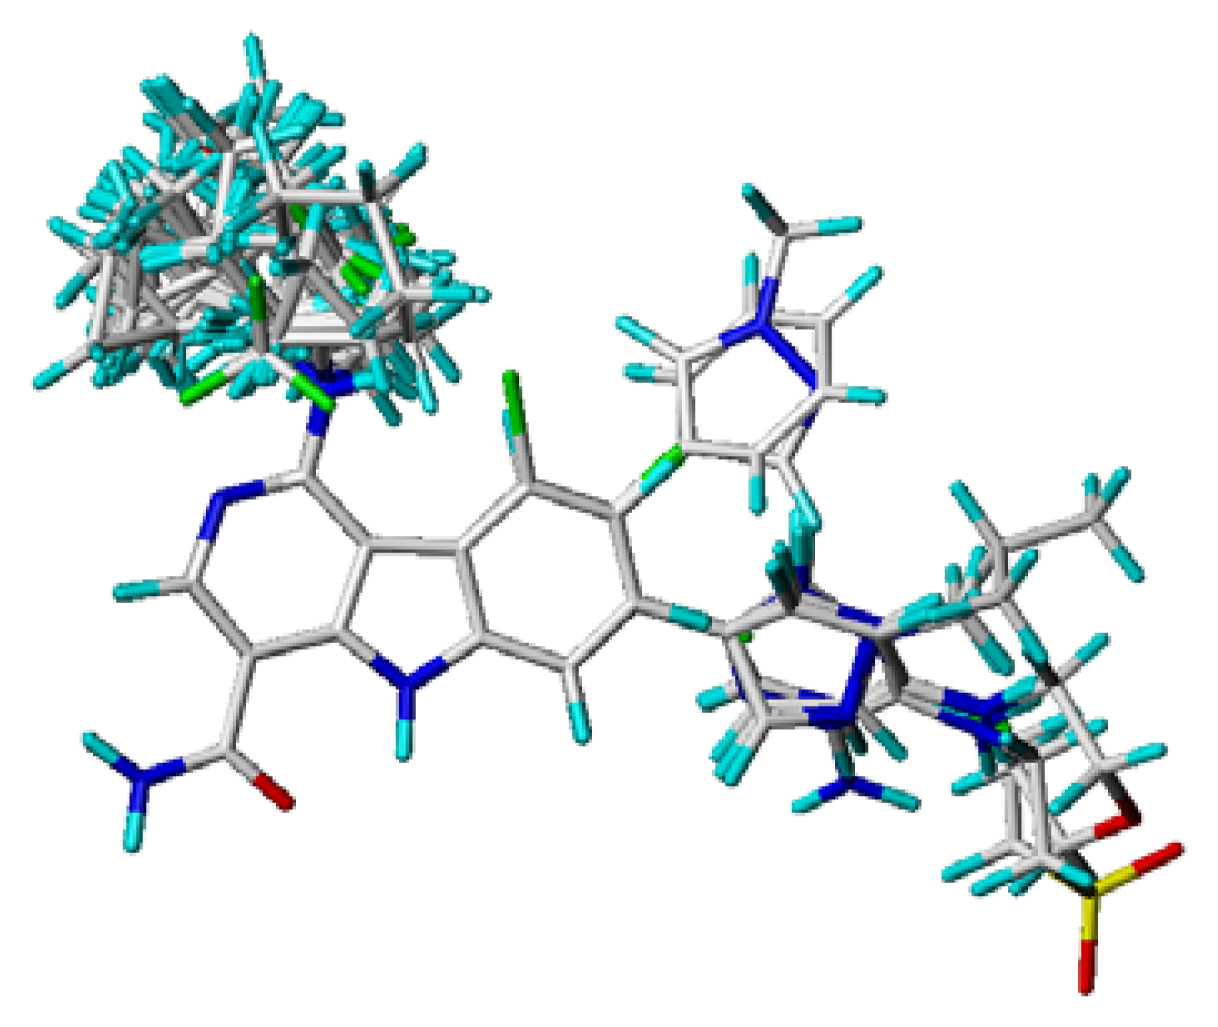
3.4. Molecular Alignment
3.5. Generation of CoMFA and CoMSIA Models
3.6. Partial Least Squares (PLS) Regression Analysis and Validation of QSAR Models
3.7. Y-Randomization Test of QSAR Models
3.8. Predictive Correlation Coefficient of QSAR Models
4. Conclusions
Supplementary Information
ijms-14-12037-s001.pdfAcknowledgments
Conflict of Interest
References
- Wallace, T.A.; Xia, S.L.; Sayeski, P.P. JAK2 tyrosine kinase prevents angiotensin II-mediated inositol 1,4,5 trisphosphate receptor degradation. Vasc. Pharmacol 2005, 43, 336–345. [Google Scholar]
- Lucet, I.S.; Fantino, E.; Styles, M.; Bamert, R.; Patel, O.; Broughton, S.E.; Walter, M.; Burns, C.J.; Treutlein, H.; Wilks, A.F.; et al. The structural basis of Janus kinase 2 inhibition by a potent and specific pan-Janus kinase inhibitor. Blood 2006, 107, 176–183. [Google Scholar]
- McDoom, I.; Ma, X.; Kirabo, A.; Lee, K.-Y.; Ostrov, D.A.; Sayeski, P.P. Identification of tyrosine 972 as a novel site of JAK2 tyrosine kinase phosphorylation and its role in JAK2 activation. Biochemistry 2008, 47, 8326–8334. [Google Scholar]
- Baxter, E.J.; Scott, L.M.; Campbell, P.J.; East, C.; Fourouclas, N.; Swanton, S.; Vassiliou, G.S.; Bench, A.J.; Boyd, E.M.; Curtin, N.; et al. Acquired mutation of the tyrosine kinase JAK2 in human myeloproliferative disorders. Lancet 2005, 365, 1054–1061. [Google Scholar]
- James, C.; Ugo, V.; le Couedic, J.P.; Staerk, J.; Delhommeau, F.; Lacout, C.; Garcon, L.; Raslova, H.; Berger, R.; Bennaceur-Griscelli, A.; et al. A unique clonal JAK2 mutation leading to constitutive signalling causes polycythaemia vera. Nature 2005, 434, 1144–1148. [Google Scholar]
- Kralovics, R.; Passamonti, F.; Buser, A.S.; Teo, S.-S.; Tiedt, R.; Passweg, J.R.; Tichelli, A.; Cazzola, M.; Skoda, R.C. A gain-of-function mutation of JAK2 in myeloproliferative disorders. N. Engl. J. Med 2005, 352, 1779–1790. [Google Scholar]
- Levine, R.L.; Wadleigh, M.; Cools, J.; Ebert, B.L.; Wernig, G.; Huntly, B.J.P.; Boggon, T.J.; Wlodarska, I.; Clark, J.J.; Moore, S.; et al. Activating mutation in the tyrosine kinase JAK2 in polycythemia vera, essential thrombocythemia, and myeloid metaplasia with myelofibrosis. Cancer Cell 2005, 7, 387–397. [Google Scholar]
- Zhao, R.; Xing, S.; Li, Z.; Fu, X.; Li, Q.; Krantz, S.B.; Zhao, Z.J. Identification of an acquired JAK2 mutation in polycythemia vera. J. Biol. Chem 2005, 280, 22788–22792. [Google Scholar]
- Lucia, E.; Recchia, A.G.; Gentile, M.; Bossio, S.; Vigna, E.; Mazzone, C.; Madeo, A.; Morabito, L.; Gigliotti, V.; de Stefano, L.; et al. Janus kinase 2 inhibitors in myeloproliferative disorders. Expert Opin. Investig. Drugs 2011, 20, 41–59. [Google Scholar]
- Quintás-Cardama, A.; Verstovsek, S. New JAK2 inhibitors for myeloproliferative neoplasms. Expert Opin. Investig. Drugs 2011, 20, 961–972. [Google Scholar]
- Menet, C.J.; Rompaey, L.V.; Geney, R. Advances in the discovery of selective JAK inhibitors. Prog. Med. Chem 2013, 52, 153–223. [Google Scholar]
- Chen, A.T.; Prchal, J.T. JAK2 kinase inhibitors and myeloproliferative disorders. Curr. Opin. Hematol 2010, 17, 110–116. [Google Scholar]
- Lim, J.; Taoka, B.; Otte, R.D.; Spencer, K.; Dinsmore, C.J.; Altman, M.D.; Chan, G.; Rosenstein, C.; Sharma, S.; Su, H.P.; et al. Discovery of 1-amino-5H-pyrido[4,3-b]indol-4-carboxamide inhibitors of janus kinase 2 (JAK2) for the treatment of myeloproliferative disorders. J. Med. Chem 2011, 54, 7334–7349. [Google Scholar]
- Wu, X.; Wu, S.; Chen, W.-H. Molecular docking and 3D-QSAR study on 4-(1H-indazol-4-yl) phenylamino and aminopyrazolopyridine urea derivatives as kinase insert domain receptor (KDR) inhibitors. J. Mol. Model 2012, 18, 1207–1218. [Google Scholar]
- Wu, X.; Chen, W.-H.; Wu, S.; Tian, Y.-X.; Zhang, J.-J. Pyrrolo[3,2-d]pyrimidine derivatives as type II kinase insert domain receptor (KDR) inhibitors: CoMFA and CoMSIA studies. Int. J. Mol. Sci 2012, 13, 2387–2404. [Google Scholar]
- Putz, M.V.; Lacrămă, A.-M. Introducing spectral structure activity relationship (S-SAR) analysis: Application to ecotoxicology. Int. J. Mol. Sci 2007, 8, 363–391. [Google Scholar]
- Lacrămă, A.-M.; Putz, M.V.; Ostafe, V. A spectral-SAR model for the anionic-cationic interaction in ionic liquids: Application to Vibrio fischeri ecotoxicity. Int. J. Mol. Sci 2007, 8, 842–863. [Google Scholar]
- Cramer, R.D.; Patterson, D.E.; Bunce, J.D. Comparative molecular field analysis (CoMFA). 1. Effect of shape on binding of steroids to carrier proteins. J. Am. Chem. Soc 1988, 110, 5959–5967. [Google Scholar]
- Klebe, G.; Abraham, U.; Mietzner, T. Molecular similarity indices in a comparative analysis (CoMSIA) of drug molecules to correlate and predict their biological activity. J. Med. Chem 1994, 37, 4130–4146. [Google Scholar]
- Sybyl, version 7.3; software for molecular modeling package; Tripos International: St. Louis, MO, USA, 2007.
- Rücker, C.; Rücker, G.; Meringer, M. y-Randomization and its variants in QSPR/QSAR. J. Chem. Inf. Model 2007, 47, 2345–2357. [Google Scholar]
 ) compounds from the CoMFA and CoMSIA models.
) compounds from the CoMFA and CoMSIA models.
) compounds from the CoMFA and CoMSIA models.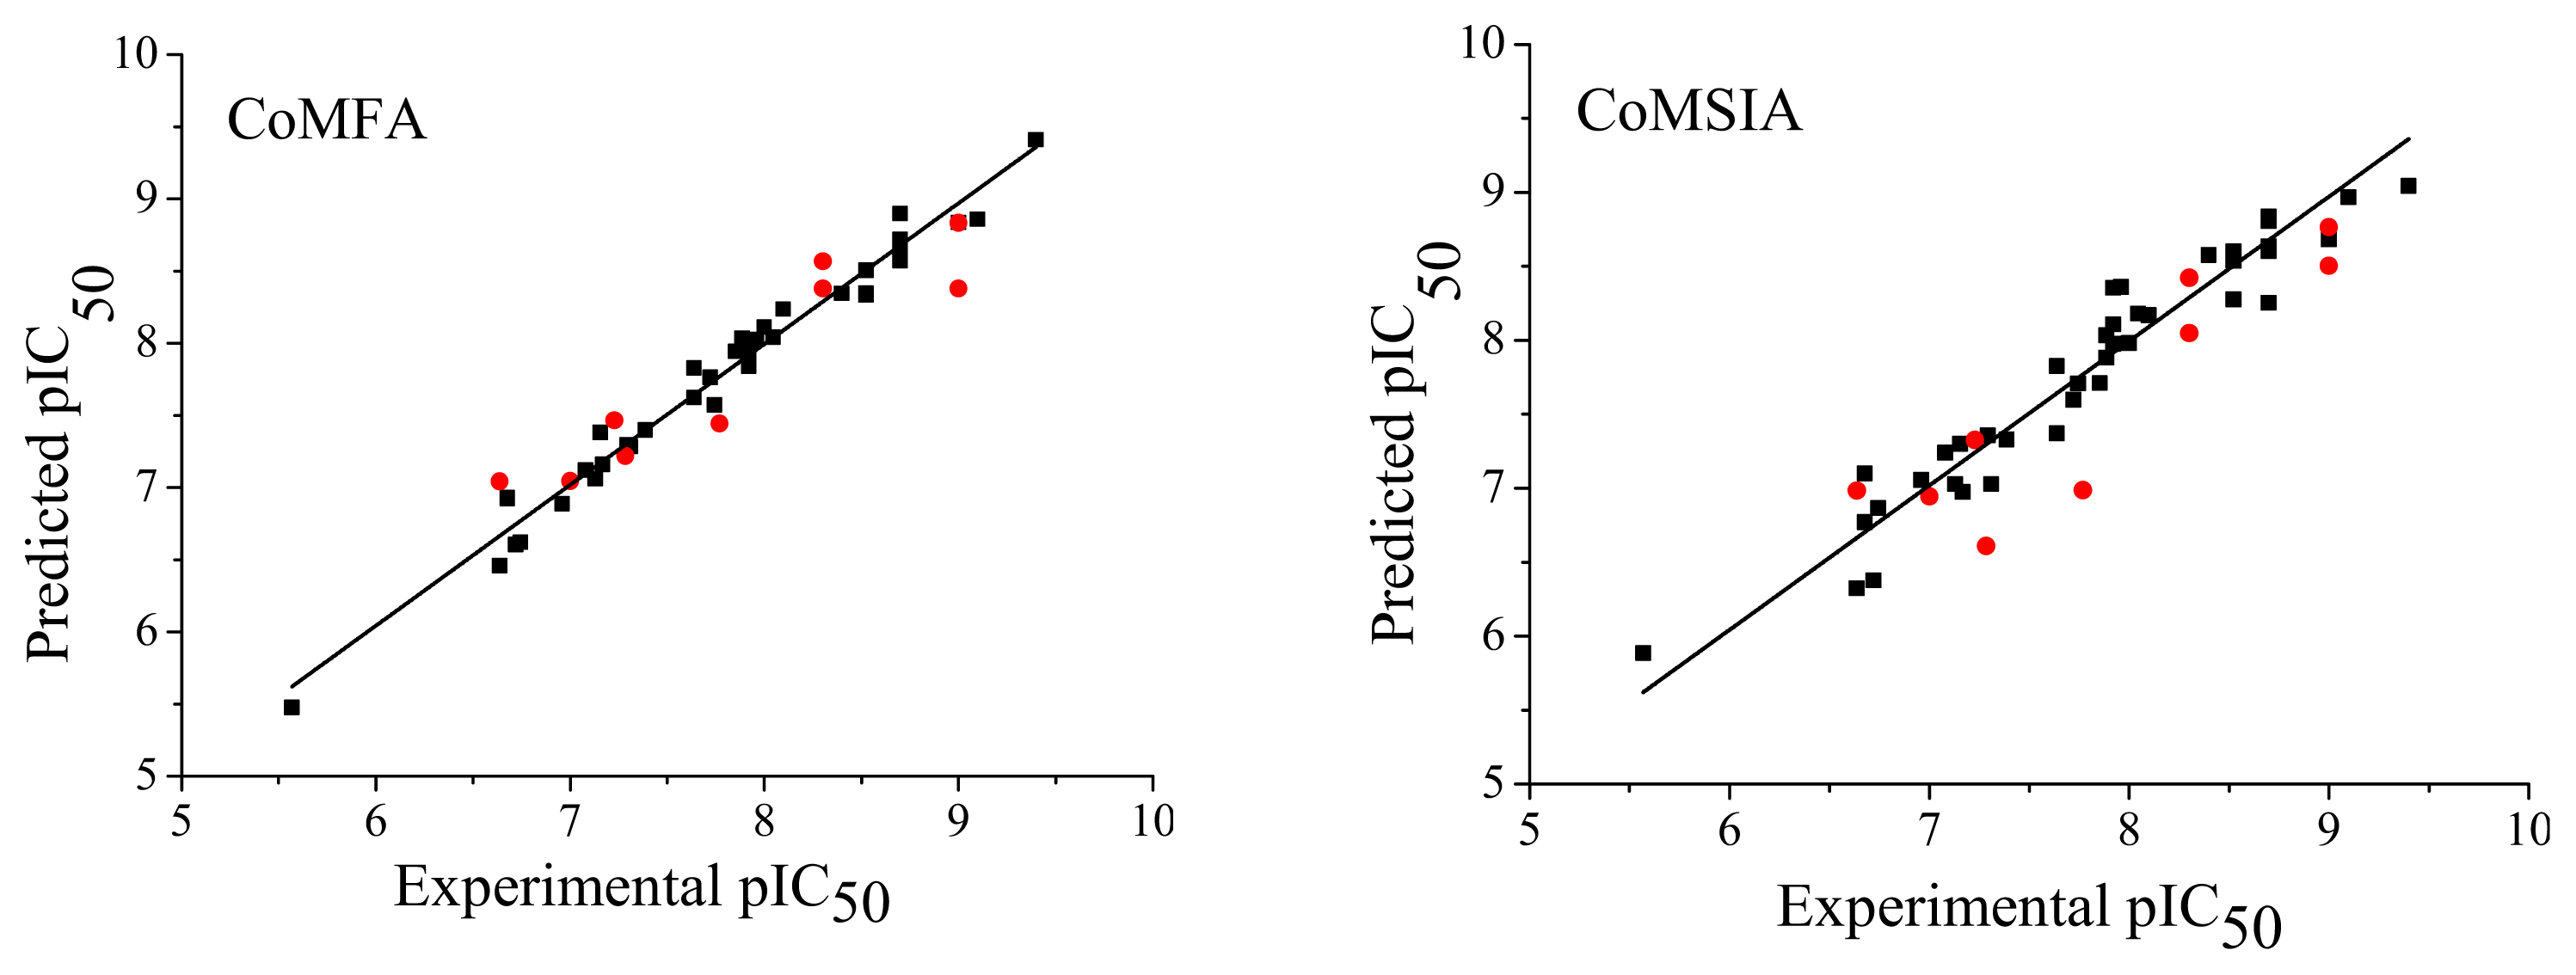


| Model | N | q2 | r2 | SEE | F | r2pred. | Field contribution | ||||
|---|---|---|---|---|---|---|---|---|---|---|---|
| S | E | H | D | A | |||||||
| CoMFA | 6 | 0.633 | 0.976 | 0.138 | 225.030 | 0.862 | 0.552 | 0.448 | - | - | - |
| CoMSIA | 5 | 0.614 | 0.929 | 0.234 | 88.771 | 0.735 | 0.273 | 0.239 | 0.164 | 0.217 | 0.107 |
| No. | Experimental pIC50 | Predicted pIC50(CoMFA) | Predicted pIC50(CoMSIA) | ||
|---|---|---|---|---|---|
| Pred. | Resid. | Pred. | Resid. | ||
| 1 | 6.678 | 6.920 | −0.243 | 7.098 | −0.420 |
| 2 * | 6.638 | 7.043 | −0.405 | 6.982 | −0.344 |
| 3 | 7.168 | 7.159 | 0.009 | 6.974 | 0.194 |
| 4 | 7.310 | 7.283 | 0.027 | 7.028 | 0.282 |
| 5 * | 7.000 | 7.045 | −0.045 | 6.944 | 0.056 |
| 6 | 7.131 | 7.061 | 0.070 | 7.029 | 0.102 |
| 7 * | 7.284 | 7.219 | 0.065 | 6.609 | 0.675 |
| 8 | 6.678 | 6.930 | −0.252 | 6.769 | −0.091 |
| 9 | 7.081 | 7.122 | −0.042 | 7.238 | −0.157 |
| 10 | 7.292 | 7.295 | −0.002 | 7.358 | −0.066 |
| 11 * | 7.770 | 7.443 | 0.326 | 6.986 | 0.784 |
| 12 | 7.721 | 7.763 | −0.042 | 7.599 | 0.122 |
| 13 | 7.745 | 7.573 | 0.172 | 7.707 | 0.038 |
| 14 | 6.638 | 6.458 | 0.180 | 6.324 | 0.314 |
| 15 | 6.721 | 6.603 | 0.118 | 6.377 | 0.344 |
| 16 | 5.569 | 5.475 | 0.094 | 5.884 | −0.315 |
| 17 * | 7.229 | 7.466 | −0.237 | 7.326 | −0.097 |
| 18 | 7.638 | 7.625 | 0.014 | 7.371 | 0.268 |
| 19 | 6.959 | 6.887 | 0.072 | 7.057 | −0.098 |
| 20 | 7.155 | 7.383 | −0.228 | 7.300 | −0.146 |
| 21 | 6.745 | 6.621 | 0.123 | 6.866 | −0.122 |
| 22 * | 8.301 | 8.568 | −0.267 | 8.422 | −0.121 |
| 23 | 7.886 | 8.034 | −0.148 | 8.034 | −0.148 |
| 24 | 7.886 | 7.996 | −0.110 | 7.883 | 0.003 |
| 25 | 7.638 | 7.828 | −0.189 | 7.827 | −0.189 |
| 26 * | 8.301 | 8.380 | −0.079 | 8.048 | 0.253 |
| 27 | 7.387 | 7.398 | −0.011 | 7.330 | 0.058 |
| 28 | 7.921 | 7.840 | 0.081 | 7.976 | −0.055 |
| 29 | 7.921 | 7.935 | −0.014 | 8.107 | −0.186 |
| 30 | 7.854 | 7.943 | −0.090 | 7.710 | 0.144 |
| 31 | 8.000 | 8.112 | −0.112 | 7.980 | 0.020 |
| 32 | 9.000 | 8.838 | 0.162 | 8.683 | 0.317 |
| 33 | 7.959 | 8.025 | −0.066 | 8.360 | −0.402 |
| 34 | 8.699 | 8.675 | 0.024 | 8.254 | 0.445 |
| 35 | 8.523 | 8.506 | 0.016 | 8.600 | −0.077 |
| 36 | 8.699 | 8.898 | −0.199 | 8.807 | −0.108 |
| 37 | 9.398 | 9.410 | −0.012 | 9.042 | 0.356 |
| 38 | 8.046 | 8.042 | 0.004 | 8.180 | −0.134 |
| 39 | 8.523 | 8.333 | 0.190 | 8.537 | −0.015 |
| 40 | 7.921 | 7.996 | −0.075 | 8.354 | −0.433 |
| 41 | 8.523 | 8.348 | 0.175 | 8.275 | 0.248 |
| 42 | 8.699 | 8.654 | 0.045 | 8.835 | −0.136 |
| 43 | 8.398 | 8.345 | 0.053 | 8.576 | −0.178 |
| 44 * | 9.000 | 8.378 | 0.622 | 8.764 | 0.236 |
| 45 * | 9.000 | 8.835 | 0.165 | 8.504 | 0.496 |
| 46 | 8.699 | 8.718 | −0.020 | 8.600 | 0.099 |
| 47 | 8.097 | 8.235 | −0.138 | 8.169 | −0.072 |
| 48 | 8.699 | 8.574 | 0.125 | 8.634 | 0.065 |
| 49 | 9.097 | 8.859 | 0.238 | 8.966 | 0.131 |
| Iteration | CoMFA | CoMSIA | ||
|---|---|---|---|---|
| q2 | r2 | q2 | r2 | |
| 1 | 0.465 | 0.821 | 0.419 | 0.511 |
| 2 | 0.458 | 0.546 | 0.393 | 0.506 |
| 3 | 0.488 | 0.678 | 0.501 | 0.577 |
| 4 | 0.325 | 0.435 | 0.379 | 0.495 |
| 5 | 0.302 | 0.420 | 0.331 | 0.453 |
| 6 | 0.216 | 0.347 | 0.247 | 0.386 |
| 7 | 0.269 | 0.589 | 0.313 | 0.422 |
| 8 | 0.313 | 0.430 | 0.343 | 0.464 |
| 9 | 0.281 | 0.389 | 0.303 | 0.417 |
| 10 | 0.338 | 0.435 | 0.295 | 0.412 |
 | ||||||
|---|---|---|---|---|---|---|
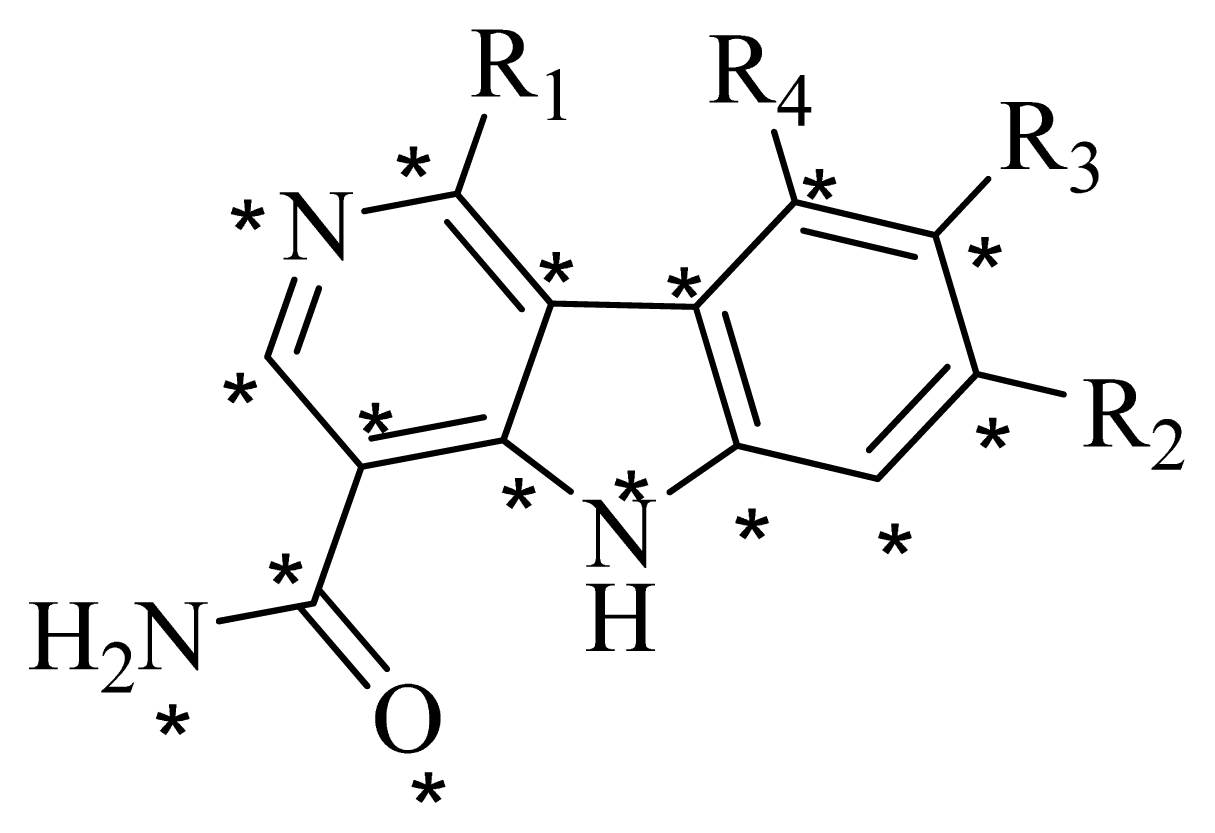
| No. | R1 | R2 | R3 | R4 | Predicted pIC50 | |
| CoMFA | CoMSIA | |||||
| D1 |  |  | F | H | 9.340 | 8.750 |
| D2 | | | H | F | 9.485 | 8.852 |
| D3 | | | F | F | 9.414 | 8.561 |
| D4 | | | Me | H | 8.978 | 9.380 |
| D5 |  | | H | H | 8.965 | 9.416 |
| D6 |  | | H | H | 8.972 | 9.272 |
| D7 |  | | H | H | 8.622 | 8.796 |
| D8 | | | F | H | 9.346 | 8.676 |
| D9 | | | Me | H | 9.169 | 8.617 |
| D10 | |  | Me | H | 8.905 | 8.816 |
| D11 | | | H | H | 8.865 | 8.890 |
| D12 | |  | H | H | 8.585 | 9.092 |
| D13 | | | Me | H | 8.547 | 9.032 |
| D14 | | | Me | H | 8.554 | 8.956 |
| D15 | | | H | H | 8.509 | 8.711 |
| No. | R1 | R2 | R3 | R4 |
|---|---|---|---|---|
| 1 |  | H | F | H |
| 2 * |  | H | F | H |
| 3 |  | H | F | H |
| 4 |  | H | F | H |
| 5 * |  | H | F | H |
| 6 |  | H | F | H |
| 7 * |  | H | F | H |
| 8 |  | H | F | H |
| 9 |  | H | F | H |
| 10 |  | H | F | H |
| 11 * |  | H | F | H |
| 12 |  | H | F | H |
| 13 |  | H | F | H |
| 14 |  | H | F | H |
| 15 |  | H | F | H |
| 16 |  | H | F | H |
| 17 * | | H | H | H |
| 18 | | Cl | H | H |
| 19 | | H | H | Cl |
| 20 | | Phenyl | H | H |
| 21 | | H | Phenyl | H |
| 22 * | | | H | H |
| 23 | | H | | H |
| 24 | |  | H | H |
| 25 | |  | H | H |
| 26 * | | | H | H |
| 27 | |  | H | H |
| 28 | |  | H | H |
| 29 | |  | H | H |
| 30 | |  | H | H |
| 31 | |  | H | H |
| 32 |  | | H | H |
| 33 |  | | H | H |
| 34 |  | | H | H |
| 35 |  | | H | H |
| 36 |  | | H | H |
| 37 | | | H | H |
| 38 |  | | H | H |
| 39 |  | | H | H |
| 40 |  | | H | H |
| 41 | | | H | H |
| 42 | |  | H | H |
| 43 | |  | H | H |
| 44 * | | | H | H |
| 45 * | | | H | H |
| 46 | |  | H | H |
| 47 | |  | H | H |
| 48 | |  | H | H |
| 49 | | | H | H |
© 2013 by the authors; licensee MDPI, Basel, Switzerland This article is an open access article distributed under the terms and conditions of the Creative Commons Attribution license ( http://creativecommons.org/licenses/by/3.0/).
Share and Cite
Wu, X.; Wan, S.; Zhang, J. Three Dimensional Quantitative Structure-Activity Relationship of 5H-Pyrido[4,3-b]indol-4-carboxamide JAK2 Inhibitors. Int. J. Mol. Sci. 2013, 14, 12037-12053. https://doi.org/10.3390/ijms140612037
Wu X, Wan S, Zhang J. Three Dimensional Quantitative Structure-Activity Relationship of 5H-Pyrido[4,3-b]indol-4-carboxamide JAK2 Inhibitors. International Journal of Molecular Sciences. 2013; 14(6):12037-12053. https://doi.org/10.3390/ijms140612037
Chicago/Turabian StyleWu, Xiaoyun, Shanhe Wan, and Jiajie Zhang. 2013. "Three Dimensional Quantitative Structure-Activity Relationship of 5H-Pyrido[4,3-b]indol-4-carboxamide JAK2 Inhibitors" International Journal of Molecular Sciences 14, no. 6: 12037-12053. https://doi.org/10.3390/ijms140612037
APA StyleWu, X., Wan, S., & Zhang, J. (2013). Three Dimensional Quantitative Structure-Activity Relationship of 5H-Pyrido[4,3-b]indol-4-carboxamide JAK2 Inhibitors. International Journal of Molecular Sciences, 14(6), 12037-12053. https://doi.org/10.3390/ijms140612037