Mass Spectrometry-Based Quantitative Metabolomics Revealed a Distinct Lipid Profile in Breast Cancer Patients

Abstract
:1. Introduction
2. Results and Discussion
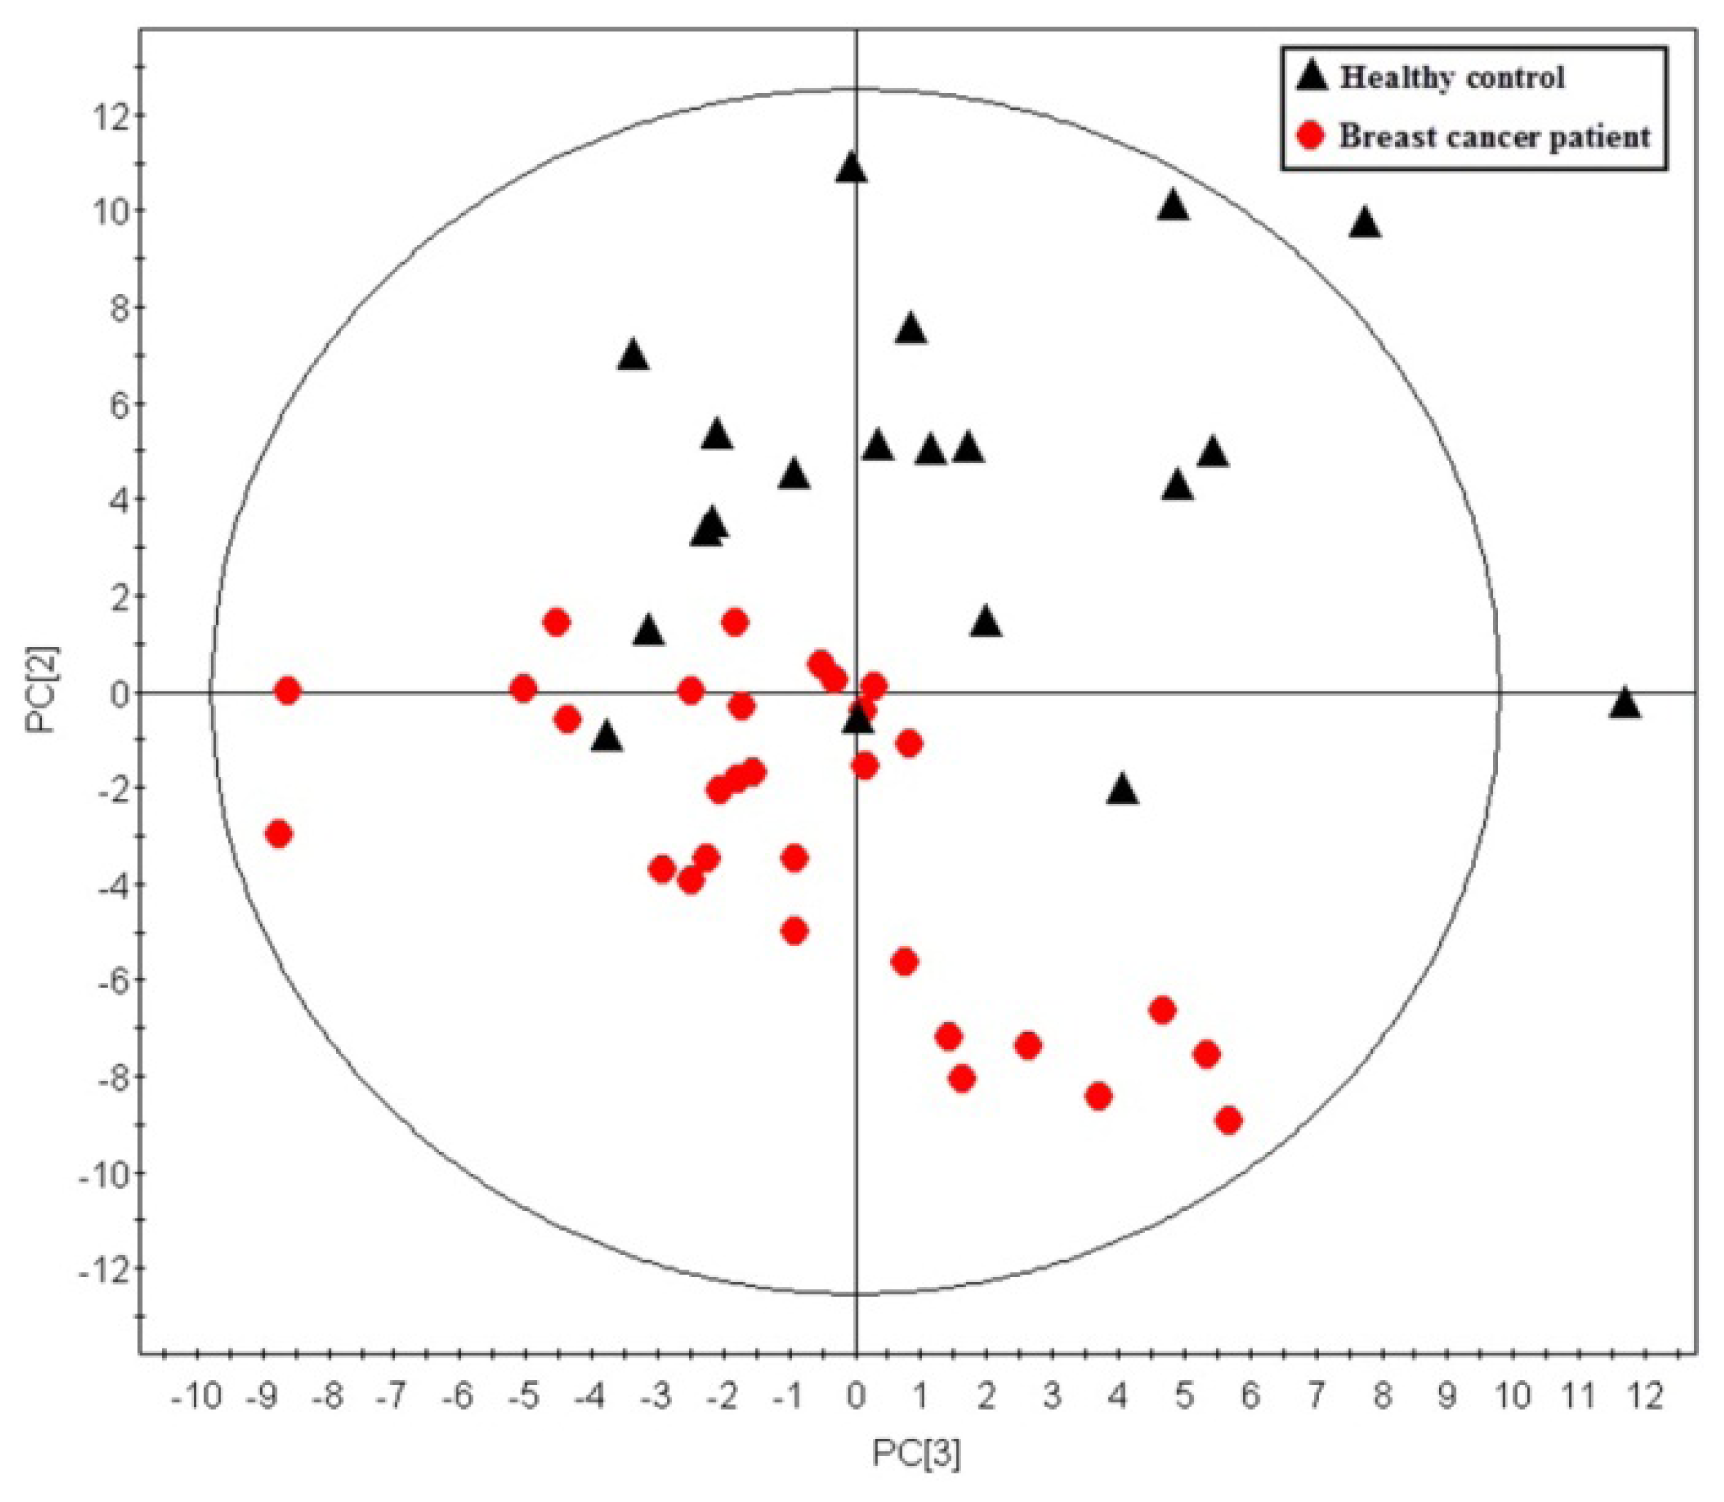
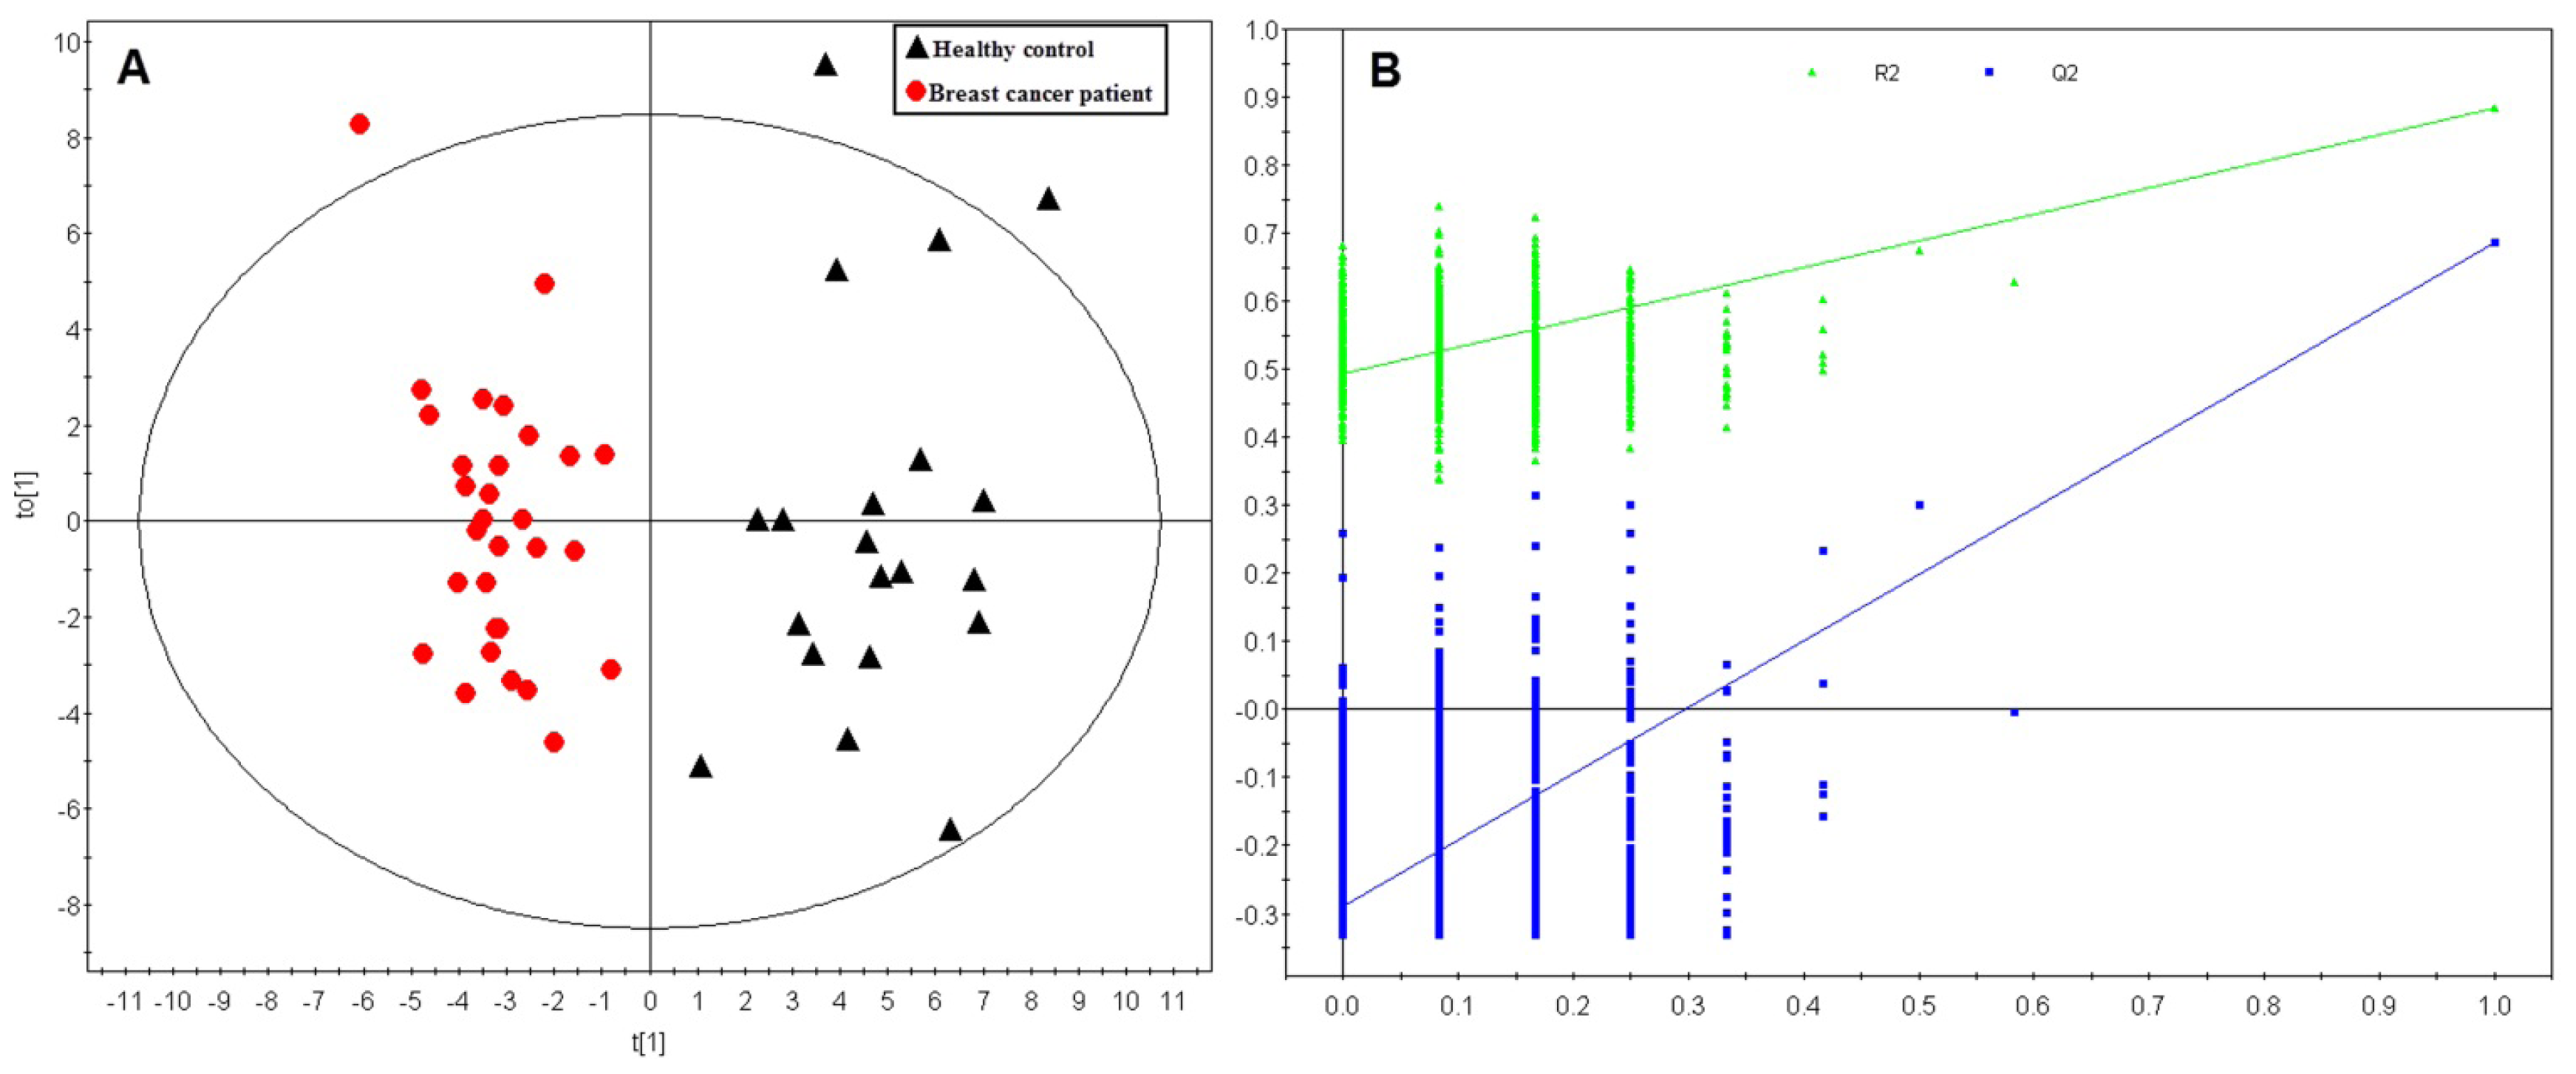
2.1. Multivariate Analysis
2.2. Differentiating Metabolites Identification
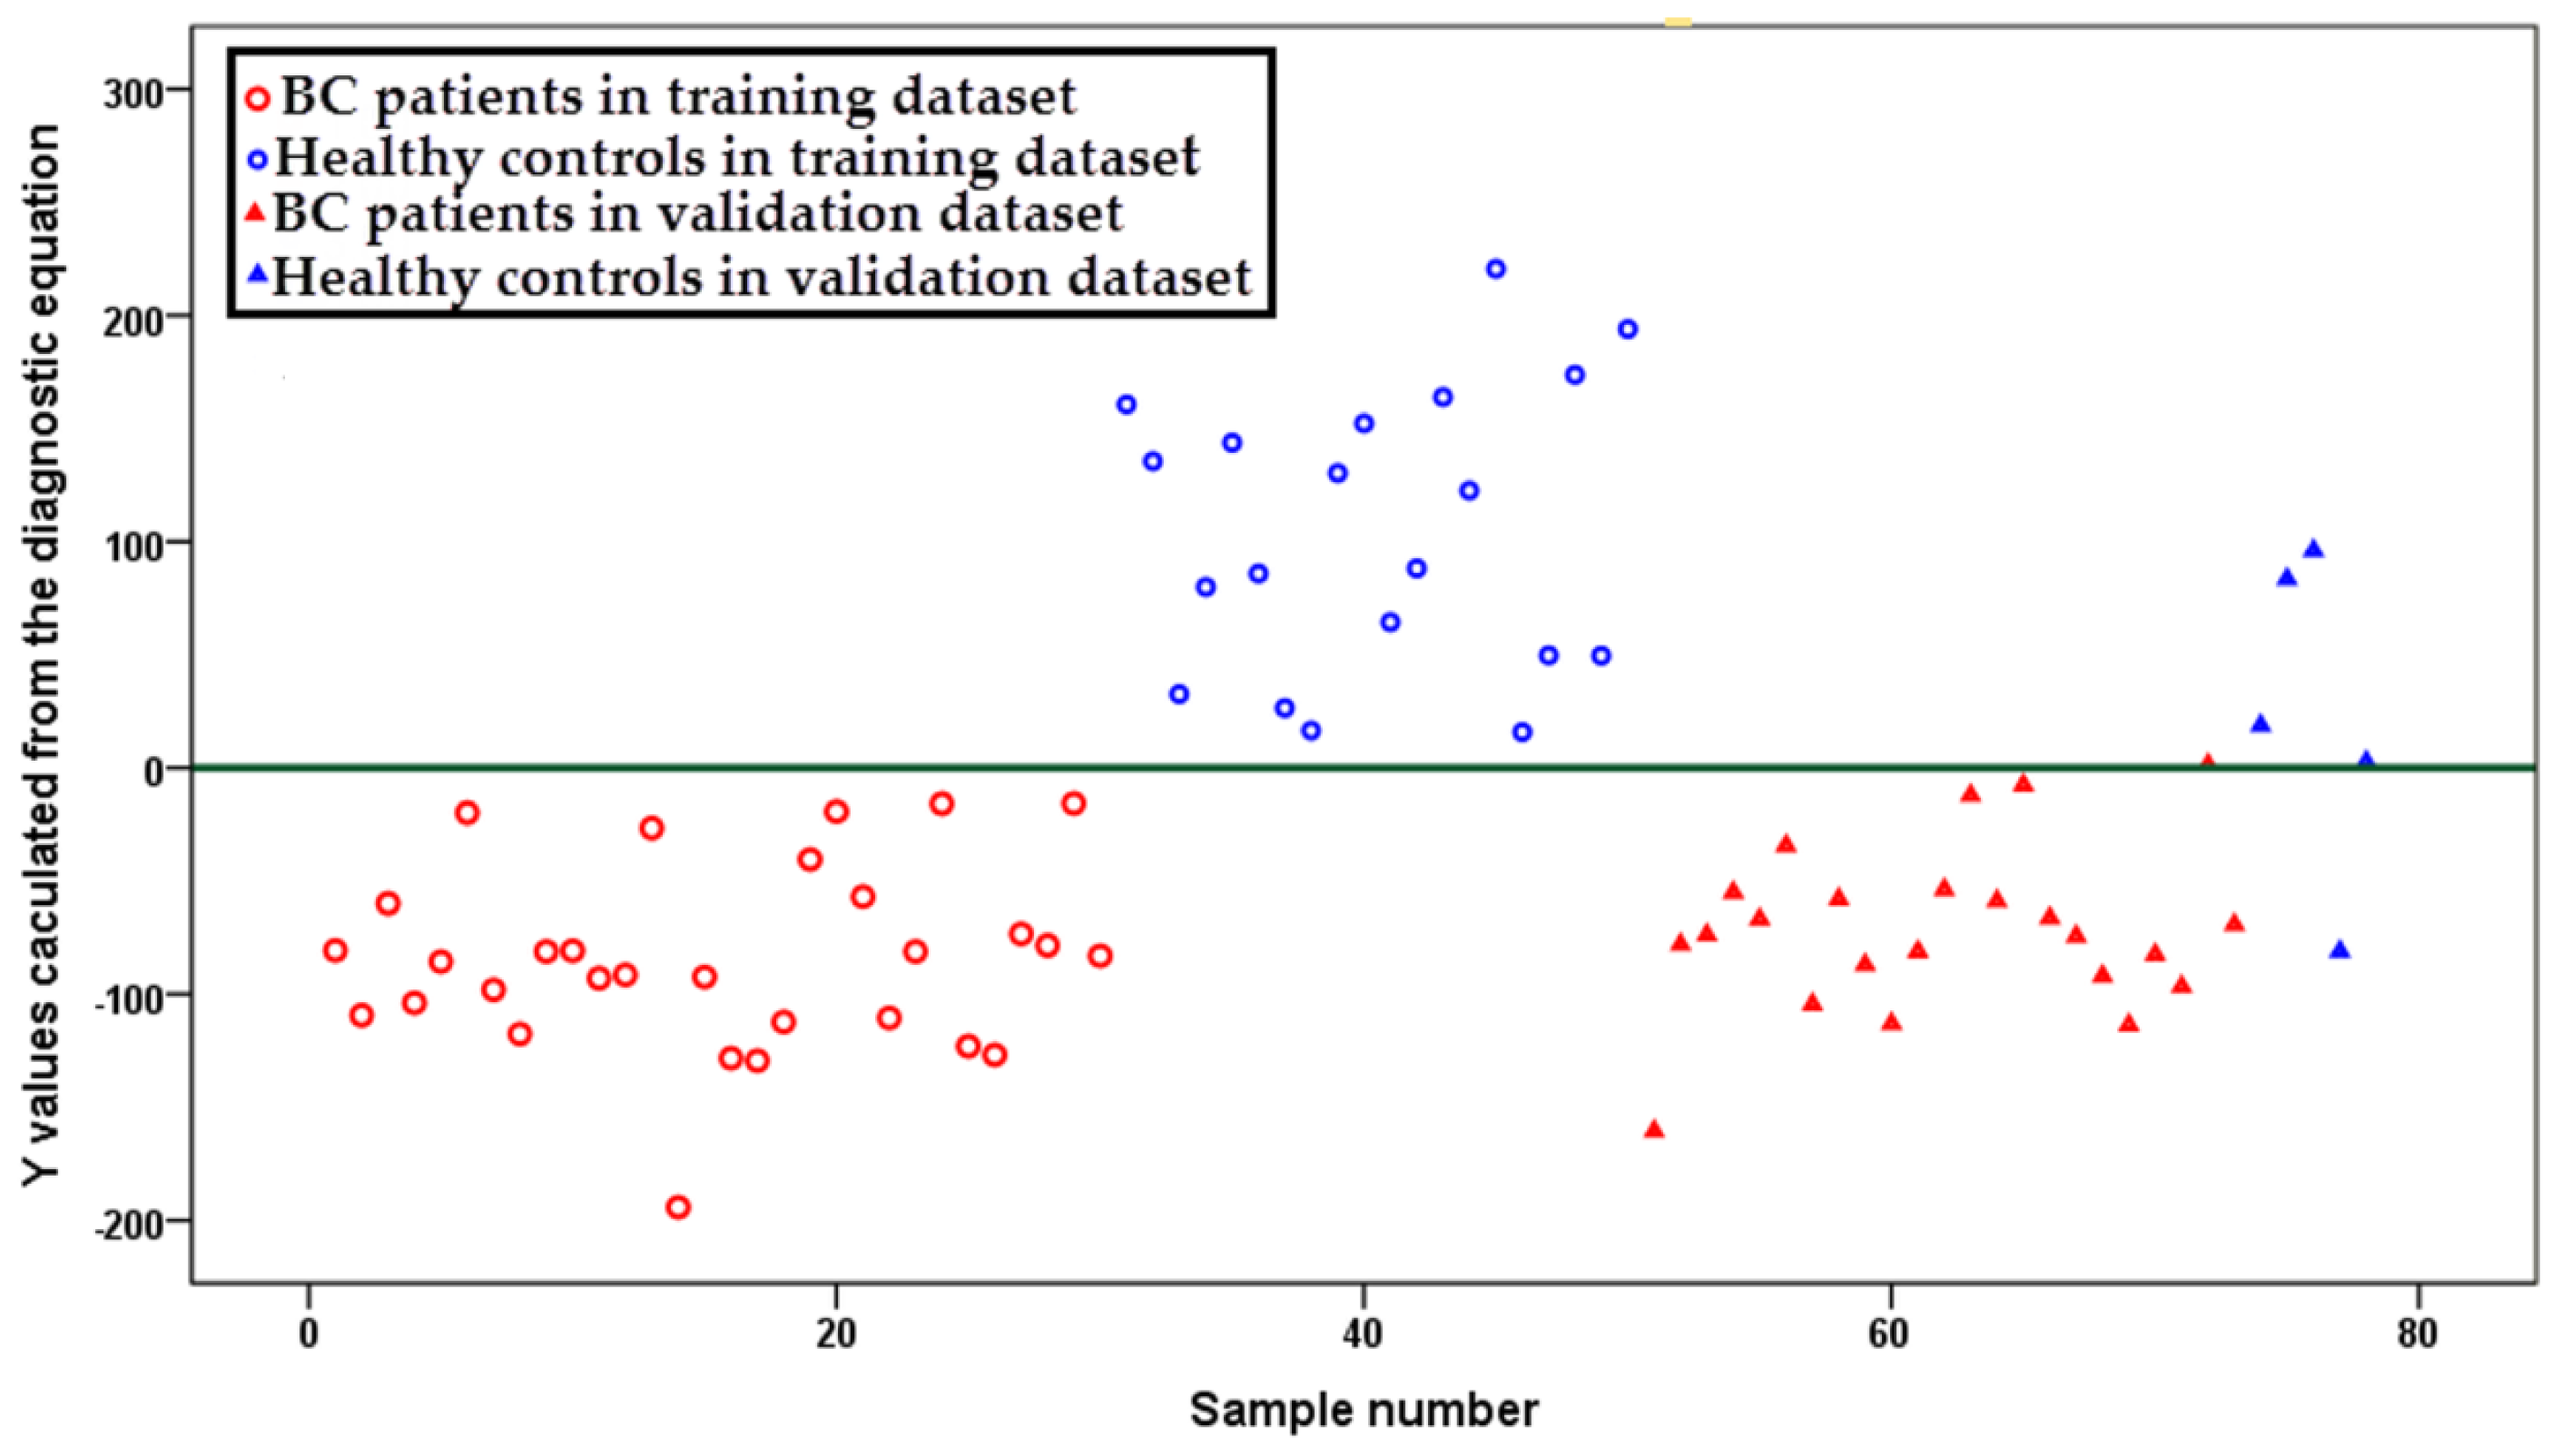
2.3. Diagnostic Equation
2.4. Phosphatidylcholines
2.5. Lysophosphatidylcholines
2.6. Acylcarnitines
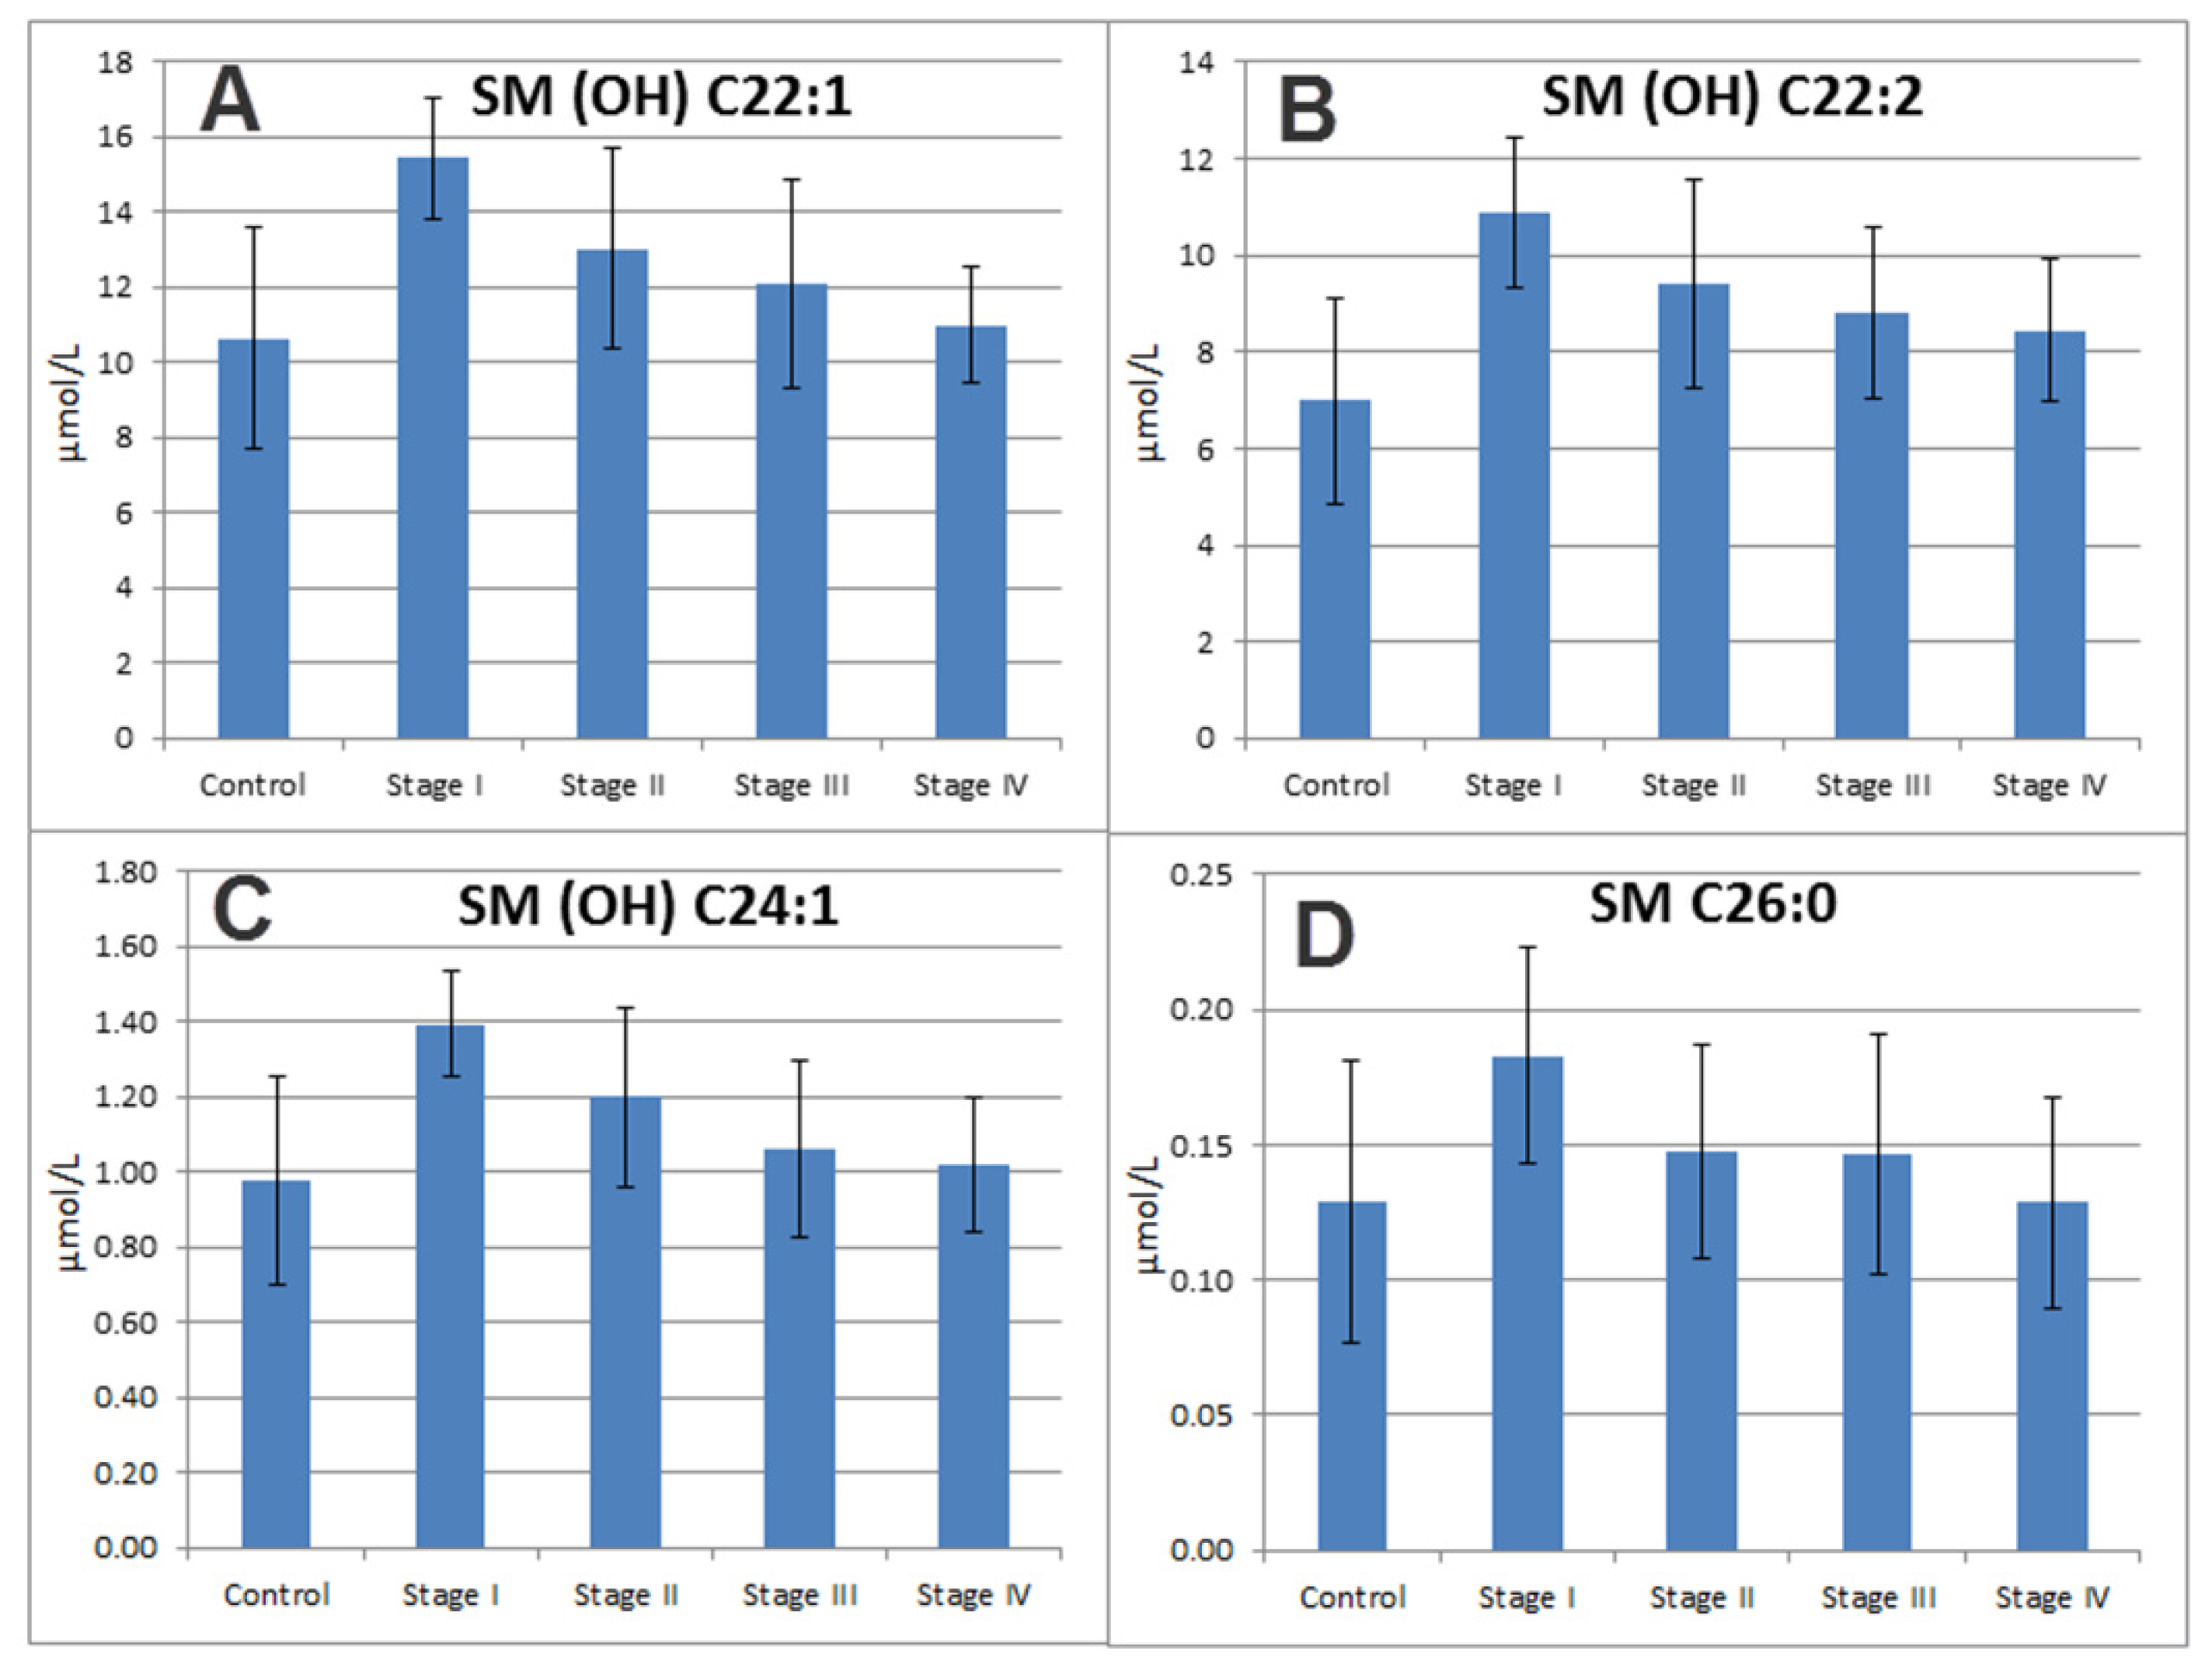
2.7. Sphingomyelins
3. Experimental Section
3.1. Sample Information
3.2. Sample Treatment and Metabolite Analysis
3.3. Data Analysis
4. Conclusions
Conflict of Interest
References
- Siegel, R.; Naishadham, D.; Jemal, A. Cancer statistics, 2012. CA Cancer J. Clin 2012, 62, 10–29. [Google Scholar]
- Stotter, A.T.; McNeese, M.D.; Ames, F.C.; Oswald, M.J.; Ellerbroek, N.A. Predicting the rate and extent of locoregional failure after breast conservation therapy for early breast cancer. Cancer 1989, 64, 2217–2225. [Google Scholar]
- U.S. Preventive Services Task Force. Screening for breast cancer: Recommendations and rationale. Ann. Intern. Med 2002, 137, 344–346.
- Warner, E. Breast-Cancer Screening. N. Engl. J. Med 2011, 365, 1025–1032. [Google Scholar]
- Astley, S.M. Computer-based detection and prompting of mammographic abnormalities. Br. J. Radiol 2004, 77, S194–S200. [Google Scholar]
- Li, J.; Zhang, Z.; Rosenzweig, J.; Wang, Y.Y.; Chan, D.W. Proteomics and bioinformatics approaches for identification of serum biomarkers to detect breast cancer. Clin. Chem 2002, 48, 1296–1304. [Google Scholar]
- Misek, D.E.; Kim, E.H. Protein biomarkers for the early detection of breast cancer. Int. J. Proteomics 2011, 2011, 343582. [Google Scholar]
- Chan, D.W.; Beveridge, R.A.; Muss, H.; Fritsche, H.A.; Hortobagyi, G.; Theriault, R.; Kiang, D.; Kennedy, B.J.; Evelegh, M. Use of Truquant BR radioimmunoassay for early detection of breast cancer recurrence in patients with stage II and stage III disease. J. Clin. Oncol 1997, 15, 2322–2328. [Google Scholar]
- Vander Heiden, M.G. Targeting cancer metabolism: A therapeutic window opens. Nat. Rev. Drug Discov 2011, 10, 671–684. [Google Scholar]
- Qiu, Y.P.; Cai, G.X.; Su, M.M.; Chen, T.L.; Zheng, X.J.; Xu, Y.; Ni, Y.; Zhao, A.H.; Xu, L.X.; Cai, S.J.; et al. Serum metabolite profiling of human colorectal cancer using GC-TOFMS and UPLC-QTOFMS. J. Proteome Res 2009, 8, 4844–4850. [Google Scholar]
- Chen, T.; Xie, G.; Wang, X.; Fan, J.; Qiu, Y.; Zheng, X.; Qi, X.; Cao, Y.; Su, M.; Xu, L.X.; et al. Serum and urine metabolite profiling reveals potential biomarkers of human hepatocellular carcinoma. Mol. Cell. Proteomics 2011, 10. [Google Scholar] [CrossRef]
- Cao, M.D.; Giskeodegard, G.F.; Bathen, T.F.; Sitter, B.; Bofin, A.; Lonning, P.E.; Lundgren, S.; Gribbestad, I.S. Prognostic value of metabolic response in breast cancer patients receiving neoadjuvant chemotherapy. BMC Cancer 2012, 12, 39. [Google Scholar] [Green Version]
- Vermeer, L.S.; Fruhwirth, G.O.; Pandya, P.; Ng, T.; Mason, A.J. NMR metabolomics of MTLn3E breast cancer cells identifies a role for CXCR4 in lipid and choline regulation. J. Proteome Res 2012, 11, 2996–3003. [Google Scholar]
- Martineau, E.; Tea, I.; Akoka, S.; Giraudeau, P. Absolute quantification of metabolites in breast cancer cell extracts by quantitative 2D (1) H INADEQUATE NMR. NMR Biomed 2012, 25, 985–992. [Google Scholar]
- Hilvo, M.; Denkert, C.; Lehtinen, L.; Muller, B.; Brockmoller, S.; Seppanen-Laakso, T.; Budczies, J.; Bucher, E.; Yetukuri, L.; Castillo, S.; et al. Novel theranostic opportunities offered by characterization of altered membrane lipid metabolism in breast cancer progression. Cancer Res 2011, 71, 3236–3245. [Google Scholar]
- Hasija, K.; Bagga, H.K. Alterations of serum cholesterol and serum lipoprotein in breast cancer of women. Indian J. Clin. Biochem 2005, 20, 61–66. [Google Scholar]
- Franky Dhaval, S.; Shilin Nandubhai, S.; Pankaj Manubhai, S.; Patel, H.R.; Prabhudas Shankerbhai, P. Significance of alterations in plasma lipid profile levels in breast cancer. Integr. Cancer Ther 2008, 7, 33–41. [Google Scholar]
- Cummings, B.S.; McHowat, J.; Schnellmann, R.G. Phospholipase A2s in cell injury and death. J. Pharmacol. Exp. Ther 2000, 294, 793–799. [Google Scholar]
- Dong, Q.; Patel, M.; Scott, K.F.; Graham, G.G.; Russell, P.J.; Sved, P. Oncogenic action of phospholipase A2 in prostate cancer. Cancer Lett 2006, 240, 9–16. [Google Scholar]
- Laye, J.P.; Gill, J.H. Phospholipase A2 expression in tumours: A target for therapeutic intervention? Drug Discov. Today 2003, 8, 710–716. [Google Scholar]
- Yamashita, S.; Yamashita, J.; Sakamoto, K.; Inada, K.; Nakashima, Y.; Murata, K.; Saishoji, T.; Nomura, K.; Ogawa, M. Increased expression of membrane-associated phospholipase A2 shows malignant potential of human breast cancer cells. Cancer 1993, 71, 3058–3064. [Google Scholar]
- Yamashita, J.; Ogawa, M.; Sakai, K. Prognostic significance of three novel biologic factors in a clinical trial of adjuvant therapy for node-negative breast cancer. Surgery 1995, 117, 601–608. [Google Scholar]
- Denizot, Y.; de Armas, R.; Caire, F.; Pommepuy, I.; Truffinet, V.; Labrousse, F. Platelet-activating factor and human meningiomas. Neuropathol. Appl. Neurobiol 2006, 32, 674–678. [Google Scholar]
- Aoki, J. Mechanisms of lysophosphatidic acid production. Semin. Cell Dev. Biol 2004, 15, 477–489. [Google Scholar]
- Cuendet, M.; Pezzuto, J.M. The role of cyclooxygenase and lipoxygenase in cancer chemoprevention. Drug Metabol. Drug Interact 2000, 17, 109–157. [Google Scholar]
- Meyer, A.M.; Dwyer-Nield, L.D.; Hurteau, G.J.; Keith, R.L.; O’Leary, E.; You, M.; Bonventre, J.V.; Nemenoff, R.A.; Malkinson, A.M. Decreased lung tumorigenesis in mice genetically deficient in cytosolic phospholipase A2. Carcinogenesis 2004, 25, 1517–1524. [Google Scholar]
- Cummings, B.S. Phospholipase A2 as targets for anti-cancer drugs. Biochem. Pharmacol 2007, 74, 949–959. [Google Scholar]
- Bougnoux, P.; Chajes, V.; Lanson, M.; Hacene, K.; Body, G.; Couet, C.; Le Floch, O. Prognostic significance of tumor phosphatidylcholine stearic acid level in breast carcinoma. Breast Cancer Res. Treat 1992, 20, 185–194. [Google Scholar]
- Abel, S.; De Kock, M.; van Schalkwyk, D.J.; Swanevelder, S.; Kew, M.C.; Gelderblom, W.C. Altered lipid profile, oxidative status and hepatitis B virus interactions in human hepatocellular carcinoma. Prostaglandins Leukot. Essent Fatty Acids 2009, 81, 391–399. [Google Scholar]
- Taylor, L.A.; Arends, J.; Hodina, A.K.; Unger, C.; Massing, U. Plasma lyso-phosphatidylcholine concentration is decreased in cancer patients with weight loss and activated inflammatory status. Lipids Health Dis. 2007, 6. [Google Scholar] [CrossRef]
- Xie, Y.; Meier, K.E. Lysophospholipase D and its role in LPA production. Cell Signal 2004, 16, 975–981. [Google Scholar]
- Umezu-Goto, M.; Kishi, Y.; Taira, A.; Hama, K.; Dohmae, N.; Takio, K.; Yamori, T.; Mills, G.B.; Inoue, K.; Aoki, J.; et al. Autotaxin has lysophospholipase D activity leading to tumor cell growth and motility by lysophosphatidic acid production. J. Cell Biol 2002, 158, 227–233. [Google Scholar]
- Liu, S.; Umezu-Goto, M.; Murph, M.; Lu, Y.; Liu, W.; Zhang, F.; Yu, S.; Stephens, L.C.; Cui, X.; Murrow, G.; et al. Expression of autotaxin and lysophosphatidic acid receptors increases mammary tumorigenesis, invasion, and metastases. Cancer Cell 2009, 15, 539–550. [Google Scholar]
- Liu, Y. Fatty acid oxidation is a dominant bioenergetic pathway in prostate cancer. Prostate Cancer Prostatic Dis 2006, 9, 230–234. [Google Scholar]
- Nomura, D.K.; Long, J.Z.; Niessen, S.; Hoover, H.S.; Ng, S.W.; Cravatt, B.F. Monoacylglycerol lipase regulates a fatty acid network that promotes cancer pathogenesis. Cell 2010, 140, 49–61. [Google Scholar]
- Zhang, F.; Du, G. Dysregulated lipid metabolism in cancer. World J. Biol. Chem 2012, 3, 167–174. [Google Scholar]
- Ganti, S.; Taylor, S.L.; Kim, K.; Hoppel, C.L.; Guo, L.; Yang, J.; Evans, C.; Weiss, R.H. Urinary acylcarnitines are altered in human kidney cancer. Int. J. Cancer 2012, 130, 2791–2800. [Google Scholar]
- Ullman, M.D.; Radin, N.S. The enzymatic formation of sphingomyelin from ceramide and lecithin in mouse liver. J. Biol. Chem 1974, 249, 1506–1512. [Google Scholar]
- Hannun, Y.A. The sphingomyelin cycle and the second messenger function of ceramide. J. Biol. Chem 1994, 269, 3125–3128. [Google Scholar]
- Ogretmen, B.; Hannun, Y.A. Biologically active sphingolipids in cancer pathogenesis and treatment. Nat. Rev. Cancer 2004, 4, 604–616. [Google Scholar]
- Pettus, B.J.; Chalfant, C.E.; Hannun, Y.A. Ceramide in apoptosis: An overview and current perspectives. Biochim. Biophys. Acta 2002, 1585, 114–125. [Google Scholar]
- Schiffmann, S.; Sandner, J.; Birod, K.; Wobst, I.; Angioni, C.; Ruckhaberle, E.; Kaufmann, M.; Ackermann, H.; Lotsch, J.; Schmidt, H.; et al. Ceramide synthases and ceramide levels are increased in breast cancer tissue. Carcinogenesis 2009, 30, 745–752. [Google Scholar]
- Pyne, N.J.; Pyne, S. Sphingosine 1-phosphate and cancer. Nat. Rev. Cancer 2010, 10, 489–503. [Google Scholar]
- Nagahashi, M.; Ramachandran, S.; Kim, E.Y.; Allegood, J.C.; Rashid, O.M.; Yamada, A.; Zhao, R.; Milstien, S.; Zhou, H.; Spiegel, S.; et al. Sphingosine-1-phosphate produced by sphingosine kinase 1 promotes breast cancer progression by stimulating angiogenesis and lymphangiogenesis. Cancer Res 2012, 72, 726–735. [Google Scholar]
- Hama, H. Fatty acid 2-Hydroxylation in mammalian sphingolipid biology. Biochim. Biophys. Acta 2010, 1801, 405–414. [Google Scholar]
- Alderson, N.L.; Hama, H. Fatty acid 2-hydroxylase regulates cAMP-induced cell cycle exit in D6P2T schwannoma cells. J. Lipid Res 2009, 50, 1203–1208. [Google Scholar]
- Jansson, J.; Willing, B.; Lucio, M.; Fekete, A.; Dicksved, J.; Halfvarson, J.; Tysk, C.; Schmitt-Kopplin, P. Metabolomics reveals metabolic biomarkers of Crohn’s disease. PLoS One 2009, 4, e6386. [Google Scholar]
- Pike, N. Using false discovery rates for multiple comparisons in ecology and evolution. Methods Ecol. Evol 2011, 2, 278–282. [Google Scholar]
- Nigam, S.; Muller, S.; Benedetto, C. Elevated plasma levels of platelet-activating factor (PAF) in breast cancer patients with hypercalcemia. J. Lipid Mediat 1989, 1, 323–328. [Google Scholar]

| NO | Metabolites | Classes | VIP a | FC b | p-value c | q-value d |
|---|---|---|---|---|---|---|
| 1 | PC ae C40:3 | Phosphatidylcholines | 2.31 | −4.24 | 2.79 × 10⁻¹⁰ | 1.36 × 10⁻⁸ |
| 2 | PC aa C42:4 | Phosphatidylcholines | 2.09 | −1.96 | 4.87 × 10⁻⁸ | 9.73 × 10⁻⁷ |
| 3 | PC ae C38:3 | Phosphatidylcholines | 2.09 | −2.15 | 5.16 × 10⁻⁸ | 9.73 × 10⁻⁷ |
| 4 | PC ae C40:4 | Phosphatidylcholines | 2.08 | −1.93 | 5.33 × 10⁻⁸ | 9.73 × 10⁻⁷ |
| 5 | PC ae C38:1 | Phosphatidylcholines | 2.05 | −72.18 | 1.16 × 10⁻⁷ | 1.82 × 10⁻⁶ |
| 6 | PC ae C42:4 | Phosphatidylcholines | 1.88 | −1.63 | 2.08 × 10⁻⁶ | 2.76 × 10⁻⁵ |
| 7 | PC ae C40:5 | Phosphatidylcholines | 1.86 | −1.63 | 2.73 × 10⁻⁶ | 3.32 × 10⁻⁵ |
| 8 | PC ae C42:5 | Phosphatidylcholines | 1.83 | −1.44 | 4.68 × 10⁻⁶ | 5.25 × 10⁻⁵ |
| 9 | PC aa C40:2 | Phosphatidylcholines | 1.82 | −2.24 | 5.63 × 10⁻⁶ | 5.87 × 10⁻⁵ |
| 10 | PC ae C44:3 | Phosphatidylcholines | 1.78 | −1.63 | 9.07 × 10⁻⁶ | 8.83 × 10⁻⁵ |
| 11 | PC ae C38:2 | Phosphatidylcholines | 1.67 | −1.84 | 4.31 × 10⁻⁵ | 3.93 × 10⁻⁴ |
| 12 | PC ae C42:1 | Phosphatidylcholines | 1.66 | −1.63 | 4.69 × 10⁻⁵ | 4.02 × 10⁻⁴ |
| 13 | PC aa C40:3 | Phosphatidylcholines | 1.65 | −1.62 | 5.43 × 10⁻⁵ | 4.40 × 10⁻⁴ |
| 14 | PC ae C36:2 | Phosphatidylcholines | 1.56 | 1.39 | 1.64 × 10⁻⁴ | 1.14 × 10⁻³ |
| 15 | PC aa C38:6 | Phosphatidylcholines | 1.48 | 1.46 | 3.64 × 10⁻⁴ | 2.21 × 10⁻³ |
| 16 | PC ae C40:6 | Phosphatidylcholines | 1.36 | 1.31 | 1.22 × 10⁻³ | 7.10 × 10⁻³ |
| 17 | PC aa C38:0 | Phosphatidylcholines | 1.31 | 1.44 | 1.92 × 10⁻³ | 1.08 × 10⁻² |
| 18 | PC ae C34:2 | Phosphatidylcholines | 1.26 | 1.33 | 2.89 × 10⁻³ | 1.51 × 10⁻² |
| 19 | PC aa C40:6 | Phosphatidylcholines | 1.26 | 1.36 | 2.90 × 10⁻³ | 1.51 × 10⁻² |
| 20 | PC ae C40:2 | Phosphatidylcholines | 1.17 | −1.32 | 6.22 × 10⁻³ | 2.93 × 10⁻² |
| 21 | PC aa C40:4 | Phosphatidylcholines | 1.16 | −1.38 | 6.71 × 10⁻³ | 2.97 × 10⁻² |
| 22 | PC aa C34:2 | Phosphatidylcholines | 1.14 | 1.19 | 7.98 × 10⁻³ | 3.43 × 10⁻² |
| 23 | PC aa C42:5 | Phosphatidylcholines | 1.13 | −1.32 | 8.63 × 10⁻³ | 3.60 × 10⁻² |
| 24 | lysoPC a C16:0 | Lysophosphatidylcholines | 2.53 | −1.98 | 1.21 × 10⁻¹³ | 1.77 × 10⁻¹¹ |
| 25 | lysoPC a C18:0 | Lysophosphatidylcholines | 2.5 | −2.25 | 4.21 × 10⁻¹³ | 3.08 × 10⁻¹¹ |
| 26 | lysoPC a C20:4 | Lysophosphatidylcholines | 2.2 | −2.14 | 4.04 × 10⁻⁹ | 1.48 × 10⁻⁷ |
| 27 | lysoPC a C18:1 | Lysophosphatidylcholines | 2.11 | −1.88 | 3.30 × 10⁻⁸ | 9.63 × 10⁻⁷ |
| 28 | lysoPC a C17:0 | Lysophosphatidylcholines | 2.04 | −1.73 | 1.25 × 10⁻⁷ | 1.82 × 10⁻⁶ |
| 29 | lysoPC a C20:3 | Lysophosphatidylcholines | 1.6 | −1.63 | 1.03 × 10⁻⁴ | 7.52 × 10⁻⁴ |
| 30 | lysoPC a C28:0 | Lysophosphatidylcholines | 1.16 | −1.23 | 6.63 × 10⁻³ | 2.97 × 10⁻² |
| 31 | lysoPC a C16:1 | Lysophosphatidylcholines | 1.09 | −1.3 | 1.09 × 10⁻² | 4.32 × 10⁻² |
| 32 | lysoPC a C24:0 | Lysophosphatidylcholines | 1.09 | −1.2 | 1.09 × 10⁻² | 4.32 × 10⁻² |
| 33 | lysoPC a C26:0 | Lysophosphatidylcholines | 1.08 | −1.28 | 1.17 × 10⁻² | 4.38 × 10⁻² |
| 34 | SM (OH) C22:2 | Sphingomyelins | 1.62 | 1.38 | 8.26 × 10⁻⁵ | 6.35 × 10⁻⁴ |
| 35 | SM (OH) C14:1 | Sphingomyelins | 1.52 | 1.37 | 2.40 × 10⁻⁴ | 1.59 × 10⁻³ |
| 36 | SM (OH) C16:1 | Sphingomyelins | 1.49 | 1.34 | 3.49 × 10⁻⁴ | 2.21 × 10⁻³ |
| 37 | SM (OH) C22:1 | Sphingomyelins | 1.2 | 1.23 | 5.07 × 10⁻³ | 2.55 × 10⁻² |
| 38 | SM C20:2 | Sphingomyelins | 1.08 | 1.32 | 1.17 × 10⁻² | 4.38 × 10⁻² |
| 39 | C4 | Acylcarnitines | 1.18 | 1.45 | 5.64 × 10⁻³ | 2.74 × 10⁻² |
| Training group | Validation group | |||
|---|---|---|---|---|
| Control (n = 20) | BC (n = 30) | Control (n = 5) | BC (n = 23) | |
| Age (mean, range) | 38.2 (28–40) | 41.3 (25–56) | 34.8 (21–39) | 56.2 (40–67) |
| Stage | ||||
| TNM-I | / | 4 | / | 4 |
| TNM-II | / | 11 | / | 8 |
| TNM-III | / | 11 | / | 7 |
| TNM-IV | / | 4 | / | 4 |
© 2013 by the authors; licensee MDPI, Basel, Switzerland This article is an open access article distributed under the terms and conditions of the Creative Commons Attribution license (http://creativecommons.org/licenses/by/3.0/).
Share and Cite
Qiu, Y.; Zhou, B.; Su, M.; Baxter, S.; Zheng, X.; Zhao, X.; Yen, Y.; Jia, W. Mass Spectrometry-Based Quantitative Metabolomics Revealed a Distinct Lipid Profile in Breast Cancer Patients. Int. J. Mol. Sci. 2013, 14, 8047-8061. https://doi.org/10.3390/ijms14048047
Qiu Y, Zhou B, Su M, Baxter S, Zheng X, Zhao X, Yen Y, Jia W. Mass Spectrometry-Based Quantitative Metabolomics Revealed a Distinct Lipid Profile in Breast Cancer Patients. International Journal of Molecular Sciences. 2013; 14(4):8047-8061. https://doi.org/10.3390/ijms14048047
Chicago/Turabian StyleQiu, Yunping, Bingsen Zhou, Mingming Su, Sarah Baxter, Xiaojiao Zheng, Xueqing Zhao, Yun Yen, and Wei Jia. 2013. "Mass Spectrometry-Based Quantitative Metabolomics Revealed a Distinct Lipid Profile in Breast Cancer Patients" International Journal of Molecular Sciences 14, no. 4: 8047-8061. https://doi.org/10.3390/ijms14048047
APA StyleQiu, Y., Zhou, B., Su, M., Baxter, S., Zheng, X., Zhao, X., Yen, Y., & Jia, W. (2013). Mass Spectrometry-Based Quantitative Metabolomics Revealed a Distinct Lipid Profile in Breast Cancer Patients. International Journal of Molecular Sciences, 14(4), 8047-8061. https://doi.org/10.3390/ijms14048047