Structure and Conformational Dynamics of DMPC/Dicationic Surfactant and DMPC/Dicationic Surfactant/DNA Systems


Abstract
:1. Introduction
2. Results and Discussion
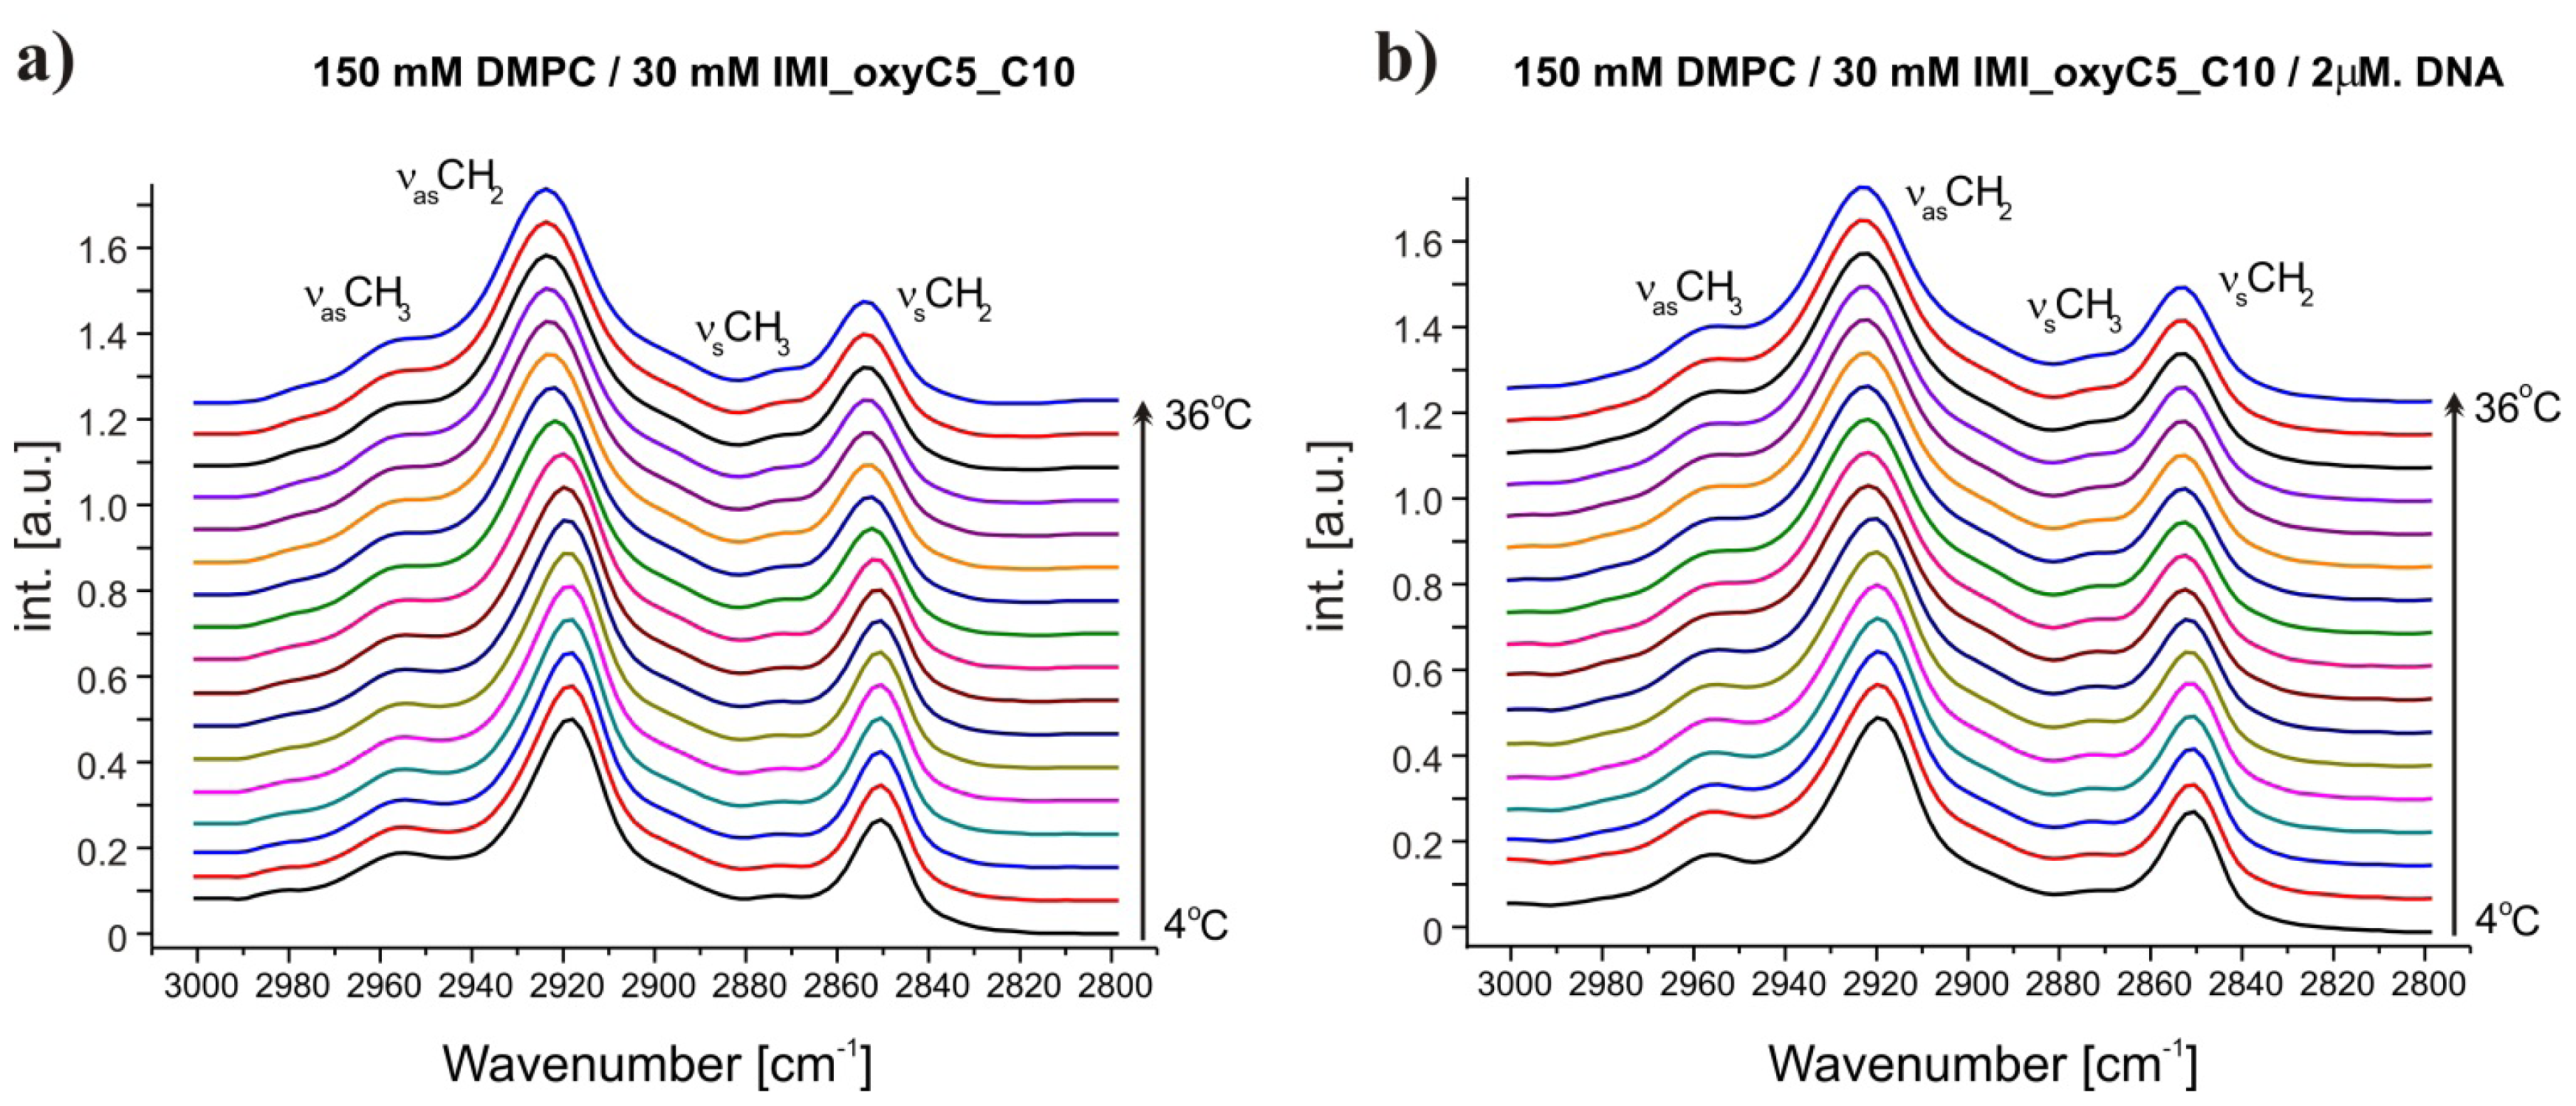
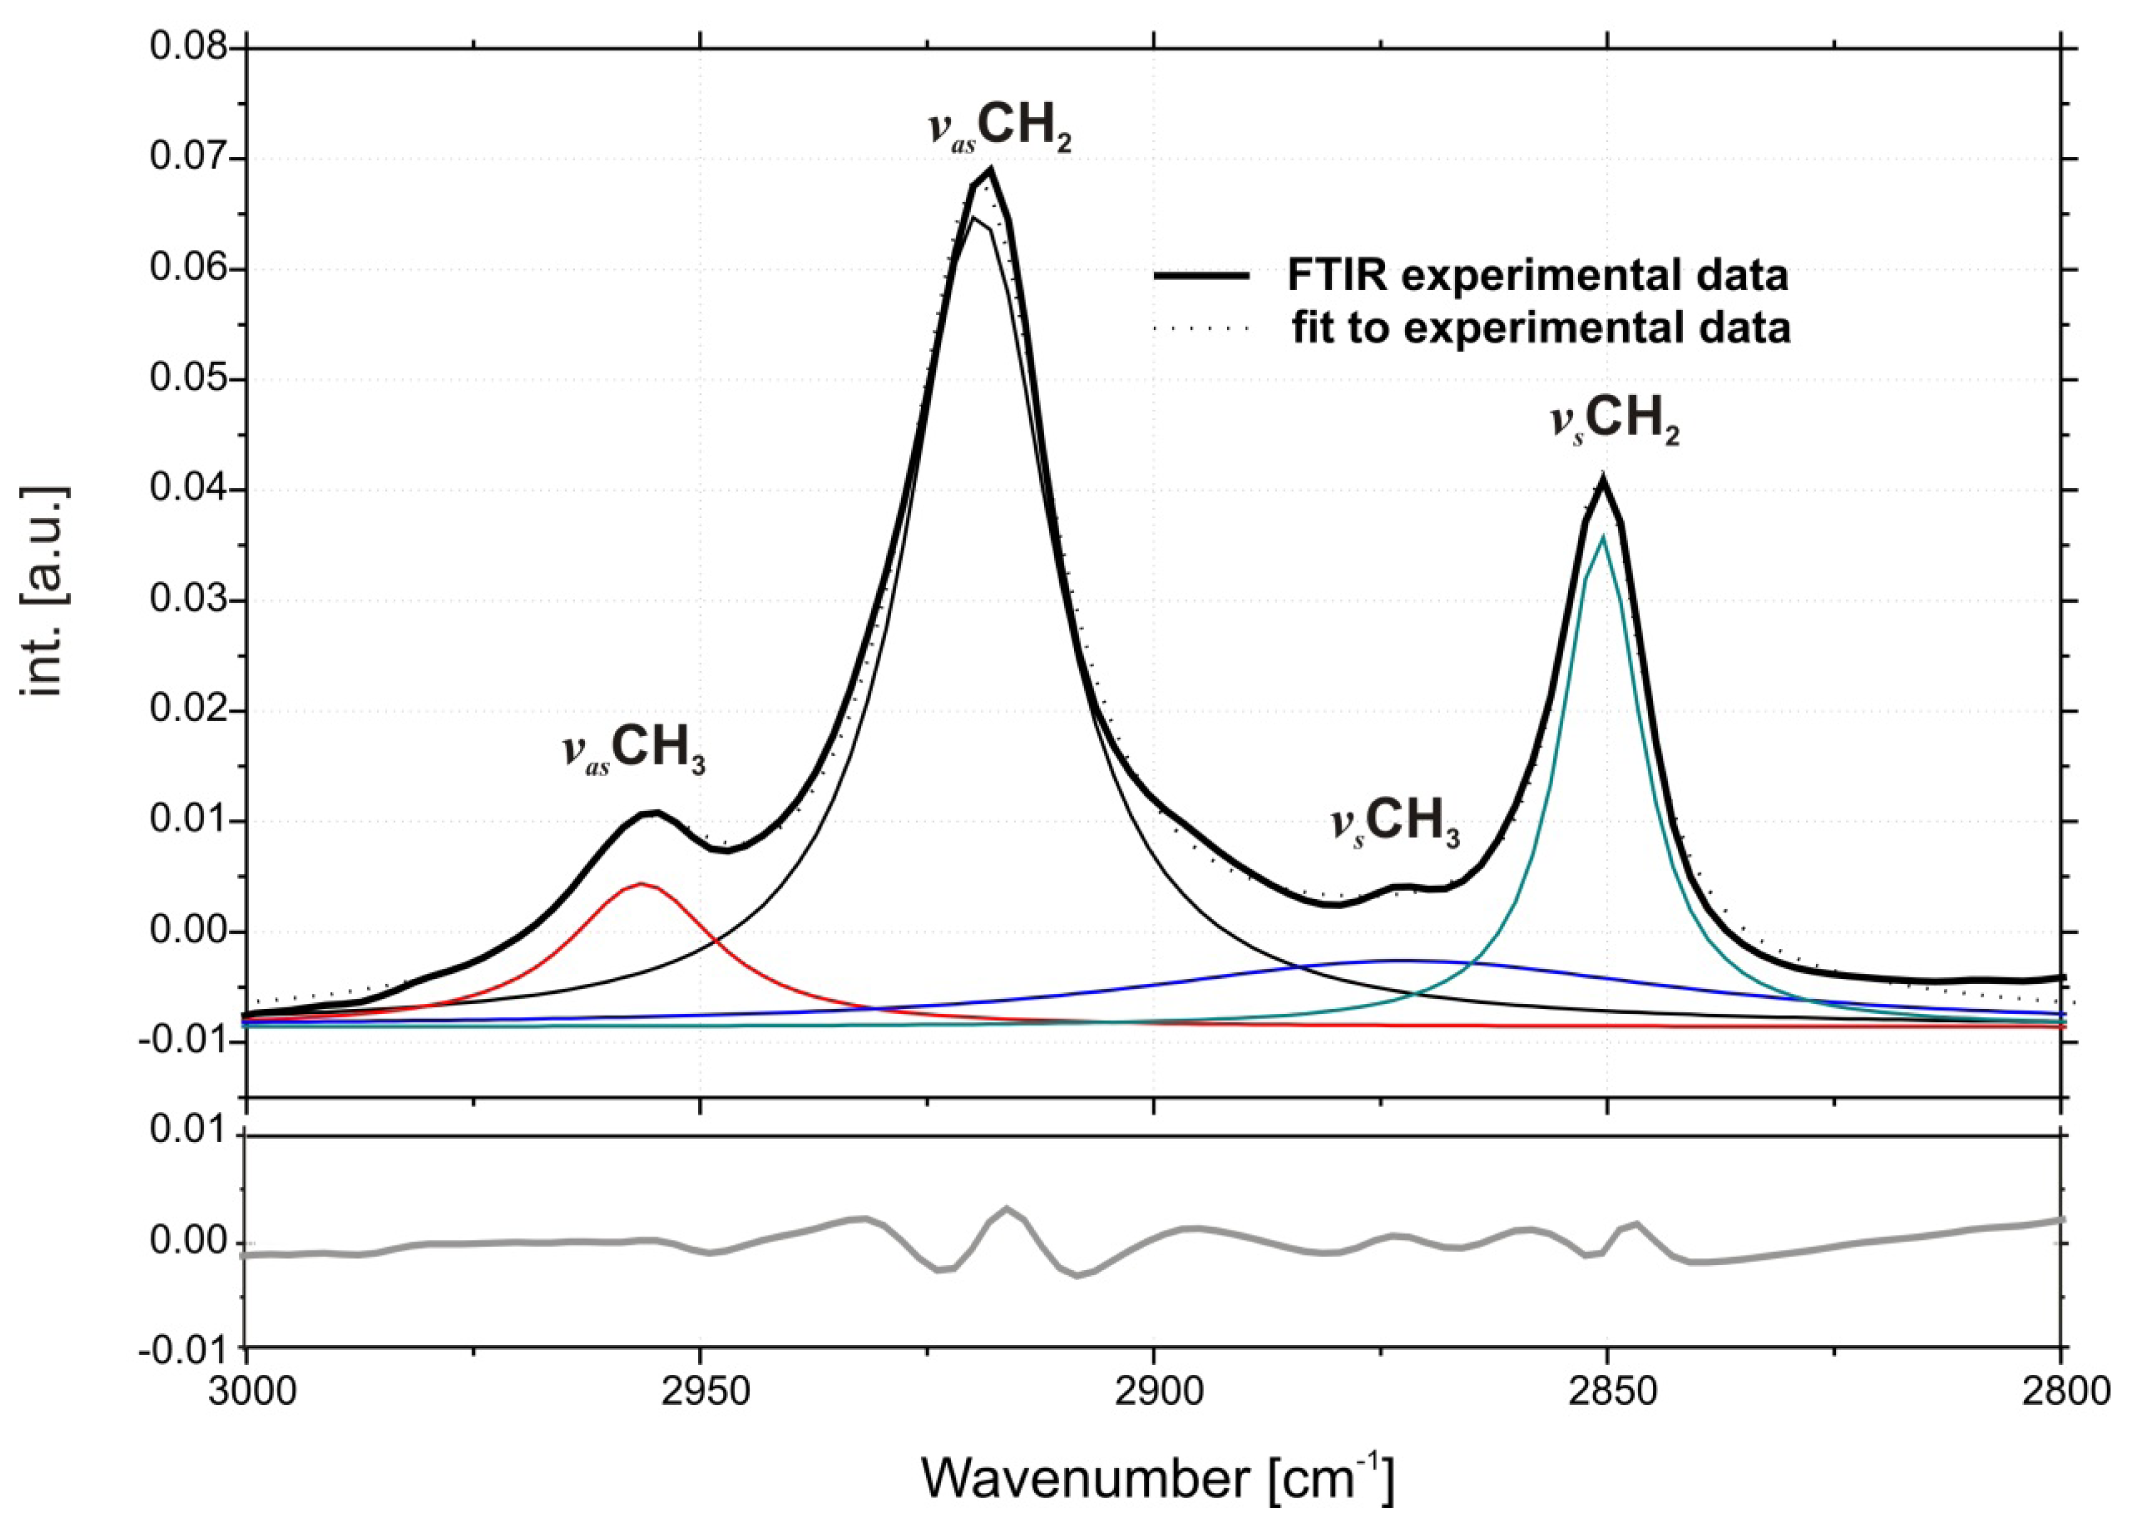
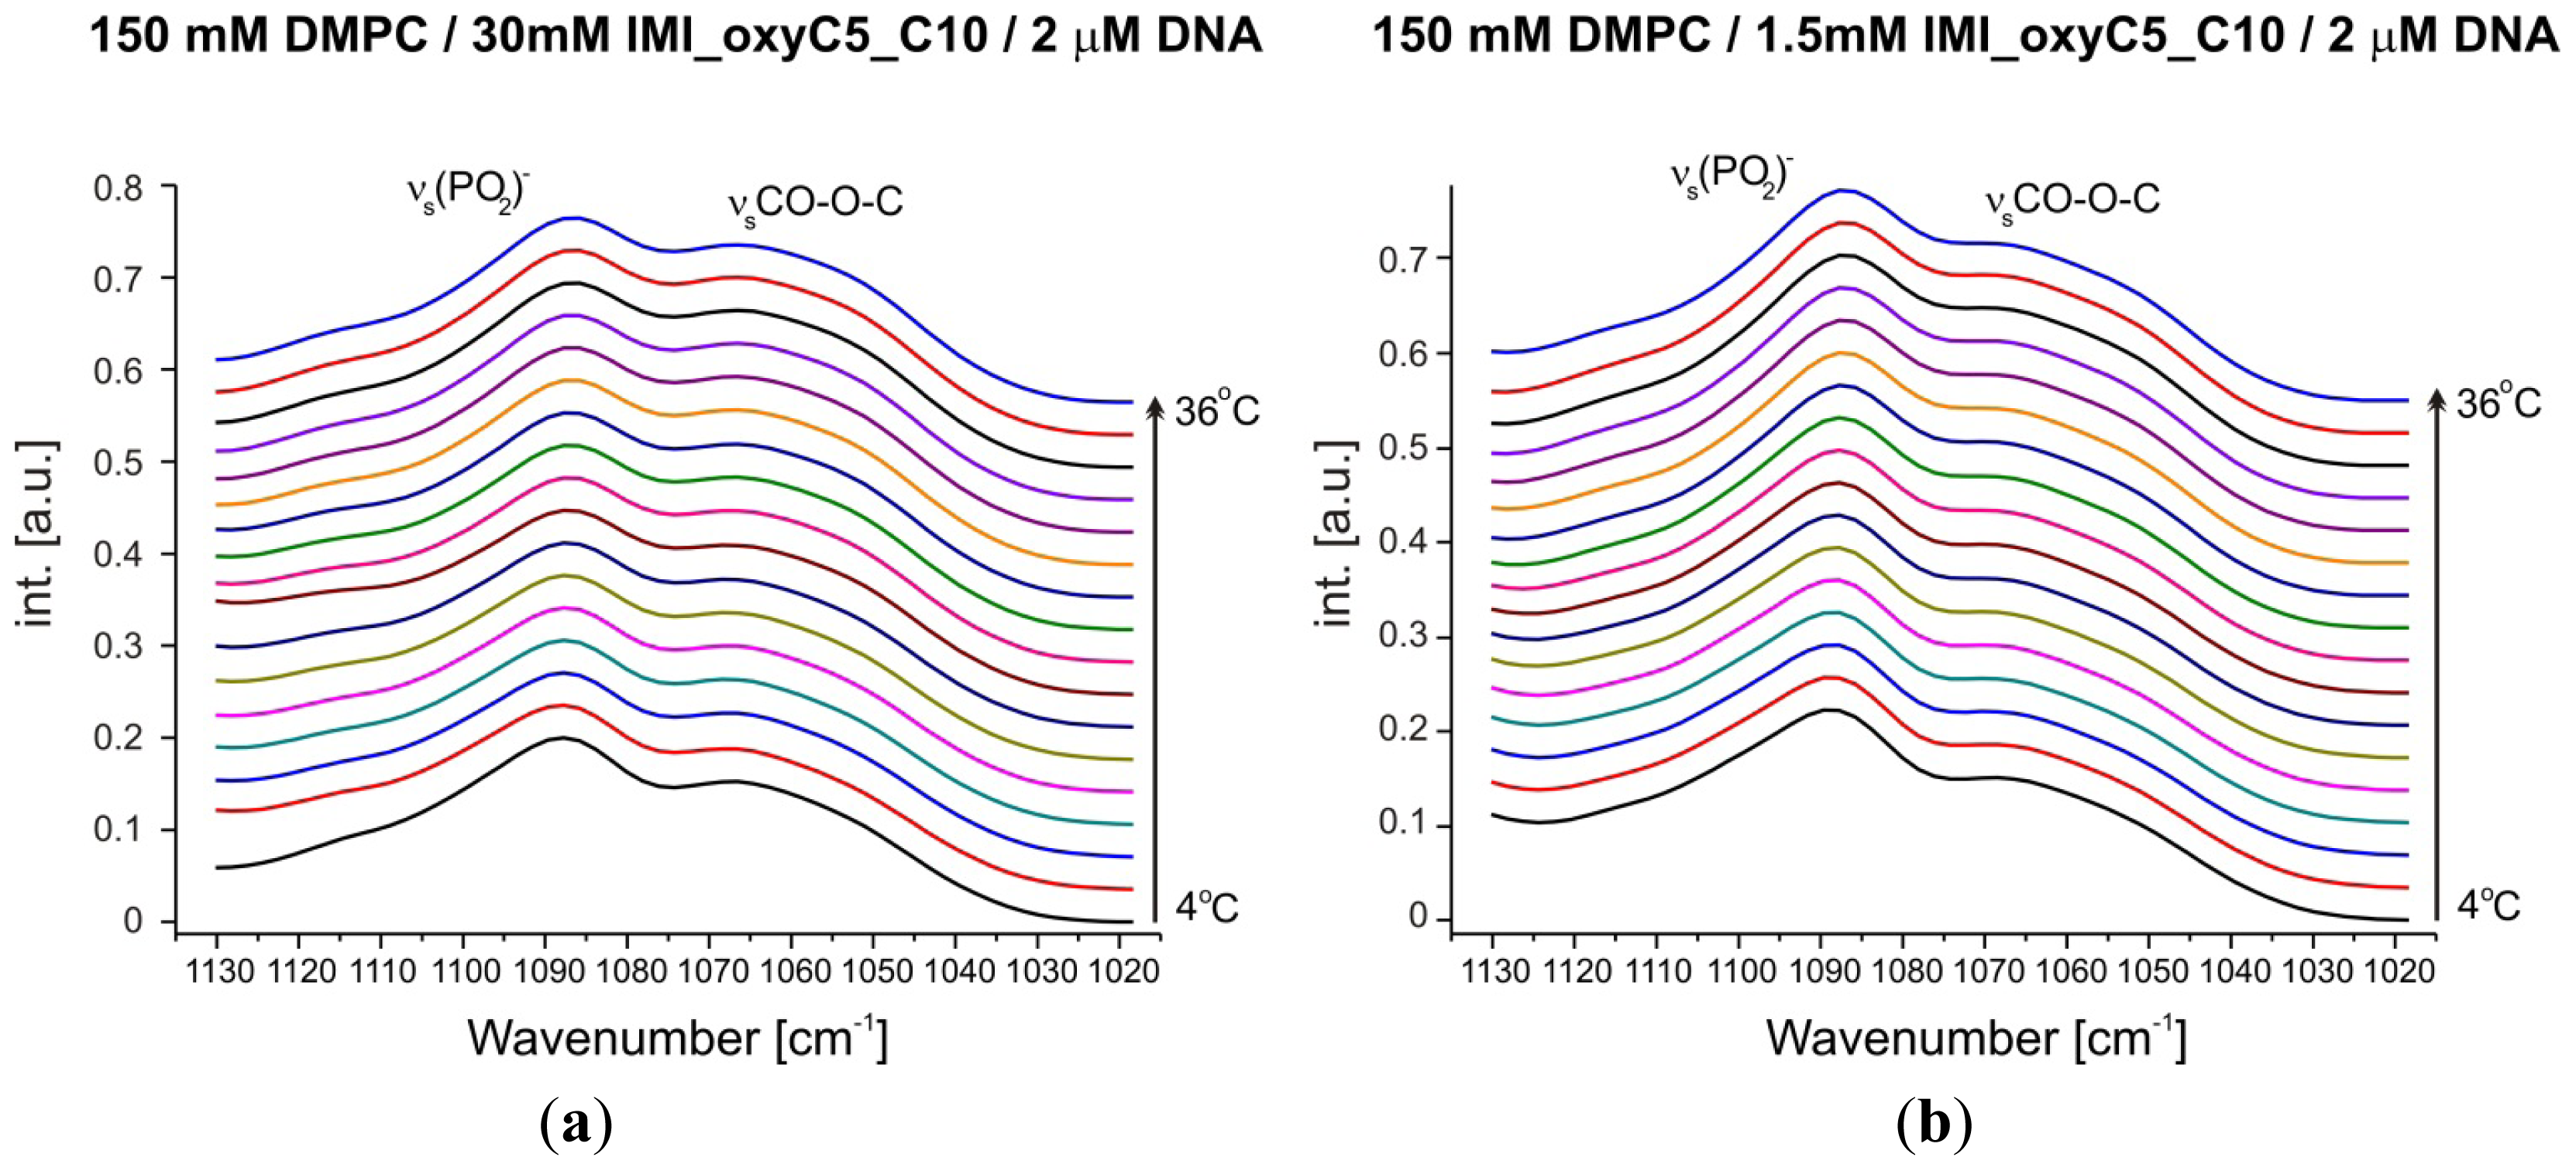
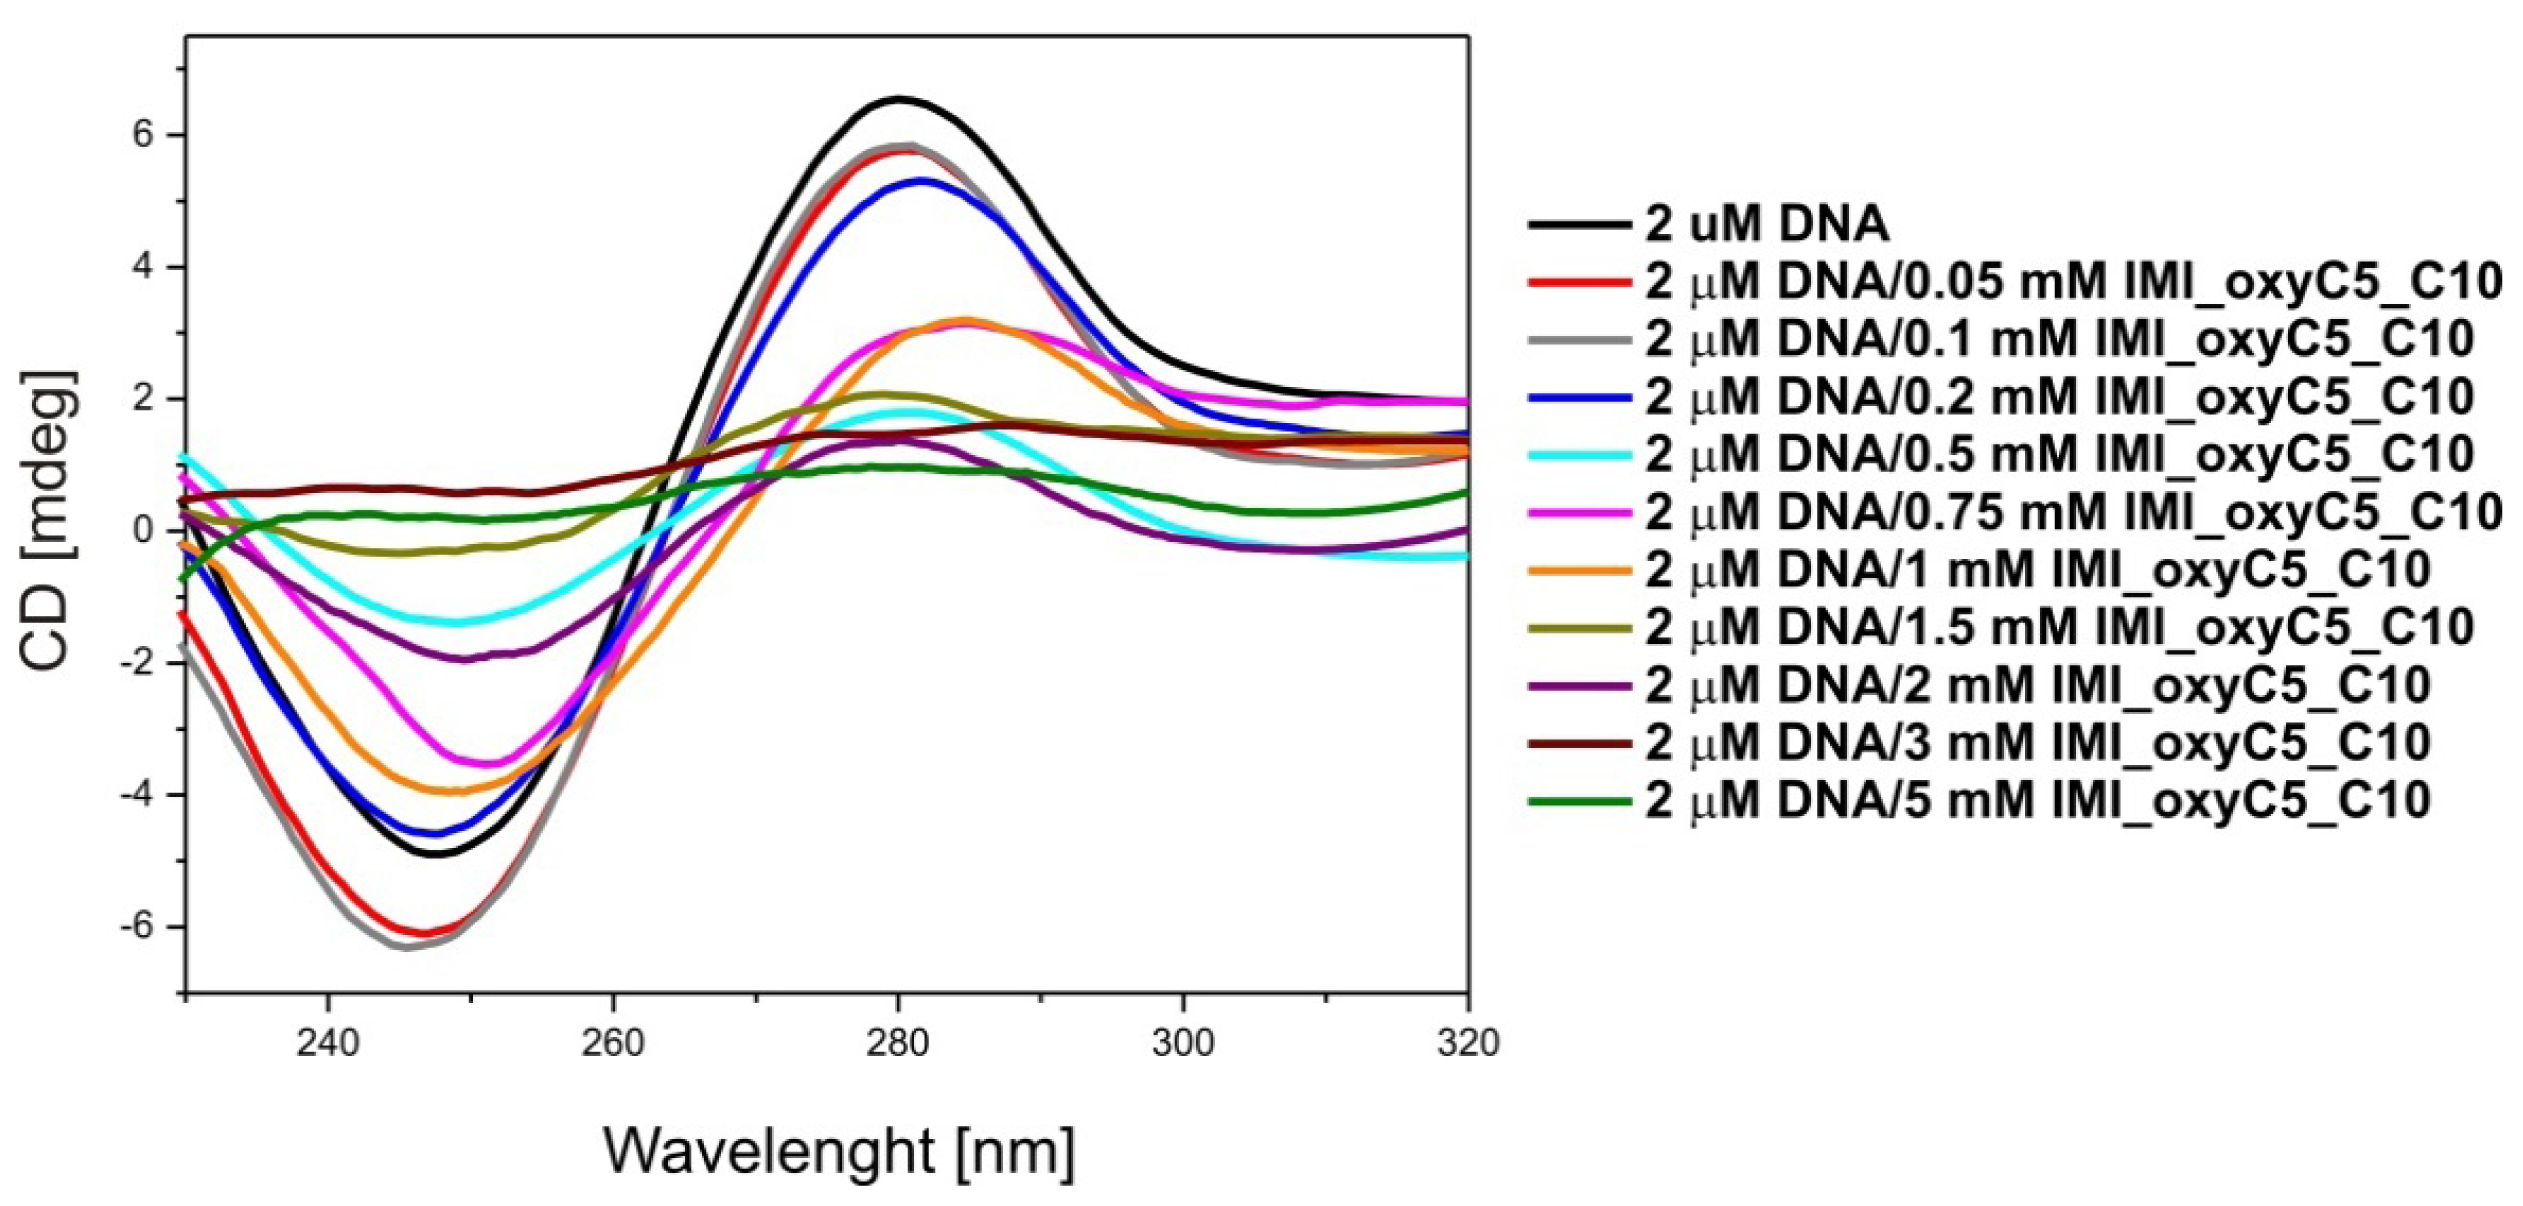
2.1. Conformation of Lipid/Surfactant and Lipid/Surfactant/DNA Complexes
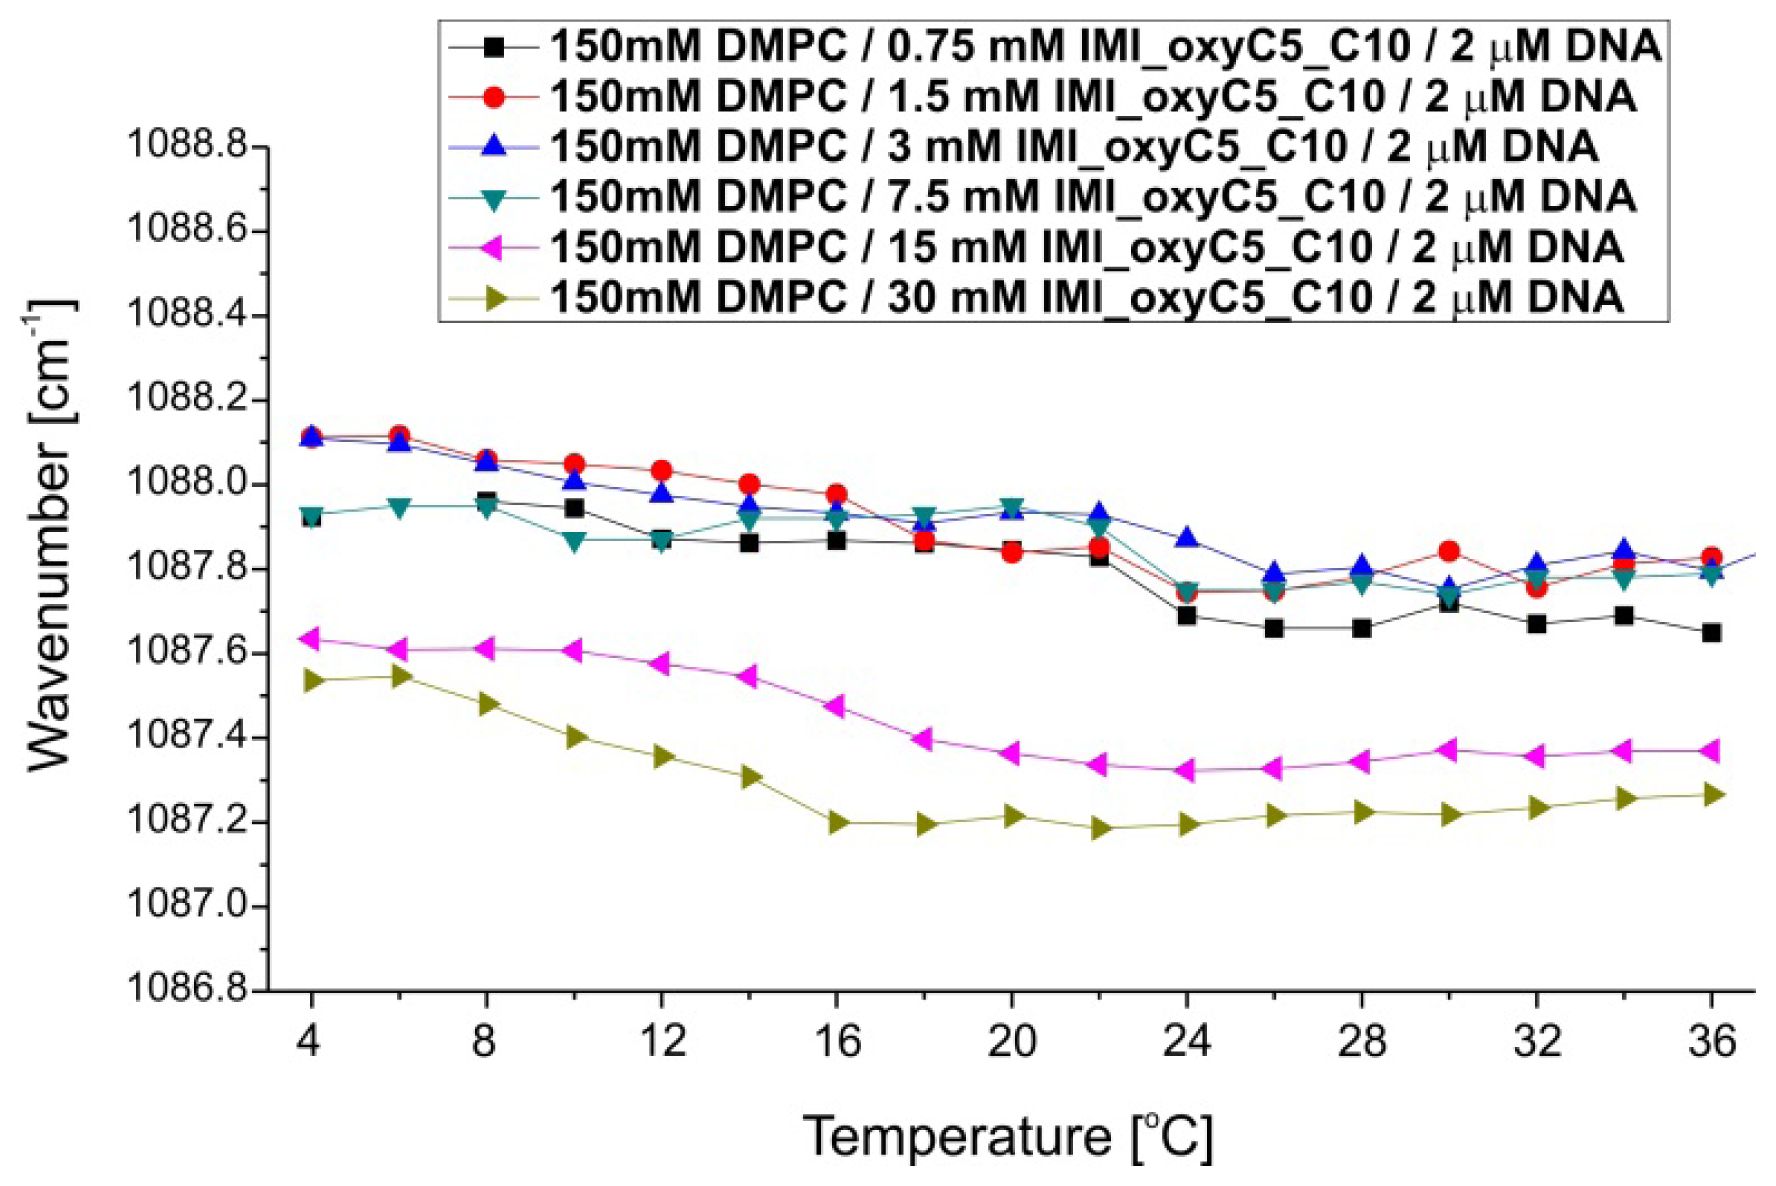
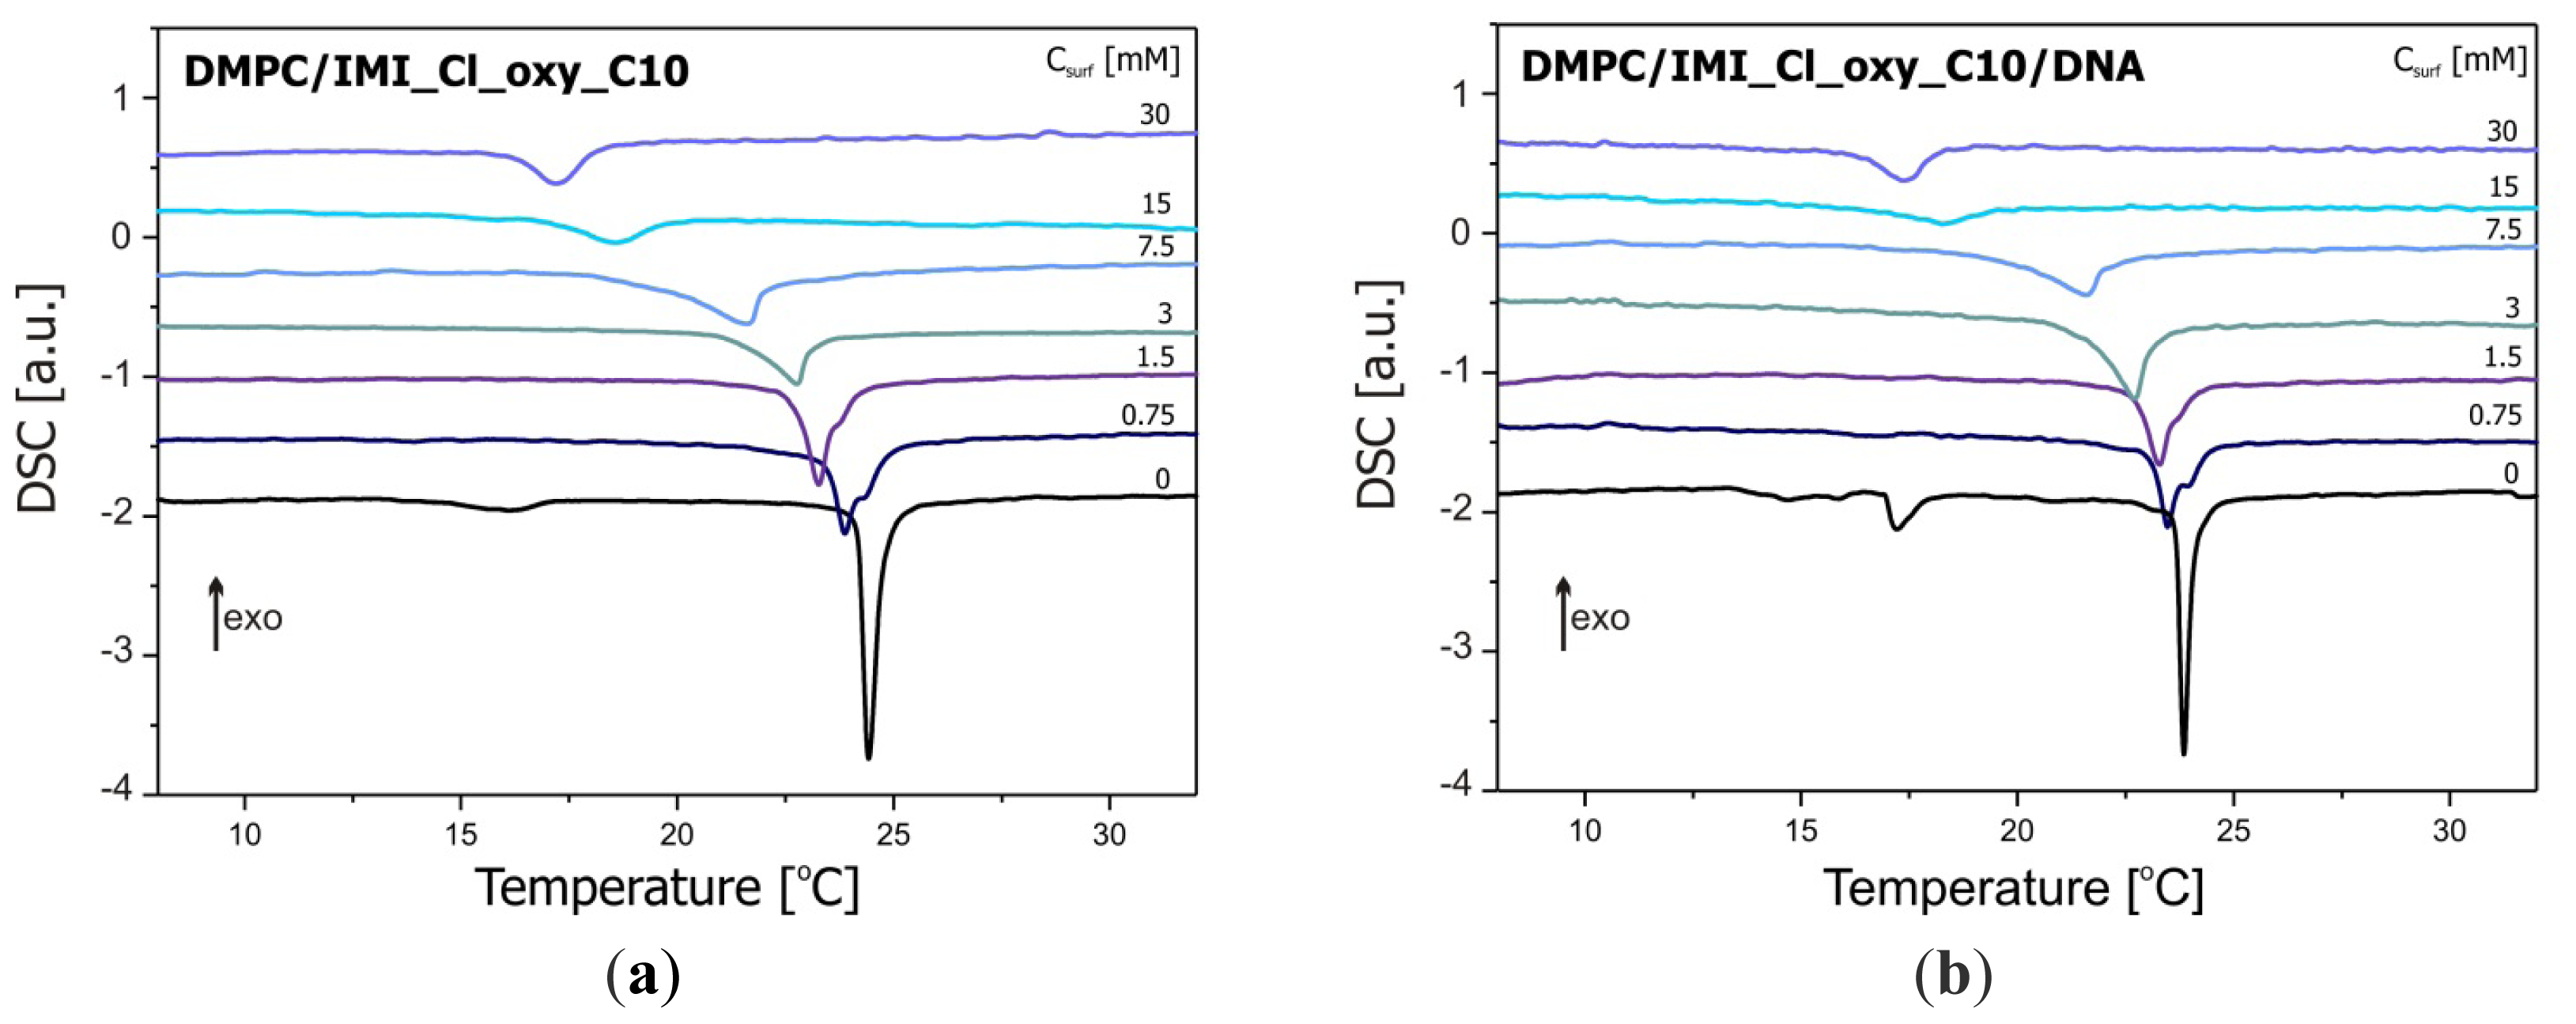
2.2. Thermal Stability of Lipid/Surfactant and Lipid/Surfactant/DNA Complexes
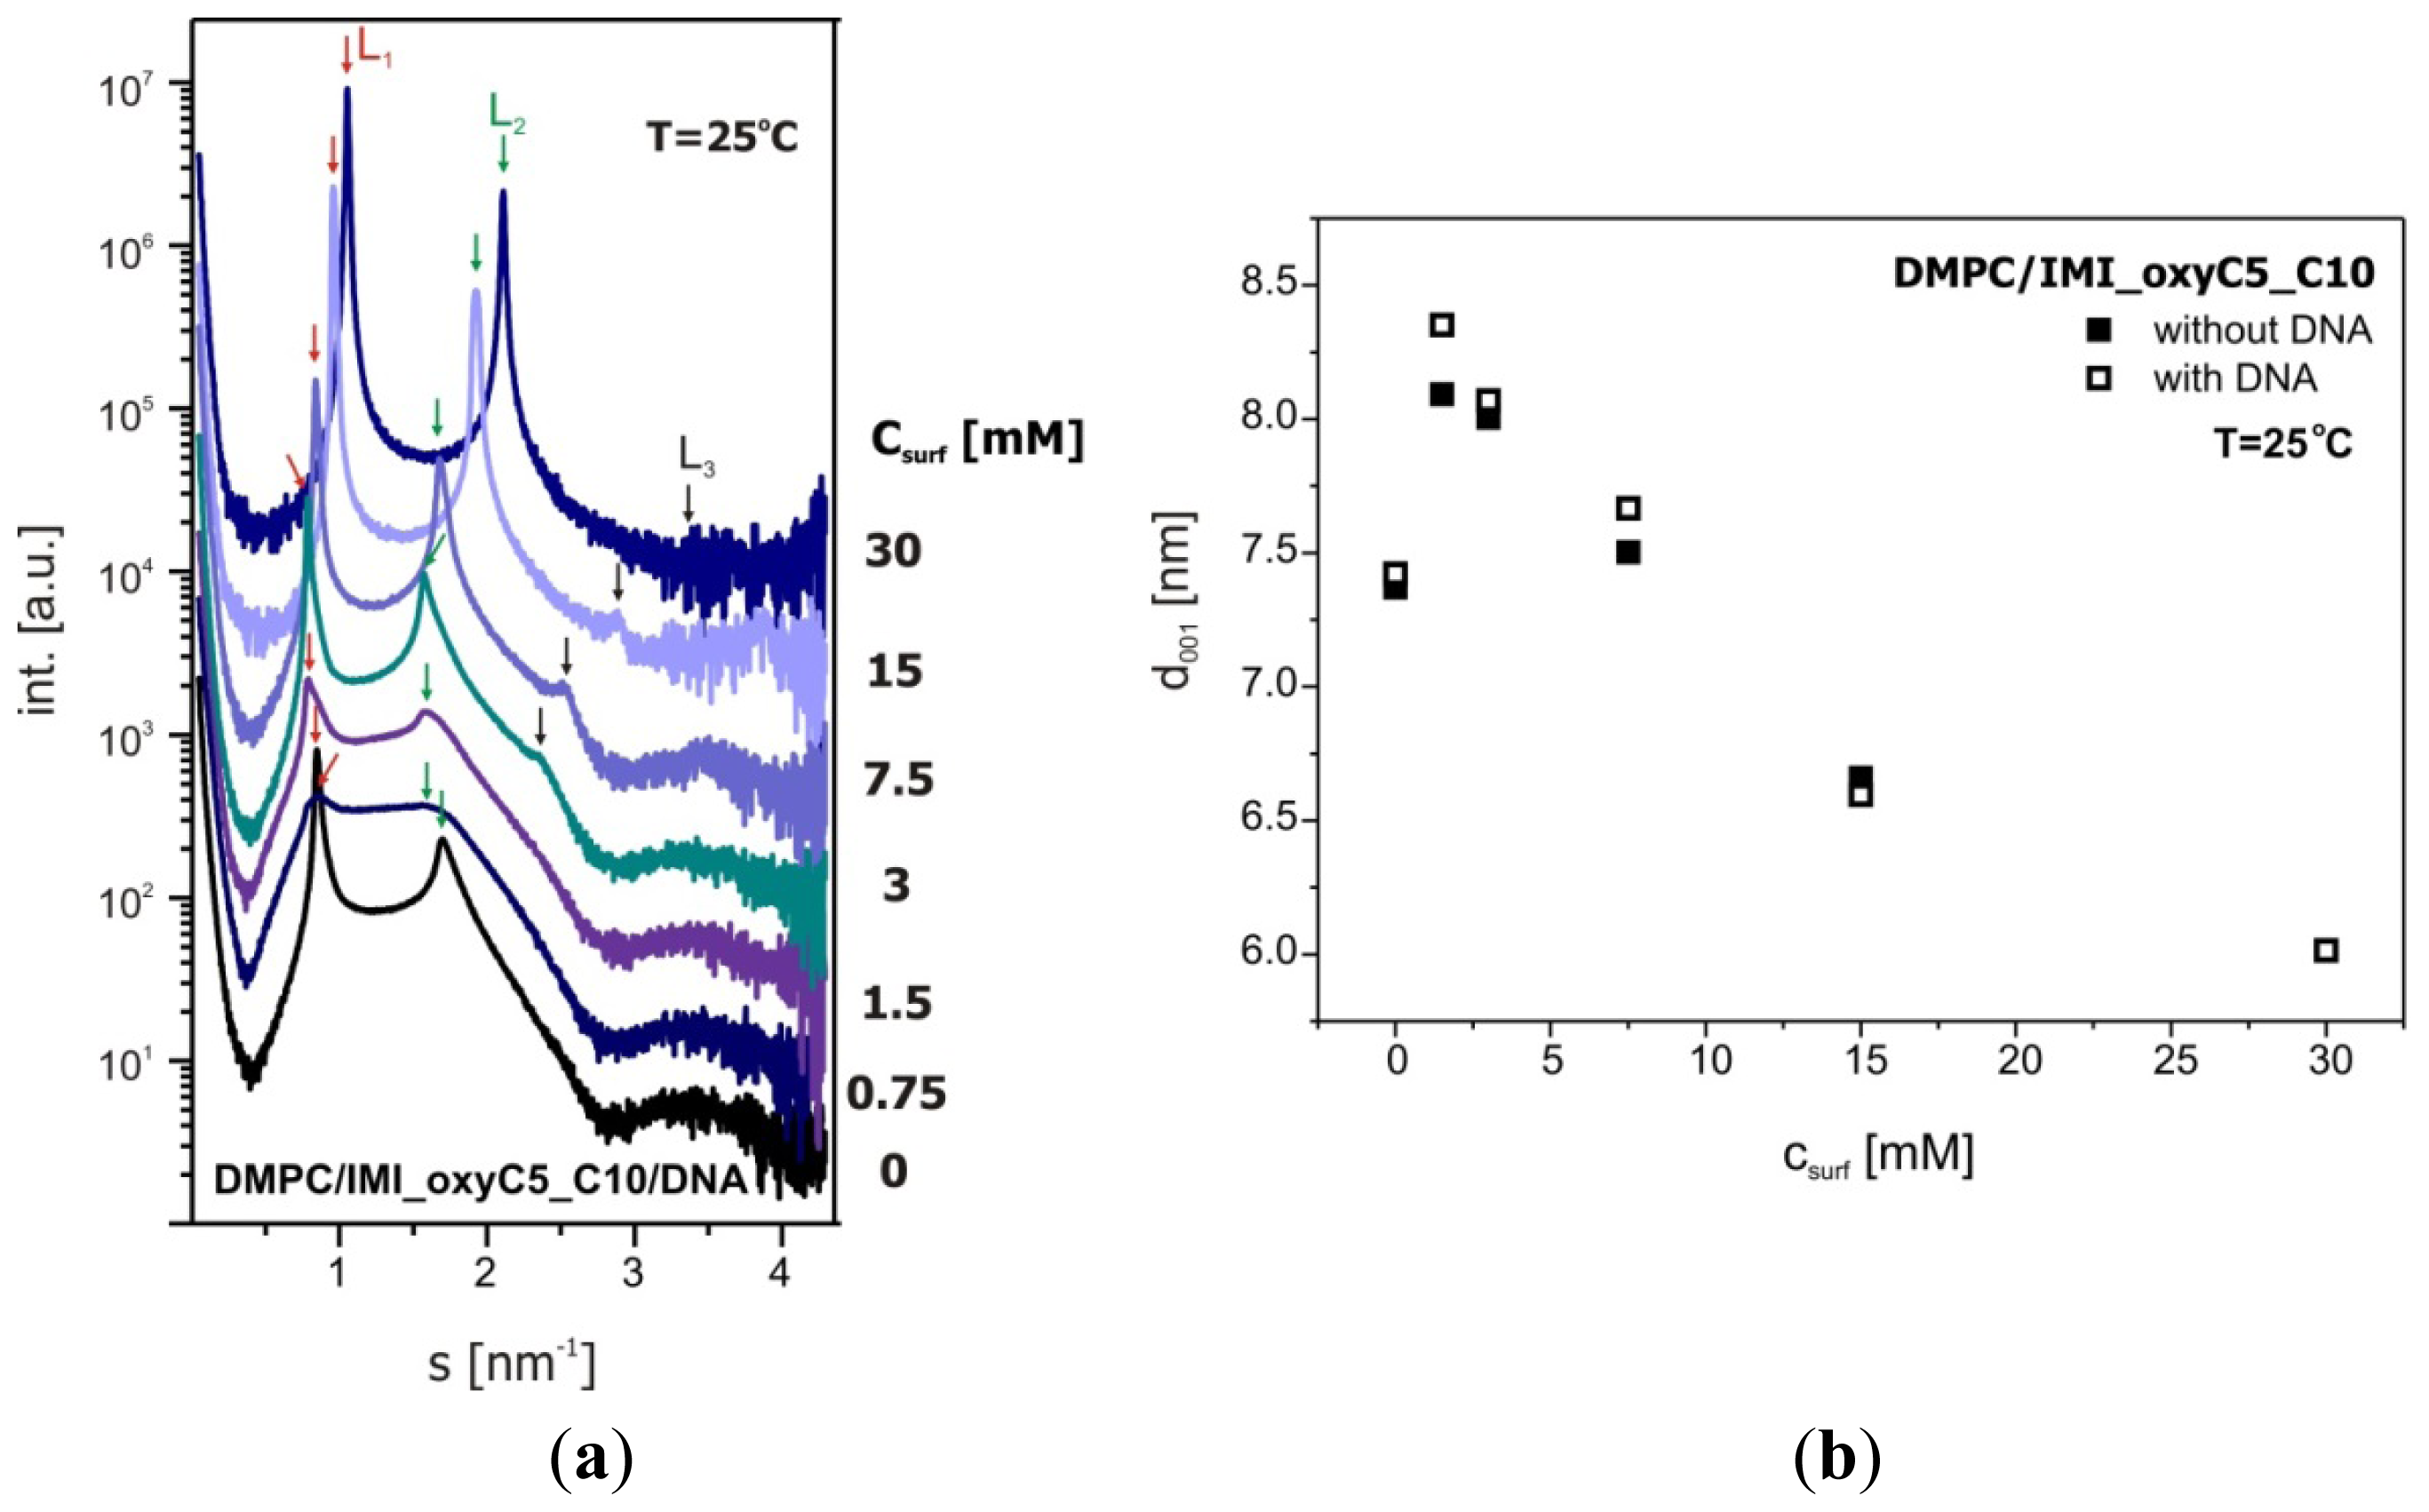
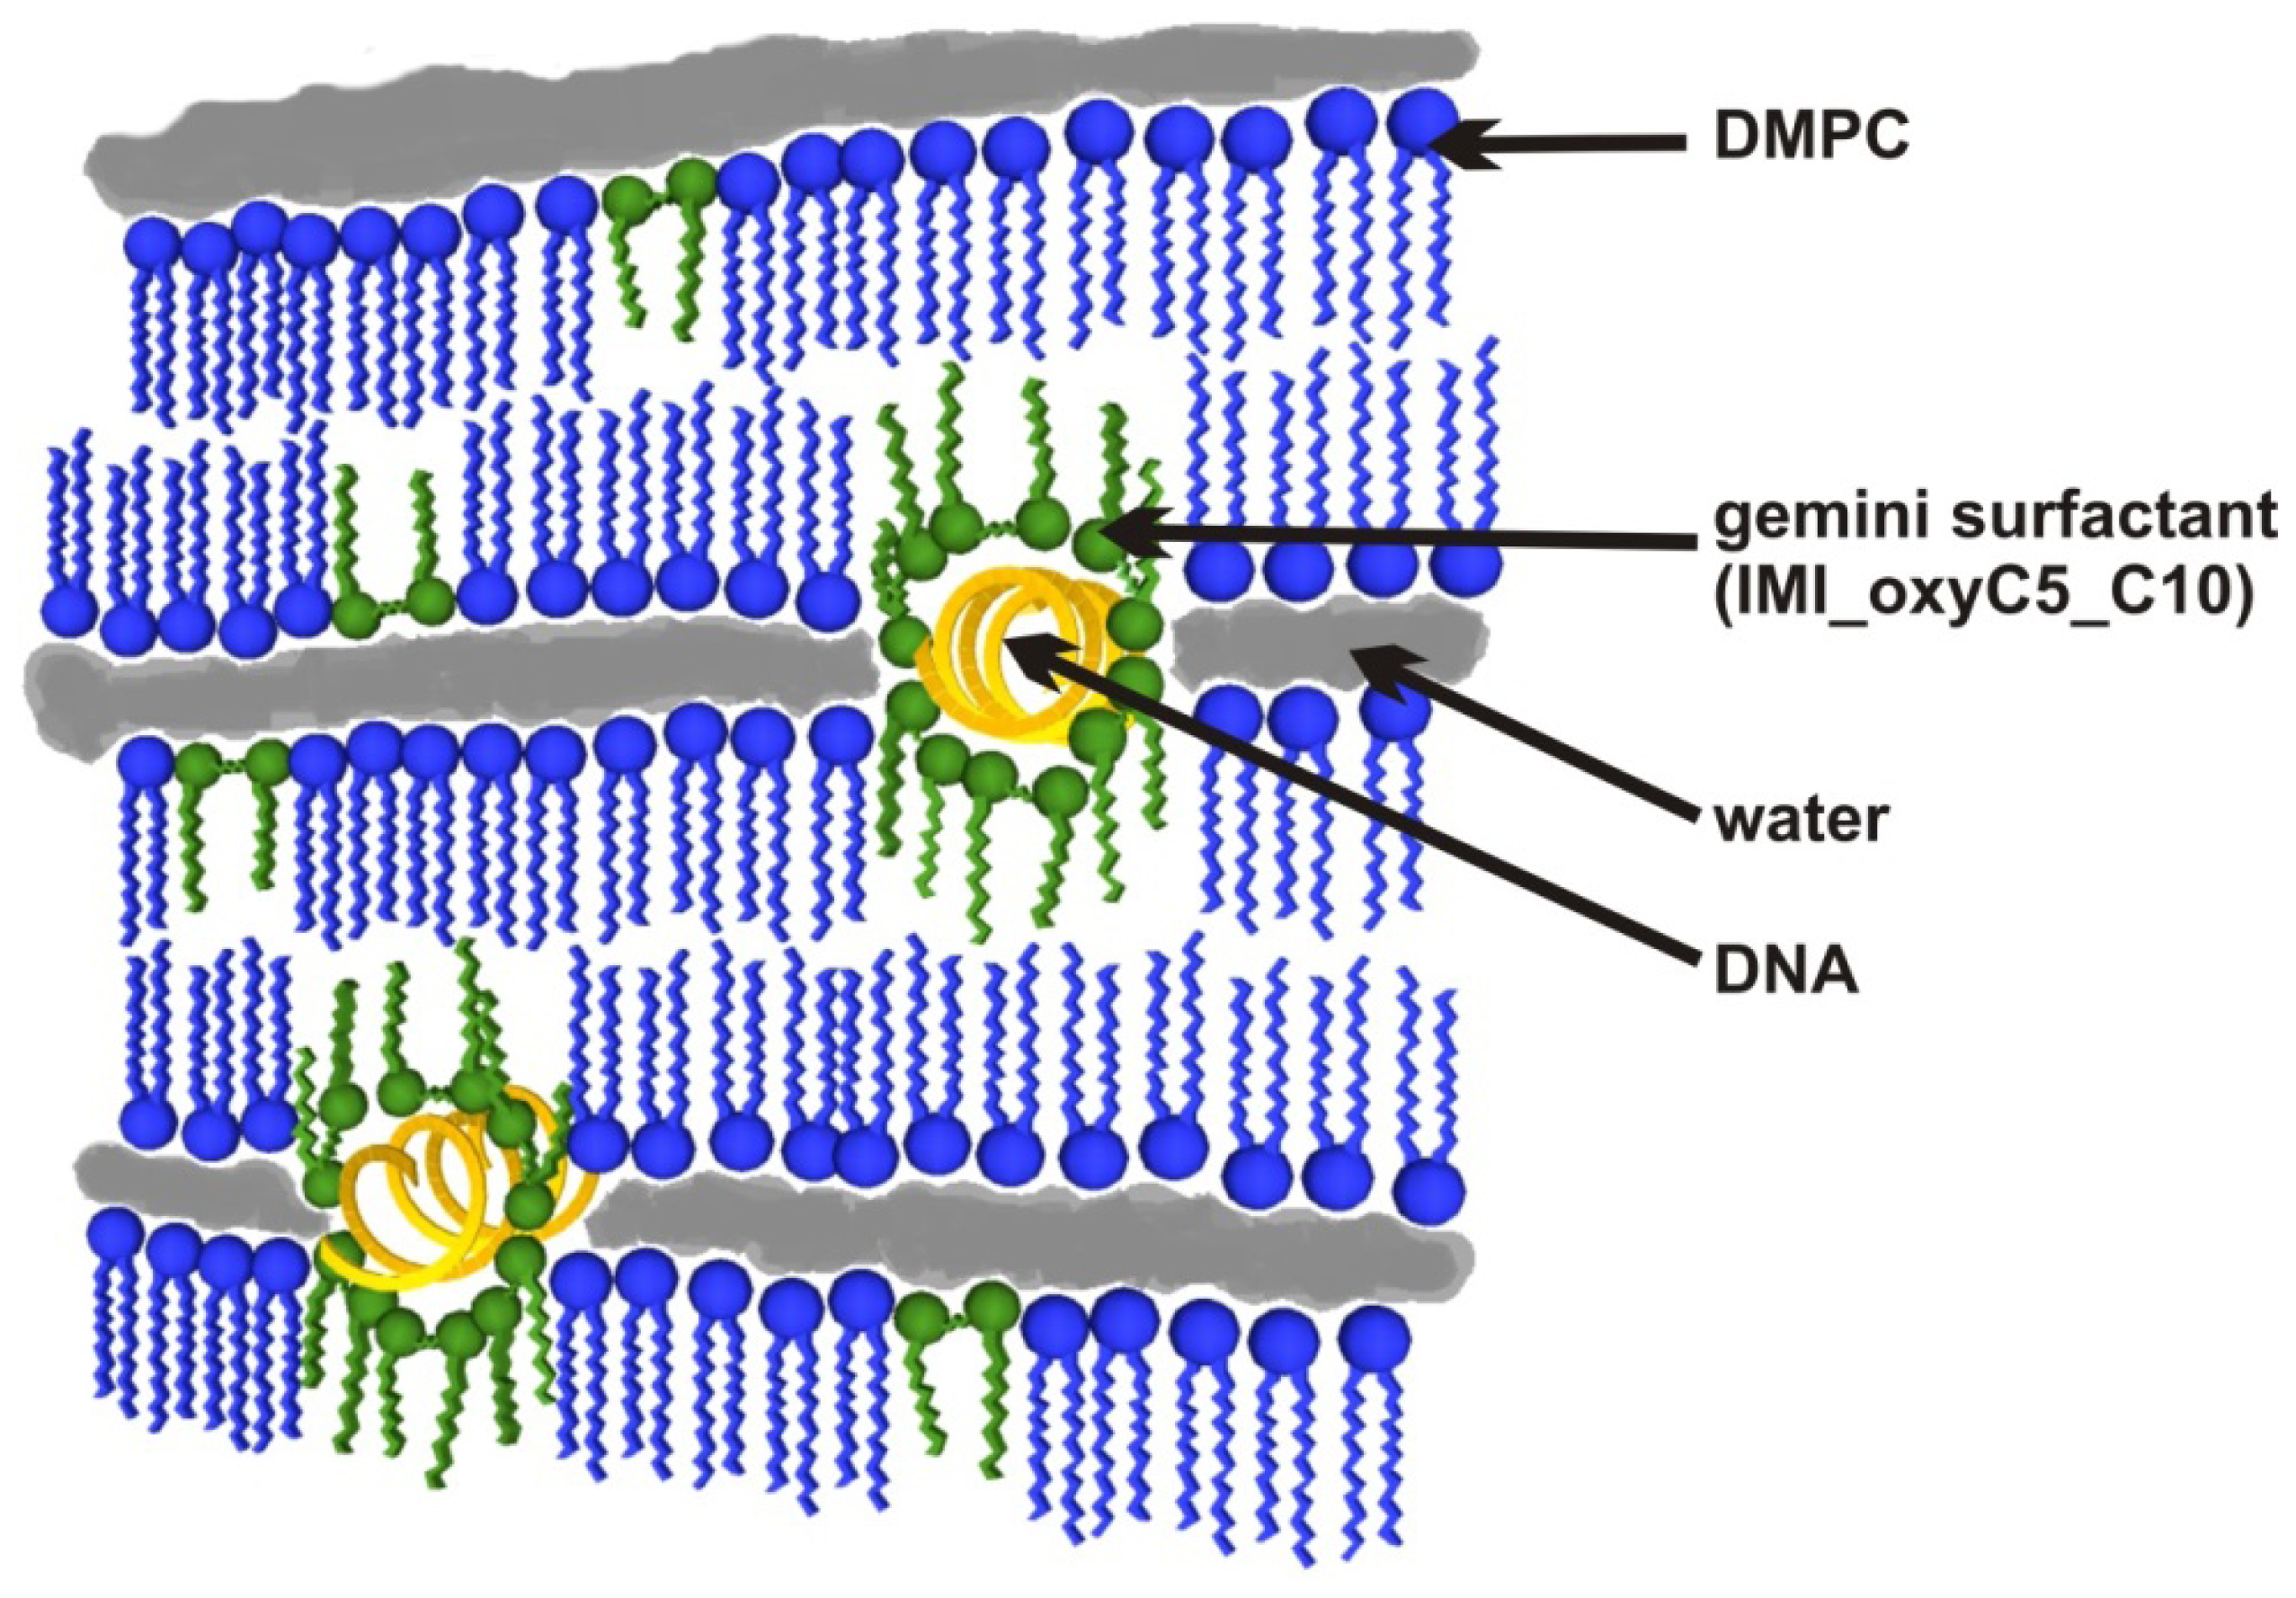
2.3. Structural Parameters of Lipid/Surfactant/DNA Complexes
3. Experimental Section
3.1. Sample Preparation
3.2. FTIR Measurements
3.3. Circular Dichroism (CD)
3.4. Differential Scanning Calorimetry (DSC)
3.5. Small Angle X-Ray Scattering (SAXS)
4. Conclusions
Acknowledgments
Conflict of Interest
References
- Lehn, J.M. Toward self-organization and complex matter. Science 2002, 295, 2400–2403. [Google Scholar]
- Misteli, T. The concept of self-organization in cellular architecture. J. Cell Biol 2001, 155, 181. [Google Scholar]
- Caroll, C.W.; Straight, A.F. Centromere formation: From epigenetics to self-assembly. Trends Cell Biol 2006, 16, 70–78. [Google Scholar]
- Zlotnick, A. To build a virus capsid. An equilibrium model of the self-assembly of polyhedral protein complexes. J. Mol. Biol 1994, 241, 59–67. [Google Scholar]
- Tien, H.T.; Leitmannova, A.; Ottova-Leitmannova, A. Membrane Biophysics as Viewed from Experimental Bilayer Lipid Membranes; Elsevier: New York, NY, USA, 2000. [Google Scholar]
- El-Aneed, A. An overview of current delivery systems in cancer gene therapy. J. Control. Release 2004, 94, 1–14. [Google Scholar]
- Israelachvili, J.N.; Mitchell, D.J.; Ninham, B.W. Theory of self-assembly of hydrocarbon amphiphiles into micelles and bilayers. J. Chem. Soc. Faraday Trans 1976, 72, 1525–1568. [Google Scholar]
- Israelachvili, J.N. Intermolecular and Surface Forces; Academic Press: New York NY, USA, 2011. [Google Scholar]
- Mirkim, S.M. Discovery of alternative DNA structures: A heroic decade (1979–1989). Front. Biosci 2008, 13, 1064–1071. [Google Scholar]
- Bloomfield, V.A. DNA condensation. Curr. Opin. Struct. Biol 1996, 6, 334–341. [Google Scholar]
- Livolant, F.; Leforestier, A. DNA mesophases. A structural analysis in polarysing and electron microscopy. Mol. Cryst. Liquid Cryst 1992, 215, 47–56. [Google Scholar]
- Radler, J.O.; Koltover, I.; Salditt, T.; Safynia, C.F. Structure of DNA-cationic liposome complexes: DNA intercalation in multilamellar membranes in distinct interhelical packing regimes. Science 1997, 275, 810–814. [Google Scholar]
- Dan, N. Multilamellar structures of DNA complexes with cationic liposomes. Biophys. J 1997, 73, 1842–1846. [Google Scholar]
- Koltover, I.; Salditt, T.; Safinya, C.R. Phase diagram, stability, and overcharging of lamellar cationic lipid-DNA self-assembled complexes. Biophys. J 1999, 77, 915–924. [Google Scholar]
- Bruinsma, R. Electrostatics of DNA-cationic lipid complexes: Isoelectric instability. Eur. Phys. J. B 1998, 4, 75–88. [Google Scholar]
- Kirby, A.J.; Camilleri, P.; Engberts, J.B.F.N.; Feiters, M.C.; Nolte, R.J.M.; Suderman, O.; Bergsma, M.; Bell, P.C.; Fielden, M.L.; Rodr’guez, C.L.G.; et al. Gemini surfactants: New synthetic vectors for gene transfection. Angew. Chem. Int. Edit 2003, 42, 1448–1457. [Google Scholar]
- Groth, C.; Nyden, M.; Holmberg, K.; Kanicky, J.R.; Shah, D.O. Kinetics of the selfassembly of gemini surfactants. J. Surfactants Deterg 2004, 7, 247–255. [Google Scholar]
- Koltover, I.; Salditt, T.; Radler, J.O.; Safynia, C.F. An inverted hexagonal phase of cationic liposome-DNA complexes related to DNA release and delivery. Science 1998, 281, 78–81. [Google Scholar]
- Bell, P.C.; Bergsma, M.; Dolbnya, I.P.; Bras, W.; Stuart, M.C.A.; Rowan, A.E.; Feiters, M.C.; Engberts, J.B.F.N. Transfection mediated by gemini surfactants: Engineered escape from the endosomal compartment. J. Am. Chem. Soc 2003, 125, 1551–1558. [Google Scholar]
- Slack, N.L.; Ahmad, A.; Evans, H.M.; Lin, A.J.; Samuel, C.E.; Safinya, C.R. Cationic lipid-DNA complexes for gene therapy: Understanding the relationship between complex structure and gene delivery pathways at the molecular level. Curr. Med. Chem 2004, 11, 133–149. [Google Scholar]
- Zuhorn, I.S.; Hoekstra, D. On the mechanism of cationic amphiphile-mediated transfection. To fuse or not to fuse: Is that the question? J. Membr. Biol 2002, 189, 167–179. [Google Scholar]
- Zhang, Y.; Chen, X.; Lan, J.; You, J.; Chen, L. Synthesis and biological applications of imidazolium-based polymerized ionic liquid as a gene delivery vector. Chem. Biol. Drug Des 2009, 74, 282–288. [Google Scholar]
- Kamboj, R.; Singh, S.; Bhadani, A.; Kataria, H.; Kaur, G. Gemini imidazolium surfactants: Synthesis and their biophysiochemical study. Langmuir 2012, 28, 11969–11978. [Google Scholar]
- Li, H.; Yu, C.; Chen, R.; Li, J.; Li, J. Novel ionic liquid-type Gemini surfactants: Synthesis, surface property and antimicrobial activity. Colloid Surf. A 2012, 395, 116–124. [Google Scholar]
- Smith, G.S.; Sirota, E.B.; Safinya, C.R.; Plano, R.J.; Clark, N.A. X-ray structural studies of freely suspended ordered hydrated DMPC multimembrane films. J. Chem. Phys 1990, 92, 4519–4529. [Google Scholar]
- Lewis, R.N.A.H.; McElhaney, R.N. Fourier transform infrared spectroscopy in the study of lipid phase transitions in model and biological membranes: Practical considerations. Methods Mol. Biol 2007, 400, 207–226. [Google Scholar]
- Disalvo, E.A.; Lairion, F.; Martini, F. Structural and functional properties of hydration and confined water in membrane interfaces. Biochim. Biophys. Acta 2008, 1778, 2655–2670. [Google Scholar]
- Pinaki, R.M.; Blume, A. Temperature-induced micelle-vesicle transitions in DMPC-SDS and DMPC-DTAB mixtures studied by calorimetry and dynamic light scattering. J. Phys. Chem. B 2002, 106, 10753–10763. [Google Scholar]
- Kozak, M.; Wypych, A.; Szpotkowski, K.; Jurga, S.; Skrzypczak, A. Structural and spectroscopic studies of DMPC/cationic surfactant system. J. Non-Cryst. Solids 2010, 356, 747–753. [Google Scholar]
- Wypych, A.; Szpotkowski, K.; Jurga, S.; Domka, L.; Kozak, M. Interactions of a cationic surfactant—(benzyloxymethyl) dodecyldimethylammonium chloride with model biomembrane systems. Colloid Surf. B 2013, in press. [Google Scholar]
- Szpotkowski, K.; Kozak, M.; Kozak, A.; Zielinski, R.; Wieczorek, D.; Jurga, S. Structural studies of selected DSPC-surfactant model systems of biological membranes. Acta Phys. Pol. A 2009, 115, 561–564. [Google Scholar]
- Kozak, M.; Szpotkowski, K.; Kozak, A.; Zieliński, R.; Wieczorek, D.; Gajda, M.J.; Domka, L. The FTIR and SAXS studies of influence of a morpholine derivatives on the DMPC-based biological membrane systems. Rad. Phys. Chem 2009, 78, S129–S133. [Google Scholar]
- Kozak, M.; Szpotkowski, K.; Kozak, A.; Zieliński, R.; Wieczorek, D.; Gajda, M.J. The effect of selected zwiterionic surfactant on the structure of hydrated DMPC. Rad. Phys. Chem 2009, 78, S112–S115. [Google Scholar]
- Pullmannová, P.; Funari, S.S.; Devínsky, F.; Uhríková, D. The DNA-DNA spacing in gemini surfactants—DOPE-DNA complexes. Biochim. Biophys. Acta 2012, 1818, 2725–2731. [Google Scholar]
- Kida, W.; Kozak, M. Structural changes of DPPC bilayers induced by gemini surfactant”. Acta Phys. Pol. A 2012, 121, 893–898. [Google Scholar]
- Labbé, J.F.; Cronier, F.; Gaudreault, R.C.; Auger, M. Spectroscopic characterization of DMPC/DOTAP cationic liposomes and their interactions with DNA and drugs. Chem. Phys. Lipids 2009, 158, 91–101. [Google Scholar]
- Gruenbaum, S.M.; Skinnera, J.L. Vibrational spectroscopy of water in hydrated lipid multi-bilayers. I. Infrared spectra and ultrafast pump-probe observables. J. Chem. Phys 2011, 135, 075101. [Google Scholar]
- Gruenbaum, S.M.; Pieniazek, P.A.; Skinner, J.L. Vibrational spectroscopy of water in hydrated lipid multi-bilayers. II. Two-dimensional infrared and peak shift observables within different theoretical approximations. J. Chem. Phys 2011, 135, 164506. [Google Scholar]
- Kirchner, S.; Cevc, G. On the origin of thermal Lβ′ → Pβ′ pretransition in the lamellar phospholipid membranes. Europhys. Lett 1994, 28, 31–36. [Google Scholar]
- Kypr, J.; Kejnovská, I.; Renčiuk, D.; Vorlíčková, M. Circular dichroism and conformational polymorphism of DNA. Nucleic Acids Res 2009, 37, 1713–1725. [Google Scholar]
- Miyahara, T.; Nakatsuji, H.; Sugiyam, H. Helical structure and circular dichroism spectra of DNA: A theoretical study. J. Phys. Chem. A 2013, 117, 42–55. [Google Scholar]
- Zhou, T.; Xu, G.; Ao, M.; Yang, Y.; Wang, C. DNA compaction to multi-molecular DNA condensation induced by cationic imidazolium gemini surfactants. Colloid Surf. A 2012, 414, 33–40. [Google Scholar]
- Lee, H.K.; Mijović, J. Bio-nano complexes: DNA/surfactant/single-walled carbon nanotube interactions in electric field. Polymer 2009, 50, 881–890. [Google Scholar]
- Chang, Y.-M.; Chen, C.K.-M.; Hou, M.-H. Conformational changes in DNA upon ligand binding monitored by circular dichroism. Int. J. Mol. Sci 2012, 13, 3394–3413. [Google Scholar]
- Rowat, A.C.; Keller, D.; Ipsen, J.H. Effects of farnesol on the physical properties of DMPC membranes. Biochim. Biophys. Acta 2005, 1713, 29–39. [Google Scholar]
- Almeida, J.A.S.; Faneca, H.; Carvalho, R.A.; Marques, E.F.; Pais, A.A.C.C. Dicationic alkylammonium bromide gemini surfactants. membrane perturbation and skin irritation. PLoS One 2011, 6, e26965. [Google Scholar]
- Muñoz-Úbeda, M.; Misra, S.K.; Barrán-Berdón, A.L.; Datta, S.; Aicart-Ramos, C.; Castro-Hartmann, P.; Kondaiah, P.; Junquera, E.; Bhattacharya, S.; Aicart, E. How does the spacer length of cationic gemini lipids influence the lipoplex formation with plasmid DNA? Physicochemical and biochemical characterizations and their relevance in gene therapy. Biomacromolecules 2012, 13, 3926–3937. [Google Scholar]
- Salditt, T.; Koltover, I.; Rädler, J.; Safinya, C. Two-dimensional smectic ordering of linear DNA chains in self-assembled DNA—Cationic liposome mixtures. Phys. Rev. Lett 1997, 79, 2582–2585. [Google Scholar]
- Caracciolo, G.; Pozzi, D.; Caminiti, R.; Mancini, G.; Luciani, P.; Amenitsch, H. Observation of a rectangular DNA superlattice in the liquid crystalline phase of cationic lipid/DNA complexes. J. Am. Chem. Soc. 2007, 129, 10092–10093. [Google Scholar]
- Bilalov, A.; Olsson, U.; Lindman, B. DNA-lipid self-assembly: Phase behavior and phase structures of a DNA-surfactant complex mixed with lecithin and water. Soft Matter 2011, 7, 730–742. [Google Scholar]
- Milani, S.; Bombelli, F.B.; Berti, D.; Baglioni, P. Nucleolipoplexes: A new paradigm for phospholipid bilayer-nucleic acid interactions. J. Am. Chem. Soc 2007, 129, 11664–11665. [Google Scholar]
- Pietralik, Z.; Taube, M.; Skrzypczak, A.; Kozak, M. SAXS Study of influence of gemini surfactant, 1,1′-(1,4-butanediyl)bis 3-cyclododecyloxymethylimidazolium di-chloride, on the fully hydrated DMPC. Acta Phys. Pol. A 2010, 117, 311. [Google Scholar]
- Roessle, M.W.; Klaering, R.; Ristau, U.; Robrahn, B.; Jahn, D.; Gehrmann, T.; Konarev, P.V.; Round, A.; Fiedler, S.; Hermes, S.; et al. Upgrade of the small angle X-ray scattering Beamline X33 at the European Molecular Biology Laboratory, Hamburg. J. Appl. Cryst 2007, 40, 190–194. [Google Scholar]
- Round, A.R.; Franke, D.; Moritz, S.; Huchler, R.; Fritsche, M.; Malthan, D.; Klaering, R.; Svergun, D.I.; Roessle, M. Automated sample-changing robot for solution scattering experiments at the EMBL Hamburg SAXS station X33. J. Appl. Cryst 2008, 41, 913–917. [Google Scholar]
- Huang, T.C.; Toraya, H.; Blanton, T.N.; Wu, Y. X-ray-powder diffraction analysis of silver behenate, a possible low-angle diffraction standard. J. Appl. Cryst. 1993, 184. [Google Scholar]
- Konarev, P.V.; Volkov, V.V.; Sokolova, A.V.; Koch, M.H.J.; Svergun, D.I. PRIMUS—A Windows-PC based system for small-angle scattering data analysis. J. Appl. Cryst 2003, 36, 1277–1282. [Google Scholar]
- Ryhanan, S.J.; Saily, M.J.; Paukku, T.; Borocci, S.; Mancini, G.; Holopainen, J.M.; Kinnunen, P.K.J. Surface charge density determines the efficiency of cationic gemini surfactant based lipofection. Biophys. J 2003, 84, 578–587. [Google Scholar]


| DMPC/IMI_oxyC5_C10 | DMPC/IMI_oxyC5_C10/DNA | ||||||
|---|---|---|---|---|---|---|---|
| Csurf (mM) | H (kJ/mol) | Tpeak (°C) | Tonset (°C) | Csurf (mM) | H (kJ/mol) | Tpeak (°C) | Tonset (°C) |
| 0 | −16.7 | 24.4 | 24.2 | 0 | −16.1 | 23.9 | 23.7 |
| 0.75 | −12.2 | 23.9 | 23.4 | 0.75 | −10.4 | 23.5 | 23.1 |
| 1.5 | −13.1 | 23.3 | 22.9 | 1.5 | −11.5 | 23.3 | 22.8 |
| 3 | −9.6 | 22.8 | 21.5 | 3 | −11.2 | 22.7 | 22.0 |
| 7.5 | −10.0 | 21.6 | 20.4 | 7.5 | −7.0 | 21.6 | 20.2 |
| 15 | −5.9 | 18.5 | 16.9 | 15 | −4.8 | 18.3 | 17.1 |
| 30 | −6.4 | 17.2 | 16.4 | 30 | −6.1 | 17.4 | 16.6 |
© 2013 by the authors; licensee MDPI, Basel, Switzerland This article is an open access article distributed under the terms and conditions of the Creative Commons Attribution license (http://creativecommons.org/licenses/by/3.0/).
Share and Cite
Pietralik, Z.; Krzysztoń, R.; Kida, W.; Andrzejewska, W.; Kozak, M. Structure and Conformational Dynamics of DMPC/Dicationic Surfactant and DMPC/Dicationic Surfactant/DNA Systems. Int. J. Mol. Sci. 2013, 14, 7642-7659. https://doi.org/10.3390/ijms14047642
Pietralik Z, Krzysztoń R, Kida W, Andrzejewska W, Kozak M. Structure and Conformational Dynamics of DMPC/Dicationic Surfactant and DMPC/Dicationic Surfactant/DNA Systems. International Journal of Molecular Sciences. 2013; 14(4):7642-7659. https://doi.org/10.3390/ijms14047642
Chicago/Turabian StylePietralik, Zuzanna, Rafał Krzysztoń, Wojciech Kida, Weronika Andrzejewska, and Maciej Kozak. 2013. "Structure and Conformational Dynamics of DMPC/Dicationic Surfactant and DMPC/Dicationic Surfactant/DNA Systems" International Journal of Molecular Sciences 14, no. 4: 7642-7659. https://doi.org/10.3390/ijms14047642
APA StylePietralik, Z., Krzysztoń, R., Kida, W., Andrzejewska, W., & Kozak, M. (2013). Structure and Conformational Dynamics of DMPC/Dicationic Surfactant and DMPC/Dicationic Surfactant/DNA Systems. International Journal of Molecular Sciences, 14(4), 7642-7659. https://doi.org/10.3390/ijms14047642