Serial Changes of Serum Growth Factor Levels and Liver Regeneration after Partial Hepatectomy in Healthy Humans
Abstract
:1. Introduction
2. Results
2.1. Clinical Characteristics of Study Population
2.2. Postoperative Changes of Laboratory Data and Liver Regeneration
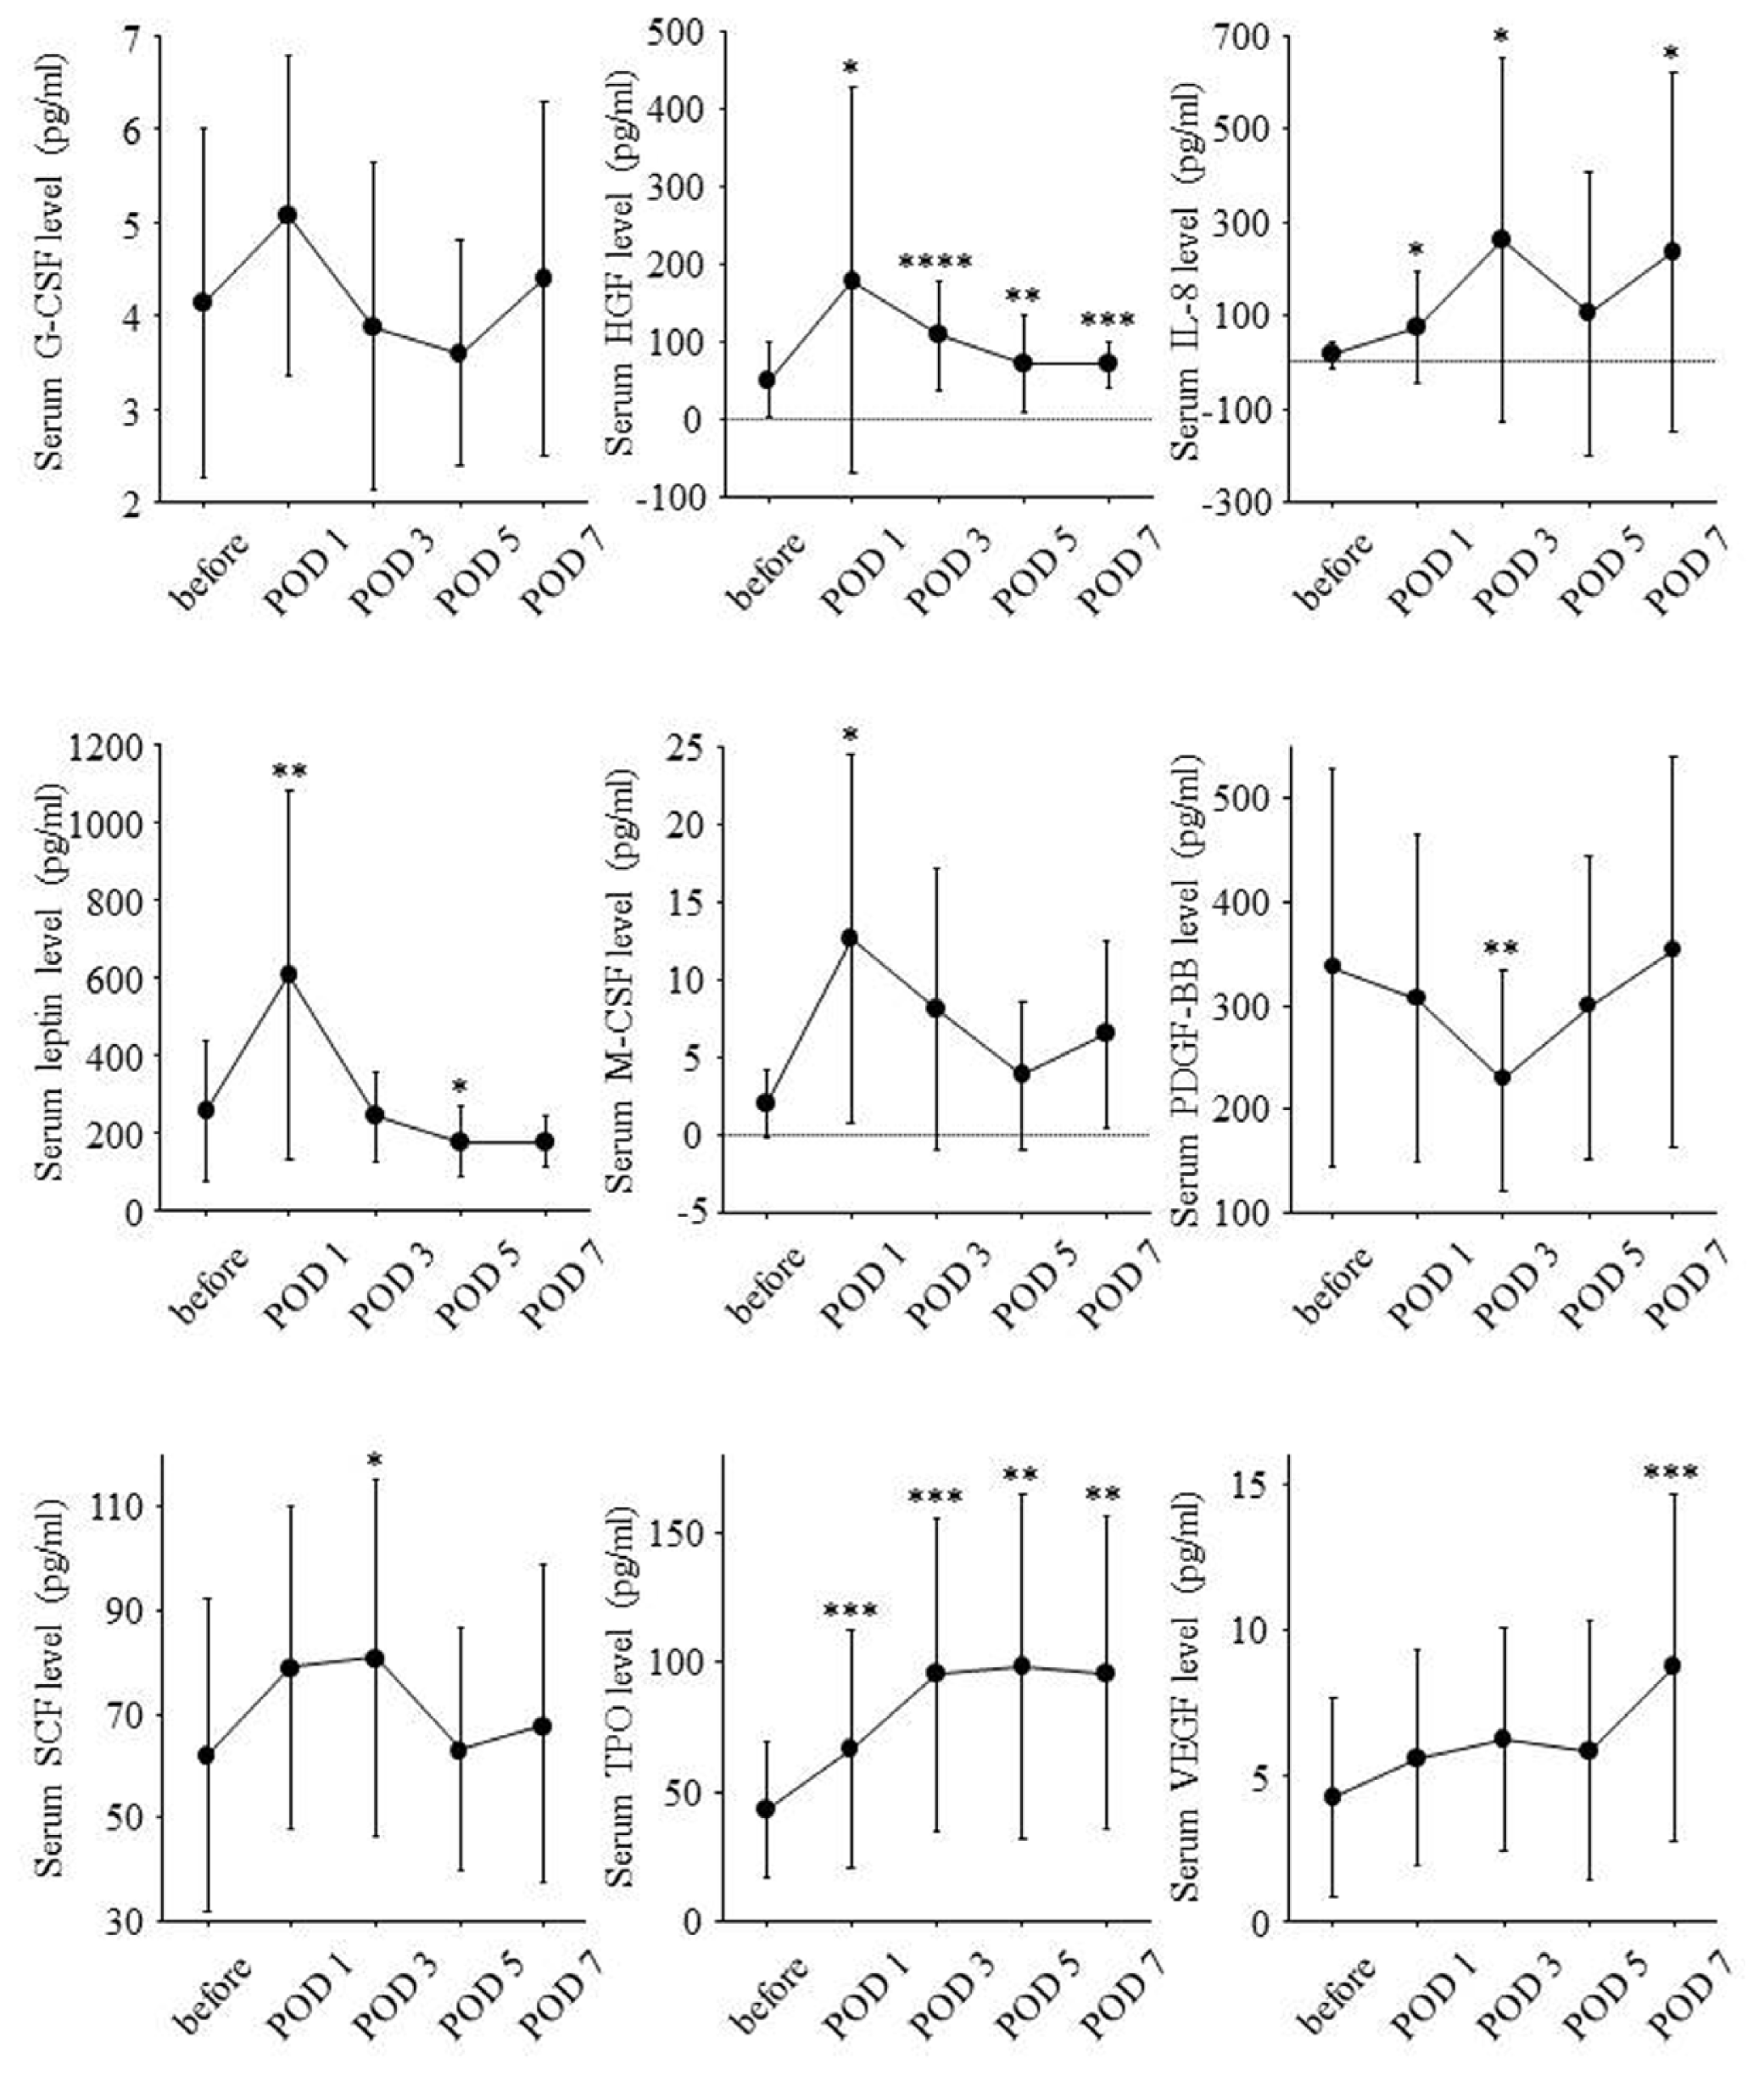
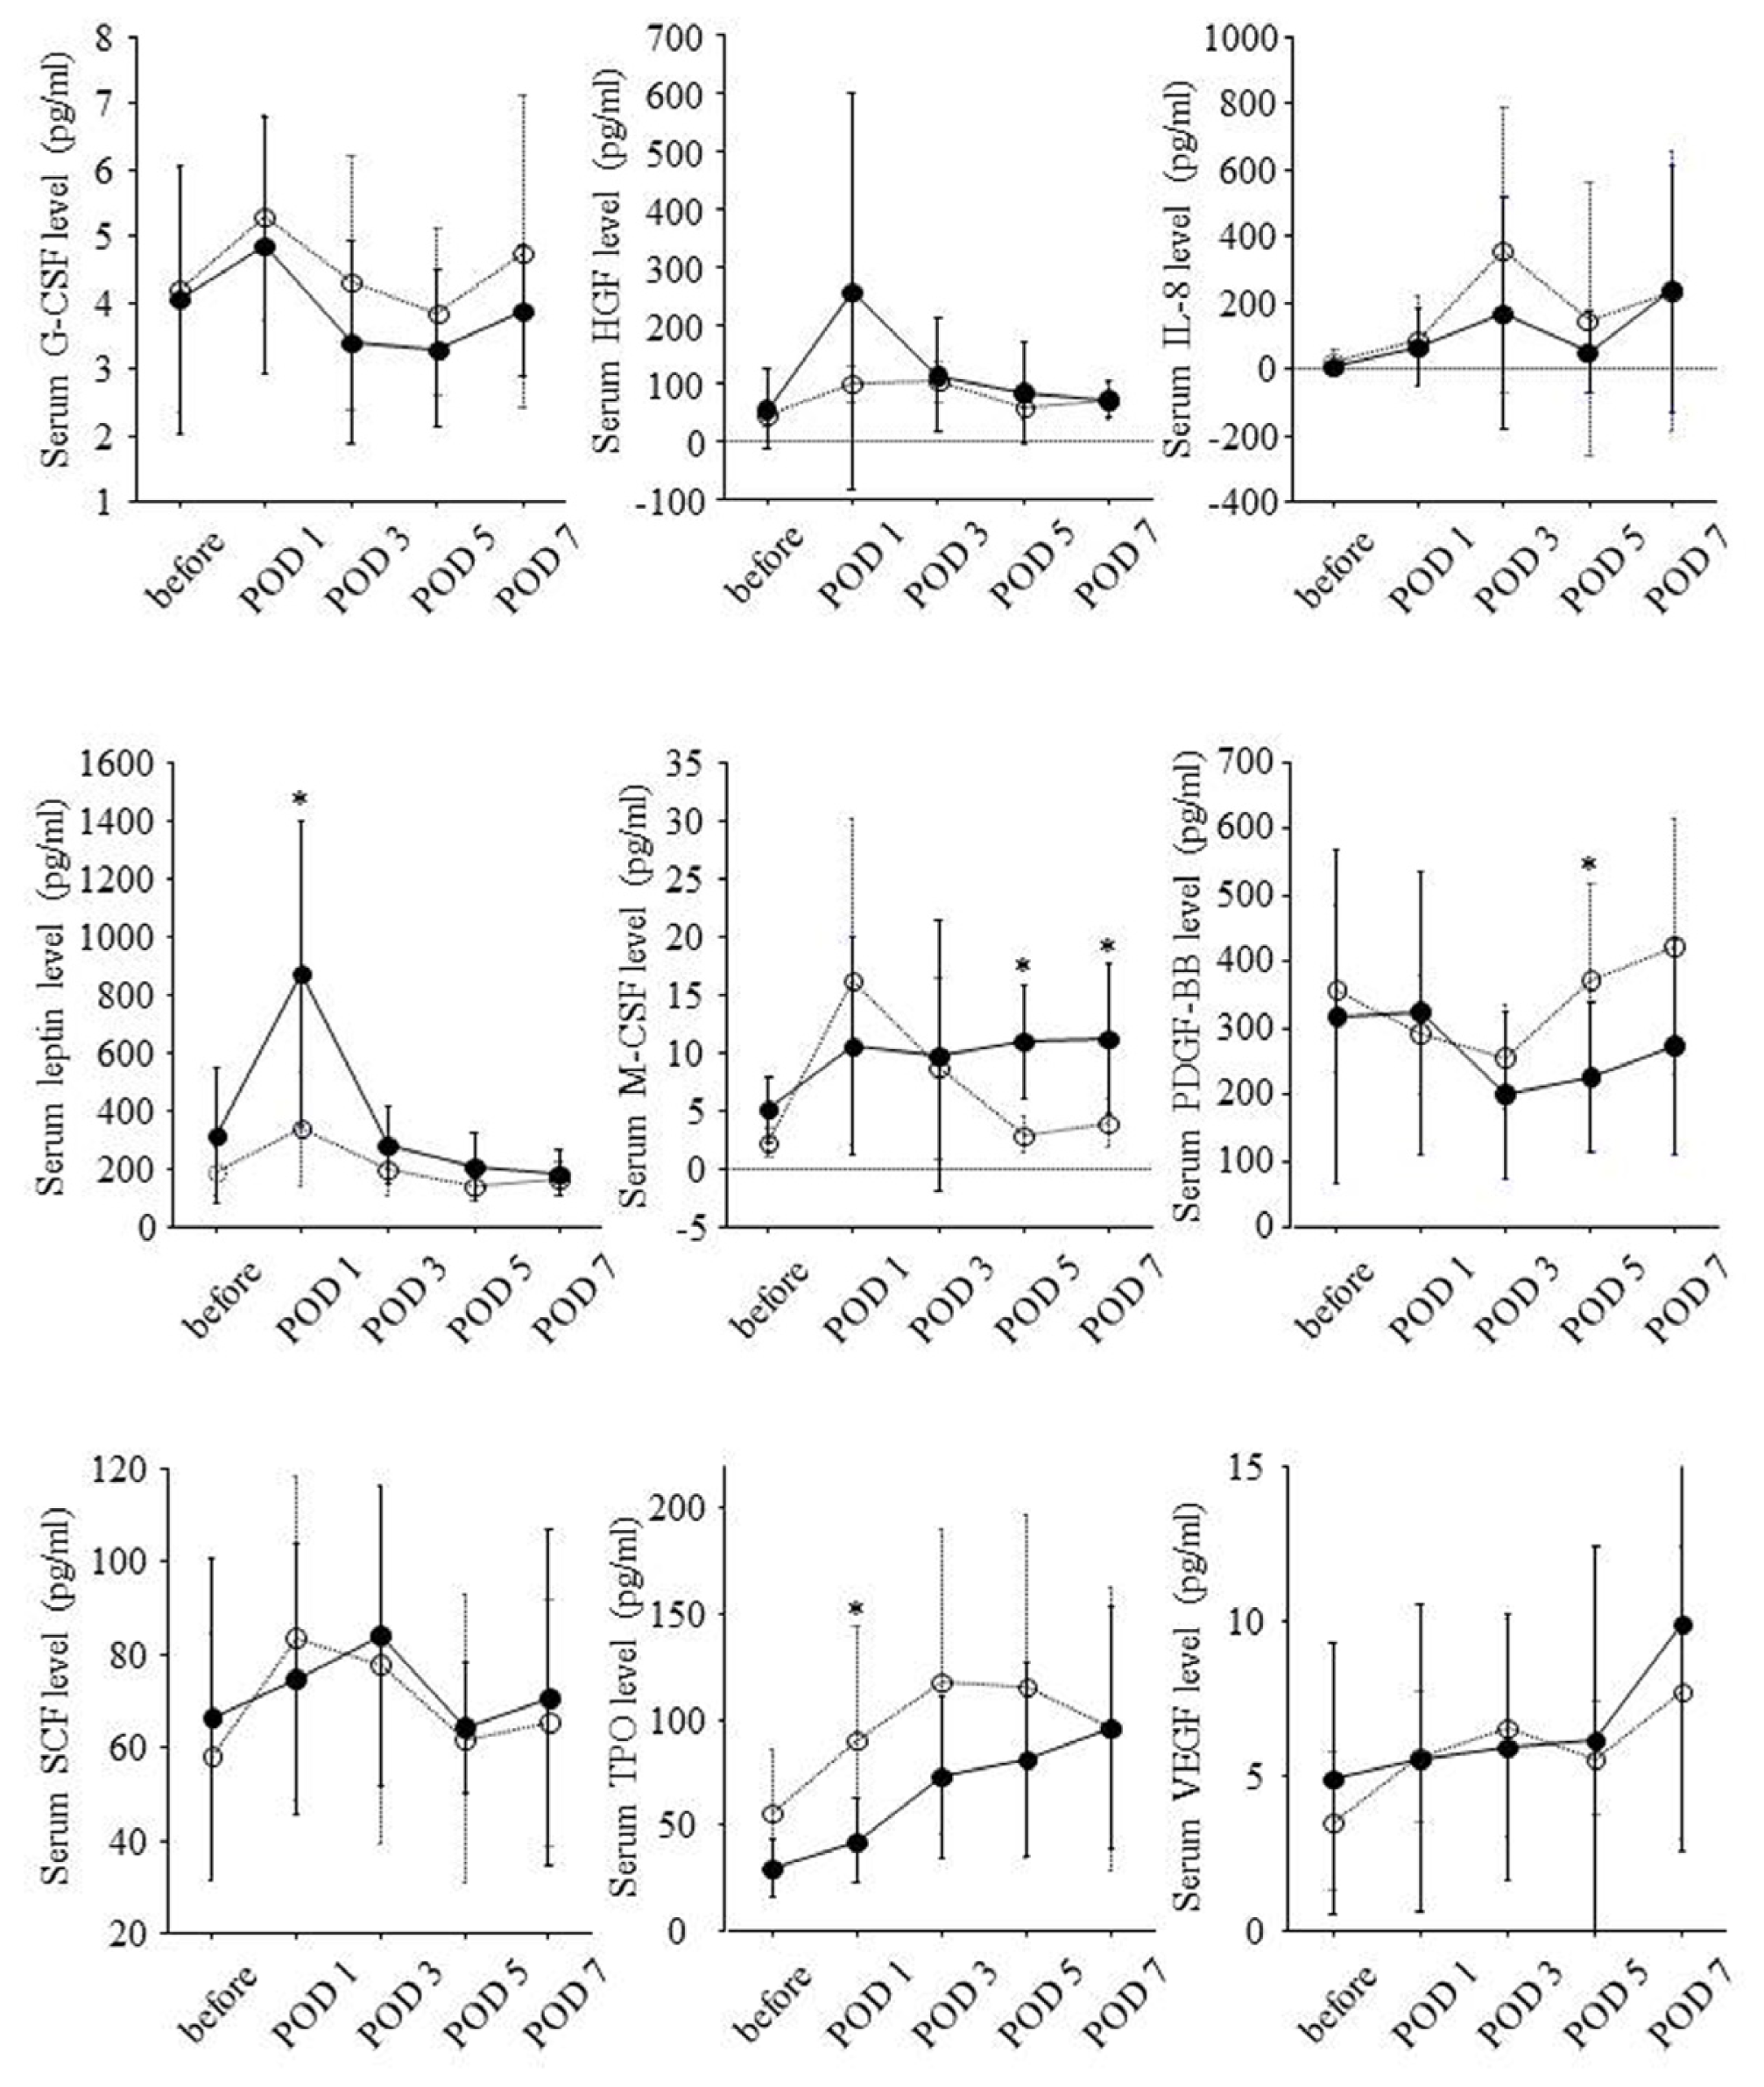
2.3. Postoperative Changes of Serum Growth Factor Levels and Liver Regeneration
3. Discussion
4. Materials and Methods
4.1. Study Population
4.2. Measurement of Serum Growth Factor Level
4.3. Volumetric Study of Liver
4.4. Statistical Analysis
5. Conclusions


| Clinical Characteristics | Value |
|---|---|
| Age (year) | 36 ± 12 |
| Gender, female (%) | 12 (75) |
| Height (cm) | 161 ± 6 |
| Body weight (kg) | 59 ± 11 |
| Body mass index (kg/m2) | 22.8 ± 4.2 |
| Laboratory Data | Value |
| White blood cell count (/mm3) | 5574 ± 890 |
| Hemoglobin concentration (g/dL) | 13.4 ± 1.8 |
| Platelet count (×104/mm3) | 24.7 ± 3.9 |
| Bilirubin (mg/dL) | 0.9 ± 0.5 |
| Albumin (g/dL) | 4.5 ± 0.3 |
| Prothrombin time-international normalized ratio (INR) | 0.98 ± 0.07 |
| Aspartate aminotransferase (IU/L) | 18 ± 4 |
| Alanine aminotransferase (IU/L) | 15 ± 9 |
| C-reactive protein (mg/dL) | 0.05 ± 0.07 |
| Graft Type | Value |
|---|---|
| Liver graft type (left graft) n (%) | 6 (38) |
| Liver graft type (right graft) n (%) | 10 (62) |
| Liver volume Change | Value |
| Liver volume before hepatectomy (cm3) | 1213 ± 206 |
| Liver resection rate (%) | 49 ± 20 |
| Remnant liver volume on POD 0 (cm3) | 622 ± 262 |
| Remnant liver volume per body weight on POD 0 (cm3/kg) | 10.7 ± 4.6 |
| Liver volume on POD 14 (cm3) | 917 ± 158 |
| Ratio of liver volume on POD 14 to liver volume on POD 0 (%) | 167 ± 54 |
Conflicts of Interest
References
- Merion, R.M. Current status and future of liver transplantation. Semin. Liver Dis 2010, 30, 411–421. [Google Scholar]
- Li, K.K.; Neuberger, J. The management of patients awaiting liver transplantation. Nat. Rev. Gastroenterol. Hepatol 2009, 6, 648–659. [Google Scholar]
- Fausto, N.; Campbell, J.S.; Riehle, K.J. Liver regeneration. Hepatology 2006, 43, S45–S53. [Google Scholar]
- Assy, N.; Spira, G.; Paizi, M.; Shenkar, L.; Kraizer, Y.; Cohen, T.; Neufeld, G.; Dabbah, B.; Enat, R.; Baruch, Y. Effect of vascular endothelial growth factor on hepatic regenerative activity following partial hepatectomy in rats. J. Hepatol 1999, 30, 911–915. [Google Scholar]
- Murata, S.; Hashimoto, I.; Nakano, Y.; Myronovych, A.; Watanabe, M.; Ohkohchi, N. Single administration of thrombopoietin prevents progression of liver fibrosis and promotes liver regeneration after partial hepatectomy in cirrhotic rats. Ann. Surg 2008, 248, 821–828. [Google Scholar]
- De Jong, K.P.; von Geusau, B.A.; Rottier, C.A.; Bijzet, J.; Limburg, P.C.; de Vries, E.G.; Fidler, V.; Slooff, M.J. Serum response of hepatocyte growth factor, insulin-like growth factor-I, interleukin-6, and acute phase proteins in patients with colorectal liver metastases treated with partial hepatectomy or cryosurgery. J. Hepatol 2001, 34, 422–427. [Google Scholar]
- Efimova, E.A.; Glanemann, M.; Nussler, A.K.; Schumacher, G.; Settmacher, U.; Jonas, S.; Nussler, N.; Neuhaus, P. Changes in serum levels of growth factors in healthy individuals after living related liver donation. Transplant. Proc 2005, 37, 1074–1075. [Google Scholar]
- Nakashima, S.; Katano, Y.; Nakano, I.; Hirooka, Y.; Ito, A.; Ishigami, M.; Hayashi, K.; Honda, T.; Goto, H. Changes in circulating cytokine levels and lymphocyte subsets in healthy liver donors after partial hepatectomy. Hepatol. Res 2007, 37, 878–884. [Google Scholar]
- Nishizaki, T.; Takenaka, K.; Yoshizumi, T.; Yanaga, K.; Soejima, Y.; Shirabe, K.; Sugimachi, K. Alteration in levels of human hepatocyte growth factor following hepatectomy. J. Am. Coll. Surg 1995, 181, 6–10. [Google Scholar]
- Nagasako, Y.; Jin, M.B.; Miyazaki, H.; Nakayama, M.; Shimamura, T.; Furukawa, H.; Matushita, M.; Todo, S. Thrombopoietin in postoperative thrombocytopenia following living donor hepatectomy. Liver Transplant 2006, 12, 435–439. [Google Scholar]
- Ido, A.; Moriuchi, A.; Numata, M.; Murayama, T.; Teramukai, S.; Marusawa, H.; Yamaji, N.; Setoyama, H.; Kim, D., II; Chiba, T.; et al. Safety and pharmacokinetics of recombinant human hepatocyte growth factor (rh-HGF) in patients with fulminant hepatitis: A phase I/II clinical trial, following preclinical studies to ensure safety. J. Transl. Med 2011, 9, 55. [Google Scholar]
- Leclercq, I.A.; Field, J.; Farrell, G.C. Leptin-specific mechanisms for impaired liver regeneration in ob/ob mice after toxic injury. Gastroenterology 2003, 124, 1451–1464. [Google Scholar]
- Leclercq, I.A.; Vansteenberghe, M.; Lebrun, V.B.; VanHul, N.K.; Abarca-Quinones, J.; Sempoux, C.L.; Picard, C.; Stärkel, P.; Horsmans, Y.L. Defective hepatic regeneration after partial hepatectomy in leptin-deficient mice is not rescued by exogenous leptin. Lab. Investig 2006, 86, 1161–1171. [Google Scholar]
- Yang, S.; Koteish, A.; Lin, H.; Huang, J.; Roskams, T.; Dawson, V.; Diehl, A.M. Oval cells compensate for damage and replicative senescence of mature hepatocytes in mice with fatty liver disease. Hepatology 2004, 39, 403–411. [Google Scholar]
- Amemiya, H.; Kono, H.; Fujii, H. Liver regeneration is impaired in macrophage colony stimulating factor deficient mice after partial hepatectomy: The role of M-CSF-induced macrophages. J. Surg. Res 2011, 165, 59–67. [Google Scholar]
- Ruhnke, M.; Ungefroren, H.; Nussler, A.; Martin, F.; Brulport, M.; Schormann, W.; Hengstler, J.G.; Klapper, W.; Ulrichs, K.; Hutchinson, J.A.; et al. Differentiation of in vitro-modified human peripheral blood monocytes into hepatocyte-like and pancreatic islet-like cells. Gastroenterology 2005, 128, 1774–1786. [Google Scholar]
- Ohnishi, T.; Kakimoto, K.; Bandow, K.; Lowenstein, C.J.; Daikuhara, Y.; Matsuguchi, T. Mature hepatocyte growth factor/scatter factor on the surface of human granulocytes is released by a mechanism involving activated factor Xa. J. Immunol 2006, 176, 6945–6953. [Google Scholar]
- Viebahn, C.S.; Benseler, V.; Holz, L.E.; Elsegood, C.L.; Vo, M.; Bertolino, P.; Ganss, R.; Yeoh, G.C. Invading macrophages play a major role in the liver progenitor cell response to chronic liver injury. J. Hepatol 2010, 53, 500–507. [Google Scholar]
- Chen, K.; Li, F.; Li, J.; Cai, H.; Strom, S.; Bisello, A.; Kelley, D.E.; Friedman-Einat, M.; Skibinski, G.A.; McCrory, M.A.; et al. Induction of leptin resistance through direct interaction of C-reactive protein with leptin. Nat. Med 2006, 12, 425–432. [Google Scholar]
- Aoyama, T.; Ikejima, K.; Kon, K.; Okumura, K.; Arai, K.; Watanabe, S. Pioglitazone promotes survival and prevents hepatic regeneration failure after partial hepatectomy in obese and diabetic KK-Ay mice. Hepatology 2009, 49, 1636–1644. [Google Scholar]
- Xi, L.; Xiao, C.; Bandsma, R.H.J.; Naples, M.; Adeli, K.; Lewis, G.F. C-reactive protein impairs hepatic insulin sensitivity and insulin signaling in rats: Role of mitogen-activated protein kinases. Hepatology 2011, 53, 127–135. [Google Scholar]
- Afdhal, N.; McHutchison, J.; Brown, R.; Jacobson, I.; Manns, M.; Poordad, F.; Weksler, B.; Esteban, R. Thrombocytopenia associated with chronic liver disease. J. Hepatol 2008, 48, 1000–1007. [Google Scholar]
© 2013 by the authors; licensee MDPI, Basel, Switzerland This article is an open access article distributed under the terms and conditions of the Creative Commons Attribution license (http://creativecommons.org/licenses/by/3.0/).
Share and Cite
Matsumoto, K.; Miyake, Y.; Umeda, Y.; Matsushita, H.; Matsuda, H.; Takaki, A.; Sadamori, H.; Nouso, K.; Yagi, T.; Fujiwara, T.; et al. Serial Changes of Serum Growth Factor Levels and Liver Regeneration after Partial Hepatectomy in Healthy Humans. Int. J. Mol. Sci. 2013, 14, 20877-20889. https://doi.org/10.3390/ijms141020877
Matsumoto K, Miyake Y, Umeda Y, Matsushita H, Matsuda H, Takaki A, Sadamori H, Nouso K, Yagi T, Fujiwara T, et al. Serial Changes of Serum Growth Factor Levels and Liver Regeneration after Partial Hepatectomy in Healthy Humans. International Journal of Molecular Sciences. 2013; 14(10):20877-20889. https://doi.org/10.3390/ijms141020877
Chicago/Turabian StyleMatsumoto, Kazuyuki, Yasuhiro Miyake, Yuzo Umeda, Hiroshi Matsushita, Hiroaki Matsuda, Akinobu Takaki, Hiroshi Sadamori, Kazuhiro Nouso, Takahito Yagi, Toshiyoshi Fujiwara, and et al. 2013. "Serial Changes of Serum Growth Factor Levels and Liver Regeneration after Partial Hepatectomy in Healthy Humans" International Journal of Molecular Sciences 14, no. 10: 20877-20889. https://doi.org/10.3390/ijms141020877
APA StyleMatsumoto, K., Miyake, Y., Umeda, Y., Matsushita, H., Matsuda, H., Takaki, A., Sadamori, H., Nouso, K., Yagi, T., Fujiwara, T., & Yamamoto, K. (2013). Serial Changes of Serum Growth Factor Levels and Liver Regeneration after Partial Hepatectomy in Healthy Humans. International Journal of Molecular Sciences, 14(10), 20877-20889. https://doi.org/10.3390/ijms141020877


