Study on QSTR of Benzoic Acid Compounds with MCI


Abstract
:1. Introduction
2. Research Methods
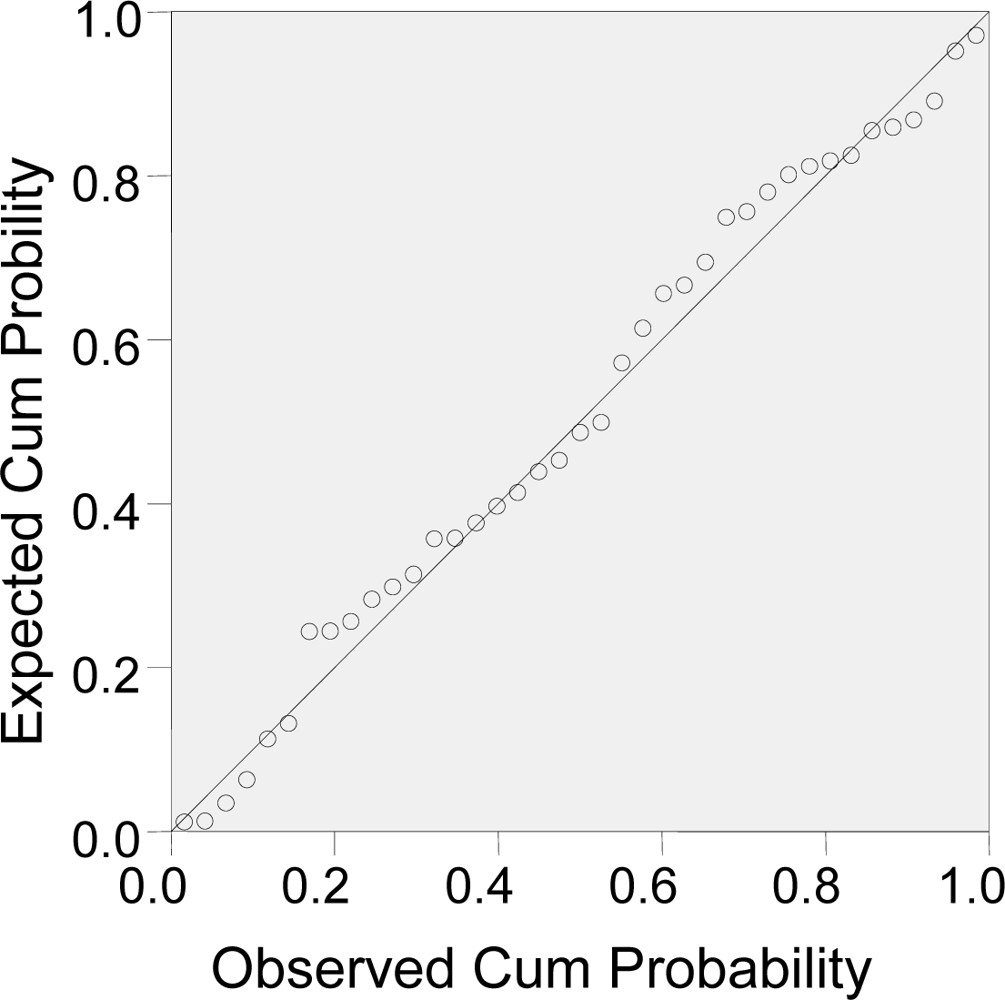
3. Results and Discussion
- 0JA: R-Square = 0.9542 and C(p) = 1.0000
- 1JA: R-Square = 0.9560 and C(p) = 1.0000
- JB: R-Square = 0.8656 and C(p) = 1.0000
- 0JA, 1JA: R-Square = 0.9560 and C(p) = 0.2565
- 0JA, JB: R-Square = 0.9829 and C(p) = 2.0000
- 1JA, JB: R-Square = 0.9816 and C(p) = 2.0000
- 0JA, 1JA: JB: R-Square = 0.9860 and C(p) = 3.0000
4. Conclusions
Acknowledgments
References and Notes
- Sun, YZ; Yan, XL; Li, ZJ; Meng, FH. Application of Chemical Models in Toxicological Study. Chinese J. Environ. Health 2007, 24, 734–736. [Google Scholar]
- Mihai, VP; Ana-Maria, L. Introducing Spectral Structure Activity Relationship (S-SAR) Analysis. Application to Ecotoxicology. Int. J. Mol. Sci 2007, 8, 363–391. [Google Scholar]
- Mihai, VP; Ana-Maria, P; Marius, L; Luciana, I; Adrian, C. Quantum-SAR Extension of the Spectral-SAR Algorithm. Application to Polyphenolic Anticancer Bioactivity. Int. J. Mol. Sci 2009, 10, 1193–1214. [Google Scholar]
- Meng, FH; Sun, YZ; Li, ZJ; Yan, XL. The Application of QSAR in the Study of Chemicals Toxicity. Chem. Bioeng 2007, 24, 5–7. [Google Scholar]
- Randic, M. On characterization of molecular branching. J. Am. Chem. Soc 1975, 97, 6609–6615. [Google Scholar]
- Kier, LB; Murray, WJ; Randic, M; Hall, LH. Molecular connectvity I Relationship to non-specific local anesthetic activity. J. Pharm. Sci 1975, 64, 1971–1974. [Google Scholar]
- Hall, LH; Kier, LB; Murray, WJ. Molecular connectivity I. Relationship to water solubility and boiling point. J. Pharm. Sci 1975, 64, 1974–1977. [Google Scholar]
- Kier, LB; Murray, WJ; Randic, M. Molecular connectivity V connectivity series applied to density. J. Pharm. Sci 1976, 65, 1226–1230. [Google Scholar]
- Kier, LB; Murray, WJ; Randic, M; Hall, LH. Molecular connectivity VII Specific treatment of heteroatoms. J. Pharm. Sci 1976, 65, 1806–1809. [Google Scholar]
- Gayathri, P; Pande, V; Sivakumar, R; Gupta, SP. A quantitative structure-activity relationship study on some HIV-1 protease inhibitors using molecular connectivity index. Bioorgan. Med. Chem 2001, 11, 3059–3036. [Google Scholar]
- Roy, K; Leonard, JT. QSAR modeling of HIV-1 reverse transcriptase inhibitor 2-amino-6-arylsulfonylbenzonitriles and congeners using molecular connectivity and E-state parameters. Bioorgan. Med. Chem 2004, 12, 745–754. [Google Scholar]
- Agrawal, VK; Khadikar, PV. QSAR study on inhibitor of brain 3-hydroxy-anthranihc acid dioxygenase (3-HAO): A molecular connectivity approach. Bioorgan. Med. Chem 2001, 9, 3295. [Google Scholar]
- Gupta, S; Singh, M; Madan, AK. Applications of graph theory: Relationship of molecular connectivity index and atomic molecular connectivity index with anti-HSV activity. J. Mol. Struct 2001, 571, 147–152. [Google Scholar]
- Yu, XM; Yu, XS. A New Method for Calculation Valence Delta of Heteroatoms in Molecular Valence Connectivity Topological Index and Its Application. Chin. J. Organ. Chem 2001, 21, 658–667. [Google Scholar]
- Xu, SJ. Computer-Assisted Drug Molecular Design; Chemical industry press: Beijing, China, 2004. [Google Scholar]

| Variable parameters | Standard estimate | Error | Type II SS | F value | Pr > F |
|---|---|---|---|---|---|
| 0JA | 1.2399 | 0.4374 | 6.6827 | 8.04 | 0.0075 |
| 1JA | 2.6911 | 0.8057 | 9.2768 | 11.16 | 0.0020 |
| JB | –0.4445 | 0.0509 | 63.3327 | 76.16 | <0.0001 |
| No. | Compound | CAS No. | LogLD50 | Std error (predicted) | Residual | |
|---|---|---|---|---|---|---|
| Dependent variable | Predicted value | |||||
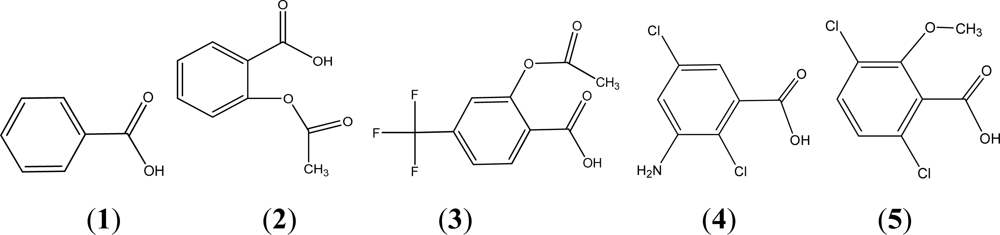
| 1 | benzamide | 55-21-0 | 7.056 | 7.187 | 0.189 | –0.131 |
| 2 | 4-aminobenzoic acid | 150-13-0 | 7.955 | 7.264 | 0.174 | 0.691 |
| 3 | 4-chlorobenzoic acid | 74-11-3 | 7.065 | 7.254 | 0.175 | –0.189 |
| 4 | 3-hydroxybenzoic acid | 99-06-9 | 7.601 | 7.236 | 0.176 | 0.362 |
| 5 | 4-bromobenzoic acid | 586-76-5 | 6.965 | 7.283 | 0.172 | –0.318 |
| 6 | 2-iodobenzoic acid | 88-67-5 | 7.313 | 7.310 | 0.170 | 0.003 |
| 7 | amino salicylic acid | 65-49-6 | 8.294 | 7.334 | 0.169 | 0.960 |
| 8 | methyl benzoate | 93-58-3 | 8.111 | 7.490 | 0.172 | 0.621 |
| 9 | 3-aminobenzoic acid | 99-05-8 | 8.748 | 7.264 | 0.174 | 1.484 |
| 10 | 3-methylbenzoic acid | 99-04-7 | 7.396 | 7.496 | 0.151 | –0.100 |
| 11 | 4-hydroxybenzoic acid | 99-96-7 | 7.696 | 7.239 | 0.176 | 0.457 |
| 12 | 4-methylbenzoic acid | 99-94-5 | 7.758 | 7.496 | 0.151 | 0.262 |
| 13 | 6-methylsalicylic acid | 567-61-3 | 5.522 | 7.518 | 0.155 | –1.997 |
| 14 | 3,5-diiodosalicylic acid | 133-91-5 | 6.109 | 7.460 | 0.170 | –1.351 |
| 15 | 2-acetyloxybenzoic acid (aspirin) | 50-78-2 | 5.522 | 7.493 | 0.201 | –1.971 |
| 16 | 2,4,6-triiodobenzoic acid | 2012-31-9 | 7.170 | 7.490 | 0.170 | –0.320 |
| 17 | 3,4,5-triiodobenzoic acid | 2338-20-7 | 8.434 | 7.490 | 0.170 | 0.944 |
| 18 | 4-tert-butylbenzoic acid | 98-73-7 | 6.342 | 6.617 | 0.481 | –0.274 |
| 19 | 2-formylbenzoic acid | 119-67-5 | 8.407 | 7.411 | 0.160 | 0.997 |
| 20 | 2-hydroxybenzamide (salicylamide) | 65-45-2 | 5.704 | 7.306 | 0.181 | –1.603 |
| 21 | 2-hydroxybenzoic acid (salicylic acid) | 69-72-7 | 6.174 | 7.243 | 0.176 | –1.069 |
| 22 | 2-aminobenzoic acid methyl ester | 134-20-3 | 8.269 | 7.513 | 0.196 | 0.756 |
| 23 | 2-(acetyl amino)benzoic acid | 89-52-1 | 7.016 | 7.481 | 0.405 | –0.465 |
| 24 | 2-amino-3,5-dichlorobenzoic acid | 2789-92-6 | 7.185 | 7.412 | 0.173 | –0.227 |
| 25 | 4-hydroxy-3,5-diiodobenzoic acid | 618-76-8 | 8.294 | 7.460 | 0.170 | 0.834 |
| 26 | 3,5-diiodo-4-methoxybenzoic acid | 4253-11-6 | 6.908 | 7.484 | 0.280 | –0.576 |
| 27 | 2,3,6-trichlorobenzoic acid (2,3,6-TBA) | 50-31-7 | 6.422 | 7.408 | 0.172 | –0.986 |
| 28 | 2-aminobenzoic acid (anthranilic acid) | 118-92-3 | 7.244 | 7.268 | 0.174 | –0.024 |
| 29 | 4-aminobenzoic acid ethyl ester (benzocaine) | 94-09-7 | 7.824 | 7.437 | 0.235 | 0.387 |
| 30 | 2-hydroxybenzoic acid methyl ester | 119-36-8 | 7.012 | 7.516 | 0.747 | –0.504 |
| 31 | 2,5-dihydroxybenzoic acid (gentisic acid) | 490-79-9 | 8.412 | 7.313 | 0.171 | 1.099 |
| 32 | 5-amino-2-hydroxybenzoic acid (mesalamine) | 89-57-6 | 8.123 | 7.334 | 0.169 | 0.789 |
| 33 | 3-amino-2,5-dichlorobenzoic acid (chloramben) | 133-90-4 | 8.223 | 7.412 | 0.173 | 0.811 |
| 34 | benzoic acid N,N-diethylamide (rebemide) | 1696-17-9 | 6.659 | 6.495 | 0.517 | 0.165 |
| 35 | 3,6-dichloro-2-methoxybenzoic acid (dicamba) | 1918-00-9 | 7.082 | 7.508 | 0.263 | –0.426 |
| 36 | 1,4-benzenedicarboxylic acid (terephthalic acid) | 100-21-0 | 8.071 | 7.469 | 0.153 | 0.602 |
| 37 | 2-hydroxy-5-methylbenzoic acid (p-cresotic acid) | 89-56-5 | 6.908 | 7.516 | 0.156 | –0.609 |
| 38 | 4-hydroxybenzoic acid propyl ester (propylparaben) | 94-13-3 | 8.753 | 7.062 | 0.405 | 1.692 |
| 39 | 2-hydroxy-3-methylbenzoic acid (hydroxytoluic acid) | 83-40-9 | 6.908 | 7.518 | 0.155 | –0.610 |
| LogLD50 | ||||
|---|---|---|---|---|
| No. | Compound | CAS No. | Dependent variable | Predicted value |
| 1 | benzoic acid | 65-85-0 | 7.57 | 7.16 |
| 2 | 2-benzoylbenzoic acid | 85-52-9 | 6.68 | 5.69 |
| 3 | 2,3,5-triiodobenzoic acid | 88-82-4 | 6.55 | 7.49 |
| 4 | 2-benzoyl-5-chlorobenzoic acid | 1147-42-8 | 6.35 | 6.16 |
| 5 | 5-amino-2-benzoylbenzoic acid | 2162-57-4 | 7.44 | 6.14 |
| 6 | 2-acetoxy-5-bromobenzoic acid | 1503-53-3 | 6.48 | 7.43 |
| 7 | 4-methylbenzoic acid methyl ester | 99-75-2 | 8.24 | 7.47 |
| 8 | 2-hydroxy-3,6-dichlorobenzoic acid | 3401-80-7 | 6.49 | 7.40 |
| 9 | benzoic acid 3-hydroxyphenyl ester | 136-36-7 | 6.68 | 6.06 |
| 10 | 6-benzoyl-3-methylbenzoic acid | 1147-41-7 | 6.80 | 5.28 |
| 11 | 3,4,5-trihydroxybenzoic acid propyl ester | 121-79-9 | 7.44 | 6.78 |
| 12 | 2-hydroxybenzoic acid 2-methylpropyl ester | 87-19-4 | 8.54 | 6.33 |
| 13 | 2-(3-chloro-2-methylphenylamino) benzoic acid | 13710-19-5 | 5.63 | 4.52 |
| 14 | 3-acetylamino-2,4,6-triiodobenzoic acid (acetrizoate) | 85-36-9 | 9.90 | 7.13 |
| 15 | benzoic acid 2-methylpropyl ester (isobutyl benzoate) | 120-50-3 | 8.48 | 6.50 |
| 16 | 2-(2,3-dimethylphenyl)aminobenzoic acid (mefenafic acid) | 61-68-7 | 6.26 | 3.29 |
| 17 | 2-acetyloxy-4-trifluoromethylbenzoic acid (triflusal) | 322-79-2 | 6.08 | 6.32 |
| 18 | 1,1′-biphenyl-2′,4′-difluoro-4-hydroxy-3-carboxylic acid (diflunisal) | 22494-42-4 | 6.08 | 5.87 |
© 2010 by the authors; licensee Molecular Diversity Preservation International, Basel, Switzerland. This article is an open-access article distributed under the terms and conditions of the Creative Commons Attribution license (http://creativecommons.org/licenses/by/3.0/).
Share and Cite
Li, Z.; Sun, Y.; Yan, X.; Meng, F. Study on QSTR of Benzoic Acid Compounds with MCI. Int. J. Mol. Sci. 2010, 11, 1228-1235. https://doi.org/10.3390/ijms11041228
Li Z, Sun Y, Yan X, Meng F. Study on QSTR of Benzoic Acid Compounds with MCI. International Journal of Molecular Sciences. 2010; 11(4):1228-1235. https://doi.org/10.3390/ijms11041228
Chicago/Turabian StyleLi, Zuojing, Yezhi Sun, Xinli Yan, and Fanhao Meng. 2010. "Study on QSTR of Benzoic Acid Compounds with MCI" International Journal of Molecular Sciences 11, no. 4: 1228-1235. https://doi.org/10.3390/ijms11041228
APA StyleLi, Z., Sun, Y., Yan, X., & Meng, F. (2010). Study on QSTR of Benzoic Acid Compounds with MCI. International Journal of Molecular Sciences, 11(4), 1228-1235. https://doi.org/10.3390/ijms11041228