Sage Tea Drinking Improves Lipid Profile and Antioxidant Defences in Humans

Abstract
:1. Introduction
2. Results and Discussion
2.1. Effects of Salvia officinalis on Blood Glucose Regulation, Plasma Aminotransferase Activity, Blood Pressure, Heart Rate at Rest and Body Weight
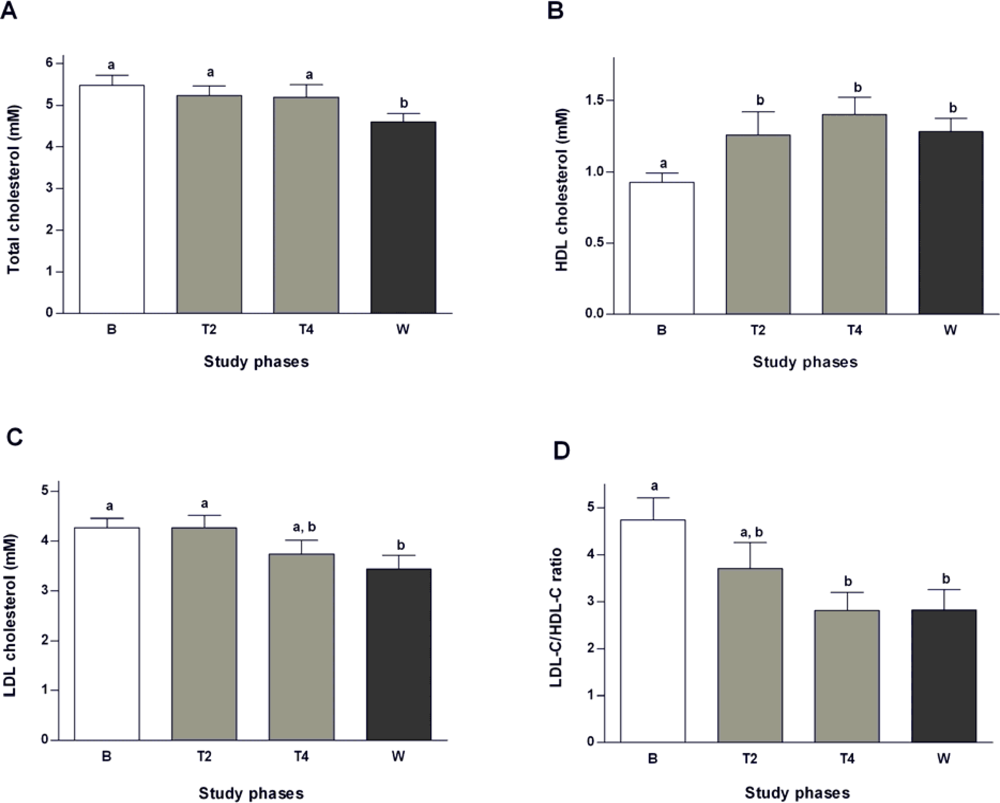
2.2. Effects of Salvia officinalis on Lipid Profile
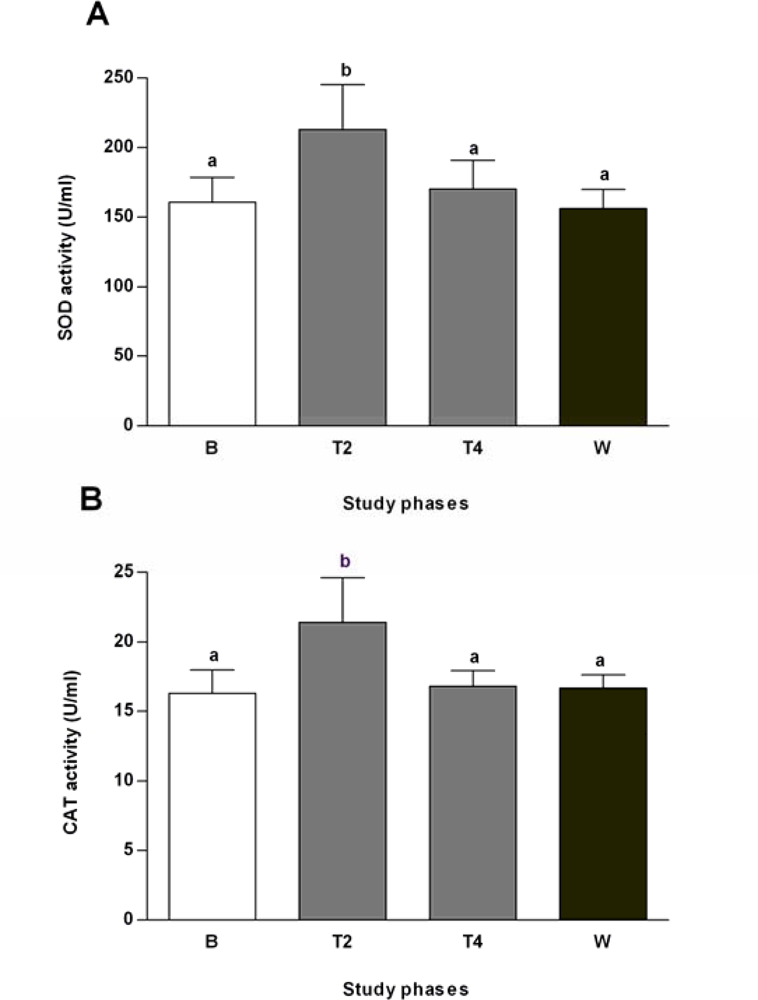
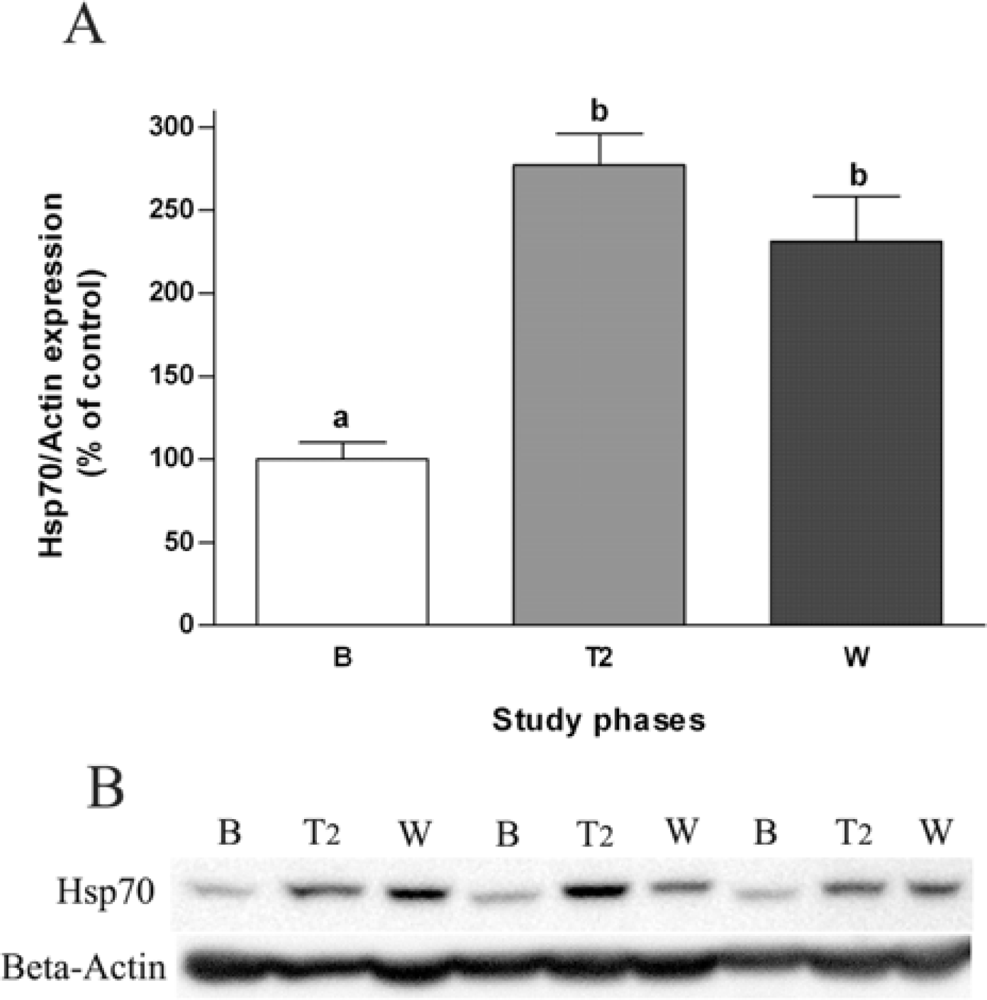
2.3. Effects of Salvia officinalis on Antioxidant Defences and Heat-shock Protein 70 (Hsp70) Expression
3. Experimental Section
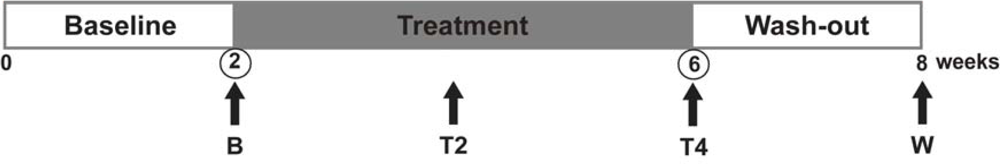
3.1. Subjects and Study Design
3.2. Plant Material and Preparation of S. officinalis Tea
3.3. Blood Samples, Erythrocytes’ Hemolysates and Lymphocytes Lysates
3.4. Measurement of Blood and Plasma Parameters
3.4.1. Quantification of Glucose Levels and Oral Glucose Tolerance Test (OGTT)
3.4.2. Characterization of Lipid Profile
3.4.3. Quantification of Plasma Aminotransferases
3.4.4. Quantification of Erythrocytes’ Antioxidant Defences
3.4.5. Western Blot Analyses
3.5. Statistical Analysis
4. Conclusions
Acknowledgments
References and Notes
- Williams, G; Pickup, JC. Handbook of Diabetes, 3rd ed; Blackwell Publishing Ltd: Oxford, UK, 2004; pp. 55–71. [Google Scholar]
- Moller, DE. New drug targets for type 2 diabetes and the metabolic syndrome. Nature 2001, 414, 821–827. [Google Scholar]
- Saxena, R; Madhu, SV; Shukla, R; Prabhu, KM; Gambhir, JK. Postprandial hypertriglyceridemia and oxidative stress in patients of type 2 diabetes mellitus with macrovascular complications. Clin. Chim. Acta 2005, 359, 101–108. [Google Scholar]
- Toth, PP. High-density lipoprotein as a therapeutic target: Clinical evidence and treatment strategies. Am. J. Cardiol 2005, 96, 50K–58K. [Google Scholar]
- Veiraiah, A. Hyperglycemia, lipoprotein glycation, and vascular disease. Angiology 2005, 56, 431–438. [Google Scholar]
- Celik, I; Isik, I. Determination of chemopreventive role of Foeniculum vulgare and Salvia officinalis infusion on trichloroacetic acid-induced increased serum marker enzymes lipid peroxidation and antioxidative defense systems in rats. Nat. Prod. Res 2008, 22, 66–75. [Google Scholar]
- Matés, JM; Pérez-Gómez, C; Castro, IN. Antioxidant enzymes and human diseases. Clin. Biochem 1999, 32, 595–603. [Google Scholar]
- Feder, ME; Hofmann, GE. Heat-shock proteins, molecular chaperones, and the stress response: Evolutionary and ecological physiology. Annu. Rev. Physiol 1999, 61, 243–282. [Google Scholar]
- Bonassi, S; Au, WW. Biomarkers in molecular epidemiology studies for health risk prediction. Mutat. Res. 2002, 511, 73–86. [Google Scholar]
- Jin, X; Wang, R; Xiao, C; Cheng, L; Wang, F; Yang, L; Feng, T; Chen, M; Chen, S; Fu, X; Deng, J; Wang, R; Tang, F; Wei, Q; Tanguay, RM; Wu, T. Serum and lymphocyte levels of heat shock protein 70 in aging: A study in the normal Chinese population. Cell Stress Chaperon 2004, 9, 69–75. [Google Scholar]
- Costacou, T; Mayer-Davis, EJ. Nutrition and prevention of type 2 diabetes. Annu. Rev. Nutr. 2003, 23, 147–170. [Google Scholar]
- Gruber, A; Nasser, K; Smith, R; Sharma, JC; Thomson, GA. Diabetes prevention: Is there more to it than lifestyle changes? Int. J. Clin. Pract 2006, 60, 590–594. [Google Scholar]
- Jermendy, G. Can type 2 diabetes mellitus be considered preventable? Diabetes Res. Clin. Pract 2005, 68, S73–S81. [Google Scholar]
- Fernandes, NP; Lagishetty, CV; Panda, VS; Naik, SR. An experimental evaluation of the antidiabetic and antilipidemic properties of a standardized Momordica charantia fruit extract. BMC Complement Altern. Med. 2007, 24, 7–29. [Google Scholar]
- Kumar, GP; Sudheesh, S; Vijayalakshmi, NR. Hypoglycaemic effect of Coccinia indica: Mechanism of action. Planta Med 1993, 59, 330–332. [Google Scholar]
- Venkateswaran, S; Pari, L. Effect of Coccinia indica leaves on antioxidant status in streptozotocin-induced diabetic rats. J. Ethnopharmacol 2003, 84, 163–168. [Google Scholar]
- Coimbra, S; Santos-Silva, A; Rocha-Pereira, P; Rocha, S; Castro, E. Green tea consumption improves plasma lipid profile in adults. Nutr. Res 2006, 26, 604–607. [Google Scholar]
- Coimbra, S; Castro, E; Rocha-Pereira, P; Rebelo, I; Rocha, S; Santos-Silva, A. The effect of green tea in oxidative stress. Clin. Nutr 2006, 25, 790–796. [Google Scholar]
- Polychronopoulos, E; Zeimbekis, A; Kastorini, CM; Papairakleous, N; Vlachou, I; Bountziouka, V; Panagiotakos, DB. Effects of black and green tea consumption on blood glucose levels in non-obese elderly men and women from Mediterranean Islands (MEDIS epidemiological study). Eur. J. Nutr 2008, 47, 10–16. [Google Scholar]
- Alarcon-Aguilar, FJ; Roman-Ramos, R; Flores-Saenz, JL; Aguirre-Garcia, F. Investigation on the hypoglycaemic effects of extracts of four Mexican medicinal plants in normal and alloxan-diabetic mice. Phytother. Res 2002, 16, 383–386. [Google Scholar]
- Eidi, M; Eidi, A; Zamanizadeh, H. Effect of Salvia officinalis L. leaves on serum glucose and insulin in healthy and streptozotocin-induced diabetic rats. J. Ethnopharmacol 2005, 100, 310–313. [Google Scholar]
- Lima, CF; Azevedo, MF; Araujo, R; Fernandes-Ferreira, M; Pereira-Wilson, C. Metformin-like effects of Salvia officinalis (common sage): Is it useful in diabetes prevention? Br. J. Nutr. 2006, 96, 326–333. [Google Scholar]
- Jamal, MM; Soni, A; Quinn, PG; Wheeler, DE; Arora, S; Johnston, DE. Clinical features of hepatitis C-infected patients with persistently normal alanine transaminase levels in the Southwestern United States. Hepatology 1999, 30, 1307–1311. [Google Scholar]
- Kim, HC; Nam, CM; Jee, SH; Han, KH; Oh, DK; Suh, I. Normal serum aminotransferase concentration and risk of mortality from liver diseases: Prospective cohort study. BMJ 2004, 328, 983–986. [Google Scholar]
- Ravel, R. Tests for diabetes and hypoglycaemica. In Clinical Laboratory Medicine: Clinical Application of Laboratory Data, 5th ed; Mosby-Year Book Inc: St. Louis, MO, USA, 1989; Chapter 27, pp. 463–466. [Google Scholar]
- Sullivan, DR. Screening for cardiovascular disease with cholesterol. Clin. Chim. Acta 2002, 315, 49–60. [Google Scholar]
- Nesto, RW. Beyond low-density lipoprotein: Addressing the atherogenic lipid triad in type 2 diabetes mellitus and the metabolic syndrome. Am. J. Cardiovasc. Drugs 2005, 5, 379–387. [Google Scholar]
- Plana, N; Nicolle, C; Ferre, R; Camps, J; Cós, R; Villoria, J; Masana, L; DANACOL group. Plant sterol-enriched fermented milk enhances the attainment of LDL-cholesterol goal in hypercholesterolemic subjects. Eur. J. Nutr 2008, 47, 32–39. [Google Scholar]
- Raederstorff, DG; Schlachter, MF; Elste, V; Weber, P. Effect of EGCG on lipid absorption and plasma lipid levels in rats. J. Nutr. Biochem 2003, 14, 326–332. [Google Scholar]
- Chen, YL; Yang, SP; Shiao, MS; Chen, JW; Lin, SJ. Salvia miltiorrhiza inhibits intimal hyperplasia and monocyte chemotactic protein-1 expression after balloon injury in cholesterol-fed rabbits. J. Cell Biochem 2001, 83, 484–493. [Google Scholar]
- Scalbert, A; Manach, C; Morand, C; Rémésy, C; Jiménez, L. Dietary polyphenols and the prevention of diseases. Crit. Rev. Food Sci. Nutr 2005, 45, 287–306. [Google Scholar]
- Lima, CF; Andrade, PB; Seabra, RM; Fernandes-Ferreira, M; Pereira-Wilson, C. The drinking of a Salvia officinalis infusion improves liver antioxidant status in mice and rats. J. Ethnopharmacol 2005, 97, 383–389. [Google Scholar]
- Lima, CF; Fernandes-Ferreira, M; Pereira-Wilson, C. Phenolic compounds protect HepG2 cells from oxidative damage: Relevance of glutathione levels. Life Sci 2006, 79, 2056–2068. [Google Scholar] [Green Version]
- Lima, CF; Valentao, PC; Andrade, PB; Seabra, RM; Fernandes-Ferreira, M; Pereira-Wilson, C. Water and methanolic extracts of Salvia officinalis protect HepG2 cells from t-BHP induced oxidative damage. Chem. Biol. Interact 2007, 167, 107–115. [Google Scholar]
- Lima, CF; Fernandes-Ferreira, M; Pereira-Wilson, C. Drinking of Salvia officinalis tea increases CCl(4)-induced hepatotoxicity in mice. Food Chem. Toxicol 2007, 45, 456–464. [Google Scholar]
- Gabai, VL; Meriin, AB; Mosser, DD; Caron, AW; Rits, S; Shifrin, VI; Sherman, MY. Hsp70 prevents activation of stress kinases. A novel pathway of cellular thermotolerance. J. Biol. Chem 1997, 272, 18033–18037. [Google Scholar]
- McCarty, MF. Induction of heat shock proteins may combat insulin resistance. Med. Hypotheses 2006, 66, 527–534. [Google Scholar]
- Meldrum, KK; Burnett, AL; Meng, X; Misseri, R; Shaw, MB; Gearhart, JP; Meldrum, DR. Liposomal delivery of heat shock protein 72 into renal tubular cells blocks nuclear factor-kappaB activation, tumor necrosis factor-alpha production, and subsequent ischemia-induced apoptosis. Circ. Res. 2003, 92, 293–299. [Google Scholar]
- Park, HS; Lee, JS; Huh, SH; Seo, JS; Choi, EJ. Hsp72 functions as a natural inhibitory protein of c-Jun N-terminal kinase. EMBO J 2001, 20, 446–456. [Google Scholar]
- Bruce, CR; Carey, AL; Hawley, JA; Febbraio, MA. Intramuscular heat shock protein 72 and heme oxygenase-1 mRNA are reduced in patients with type 2 diabetes: Evidence that insulin resistance is associated with a disturbed antioxidant defense mechanism. Diabetes 2003, 52, 2338–2345. [Google Scholar]
- Kurucz, I; Morva, A; Vaag, A; Eriksson, KF; Huang, X; Groop, L; Koranyi, L. Decreased expression of heat shock protein 72 in skeletal muscle of patients with type 2 diabetes correlates with insulin resistance. Diabetes 2002, 51, 1102–1109. [Google Scholar]
- Chung, J; Nguyen, AK; Henstridge, DC; Holmes, AG; Chan, MH; Mesa, JL; Lancaster, GI; Southgate, RJ; Bruce, CR; Duffy, SJ; Horvath, I; Mestril, R; Watt, MJ; Hooper, PL; Kingwell, BA; Vigh, L; Hevener, A; Febbraio, MA. HSP72 protects against obesity-induced insulin resistance. Proc. Natl. Acad. Sci. USA 2008, 105, 1739–1744. [Google Scholar]
- Gupte, AA; Bomhoff, GL; Morris, JK; Gorres, BK; Geiger, PC. Lipoic acid increases heat shock protein expression and inhibits stress kinase activation to improve insulin signaling in skeletal muscle from high-fat-fed rats. J. Appl. Physiol 2009, 106, 1425–1434. [Google Scholar]
- Putics, A; Végh, EM; Csermely, P; Soti, C. Resveratrol induces the heat-shock response and protects human cells from severe heat stress. Antioxid. Redox. Signal 2008, 10, 65–75. [Google Scholar]
- Yan, D; Saito, K; Ohmi, Y; Fujie, N; Ohtsuka, K. Paeoniflorin, a novel heat shock protein-inducing compound. Cell Stress Chaperones 2004, 9, 378–389. [Google Scholar]
- Aebi, H. Catalase in vitro. Methods Enzymol 1984, 105, 121–126. [Google Scholar]


| Parameters | Phases of the trial | |||
|---|---|---|---|---|
| B | T2 | T4 | W | |
| Weight (kg) | 56.2 ± 7.1 | 56.2 ± 6.1 | 55.6 ± 6.1 | 55.9 ± 5.9 |
| Systolic blood pressure (mmHg) | 116.1 ± 10.3 | 110.3 ± 14.5 | 110.7 ± 15.5 | 107.7 ± 13.2 |
| Diastolic blood pressure (mmHg) | 68.2 ± 9.4 | 64.5 ± 14.0 | 63.6 ± 11.7 | 59.5 ± 9.1 |
| Heart rate at rest (beats/min) | 65.9 ± 10.7 | 67.2 ± 10.9 | 66.6 ± 8.2 | 68.7 ± 9.9 |
| ALT (IU/L) | 7.3 ± 1.0 | 6.8 ± 1.4 | 8.4 ± 1.6 | 7.6 ± 1.5 |
| AST (IU/L) | 8.1 ± 1.1 | 10.0 ± 2.0 | 10.6 ± 1.8* | 9.8 ± 1.2 |
| Fasting glucose levelsa (mM) | 4.31 ± 1.18 | 4.60 ± 0.92 | 4.21 ± 1.54 | --- |
| Postprandial glucose levelsa (mM) | 5.33 ± 1.64 | 4.35 ± 0.53 | 4.88 ± 0.94 | 4.58 ± 0.90 |
| Blood glucose levels (mM) | |||
|---|---|---|---|
| Time | 0 min | 45 min | 165 min |
| Baseline | 4.3 ± 1.2 | 5.5 ± 1.2 | 4.3 ± 0.4 |
| Treatment (4 weeks) | 4.2 ± 1.5 | 6.9 ± 1.4 | 4.5 ± 0.9 |
© 2009 by the authors; licensee Molecular Diversity Preservation International, Basel, Switzerland. This article is an open-access article distributed under the terms and conditions of the Creative Commons Attribution license (http://creativecommons.org/licenses/by/3.0/).
Share and Cite
Sá, C.M.; Ramos, A.A.; Azevedo, M.F.; Lima, C.F.; Fernandes-Ferreira, M.; Pereira-Wilson, C. Sage Tea Drinking Improves Lipid Profile and Antioxidant Defences in Humans. Int. J. Mol. Sci. 2009, 10, 3937-3950. https://doi.org/10.3390/ijms10093937
Sá CM, Ramos AA, Azevedo MF, Lima CF, Fernandes-Ferreira M, Pereira-Wilson C. Sage Tea Drinking Improves Lipid Profile and Antioxidant Defences in Humans. International Journal of Molecular Sciences. 2009; 10(9):3937-3950. https://doi.org/10.3390/ijms10093937
Chicago/Turabian StyleSá, Carla M., Alice A. Ramos, Marisa F. Azevedo, Cristovao F. Lima, Manuel Fernandes-Ferreira, and Cristina Pereira-Wilson. 2009. "Sage Tea Drinking Improves Lipid Profile and Antioxidant Defences in Humans" International Journal of Molecular Sciences 10, no. 9: 3937-3950. https://doi.org/10.3390/ijms10093937
APA StyleSá, C. M., Ramos, A. A., Azevedo, M. F., Lima, C. F., Fernandes-Ferreira, M., & Pereira-Wilson, C. (2009). Sage Tea Drinking Improves Lipid Profile and Antioxidant Defences in Humans. International Journal of Molecular Sciences, 10(9), 3937-3950. https://doi.org/10.3390/ijms10093937