Calculation of the Aqueous Thermodynamic Properties of Citric Acid Cycle Intermediates and Precursors and the Estimation of High Temperature and Pressure Equation of State Parameters

Abstract
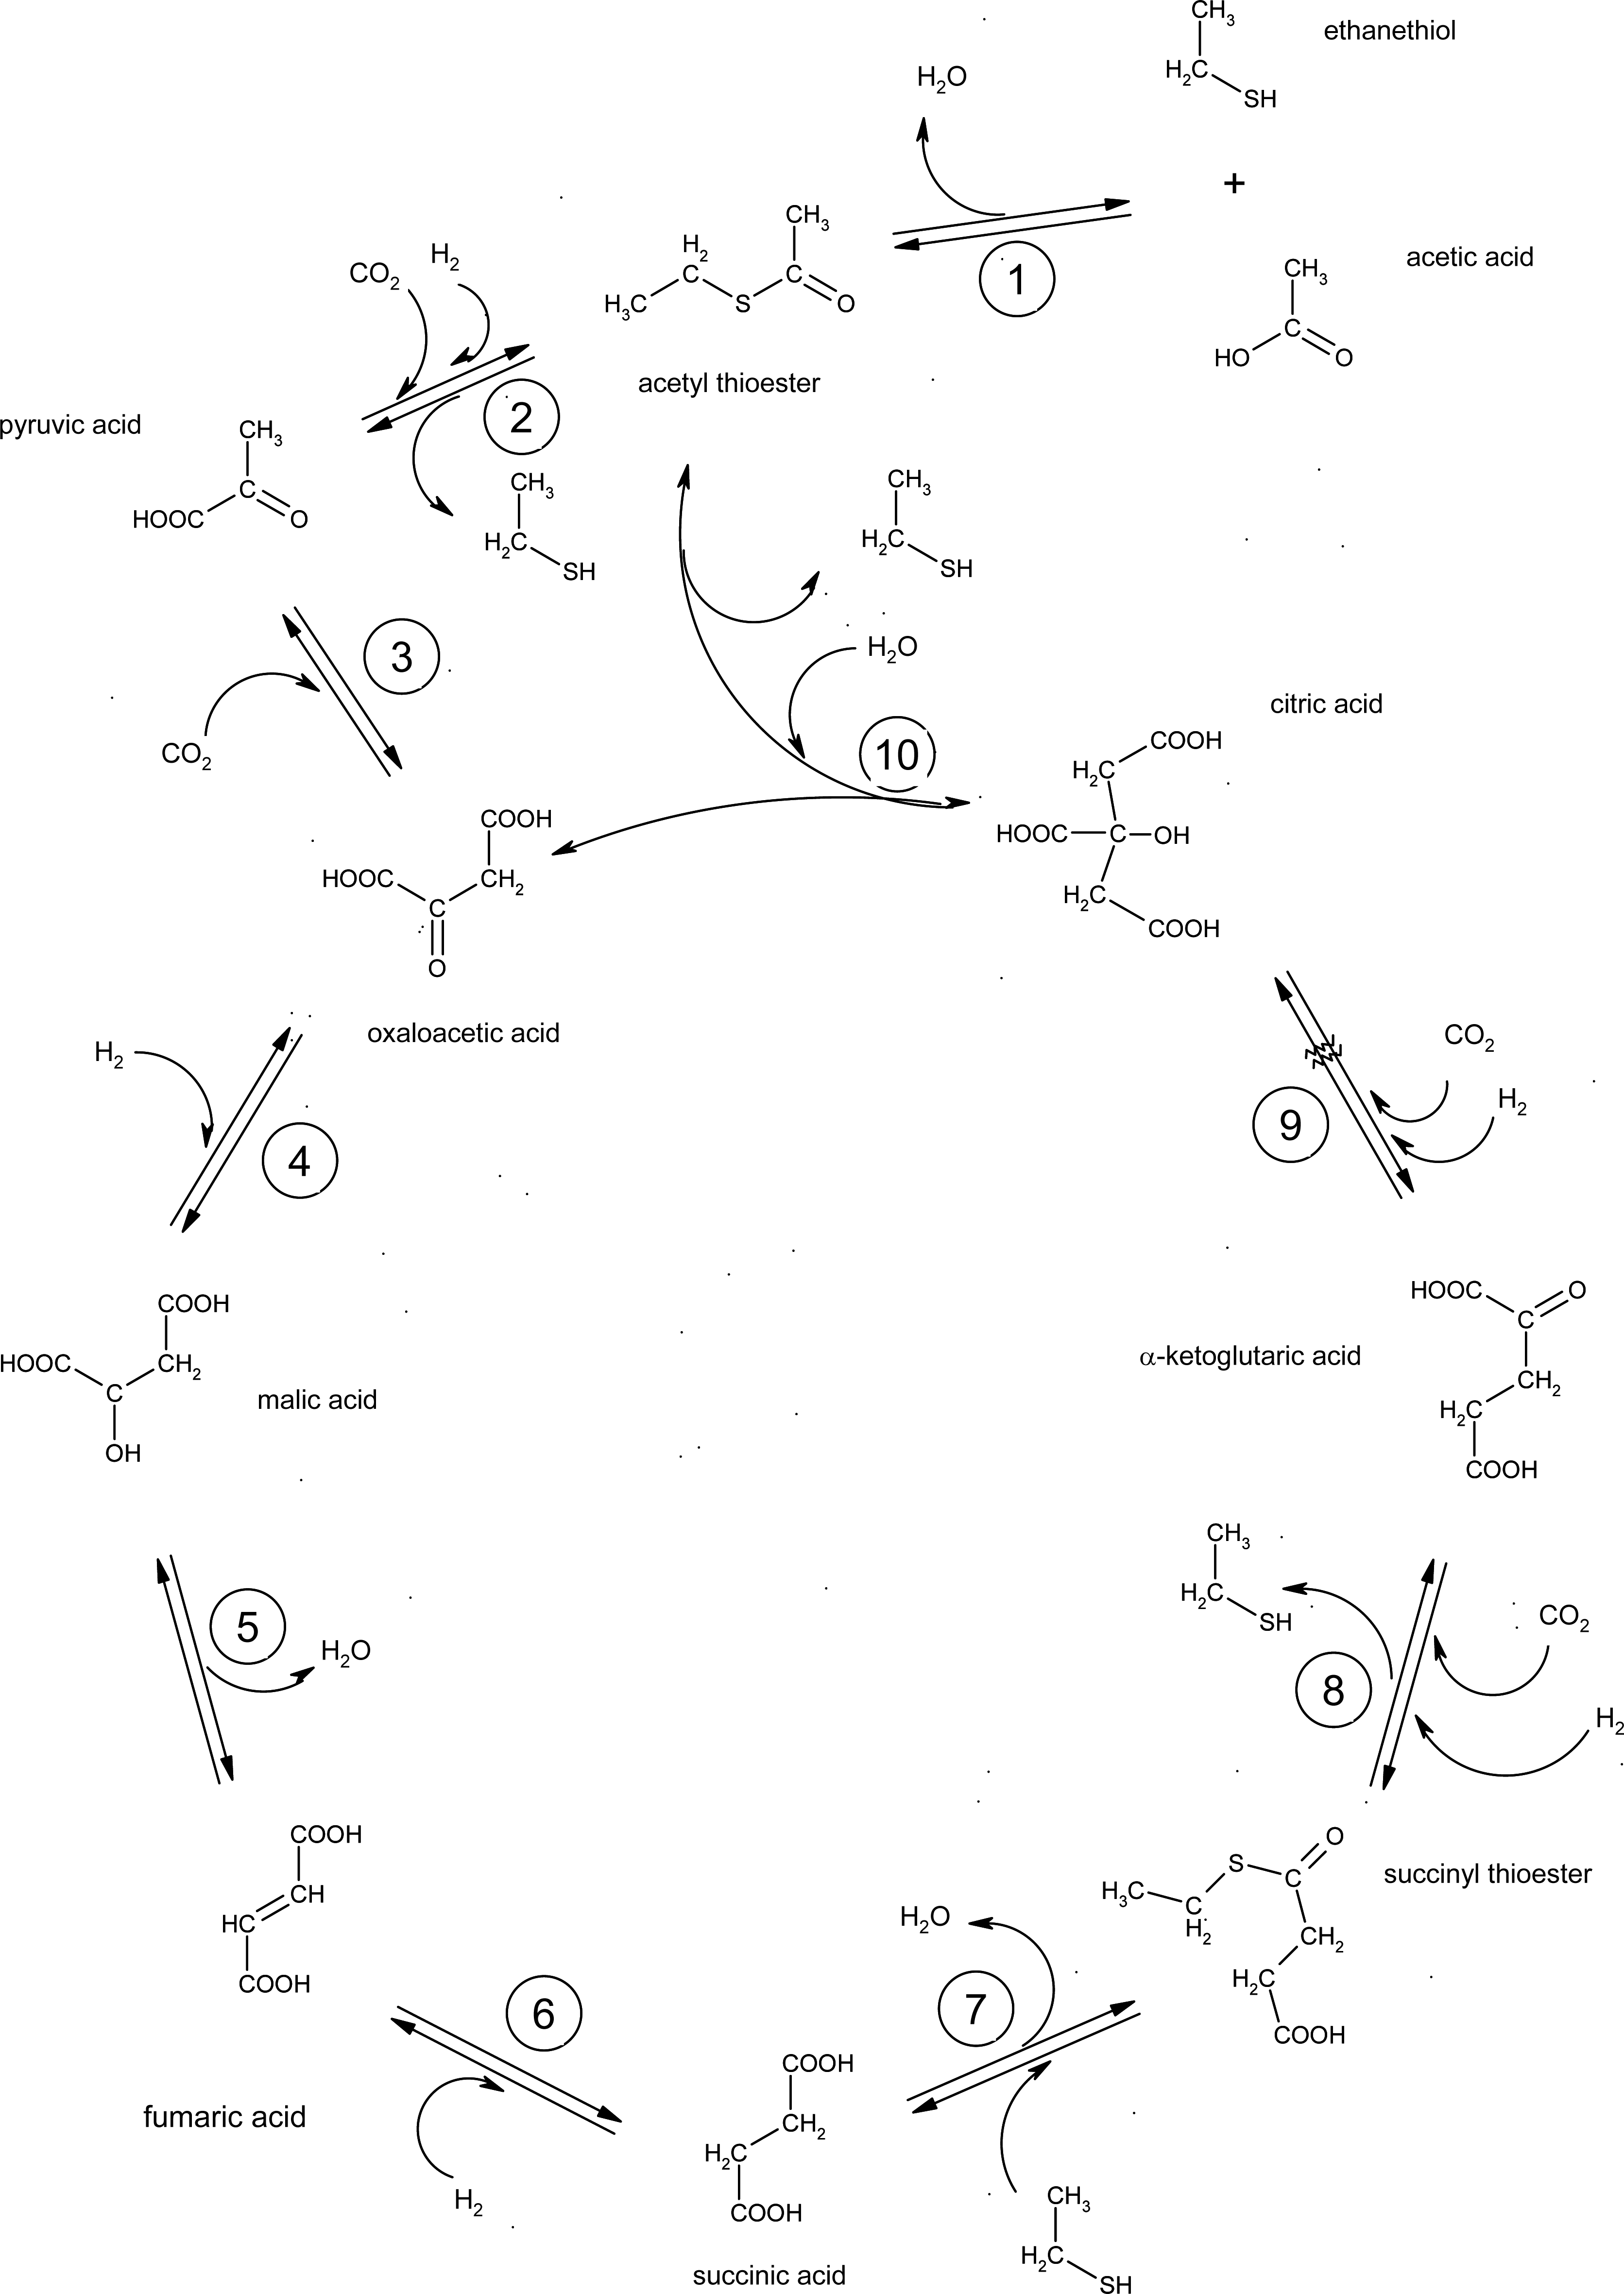
:1. Introduction
2. Methods
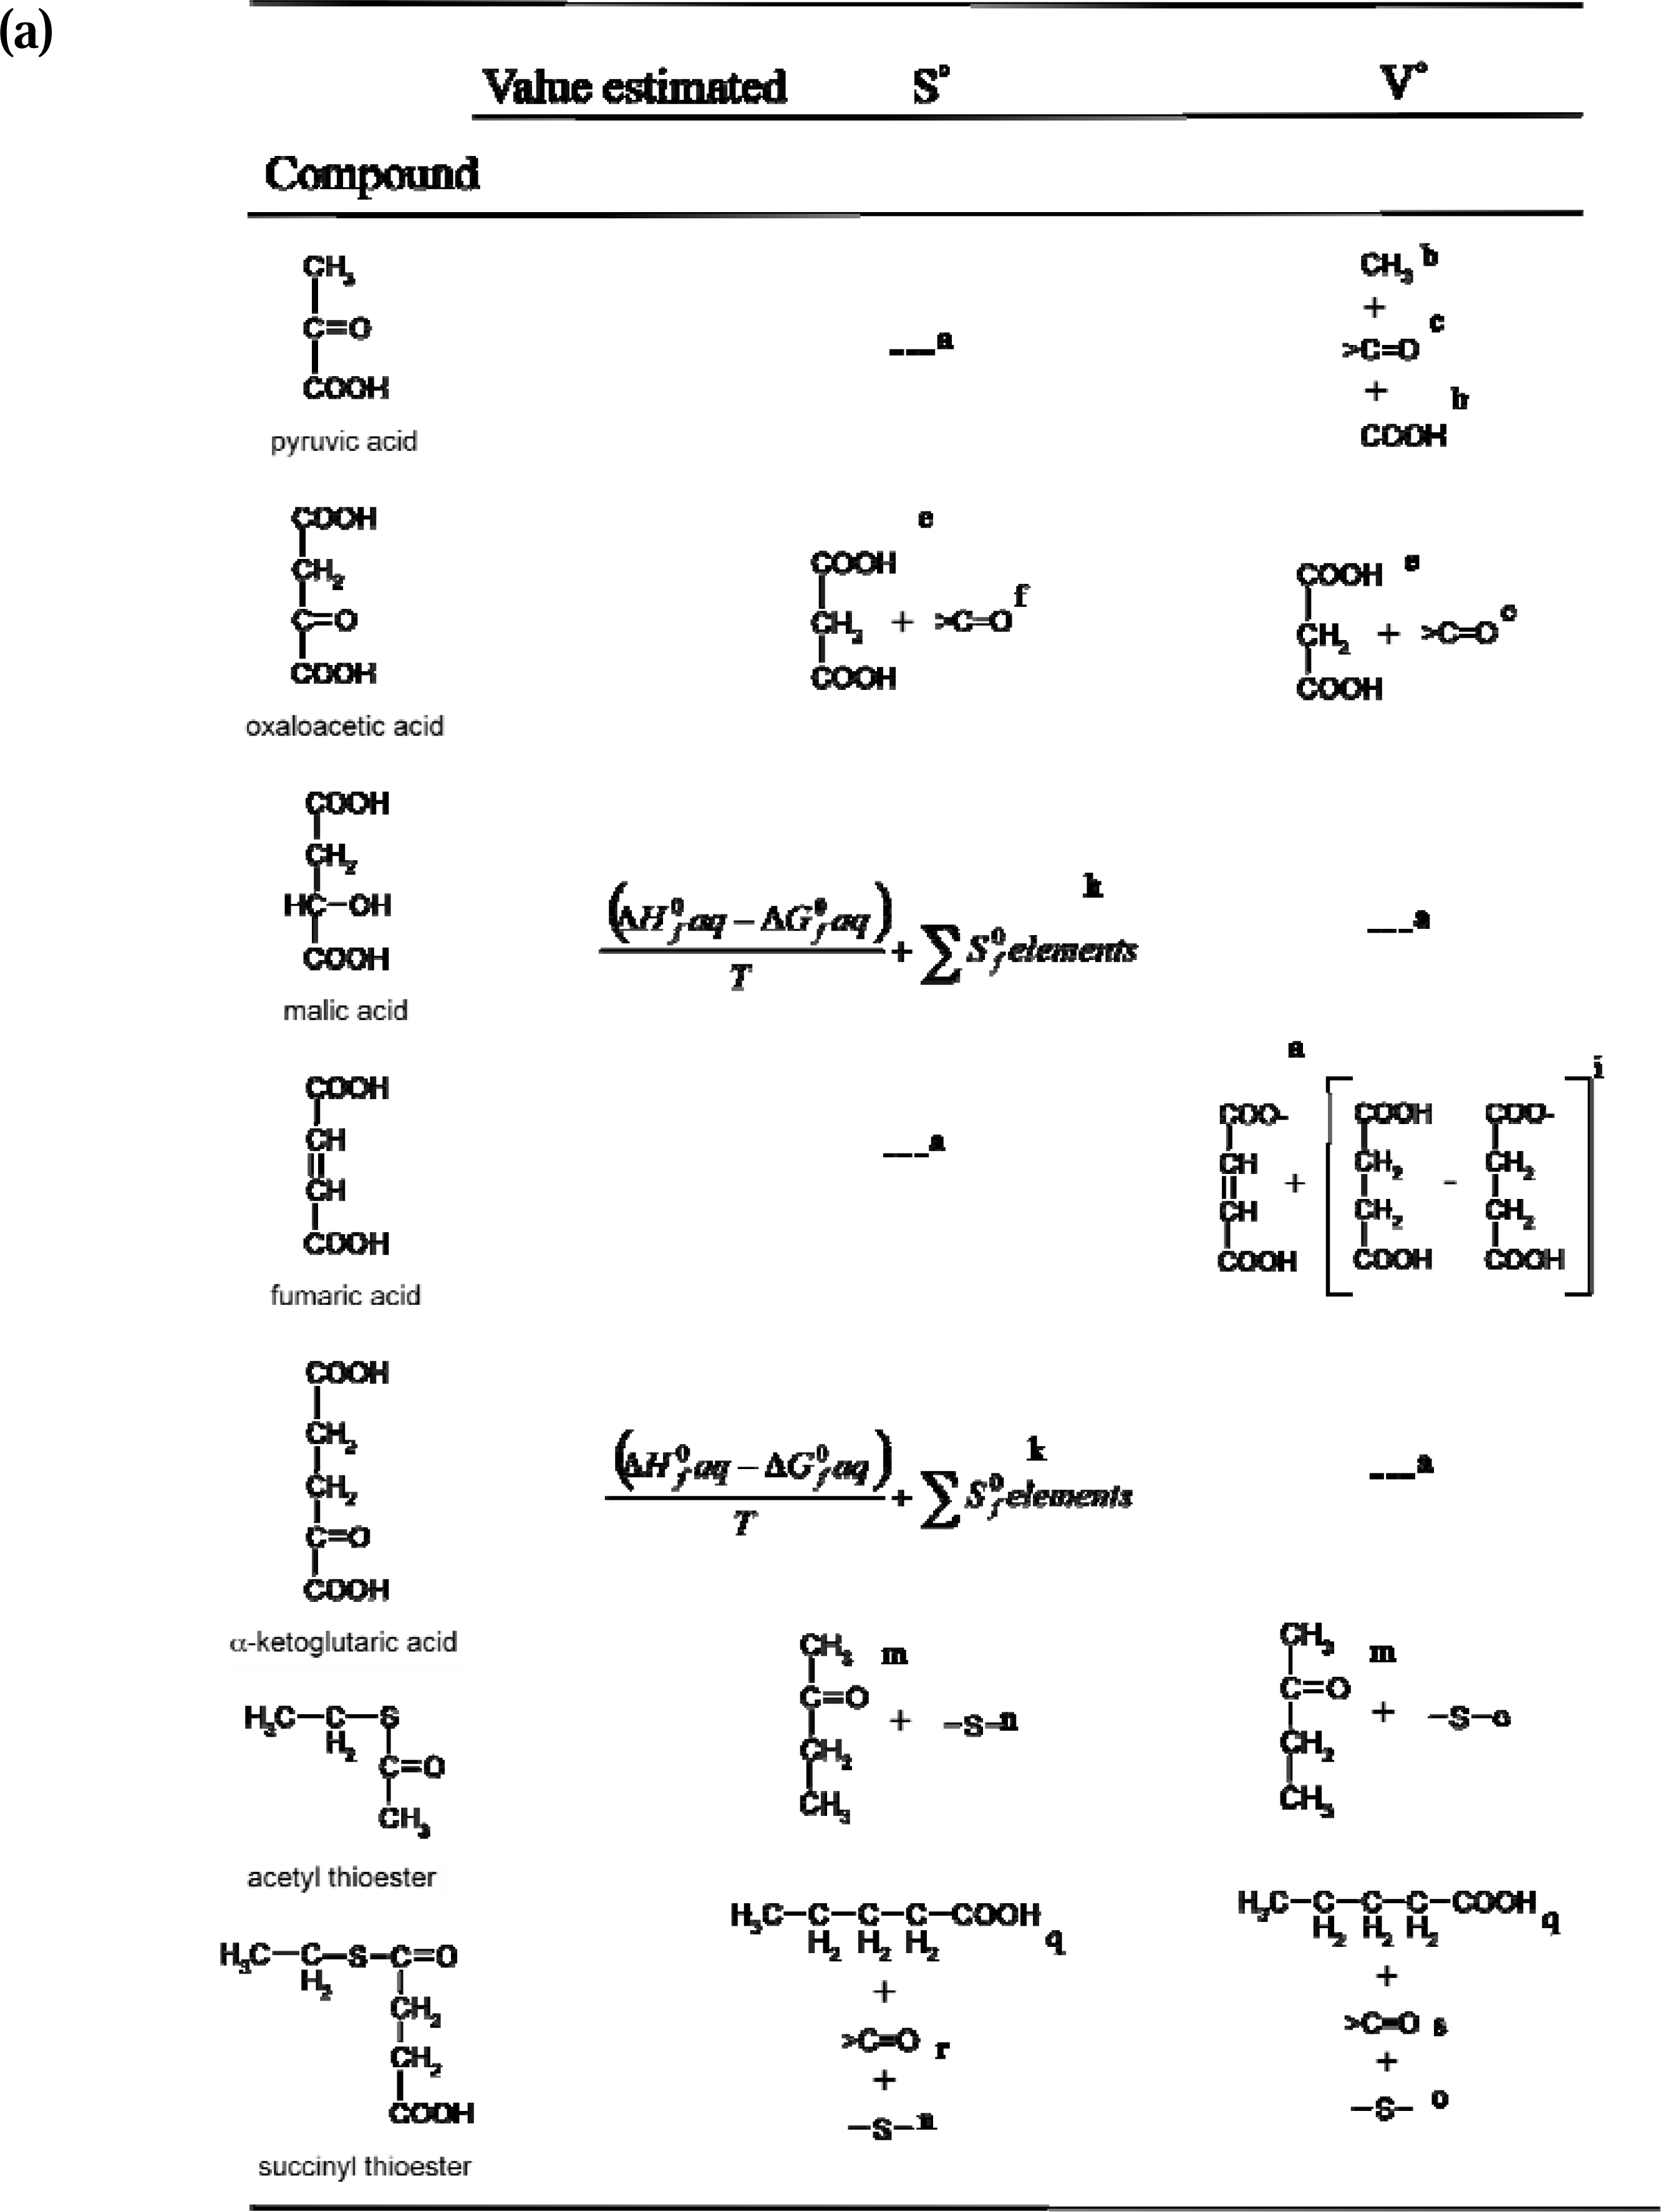
2.1. Strategy used for the estimation of missing reference state values
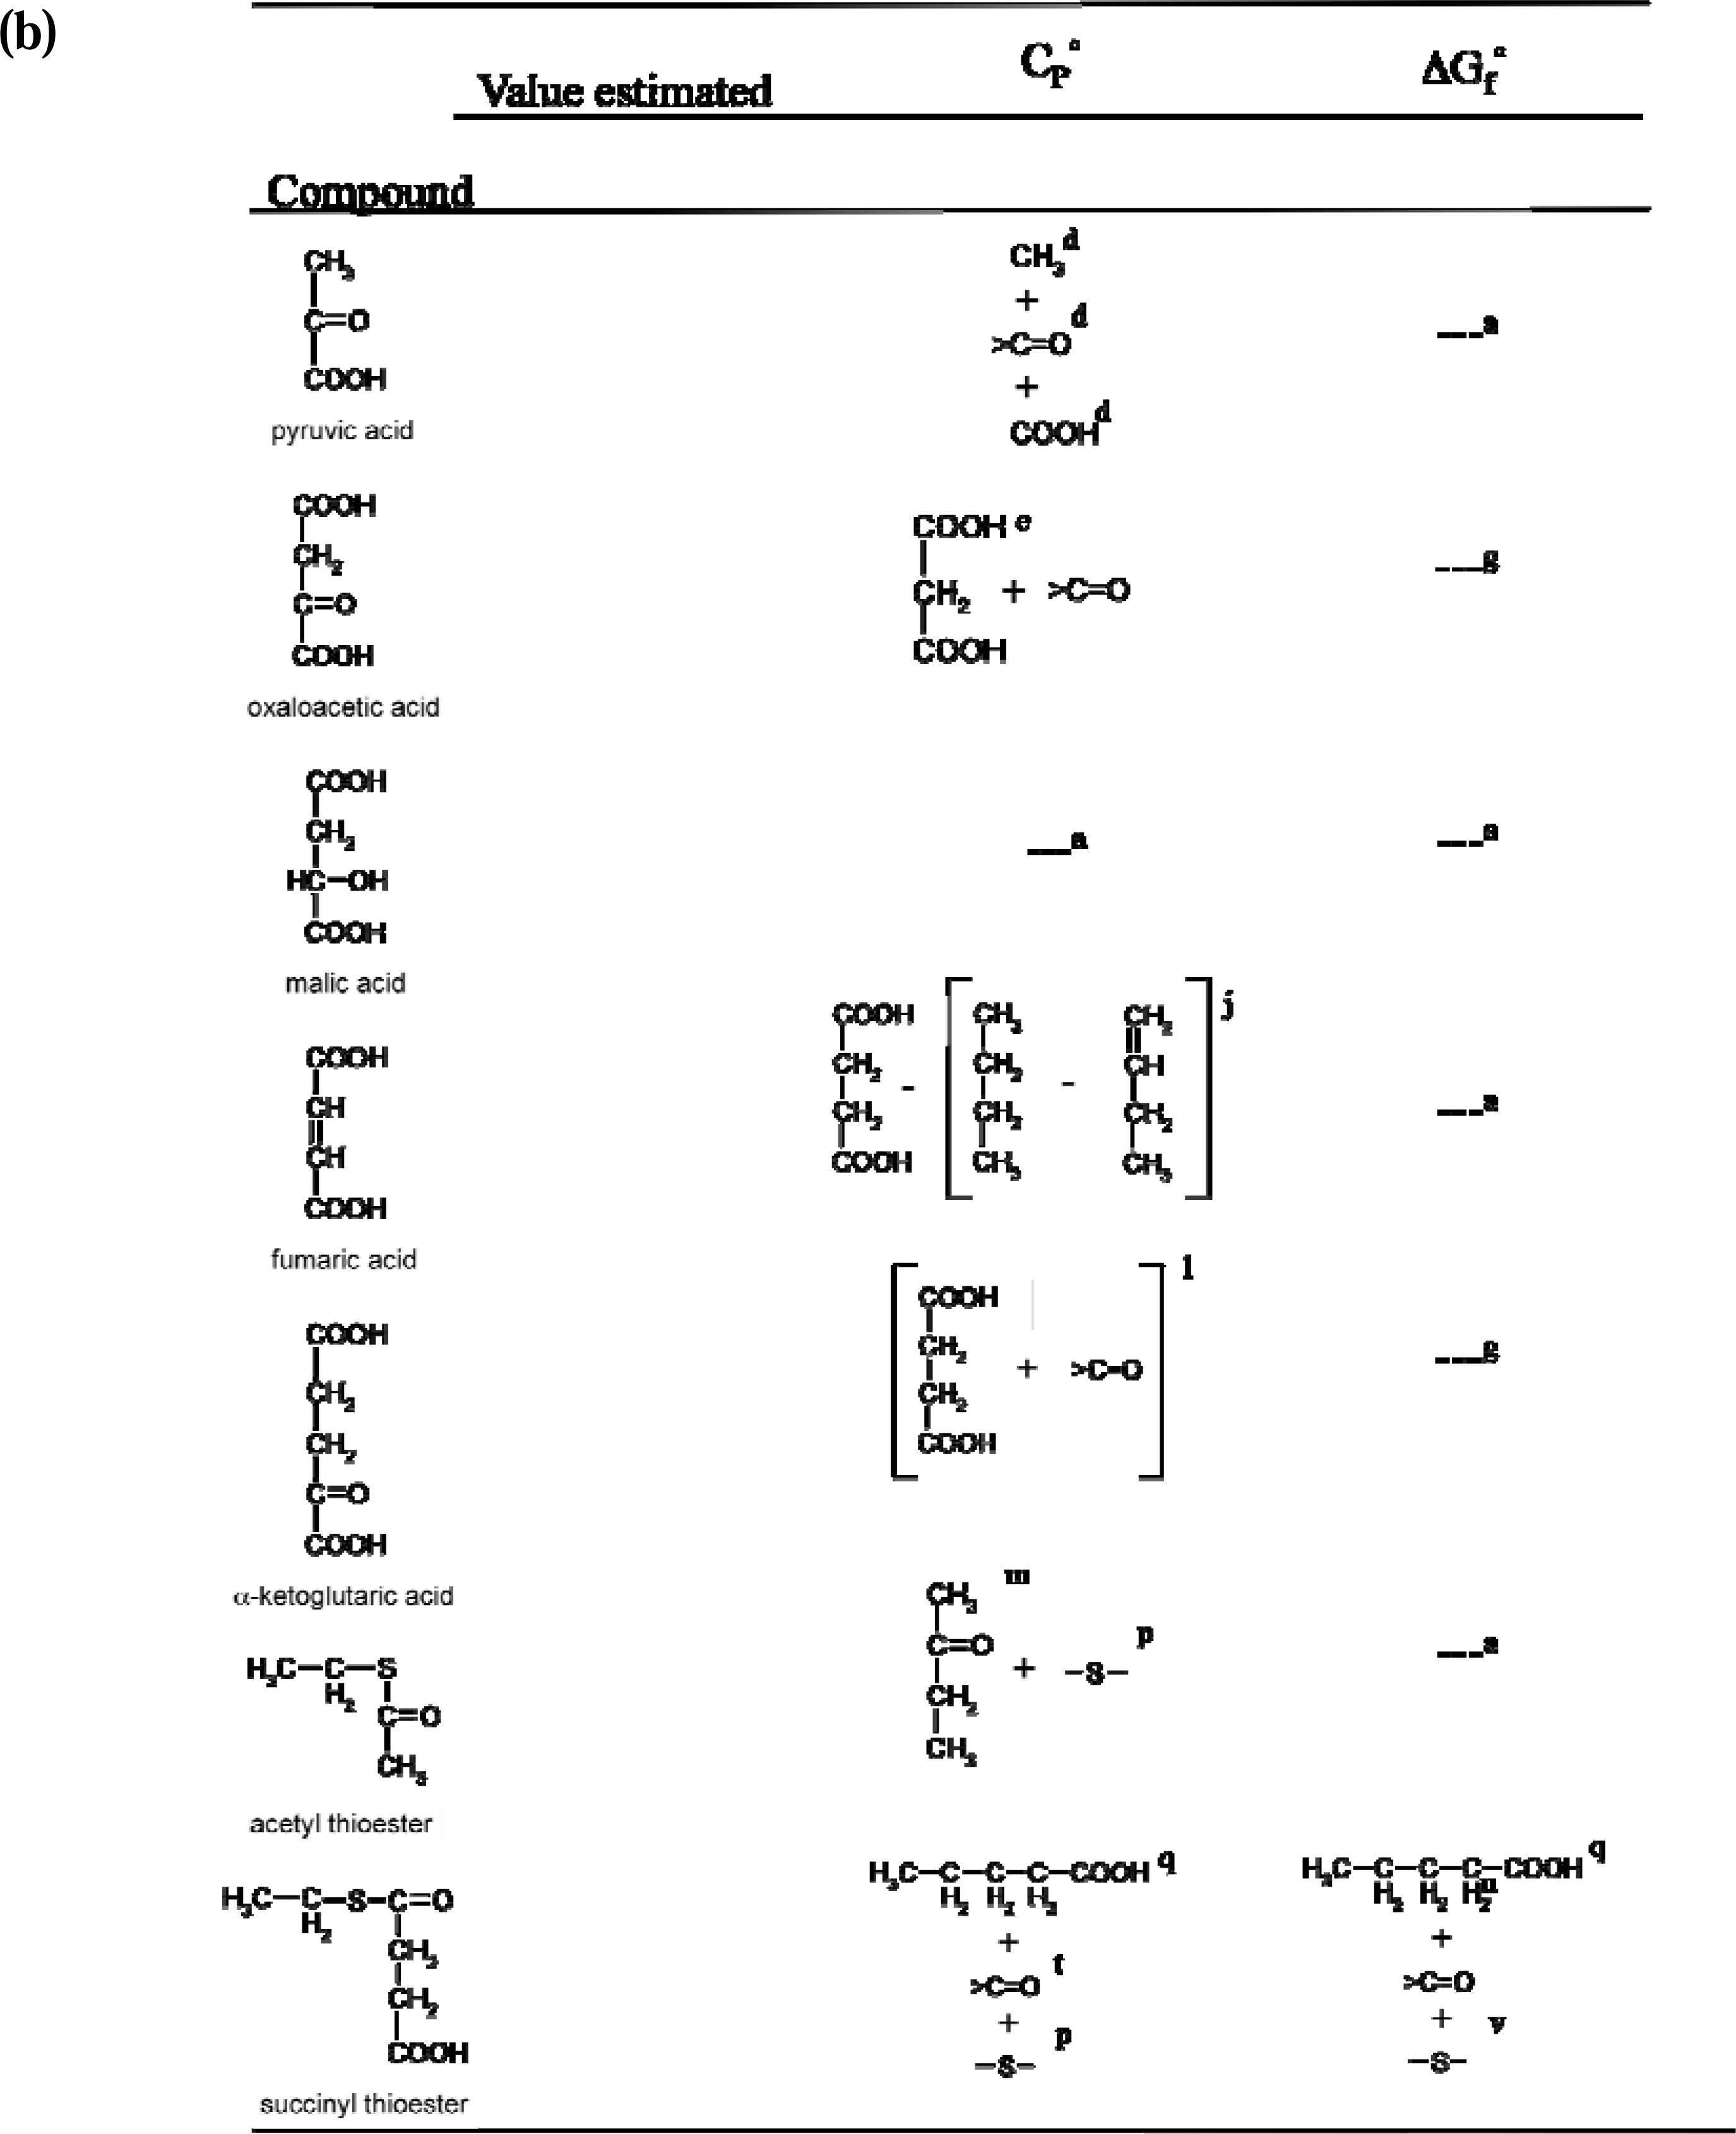
2.2. Calculation of reference state and estimation of missing values
2.3. Calculation of the reference state entropy (S0 aq) and estimation of missing values
2.4. Calculation of the reference state partial molal volume (V°aq) and estimation of missing values
2.5. Calculation of the reference state heat capacity (C°p aq) and estimation of missing values
2.6. Extrapolation of reference state data to high pressures and temperatures
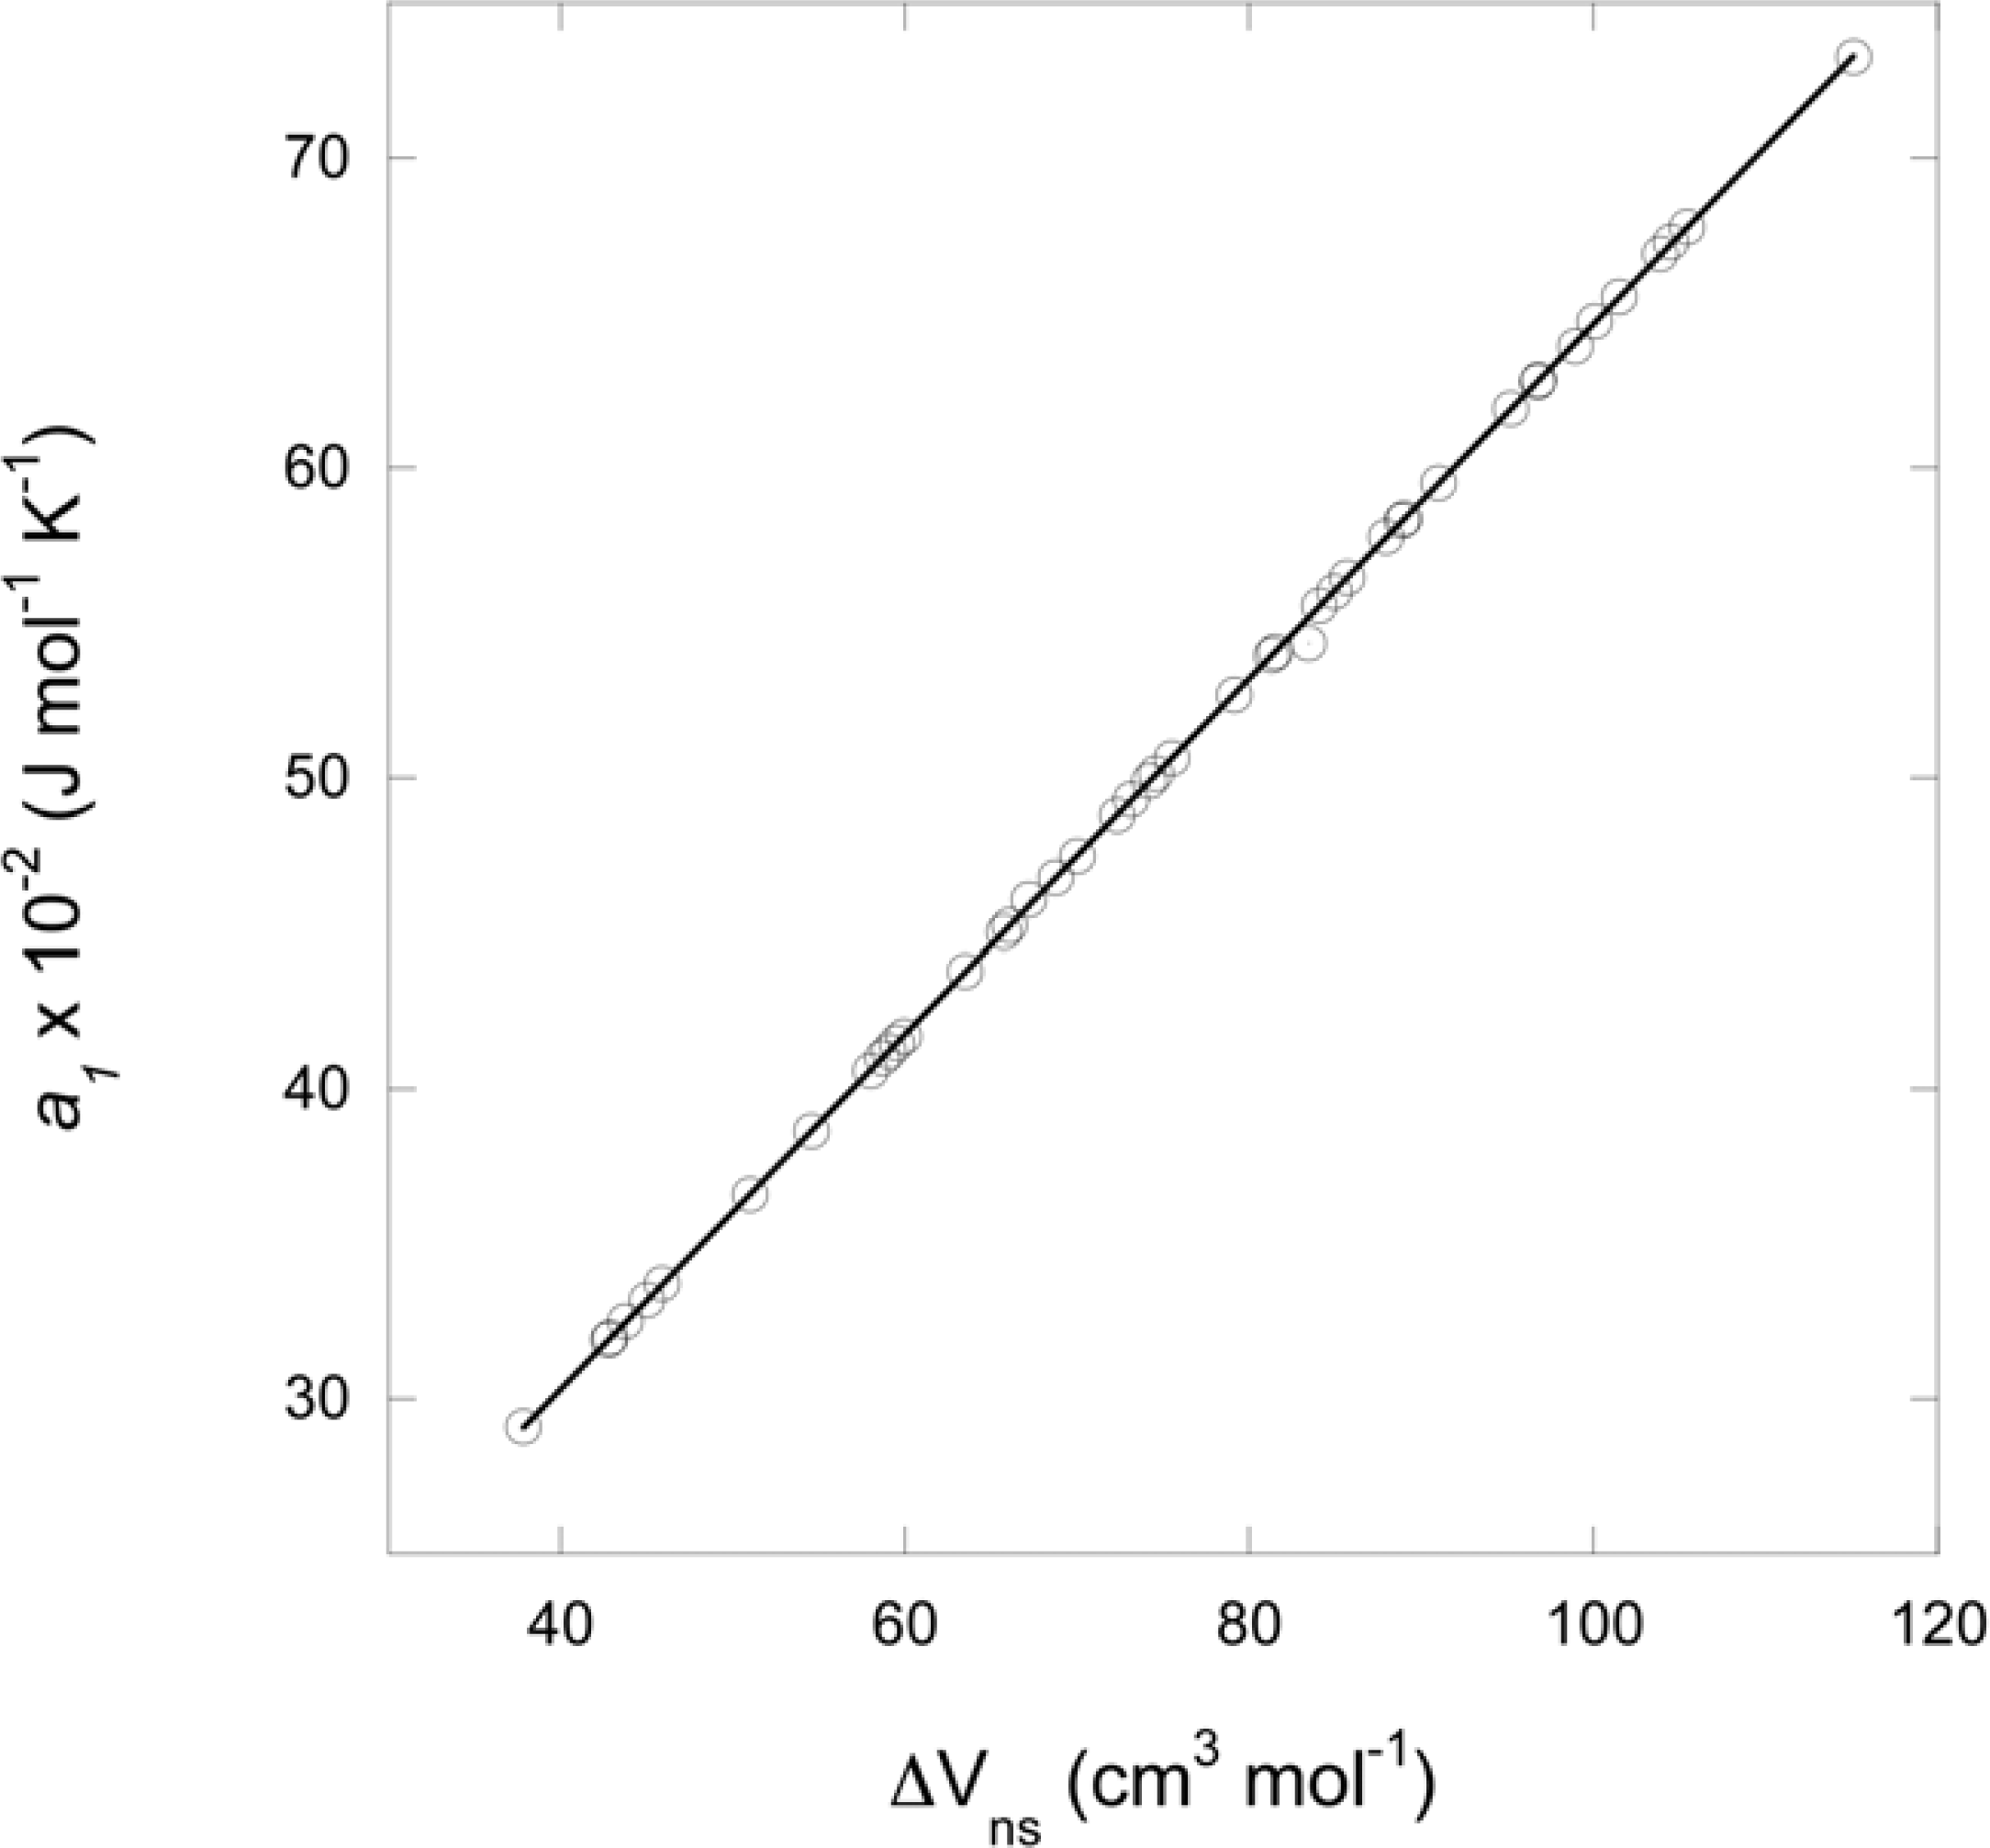
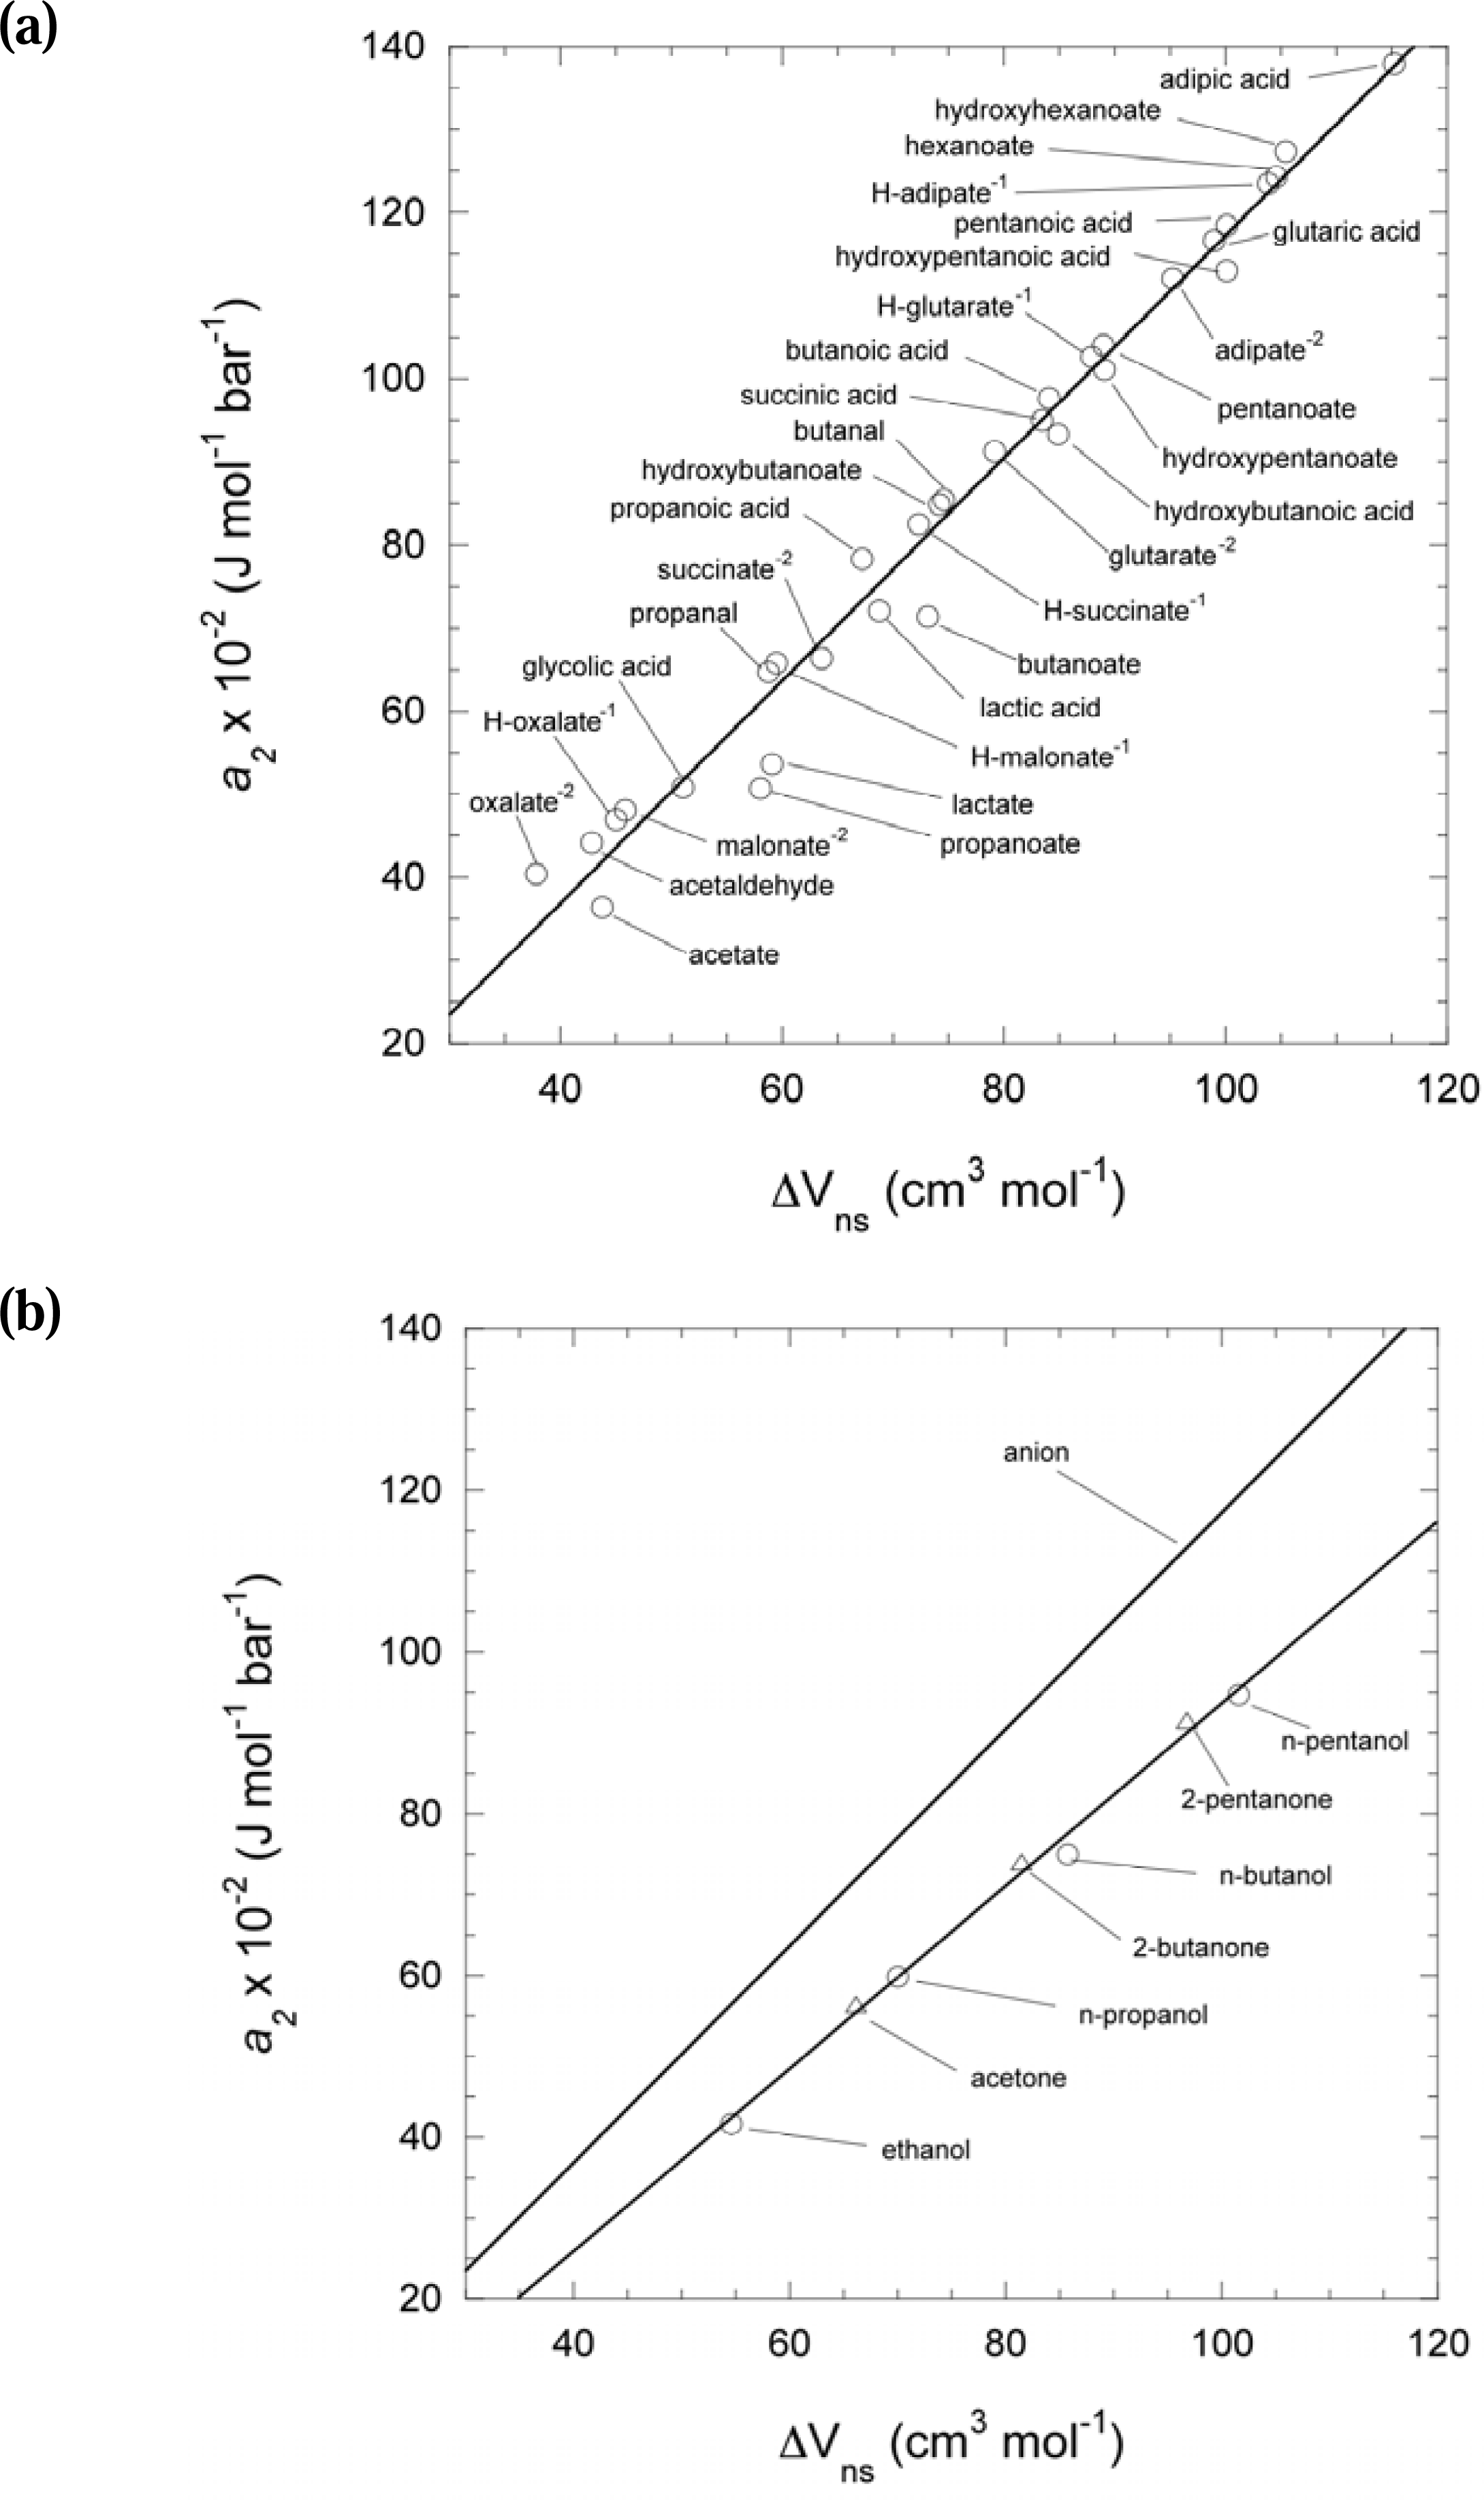
2.7. Estimation of the temperature and pressure effects on the partial molal volume of aqueous organic species: the non-solvation contribution
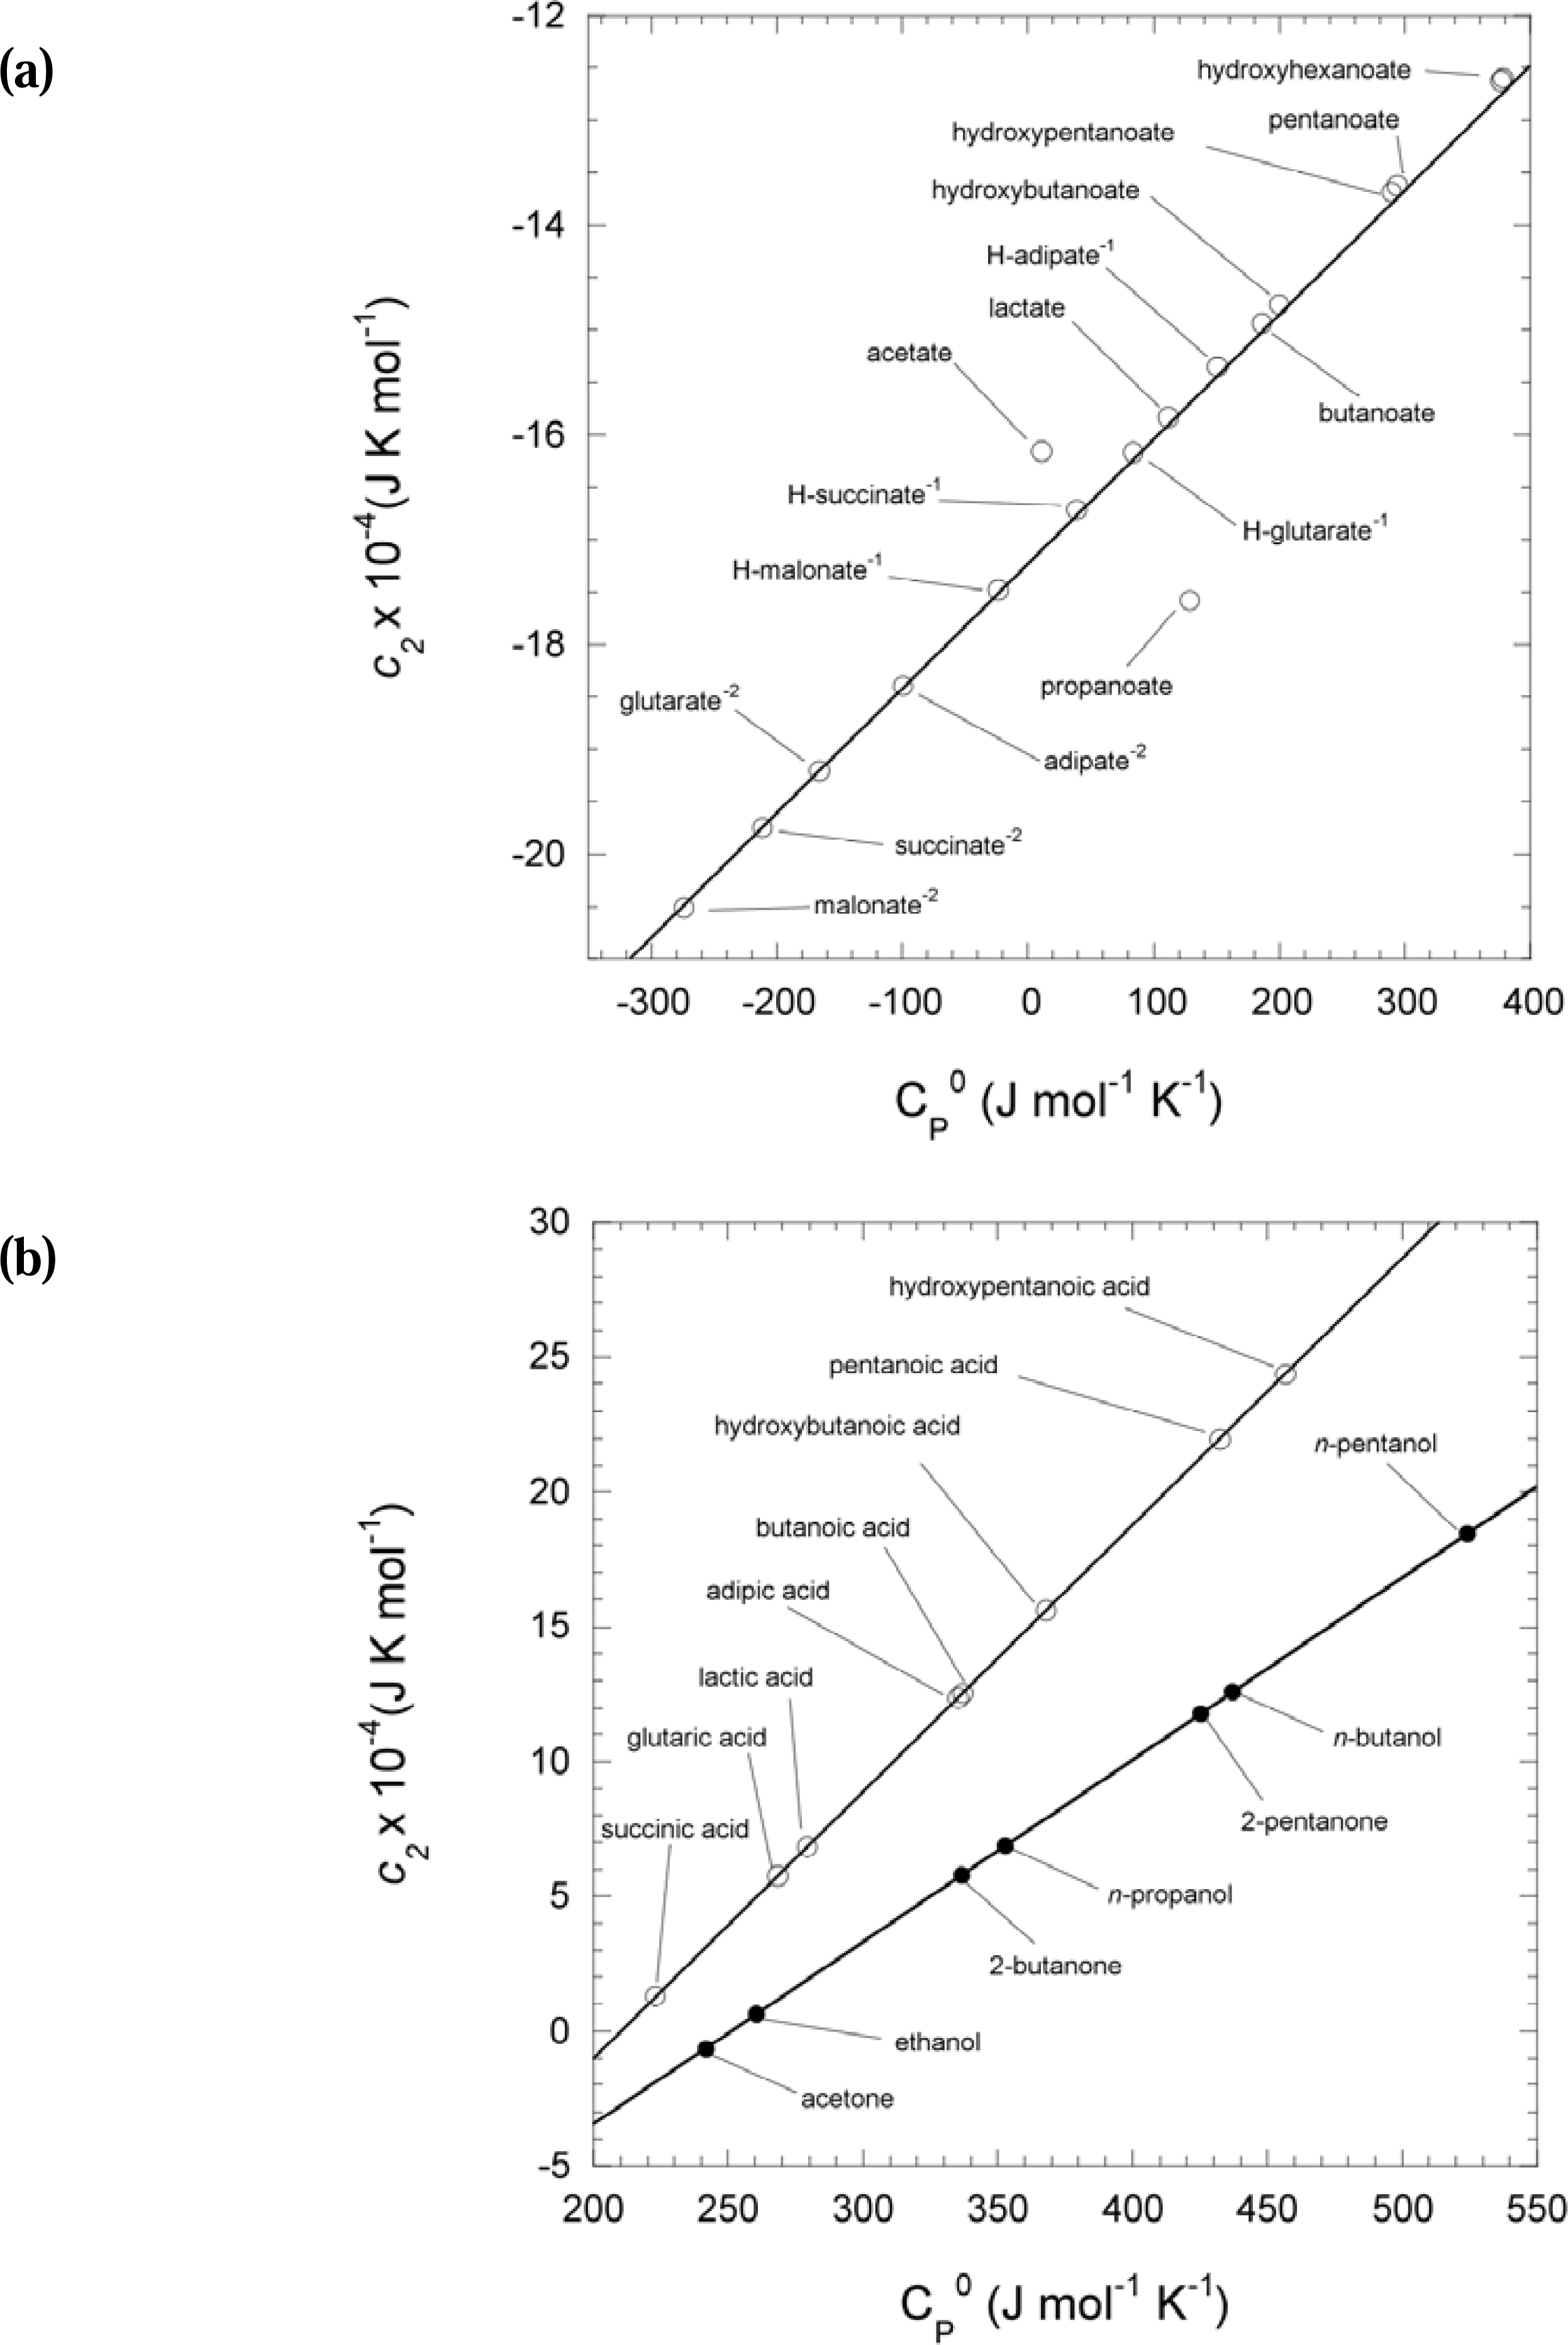
2.8. Estimation of temperature and pressure effects on the isobaric heat capacity of aqueous organic species: The non-solvation contribution
2.9. Estimation of temperature and pressure effects on the partial molal properties of aqueous organic species: The solvation contribution
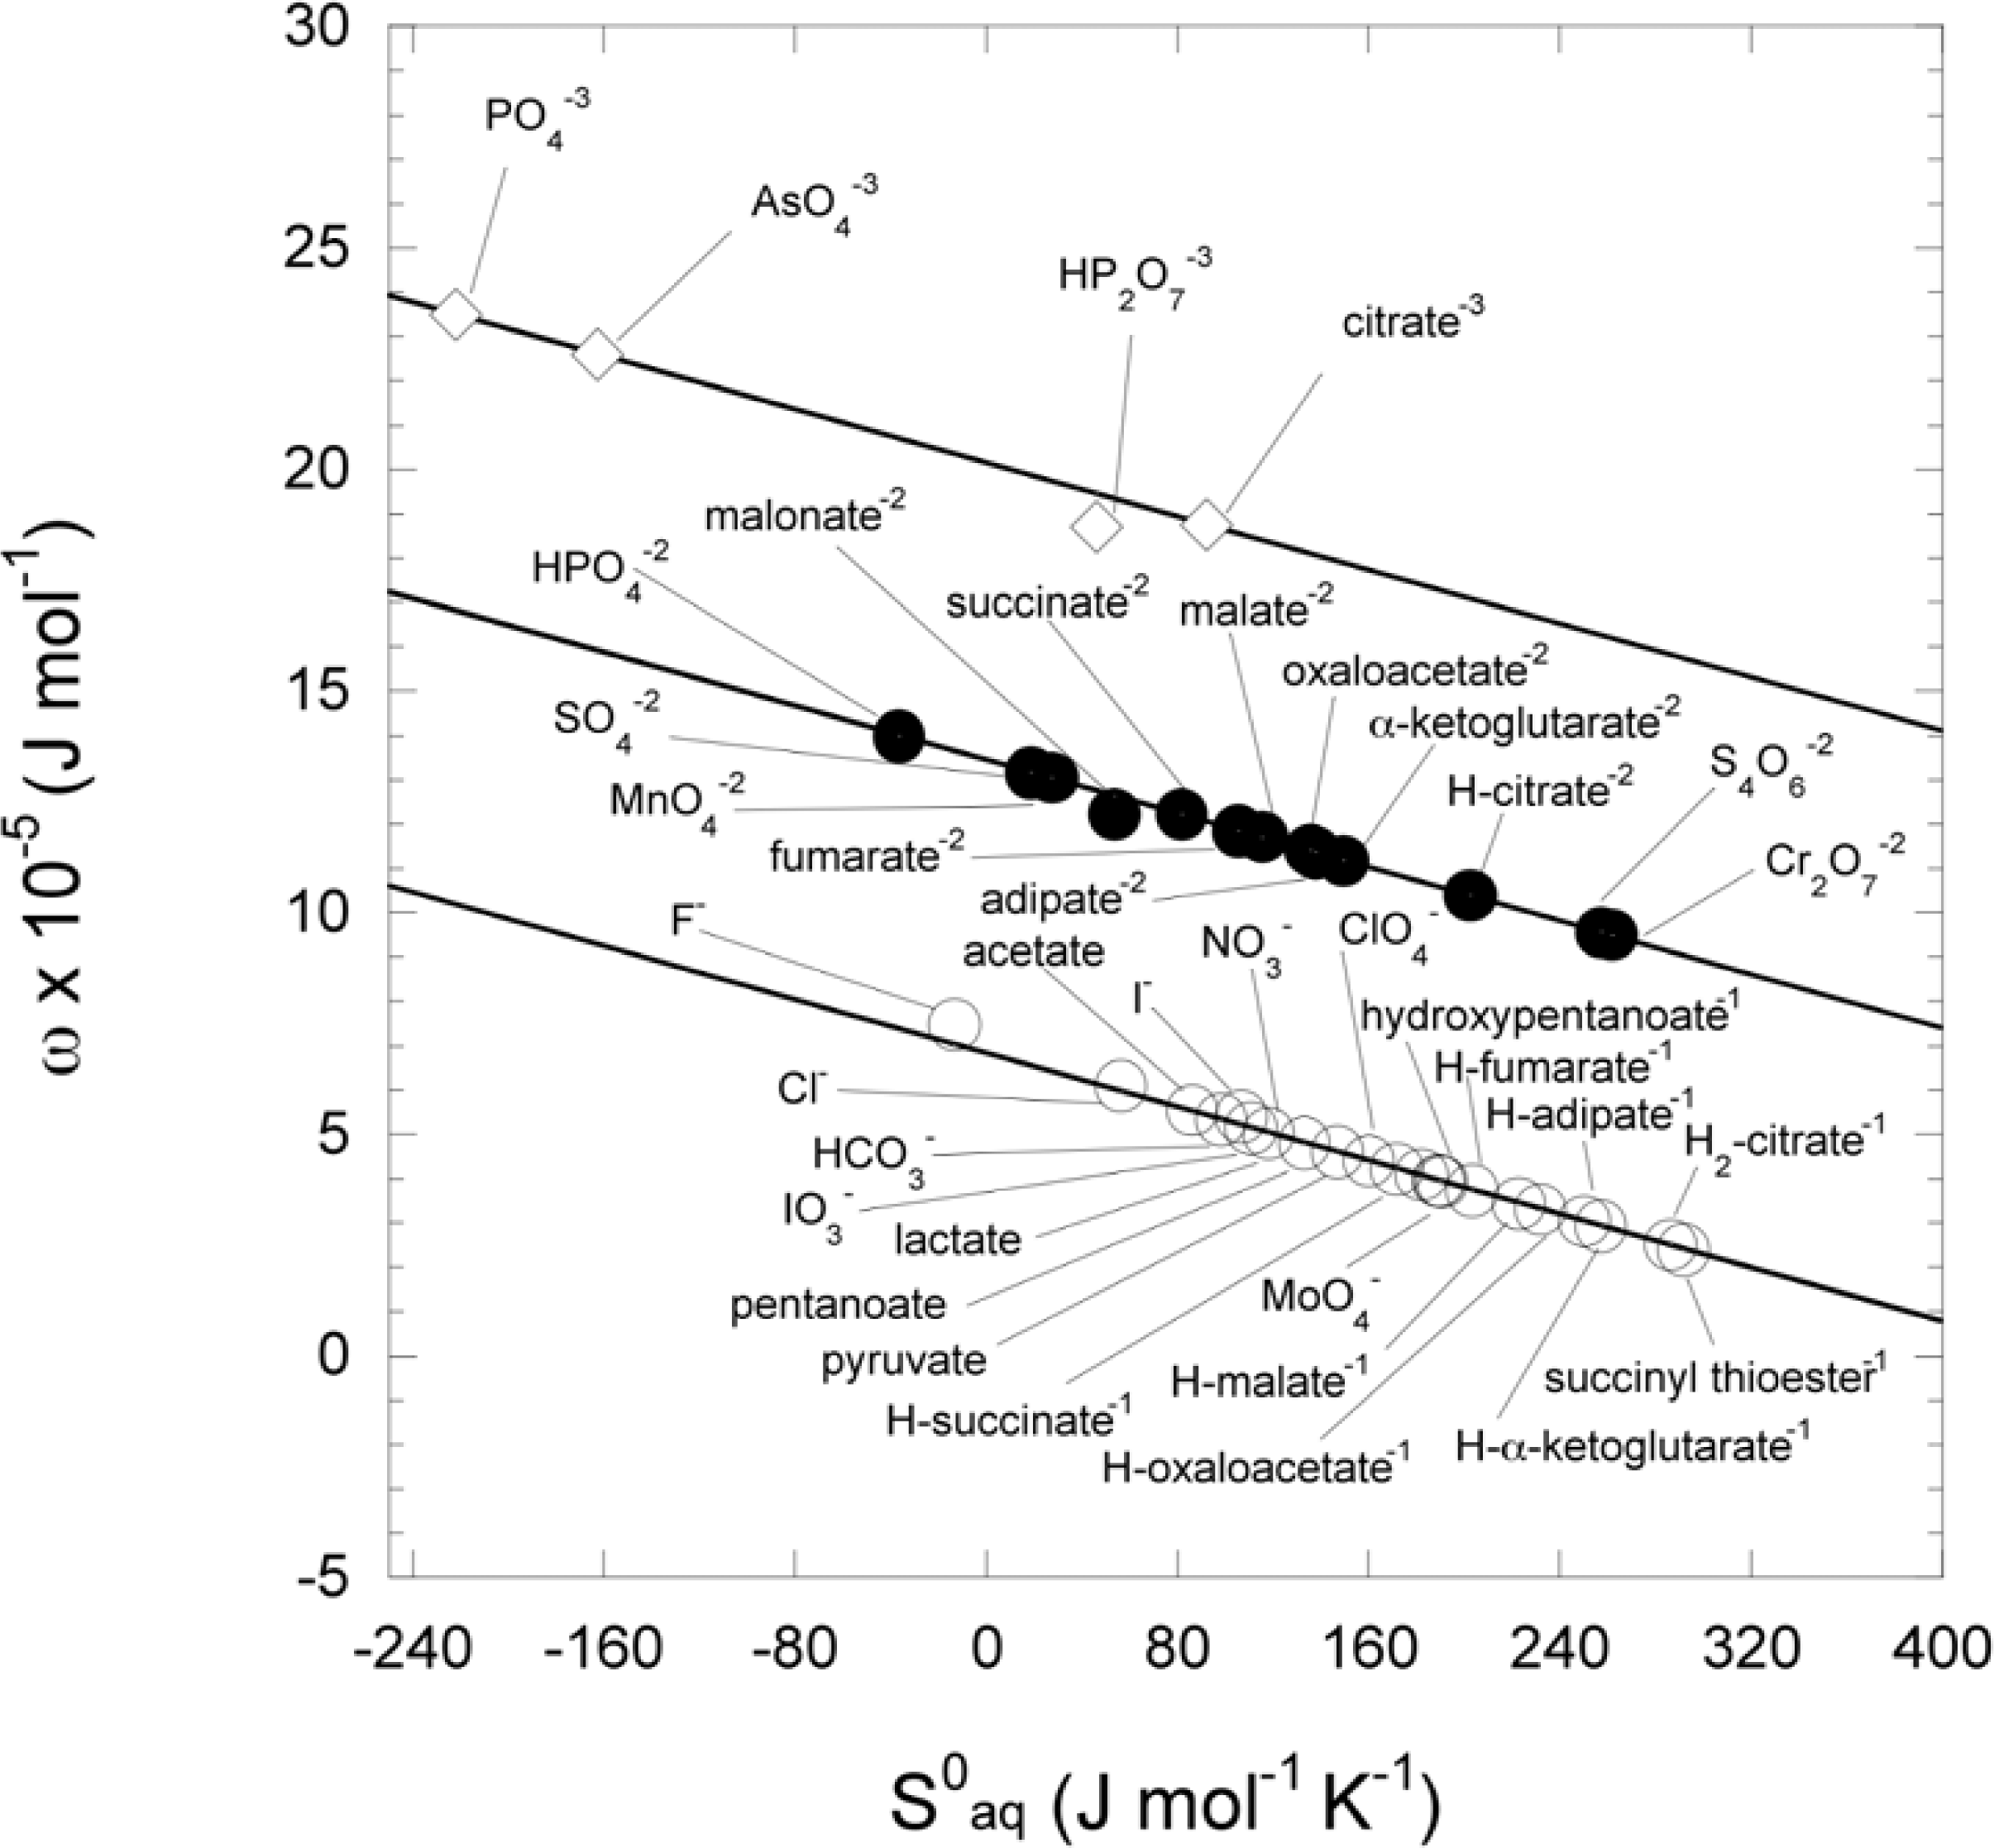
2.10. Calculation of the conventional Born coefficient (ω) for ionic species
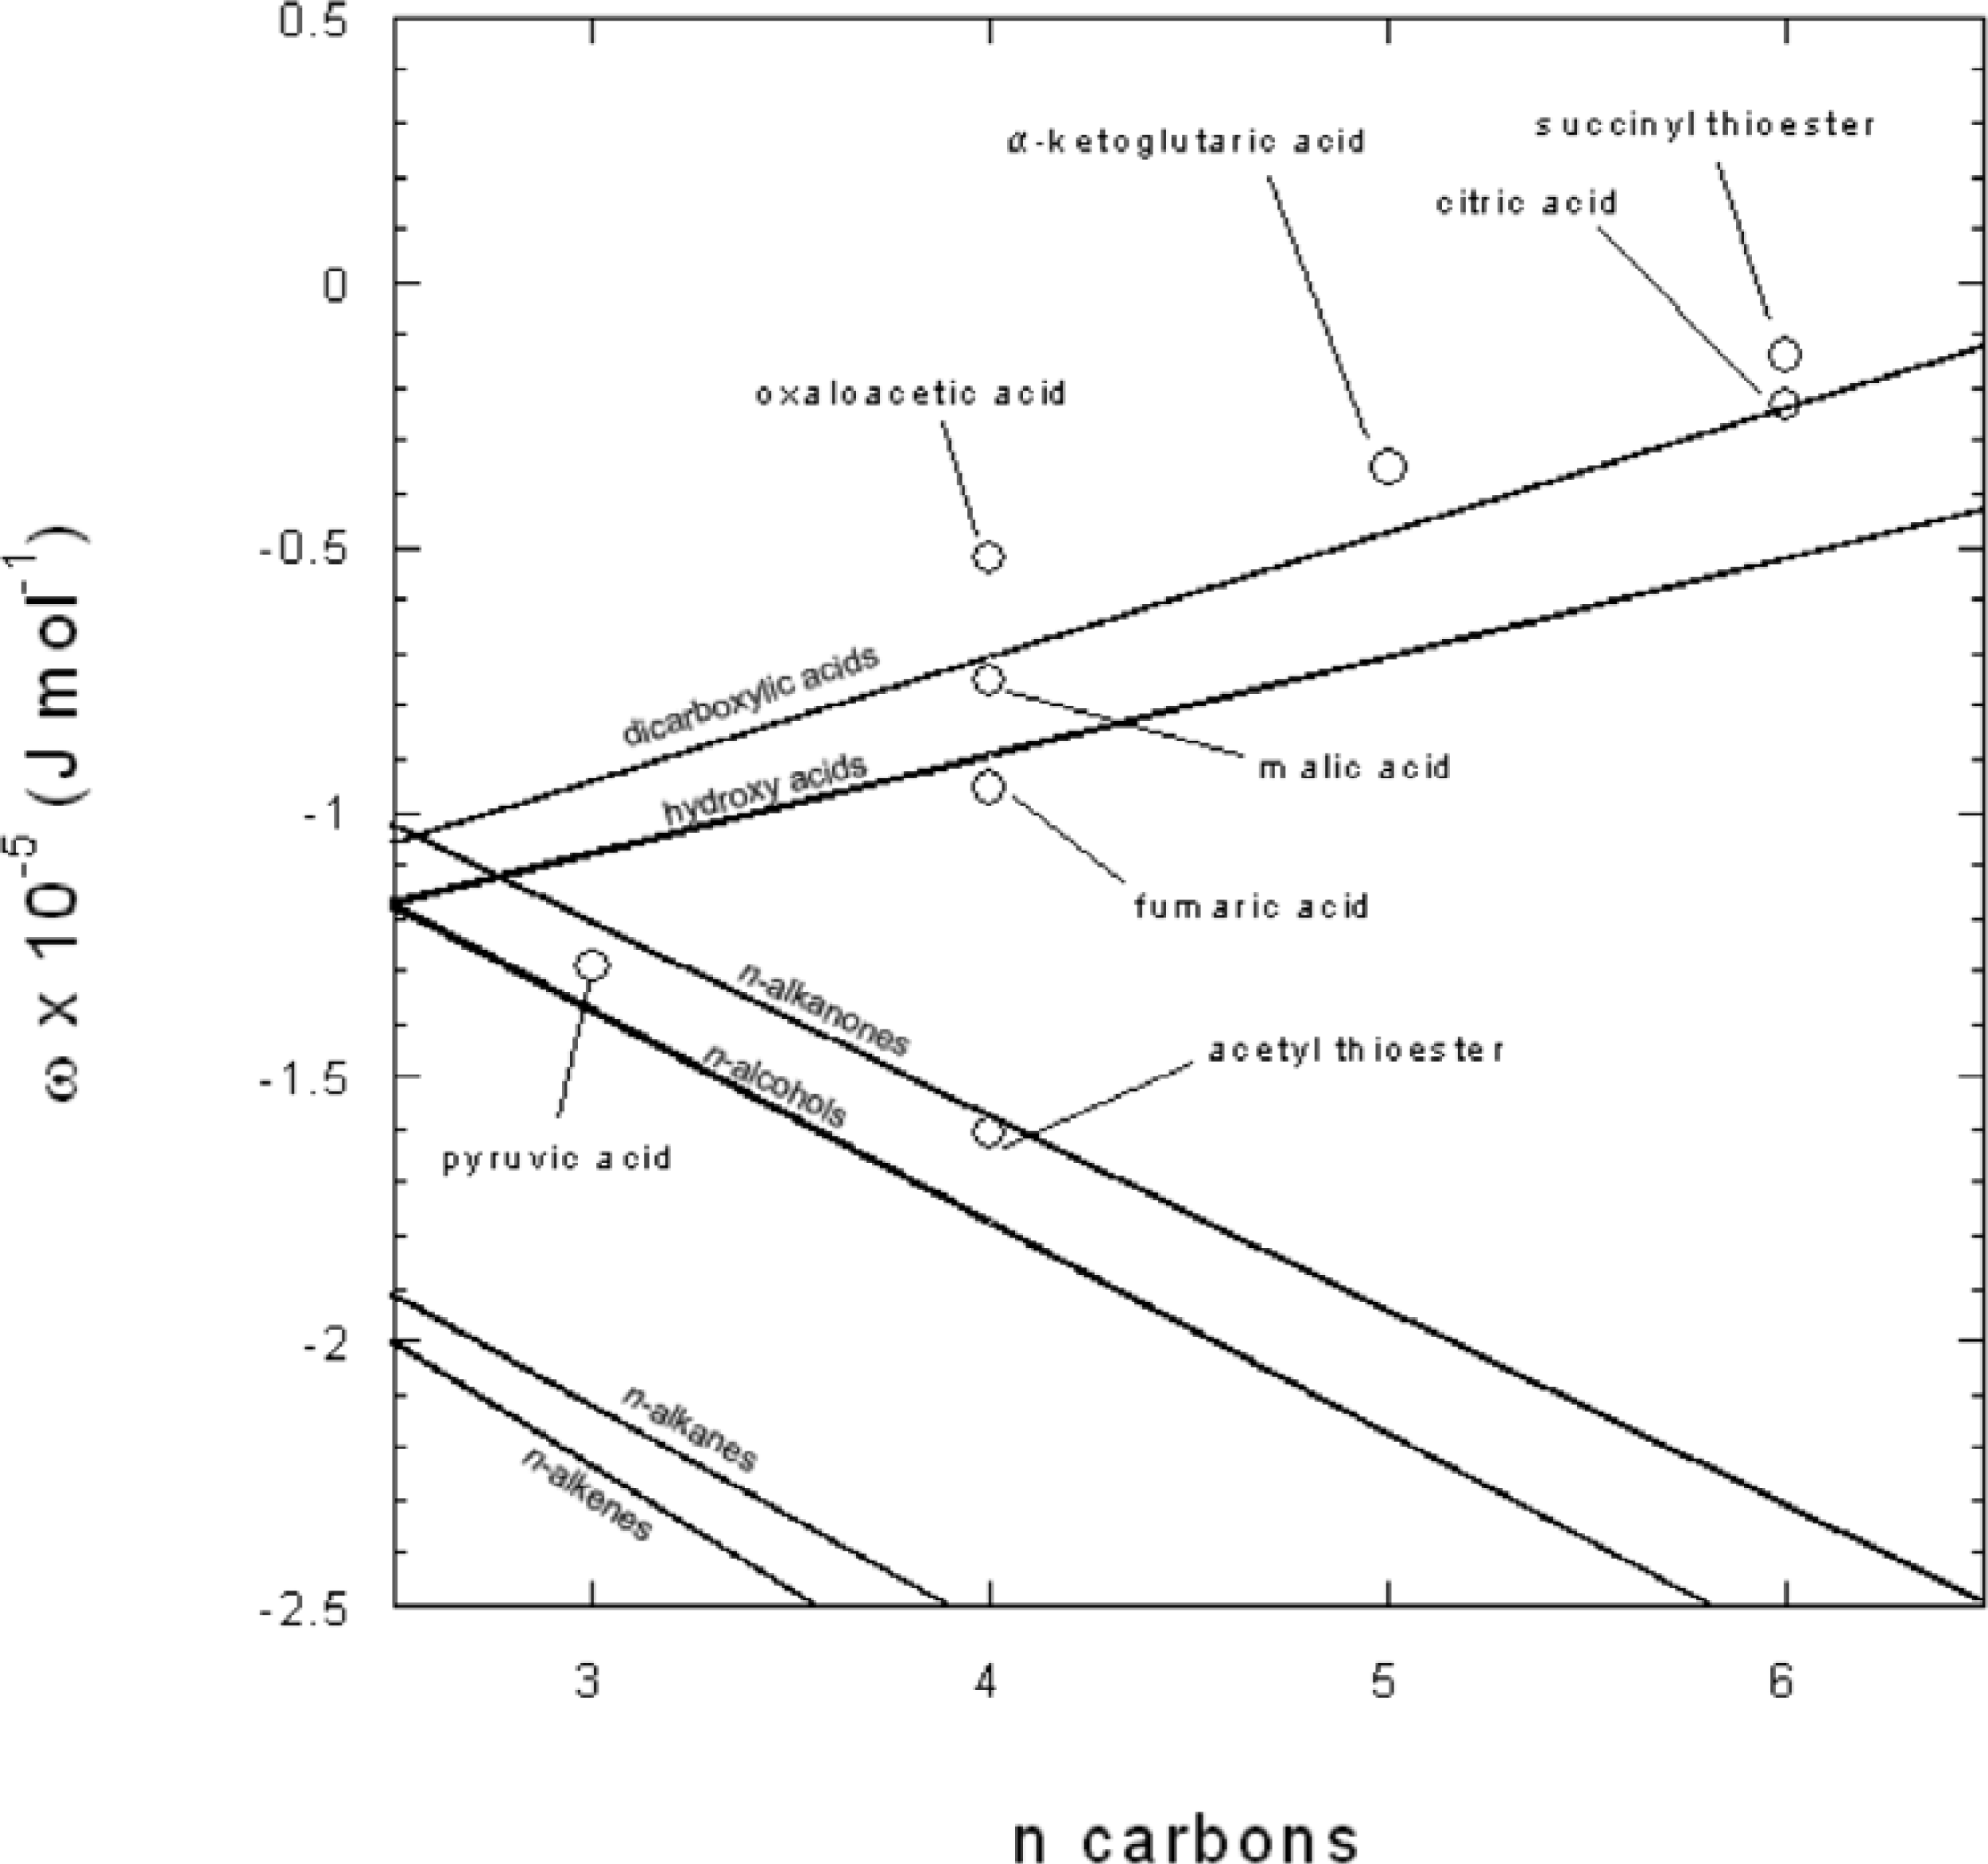
2.11. Calculation of the effective Born coefficient (ωe) for neutral species
3. Results
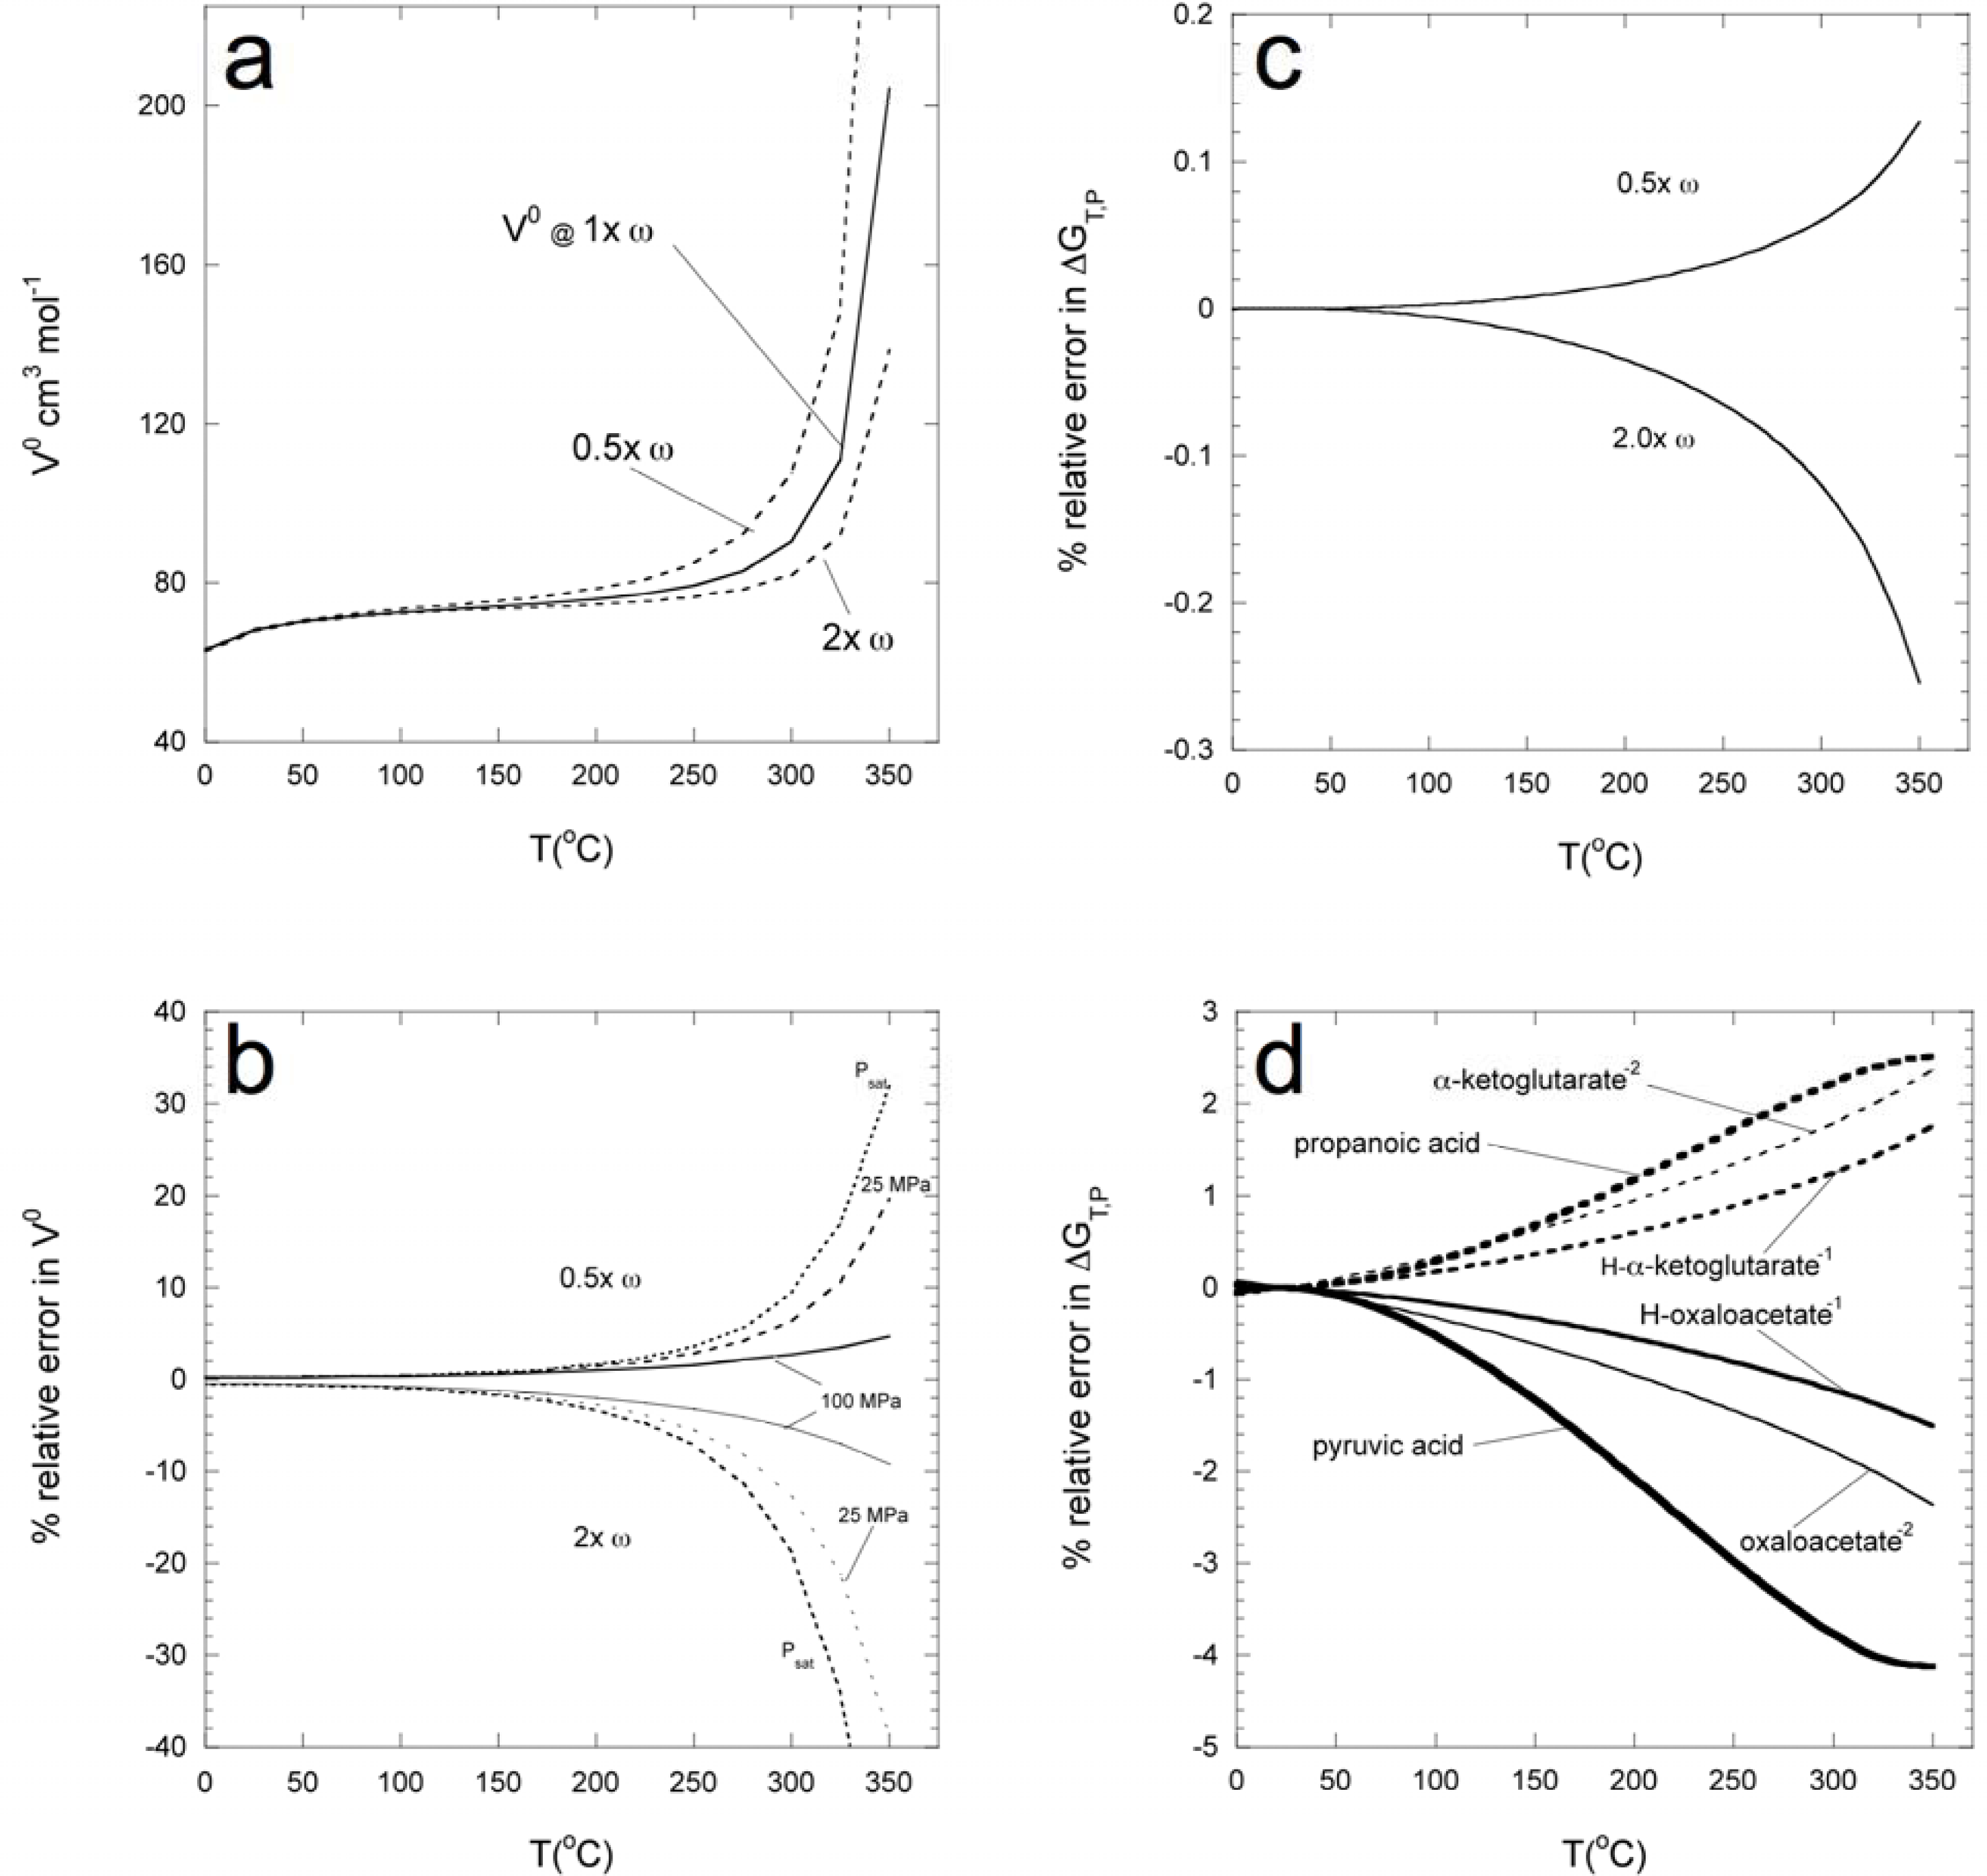
3.1. Analysis of the possible error associated with methods used in estimating reference and standard state parameters
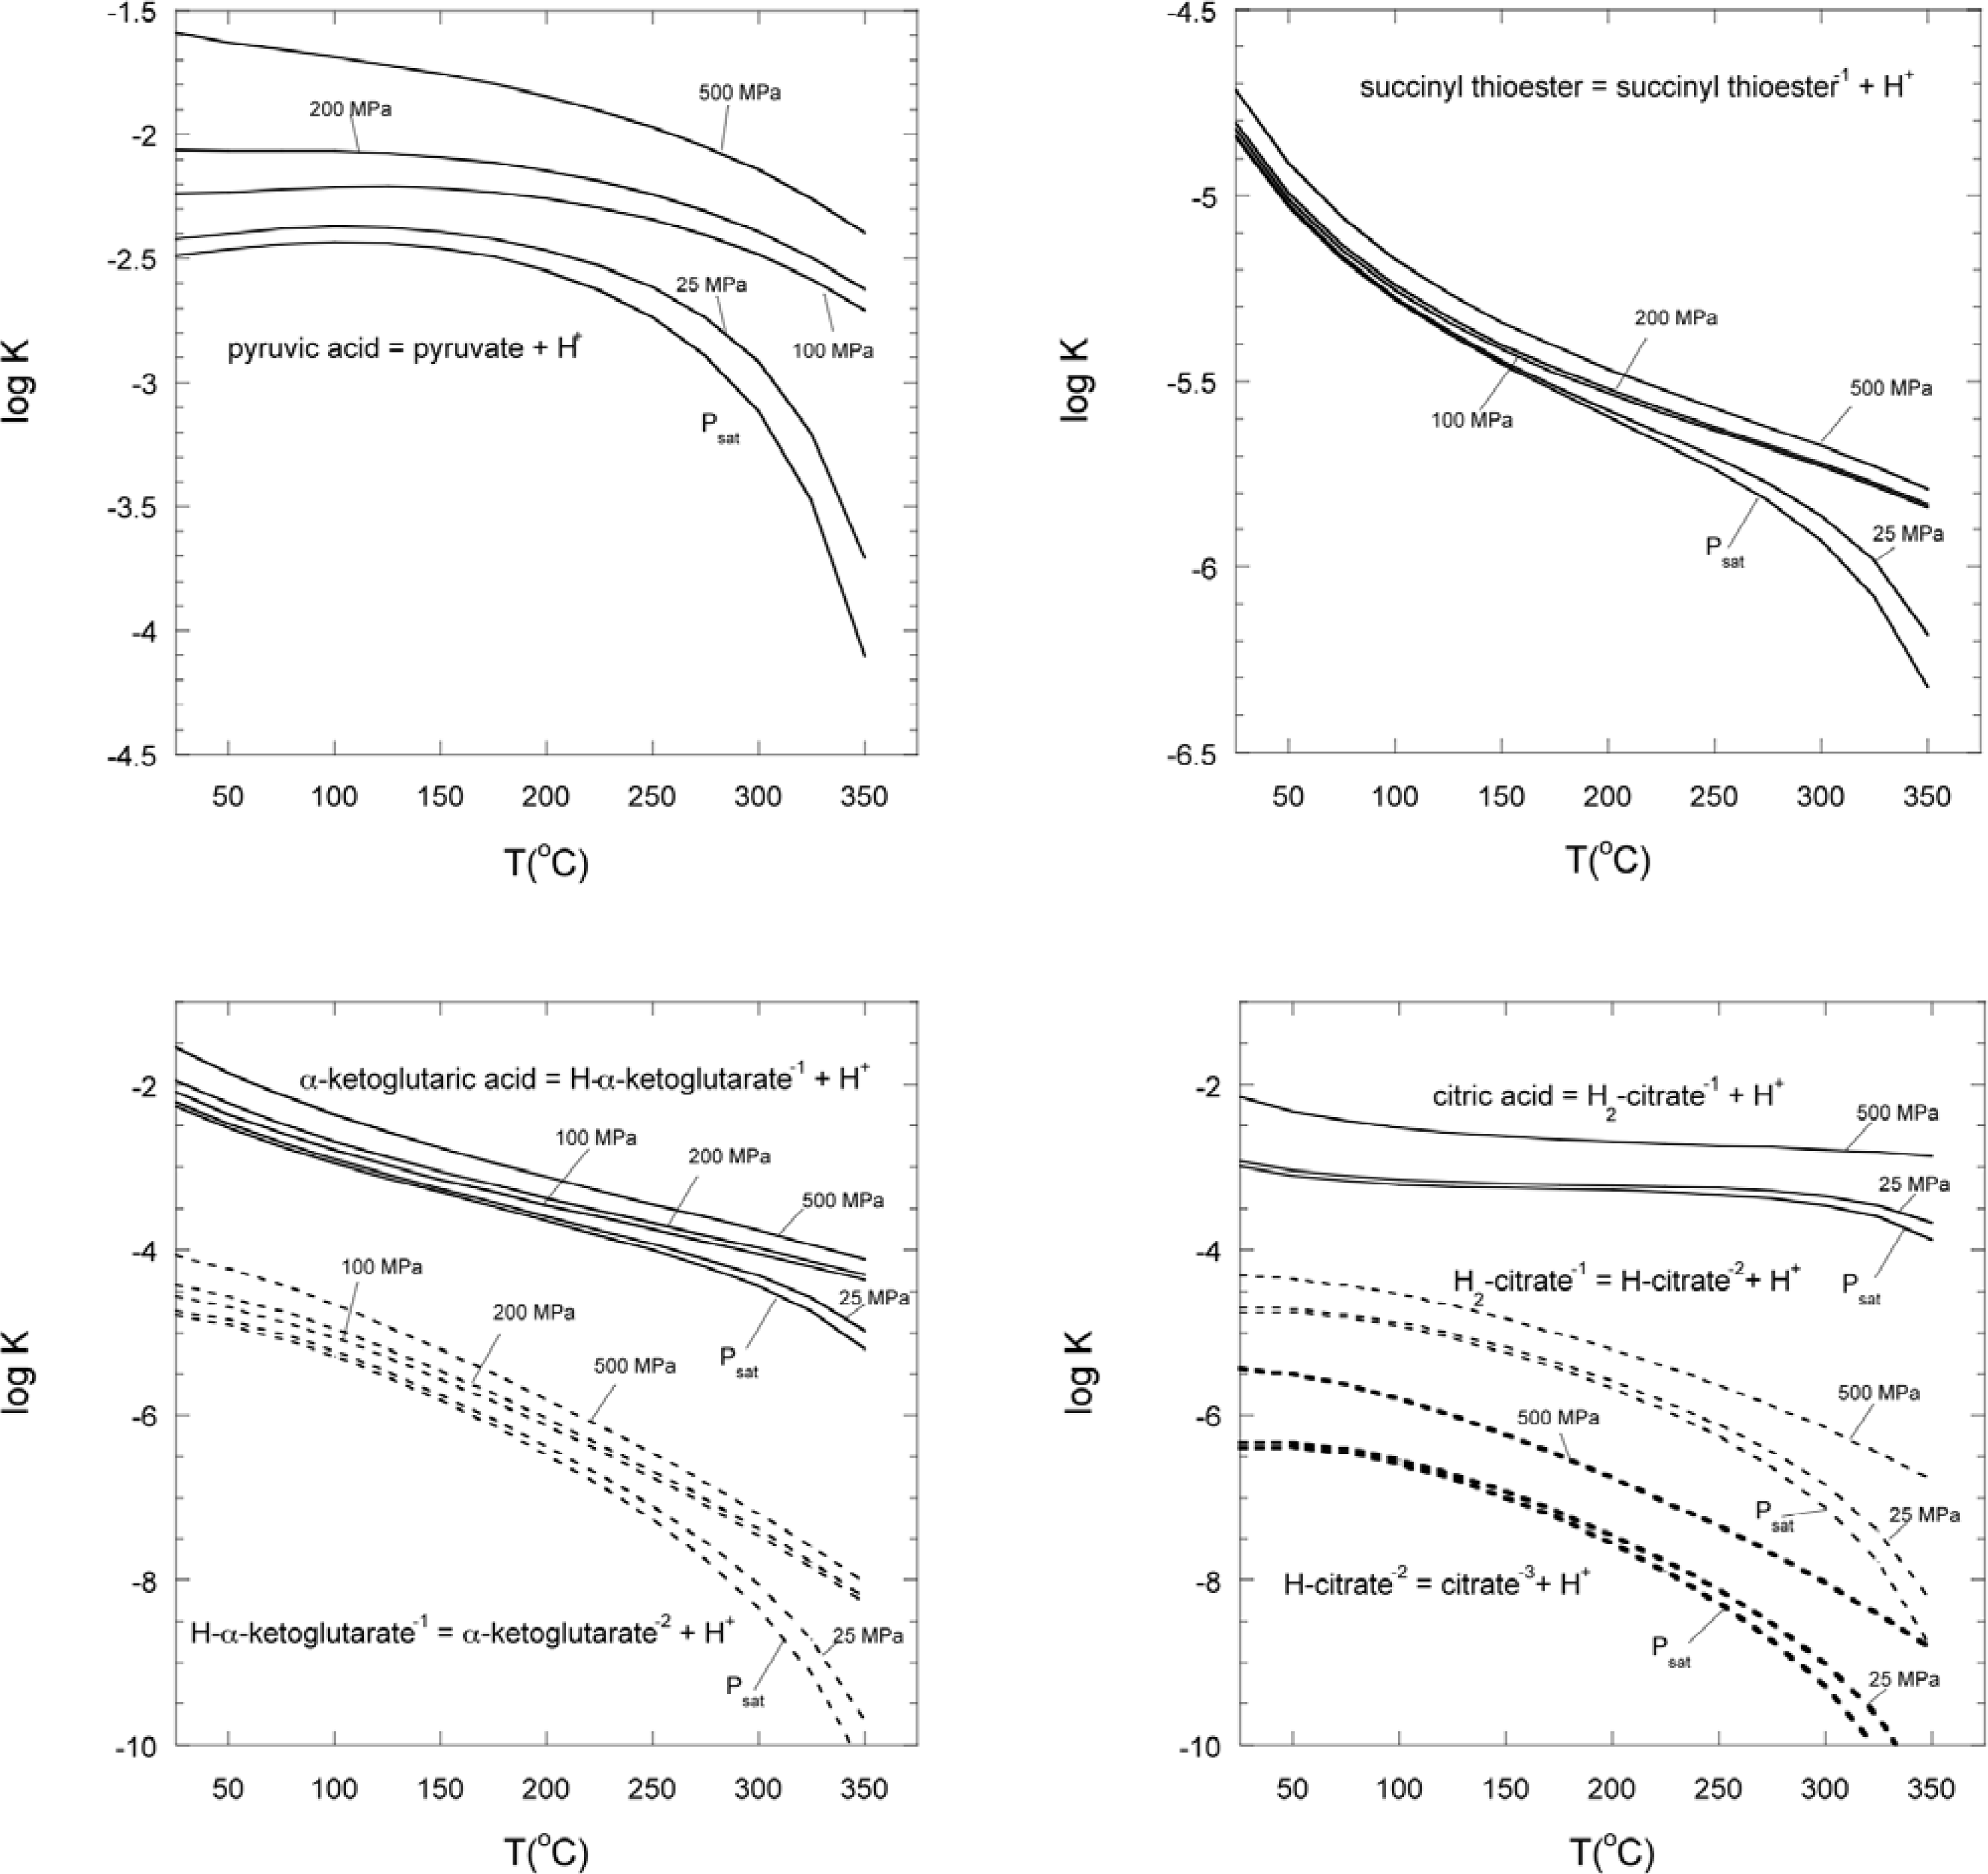
3.2. Estimation of equilibrium constants at high temperatures and pressures
4. Concluding Remarks
Acknowledgments
Appendices
Appendix A
Appendix B
Appendix C
Calculation of the effective Born coefficient (we) from ΔhydG0
Calculation of the effective Born coefficient (we) from
References and Notes
- Campbell, BJ; Cary, SC. Abundance of reverse tricarboxylic acid cycle genes in free-living microorganisms at deep-sea hydrothermal vents. Appl. Environ. Microbiol 2004, 70, 6282–6289. [Google Scholar]
- Hu, Y; Holden, JF. Citric acid cycle in the hyperthermophilic Archaeon Pyrobaculum islandicum grown autotrophically, heterotrophically, and mixotrophically with acetate. J. Bacteriol 2006, 188, 4350–4355. [Google Scholar]
- Hügler, M; Huber, H; Molyneaux, SJ; Vetriani, C; Sievert, SM. Autotrophic CO2 fixation via the reductive tricarboxylic acid cycle in different lineages within the phylum Aquificae: evidence for two ways of citrate cleavage. Environ. Microbiol 2007, 9, 81–92. [Google Scholar]
- Hügler, M; Wirsen, CO; Fuchs, G; Taylor, CD; Sievert, SM. Evidence for autotrophic CO2 fixation via the reductive tricarboxylic acid cycle by members of the ɛ subdivision of Proteobacteria. J. Bacteriol 2005, 187, 3020–3027. [Google Scholar]
- Cody, GD; Boctor, NZ; Filley, TR; Hazen, RM; Scott, JH; Sharma, A; Yoder, HS, Jr. Primordial carbonylated iron-sulfur compounds and the synthesis of pyruvate. Science 2000, 289, 1337–1340. [Google Scholar]
- de Duve, C. Clues from present-day biology: the thioester world. In The Molecular Origins of Life: Assembling the Pieces of the Puzzle; Brack, A, Ed.; Cambridge University Press: Cambridge, UK, 1998; pp. 219–236. [Google Scholar]
- Wächtershäuser, G. Evolution of the first metabolic cycles. Proc. Natl. Acad. Sci. USA 1990, 87, 200–204. [Google Scholar]
- Amend, JP; Shock, EL. Energetics of amino acid synthesis in hydrothermal ecosystems. Science 1998, 281, 1659–1662. [Google Scholar]
- Schulte, M; Shock, E. Thermodynamics of Strecker synthesis in hydrothermal systems. Orig. Life Evol. Biosph 1995, 25, 161–173. [Google Scholar]
- Shock, EL; McCollom, T; Schulte, MD. Geochemical constraints on chemolithoautotrophic reactions in hydrothermal systems. Orig. Life Evol. Biosph 1995, 25, 141–159. [Google Scholar]
- Tanger, JC; Helgeson, HC. Calculation of the thermodynamic and transport properties of aqueous species at high pressures and temperatures: revised equations of state for the standard partial molal properties of ions and electrolytes. Am. J. Sci 1988, 288, 19–98. [Google Scholar]
- Sedelbauer, J; O’Connell, JP; Wood, RH. A new equation of state for correlation and prediction of standard molal thermodynamic properties of aqueous species at high temperatures and pressures. Chem. Geol 2000, 163, 43–63. [Google Scholar]
- Amend, JP; Helgeson, HC. Group additivity equations of state for calculating the standard molal thermodynamic properties of aqueous organic species at elevated temperatures and pressures. Geochim. Cosmochim. Acta 1997, 61, 11–46. [Google Scholar]
- Schulte, M. Synthesis and processing of aqueous organic compounds during water/rock reactions. Washington University: St. Louis, 1997. [Google Scholar]
- Schulte, MD; Shock, EL. Aldehydes in hydrothermal solution: standard partial molal thermodynamic properties and relative stabilities at high temperatures and pressures. Geochim. Cosmochim. Acta 1993, 57, 3835–3846. [Google Scholar]
- Schulte, MD; Rogers, KL. Thiols in hydrothermal solution: standard partial molal properties and their role in the organic geochemistry of hydrothermal environments. Geochim. Cosmochim. Acta 2004, 68, 1087–1097. [Google Scholar]
- Shock, EL; Helgeson, HC. Calculation of the thermodynamic and transport properties of aqueous species at high pressures and temperatures: Correlation algorithms for ionic species and equation of state predictions to 5 Kb and 1000°C. Geochim. Cosmochim. Acta 1988, 52, 2009–2036. [Google Scholar]
- Shock, EL; Helgeson, HC. Calculation of the thermodynamic and transport properties of aqueous species at high pressures and temperatures: Standard partial molal properties of organic species. Geochim. Cosmochim. Acta 1990, 54, 915–945. [Google Scholar]
- Shock, EL; Helgeson, HC; Sverjensky, DA. Calculation of the thermodynamic and transport properties of aqueous species at high pressures and temperatures: Standard partial molal properties of inorganic neutral species. Geochim. Cosmochim. Acta 1989, 53, 2157–2183. [Google Scholar]
- Shock, EL; Sassani, DC; Willis, M; Sverjensky, DA. Inorganic species in geologic fluids: Correlations among standard molal thermodynamic properties of aqueous ions and hydroxide complexes. Geochim. Cosmochim. Acta 1997, 61, 907–950. [Google Scholar]
- Amend, JP; Helgeson, HC. Solubilities of the common L-α-amino acids as a function of temperature and solution pH. Pure Appl. Chem 1997, 69, 935–942. [Google Scholar]
- Amend, JP; Helgeson, HC. Calculation of the standard molal thermodynamic properties of aqueous biomolecules at elevated temperatures and pressures .1. L-alpha-amino acids. J. Chem. Soc. Faraday T 1997, 93, 1927–1941. [Google Scholar]
- Shock, EL. Organic acids in hydrothermal solutions: standard molal thermodynamic properties of carboxylic acids and estimates of dissociation constants at high temperatures and pressures. Am. J. Sci 1995, 295, 496–580. [Google Scholar]
- Amend, JP; Shock, EL. Energetics of overall metabolic reactions of thermophilic and hyperthermophilic Archaea and Bacteria. FEMS Microbiol. Rev 2001, 25, 175–243. [Google Scholar]
- Russell, MJ; Hall, AJ. The emergence of life from iron monosulphide bubbles at a submarine hydrothermal redox and pH front. J. Geol. Soc. London 1997, 154, 377–402. [Google Scholar]
- 25°C and 0.1 MPa. The standard state used in the present study is one of unit activity of the pure solvent at any pressure and temperature, and the standard state for gases is unit fugacity of the ideal gas at any temperature and 1 bar (0.1 MPa). The standard state convention for aqueous species is one of unit activity in a hypothetical 1 molal solution referenced to infinite dilution at any pressure and temperature.
- Benson, SW; Buss, JH. Additivity rules for the estimation of molecular properties. Thermodynamic properties. J. Chem. Phys 1958, 29, 546–572. [Google Scholar]
- Domalski, ES; Hearing, ED. Estimation of the thermodynamic properties of C-H-N-O-S-Halogen compounds at 298.15 K. J. Phys. Chem. Ref. Data 1993, 22, 805–1135. [Google Scholar]
- Richard, L. Calculation of the standard molal thermodynamic properties as a function of temperature and pressure of some geochemically important organic sulfur compounds. Geochim. Cosmochim. Acta 2001, 65, 3827–3877. [Google Scholar]
- Schulte, MD; Shock, EL; Obsil, M; Majer, V. Volumes of aqueous alcohols, ethers, and ketones to T = 523 K and p = 28 MPa. J. Chem. Thermodyn 1999, 31, 1195–229. [Google Scholar]
- Cabani, S; Gianni, P; Mollica, V; Lepori, L. Group contributions to the thermodynamic properties of non-ionic organic solutes in dilute aqueous solutions. J. Solution Chem 1981, 10, 563–595. [Google Scholar]
- Mavrovouniotis, ML. Group contributions for estimating standard Gibbs energies of formation of biochemical compounds in aqueous solution. Biotechnol. Bioeng 1990, 36, 1070–1082. [Google Scholar]
- Miller, SL; Smith-Magowan, D. The thermodynamics of the Krebs cycle and related compounds. J. Phys. Chem. Ref. Data 1990, 19, 1049–1073. [Google Scholar]
- Bastos, M; Kimura, T; Wadsö, I. Some thermodynamic properties of dialkylsulfides and dialkyldisulfides in aqueous solution. J. Chem. Thermodyn 1991, 23, 1069–1074. [Google Scholar]
- Criss, CM; Wood, RH. Apparent molar volumes of aqueous solutions of soome organic solutes at the pressure of 28 MPa and temperatures to 598 K. J. Chem. Thermodyn 1996, 28, 723–741. [Google Scholar]
- Wilhoit, C; Lei, I. Thermochemistry of some biologically important compounds. J. Chem. Eng. Data 1965, 10, 1066–1067. [Google Scholar]
- Brown, HD. Biochemical Microcalorimetry; Academic Press: New York, 1969. [Google Scholar]
- James, AM; Lord, MP. Macmillan's Chemical and Physical Data, 1992.
- Cox, JD; Wagman, DD; Medvedev, VA. CODATA key values for thermodynamics; Hemisphere Publishing Corp: New York, 1989. [Google Scholar]
- Lepori, L; Gianni, P. Partial molar volumes of ionic and nonionic organic solutes in water: A simple additivity scheme based on the intrinsic volume approach. J. Solution Chem 2000, 29, 405–447. [Google Scholar]
- Levien, BJ. A physicochemical study of aqueous citric acid solutions. J. Phys. Chem 1955, 59, 640–644. [Google Scholar]
- Sijpkes, AH; Van Rossum, P; Raad, JS; Somsen, G. Heat Capacities and Volumes of some polybasic carboxylic acids in water at 298.15K. J. Chem. Thermodyn 1989, 21, 1061–1067. [Google Scholar]
- Yokoyama, H; Mochida, M; Koyama, Y. Molar volumes and electrostriction behavior of dicarboxylate, disulfonate, tartrate, and bis(ethylenediamine)-glycinacobalt(III) ions in water. B. Chem. Soc. Jpn 1988, 61, 3445–3449. [Google Scholar]
- Apelblat, A; Manzurola, E. Apparent molar volumes of organic acids and salts in water at 298.15 K. Fluid Phase Equilibr 1990, 60, 157–171. [Google Scholar]
- Higgins, IJ; Best, DJ; Hammond, RC; Scott, D. Methane-oxidizing microorganisms. Microbiol. Rev 1981, 45, 556–590. [Google Scholar]
- Schulte, MD; Shock, EL; Wood, RH. The temperature dependence of the standard-state thermodynamic properties of aqueous nonelectrolytes. Geochim. Cosmochim. Acta 2001, 65, 3919–3930. [Google Scholar]
- Shock, EL; Oelkers, EH; Johnson, JW; Sverjensky, DA; Helgeson, HC. Calculation of the thermodynamic properties of aqueous species at high pressures and temperatures: Effective electrostatic radii, dissociation constants and standard partial molal properties to 1000 °C and 5 Kbar. J. Chem. Soc. Faraday T 1992, 88, 803–826. [Google Scholar]
- Chialvo, AA; Kusalik, PG; Cummings, PT; Simonson, JM; Mesmer, RE. Molecular approach to high-temperature solvation. Formal, integral equation and experimental results. J. Phys. Condens. Matter 2000, 12, 3585–3593. [Google Scholar]
- Amend, JP; Plyasunov, A. Carbohydrates in thermophile metabolism: calculation of the standard molal thermodynamic properties of aqueous pentoses and hexoses at elevated temperatures and pressures. Geochim. Cosmochim. Acta 2001, 65, 3901–3917. [Google Scholar]
- Plyasunov, AV; Shock, EL. Correlation strategy for determining the parameters of the revised Helgeson-Kirkham-Flowers model for aqueous nonelectrolytes. Geochim. Cosmochim. Acta 2001, 65, 3879–3900. [Google Scholar]
- Johnson, JW; Oelkers, EH; Helgeson, HC. SUPCRT92: A software package for calculating the standard molal properties of minerals, gases, aqueous species, and reactions from 1 to 5000 bar and 0 to 1000°C. Comput. Geosci 1992, 18, 899–947. [Google Scholar]
- Guthrie, JP. Hydration of thioesters. Evaluation of the free-energy changes for the addition of water to some thioesters, rate-equilibrium correlations over very wide ranges in equilibrium constants, and a new mechansitic criterion. J. Am. Chem. Soc 1978, 100, 5892–5904. [Google Scholar]
- Wadsö, I. Heat of vaporization for a number of organic compounds at 25°C. Acta Chem. Scand 1966, 23, 544–552. [Google Scholar]
- Helgeson, HC; Kirkham, DH. Theoretical prediction of thermodynamic properties of aqueous electrolytes at high pressures and temperatures. III. Equation of state for aqueous species at infinite dilution. Am. J. Sci 1976, 276, 97–240. [Google Scholar]
- Kahn, I; Brimblecombe, P; Clegg, SL. Solubilities of pyruvic acid and the lower (C1–C6) carboxylic acids. Experimental determination of equilibrium vapor pressures above pure aqueous and salt solutions. J. Atmos. Chem 1995, 22, 285–302. [Google Scholar]
- Saxena, P; HiIdelmann, LM. Water-soluble organics in atmospheric particles: A critical review of the literaure and application of thermodynamics to identify candidate compoiunds. J. Atmos. Chem 1996, 24, 57–109. [Google Scholar]


| ΔGf0 a | S0 b | V0 c | CP0 b | a1 d,ee | a2 d | a3 e | a4 f,hh | c1 g | c2 f | ωb | |
|---|---|---|---|---|---|---|---|---|---|---|---|
| pyruvic acid | −489.1j | 179.9 k | 54.6 h | 114.6 h | 3.9096 | 5745.0 ff | 2.478 | −140079 | 24.645 | 384086 jj | −129222 mm |
| pyruvate−1 | −474.9 I | 171.5 k | 41.5 t | −52.8 bb | 3.2601 | 4220.3 ff | 17.617 | −133776 | 22.278 | −178281 ii | 42208 ll |
| oxalaoacetic acid | −838.3 j | 287.5 h | 72.4 h | 108.7 h | 4.8998 | 7178.9 ff | 24.687 | −146006 | 27.207 | 377592 jj | −52158 mm |
| H-oxalaoacetate−1 | −823.7 j | 233.1 p | 60.3 u | −77.7 cc | 4.3045 | 6672.1 ff | 10.473 | −143911 | −10.600 | −181300 ii | 330604 ll |
| oxalaoacetate−2 | −798.7 I | 107.9 q | 46.7 v | −328.1 cc | 3.8109 | 5513.3 ff | 13.850 | −139121 | −176.230 | −211639 ii | 1139579 ll |
| malic acid | −891.6 k | 283.8 h | 82.8 w | 227.7 w | 5.5023 | 8481.8 ff | 21.621 | −151393 | 117.243 | 509492 jj | −75348 mm |
| H-malate−1 | −872.4 l | 227.7 r | 69.4 x | 41.2 dd | 4.8234 | 7890.2 ff | 6.924 | −148947 | 106.200 | −166880 ii | 344473 ll |
| malate−2 | −843.1 l | 126.8 r | 55.7 x | −209.1 dd | 4.3174 | 6702.4 ff | 10.385 | −144037 | −62.817 | −197220 ii | 1170226 ll |
| fumaric acid | −645.8 k | 261.1 k | 78.8 h | 154.7 h | 5.2807 | 8963.5 ff | 39.867 | −153384 | 58.786 | 428516 jj | −95650 mm |
| H-fumarate−1 | −628.1 k | 203.3 k | 65.4 y | −31.8 dd | 4.6074 | 7383.1 ff | 8.401 | −146851 | 38.350 | −175733 ii | 373932 ll |
| fumarate−2 | −601.9 k | 105.4 k | 51.7 y | −282.1 dd | 4.0998 | 6191.7 ff | 11.873 | −141925 | −131.082 | −206072 ii | 1185066 ll |
| α-ketoglutaric acid | −842.3 j | 315.1 h | 89.0 z | 173.4 h | 5.8421 | 9216.6 ff | 24.128 | −154430 | 78.884 | 449296 jj | −35121 mm |
| H-α-ketoglutarate−1 | −829.4 j | 243.5 s | 75.6 x | −13.1 dd | 5.1687 | 8700.7 ff | 4.562 | −152298 | 51.025 | −173461 ii | 292131 ll |
| α-ketoglutarate−2 | −802.0 I | 136.0 s | 61.9 x | −263.4 dd | 4.6661 | 7520.8 ff | 8.000 | −147420 | −117.057 | −203800 ii | 1117934 ll |
| citric acid | −1243.4 m | 329.4 l | 113.6 w | 322.5 w | 7.2438 | 12247.7 ff | 39.901 | −166961 | 195.456 | 614557 jj | −23333 mm |
| H2-citrate−1 | −1226.3 k | 286.2 k | 98.1 aa | 187.9 k | 6.4344 | 11671.9 ff | −4.096 | −164580 | 241.056 | −149109 ii | 248464 ll |
| H-citrate−2 | −1199.2 k | 202.3 k | 88.5 aa | 0.84 k | 6.1522 | 11009.3 ff | −2.165 | −161841 | 131.407 | −171775 ii | 1038339 ll |
| citrate−3 | −1162.7 k | 92.1 k | 72.0 aa | −254.8 k | 5.4914 | 9458.3 ff | 2.355 | −155429 | −40.909 | −202760 ii | 1874470 ll |
| succinyl thioester | −496.6 n | 394.5 h | 140.5 h | 216.1 h | 8.7769 | 15562.9 ff | 115.513 | −180666 | 113.931 | 496645 jj | −13856 mm |
| succinyl thioester−1 | −468.9 o | 292.0 h | 133.7 h | 78.0 h | 8.4641 | 16436.3 ff | −17.979 | −184277 | 133.088 | −162424 ii | 187278 ll |
| acetyl thioester | −140.1 n | 400.1 h | 107.3 h | 255.5 h | 6.9314 | 10305.7 gg | 36.887 | −158933 | 171.102 | 342400 kk | −160625 mm |
| ωa | ωb | ωc | |
|---|---|---|---|
| pyruvic acid | −1.2922 | −1.2679 | 1.2156 |
| oxalaoacetic acid | −0.5216 | −0.4495 | 2.4908 |
| malic acid | −0.7535 | −0.5100 | 2.7785 |
| fumaric acid | −0.9565 | −0.7306 | −1.7418 |
| a-ketoglutaric acid | −0.3512 | −0.2814 | 1.3690 |
| citric acid | −0.2333 | −0.2780 | 4.0067 |
| succinnyl thioester | −0.1386 | 0.0107 | 7.7939 |
| acetyl thioester | −1.6063 | 0.0453 | −3.7706 |
© 2009 by the authors; licensee Molecular Diversity Preservation International, Basel, Switzerland. This article is an open-access article distributed under the terms and conditions of the Creative Commons Attribution license (http://creativecommons.org/licenses/by/3.0/).
Share and Cite
Dalla-Betta, P.; Schulte, M. Calculation of the Aqueous Thermodynamic Properties of Citric Acid Cycle Intermediates and Precursors and the Estimation of High Temperature and Pressure Equation of State Parameters. Int. J. Mol. Sci. 2009, 10, 2809-2837. https://doi.org/10.3390/ijms10062809
Dalla-Betta P, Schulte M. Calculation of the Aqueous Thermodynamic Properties of Citric Acid Cycle Intermediates and Precursors and the Estimation of High Temperature and Pressure Equation of State Parameters. International Journal of Molecular Sciences. 2009; 10(6):2809-2837. https://doi.org/10.3390/ijms10062809
Chicago/Turabian StyleDalla-Betta, Peter, and Mitchell Schulte. 2009. "Calculation of the Aqueous Thermodynamic Properties of Citric Acid Cycle Intermediates and Precursors and the Estimation of High Temperature and Pressure Equation of State Parameters" International Journal of Molecular Sciences 10, no. 6: 2809-2837. https://doi.org/10.3390/ijms10062809
APA StyleDalla-Betta, P., & Schulte, M. (2009). Calculation of the Aqueous Thermodynamic Properties of Citric Acid Cycle Intermediates and Precursors and the Estimation of High Temperature and Pressure Equation of State Parameters. International Journal of Molecular Sciences, 10(6), 2809-2837. https://doi.org/10.3390/ijms10062809