Abstract
Microwave sidebands of CO2 laser lines were used as an infrared source in infrared microwave double resonance spectroscopy and infrared saturation spectroscopy to study the C-O stretching fundamental band of methanol. In the former application, rotational lines in the vCO = 1 state have been observed with good signal to noise ratios and physical processes involved in this method have been discussed. In the latter method, (vt, A/E, K) = (2, A, 4) sequence transitions in the C-O stretching fundamental band have been identified and term values for the (2, A, 4) levels in the vCO = 1 state have been determined.
Introduction
Microwave sidebands of CO2 laser lines are useful infrared sources for spectroscopy in the 10-μm region due to their tunability, high power and high spectral purity. In this paper two applications related with saturated absorption to the spectroscopy for the C-O stretching fundamental band of the methanol molecule are reported: (1) infrared-microwave double resonance spectroscopy and (2) infrared saturation spectroscopy. The C-O stretching fundamental band of methanol has been studied by many researchers because of spectroscopic interest and practical interest related to optically-pumped far-infrared lasers. This band has been studied by infrared Fourier transform (FT) spectroscopy [1] and the data given in Ref. [1] are now widely used. However, in the FT spectrum, where resolution is limited by the Doppler width of 60 MHz and where frequency accuracy is several megahertz, there are many blended features and unidentified lines. Therefore the study of this band by the sub-Doppler method is necessary.
The available power from an infrared source using microwave sidebands of CO2 laser line is a few milliwatts or more. It is usually sufficient for saturating infrared transitions at low pressures as is shown by the following numerical example. A transition moment for a vibration-rotational transition μ is given by μvΦR [2], where dipole moment μv and direction cosine ΦR are related to the change of the vibrational state and that of rotational state, respectively; as typical values, μv and ΦR are assumed to be 0.1 D and 1/3, respectively. This transition is saturated when μE/h ~Δν, where E is the amplitude of the laser electric field, μE/h is the Rabi-frequency of this transition, and Δν is the collisional width (HWHM). The Rabi frequency for an infrared beam with a power of 2mW and a diameter of 3 mm is 0.054 MHz, when a uniform distribution of light intensity over the cross section is assumed. A transition of molecules with a pressure broadening parameter of 20 MHz/Torr (HWHM) can be saturated up to 3 mTorr. Since the frequencies of CO2 laser lines can be determined with a high precision, an infrared source using the CO2 laser sidebands has high absolute frequency accuracy. Due to the high power and high frequency accuracy, this radiation source is most suited for sub-Doppler spectroscopy in the 10-μm infrared region.
In the infrared-microwave double resonance spectroscopy, microwave transitions or rotational transitions are observed as changes in infrared absorptions. In case the rotational transition is in the vCO = 1 state of CH3OH, a strong double resonance signal is observed when the infrared transition is saturated. This observation is useful to the study of energy levels in the vCO = 1 state. In case the rotational transition is in the ground vibrational state, a strong signal is observed when the infrared transition is saturated. Even when infrared transition is not saturated, however, a weaker signal is observed due to the change in populations in the ground state levels caused by microwave transition. The double resonance signal in this case is useful for the assignment of infrared transitions. In either case, it is shown in this report that double resonance signals have been observed with high signal-to-noise ratios.
The saturation spectroscopy has been applied to the observation of inverse Lamb dips for the (vt, A/E, K) = (2, A, 4) sequence lines in the C-O stretching fundamental band. It has been listed in Ref. [1] that Q-branch lines up to J = 13 and P- and R-branch lines up to higher J in the (2, A, 4) sequence overlap with the corresponding lines in the (2, E, -2) sequence. We have identified transitions for the (2, A, 4) sequence by their Stark effects and the loop check using the Ritz’s combination rule but have not yet identified (2, E, -2) lines. Term values of (2, A, 4) levels in the vCO = 1 state have been determined for J up to 15.
Experimental
A. Radiation Source
The microwave modulator of the CO2 laser radiation used in our experiment has been developed by Cheo [3]. The infrared beam of 10-15 W from a CO2 laser and microwave radiation with a power of ~20 W in the 8-18 GHz frequency range produced by a synthesized sweeper and a TWT amplifier were used as an input to the modulator. The output infrared beam from the modulator with a transmission of 20 % consisted of a carrier and two sidebands with a typical sideband-to-carrier ratio of 0.8 % for each sideband. A desired sideband was selected by a Fabry-Perot filter with a free spectral range of 50 GHz and a finesse of 70. The transmission at a center frequency of the filter was ~30 %. So the available power for a sideband in this system was a few milliwatts or more. This power is sufficient for saturating infrared transitions at low sample pressures as was shown above.
B. Double resonance spectroscopy
The details of experimental setup has been given elsewhere [2]. The double resonance cell was a 1.2 m section of a microwave waveguide with two ZnSe Brewster windows for a laser beam and with two bent arms used for introducing and monitoring the microwave power. The microwave radiation from a klystron was frequency modulated with a few megahertz depth by 100 kHz square waves. To have higher infrared powers in the cell, a desired sideband was separated from the carrier not before but after the beam passed through the cell by the Fabry-Perot filter and was detected by an infrared detector followed by a lock-in-amplifier locked to 100 kHz. For the observation of a double resonance signal a microwave sideband was tuned to an infrared molecular transition while microwave frequency was scanned.
C. Saturation Spectroscopy
A multi-reflection cell with Stark electrodes was used to observe inverse Lamb dips of vibration-rotational lines and their Stark components. The cell was made of a Pyrex glass tube of 1.5 m length and 100 mm diameter containing three mirrors and a pair of electrodes separated by spacers of 8 mm thickness [4]. A dc voltage for Stark effect and sine-wave voltage at 30 kHz for Stark modulation were applied to one of the electrodes. The sideband laser beam which made 4-round trips in the cell was detected by an infrared detector followed by a lock-in-amplifier tuned to 30 kHz.
Observed Results
A. Infrared Microwave Double Resonance
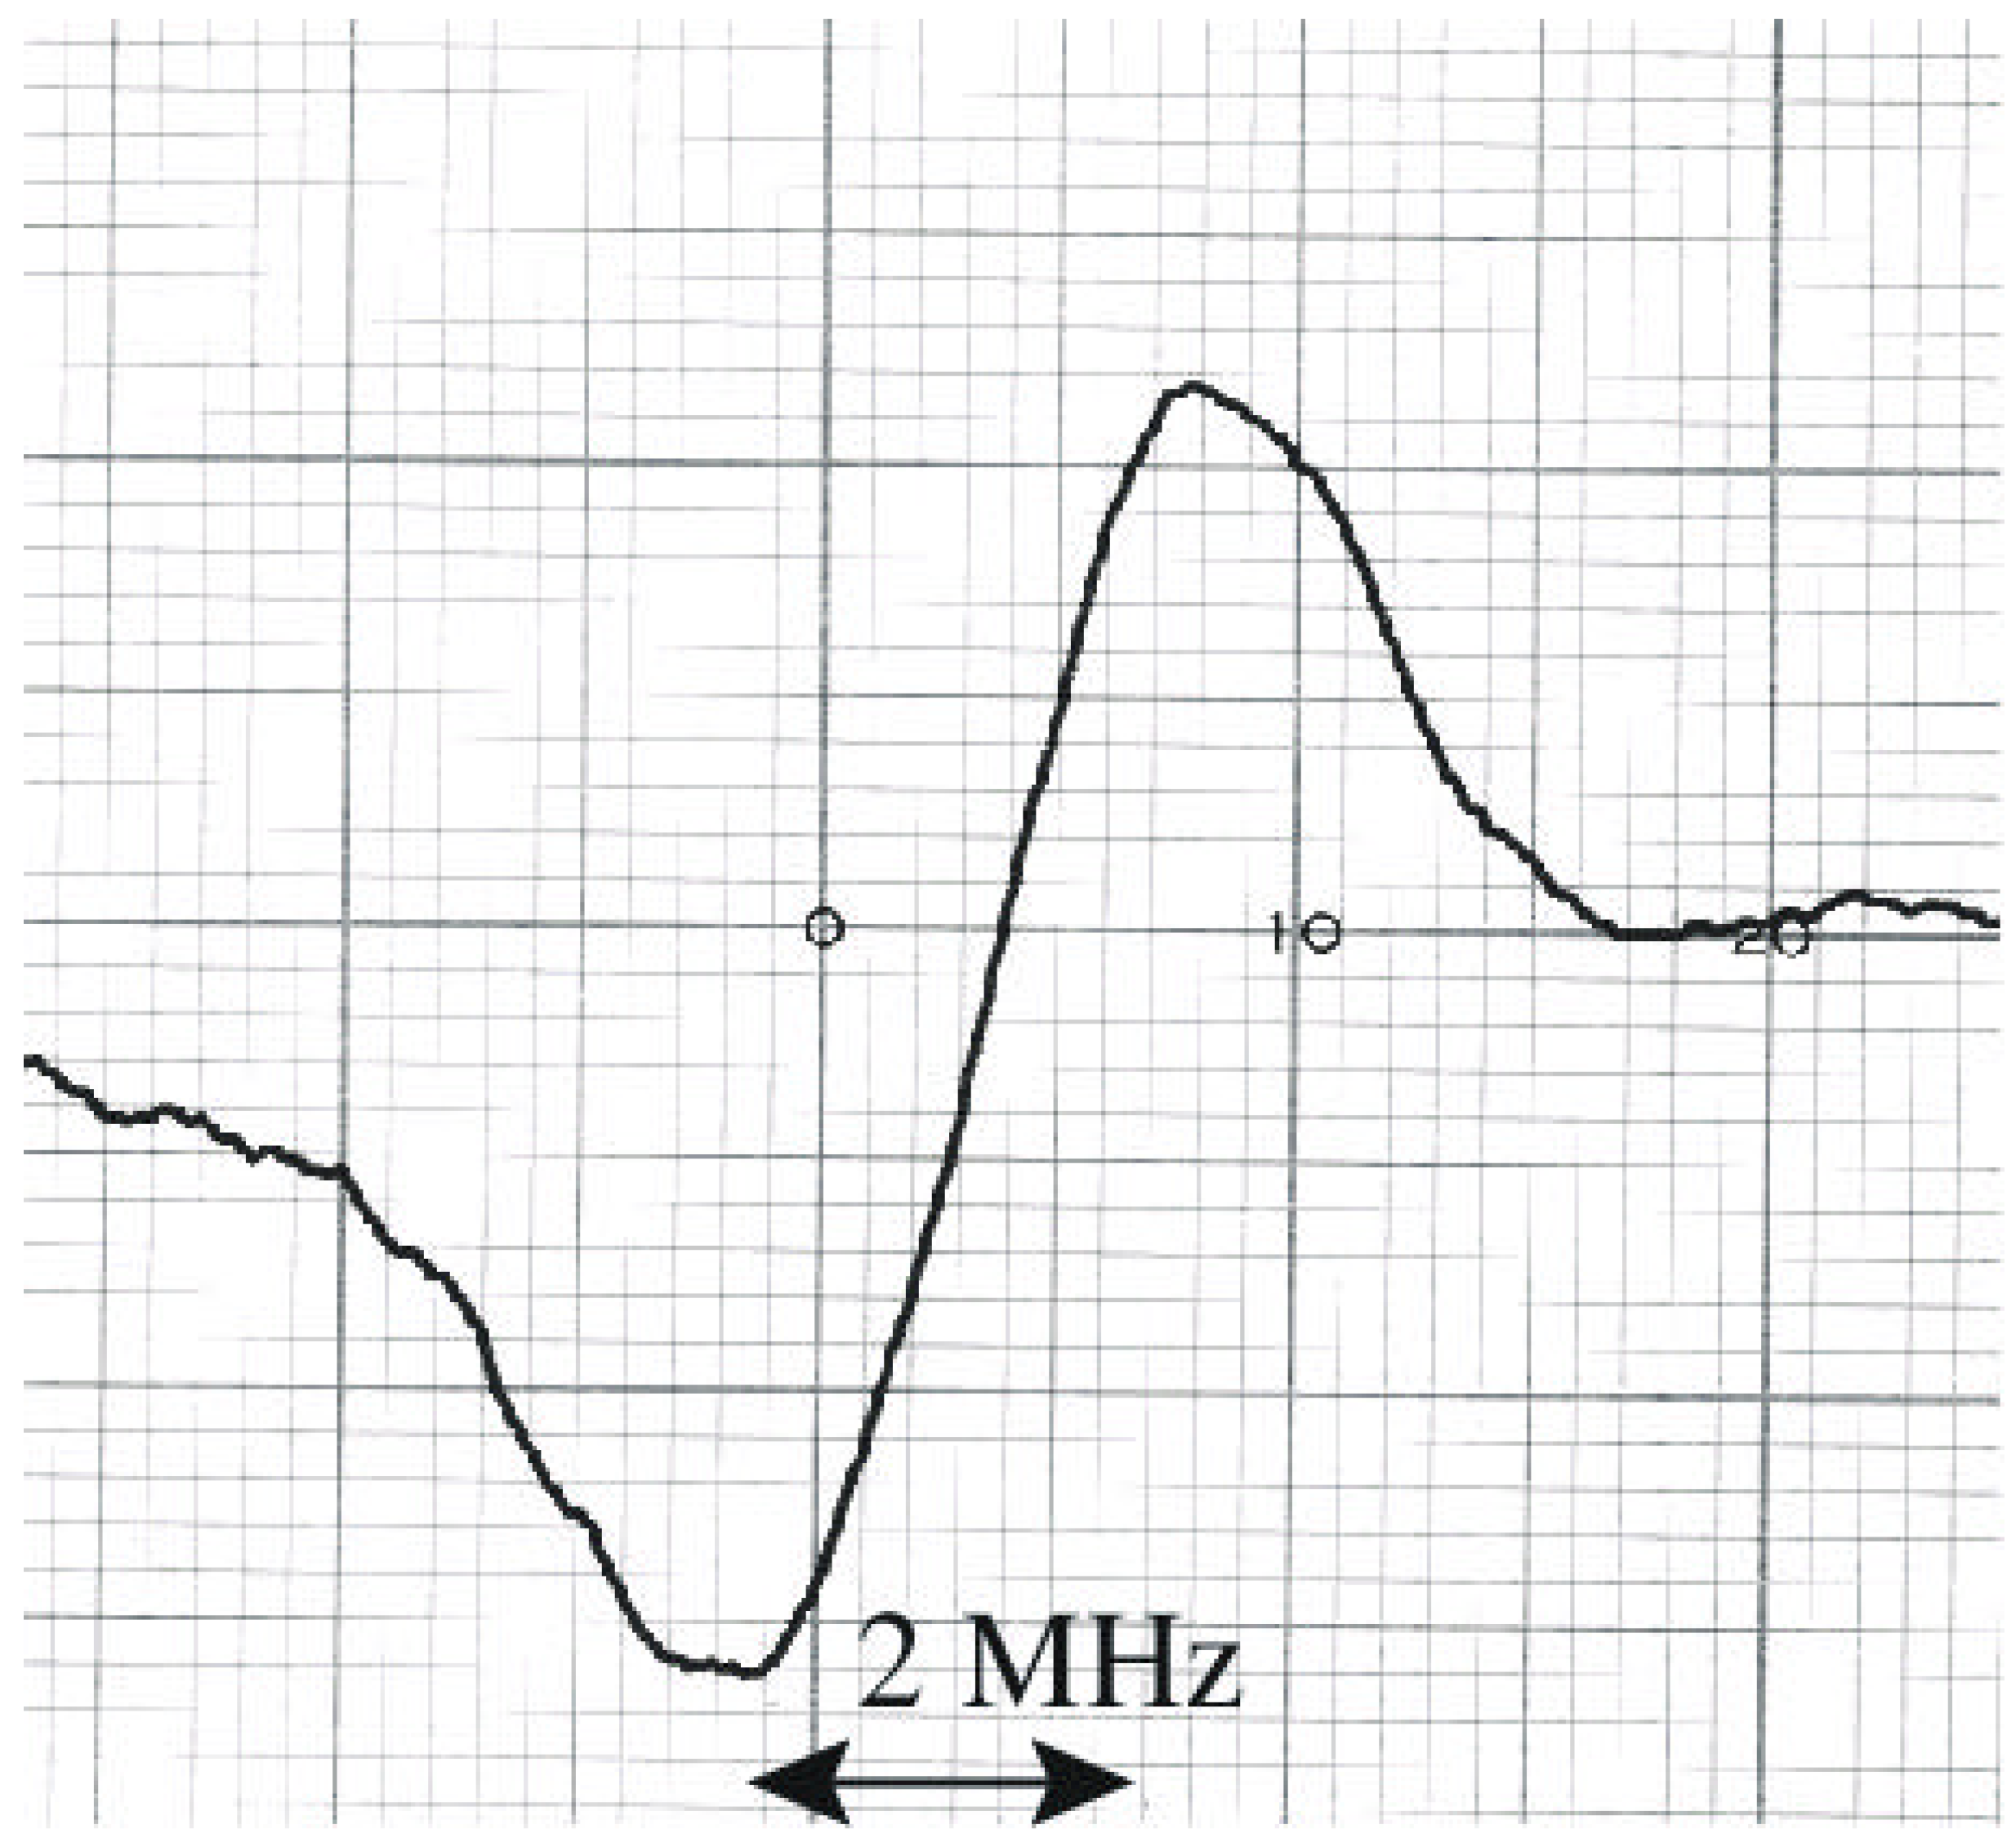
As an example of the double resonance signals where infrared transitions are well saturated, a recorder tracing of the double resonance signal of CH3OH at a sample pressure of 6 mTorr for the vt = 0, E, (J, K) = (16,2) ← (16,1) transition in the vCO = 1 state is shown in Figure1.

Figure 1.
Recorder tracing of the microwave transition υco = 1, E, 162 ← 161, of CH3OH at 49908.35 MHz with the infrared transition 161, υco = 1 ← 151, υco = 0. The sample pressure is 6 mTorr. The maximum and the minimum of the signal are separated by 2 MHz in frequency, coming from the microwave frequency modulation.
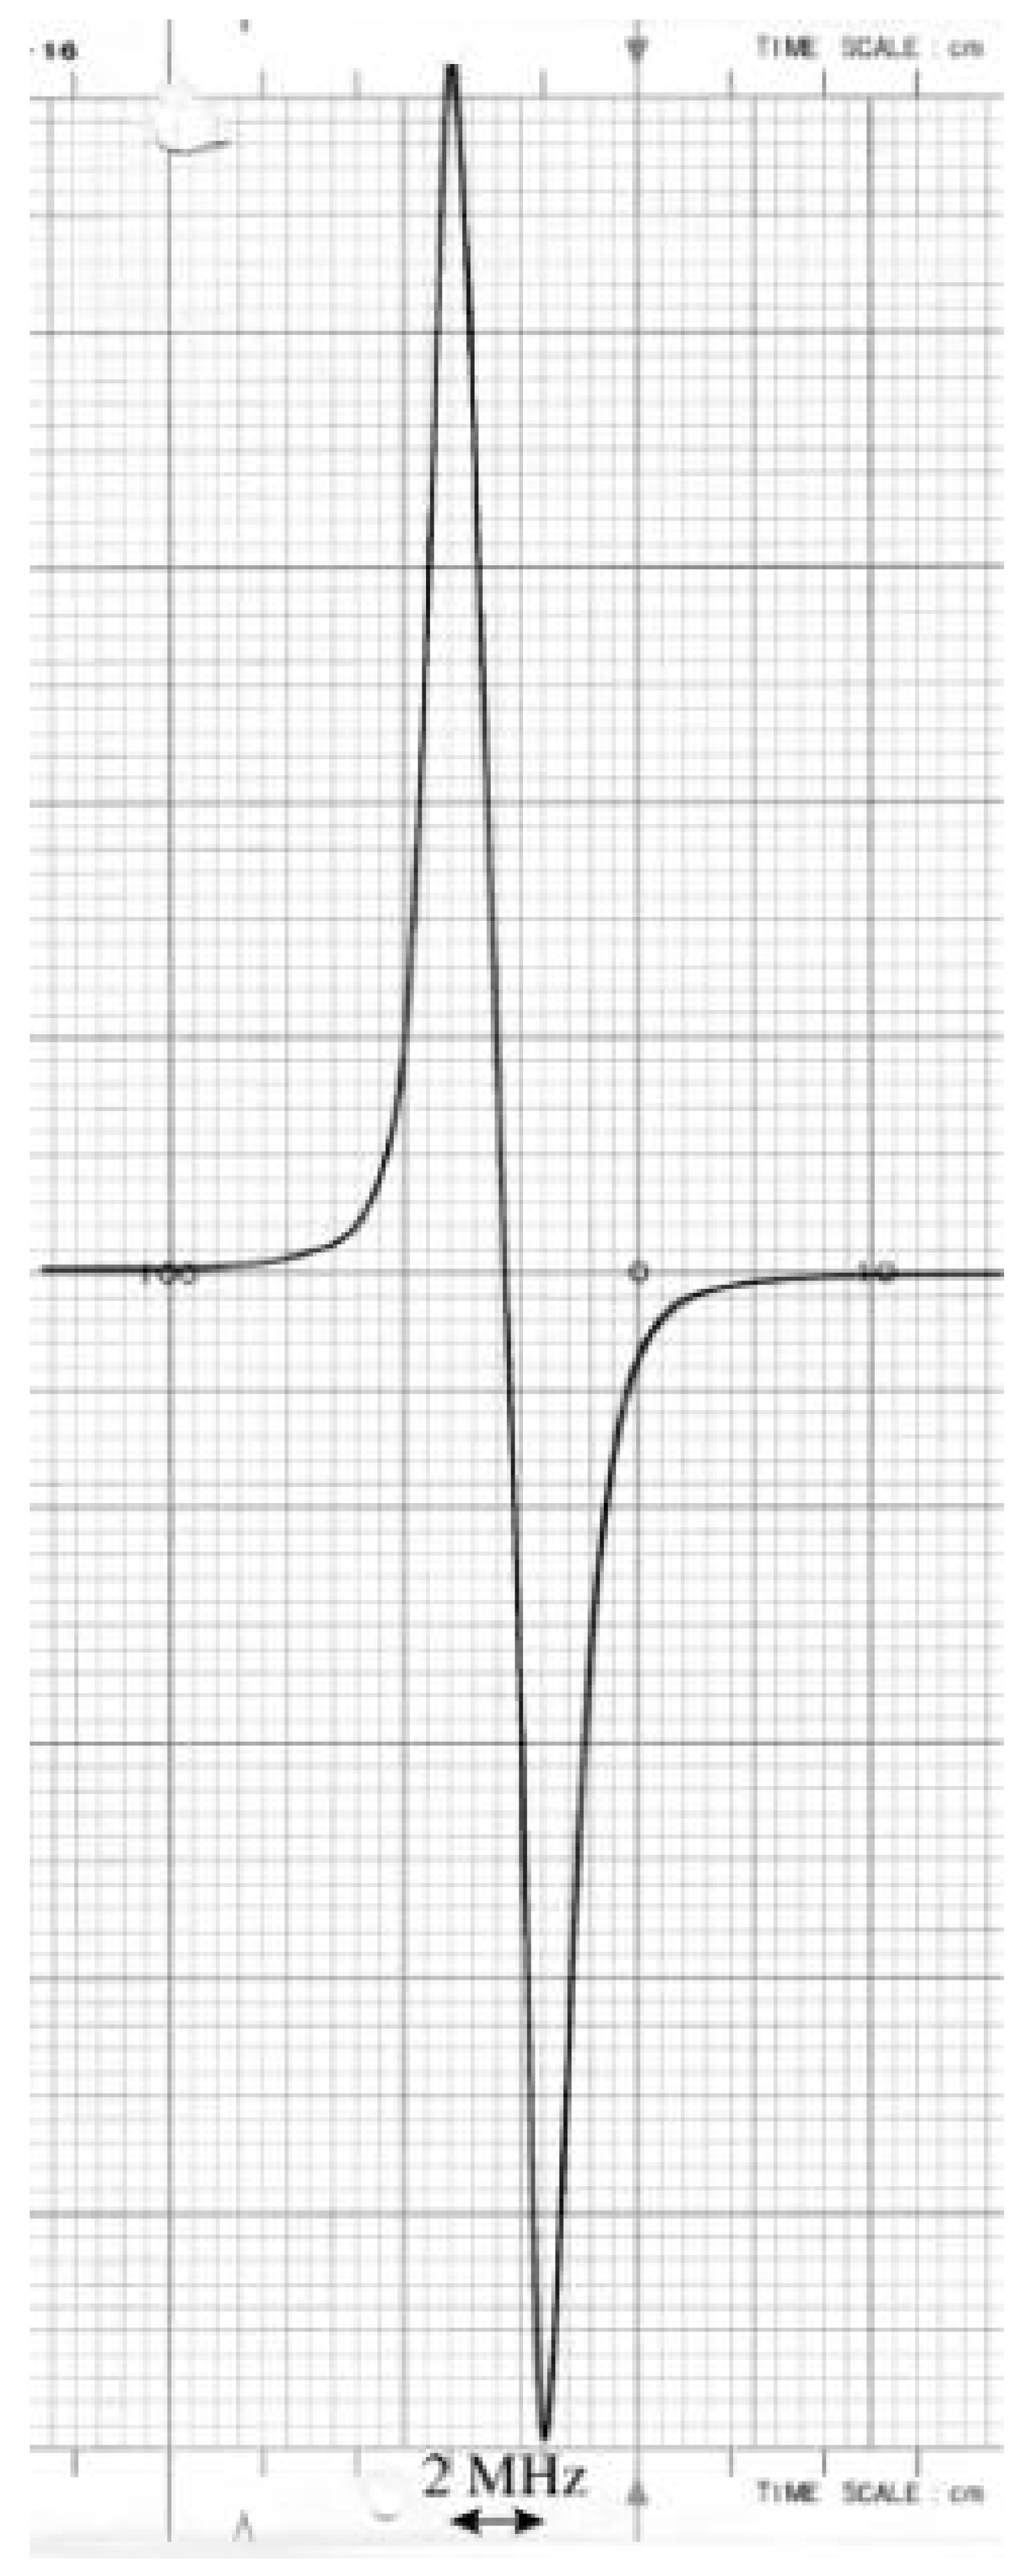
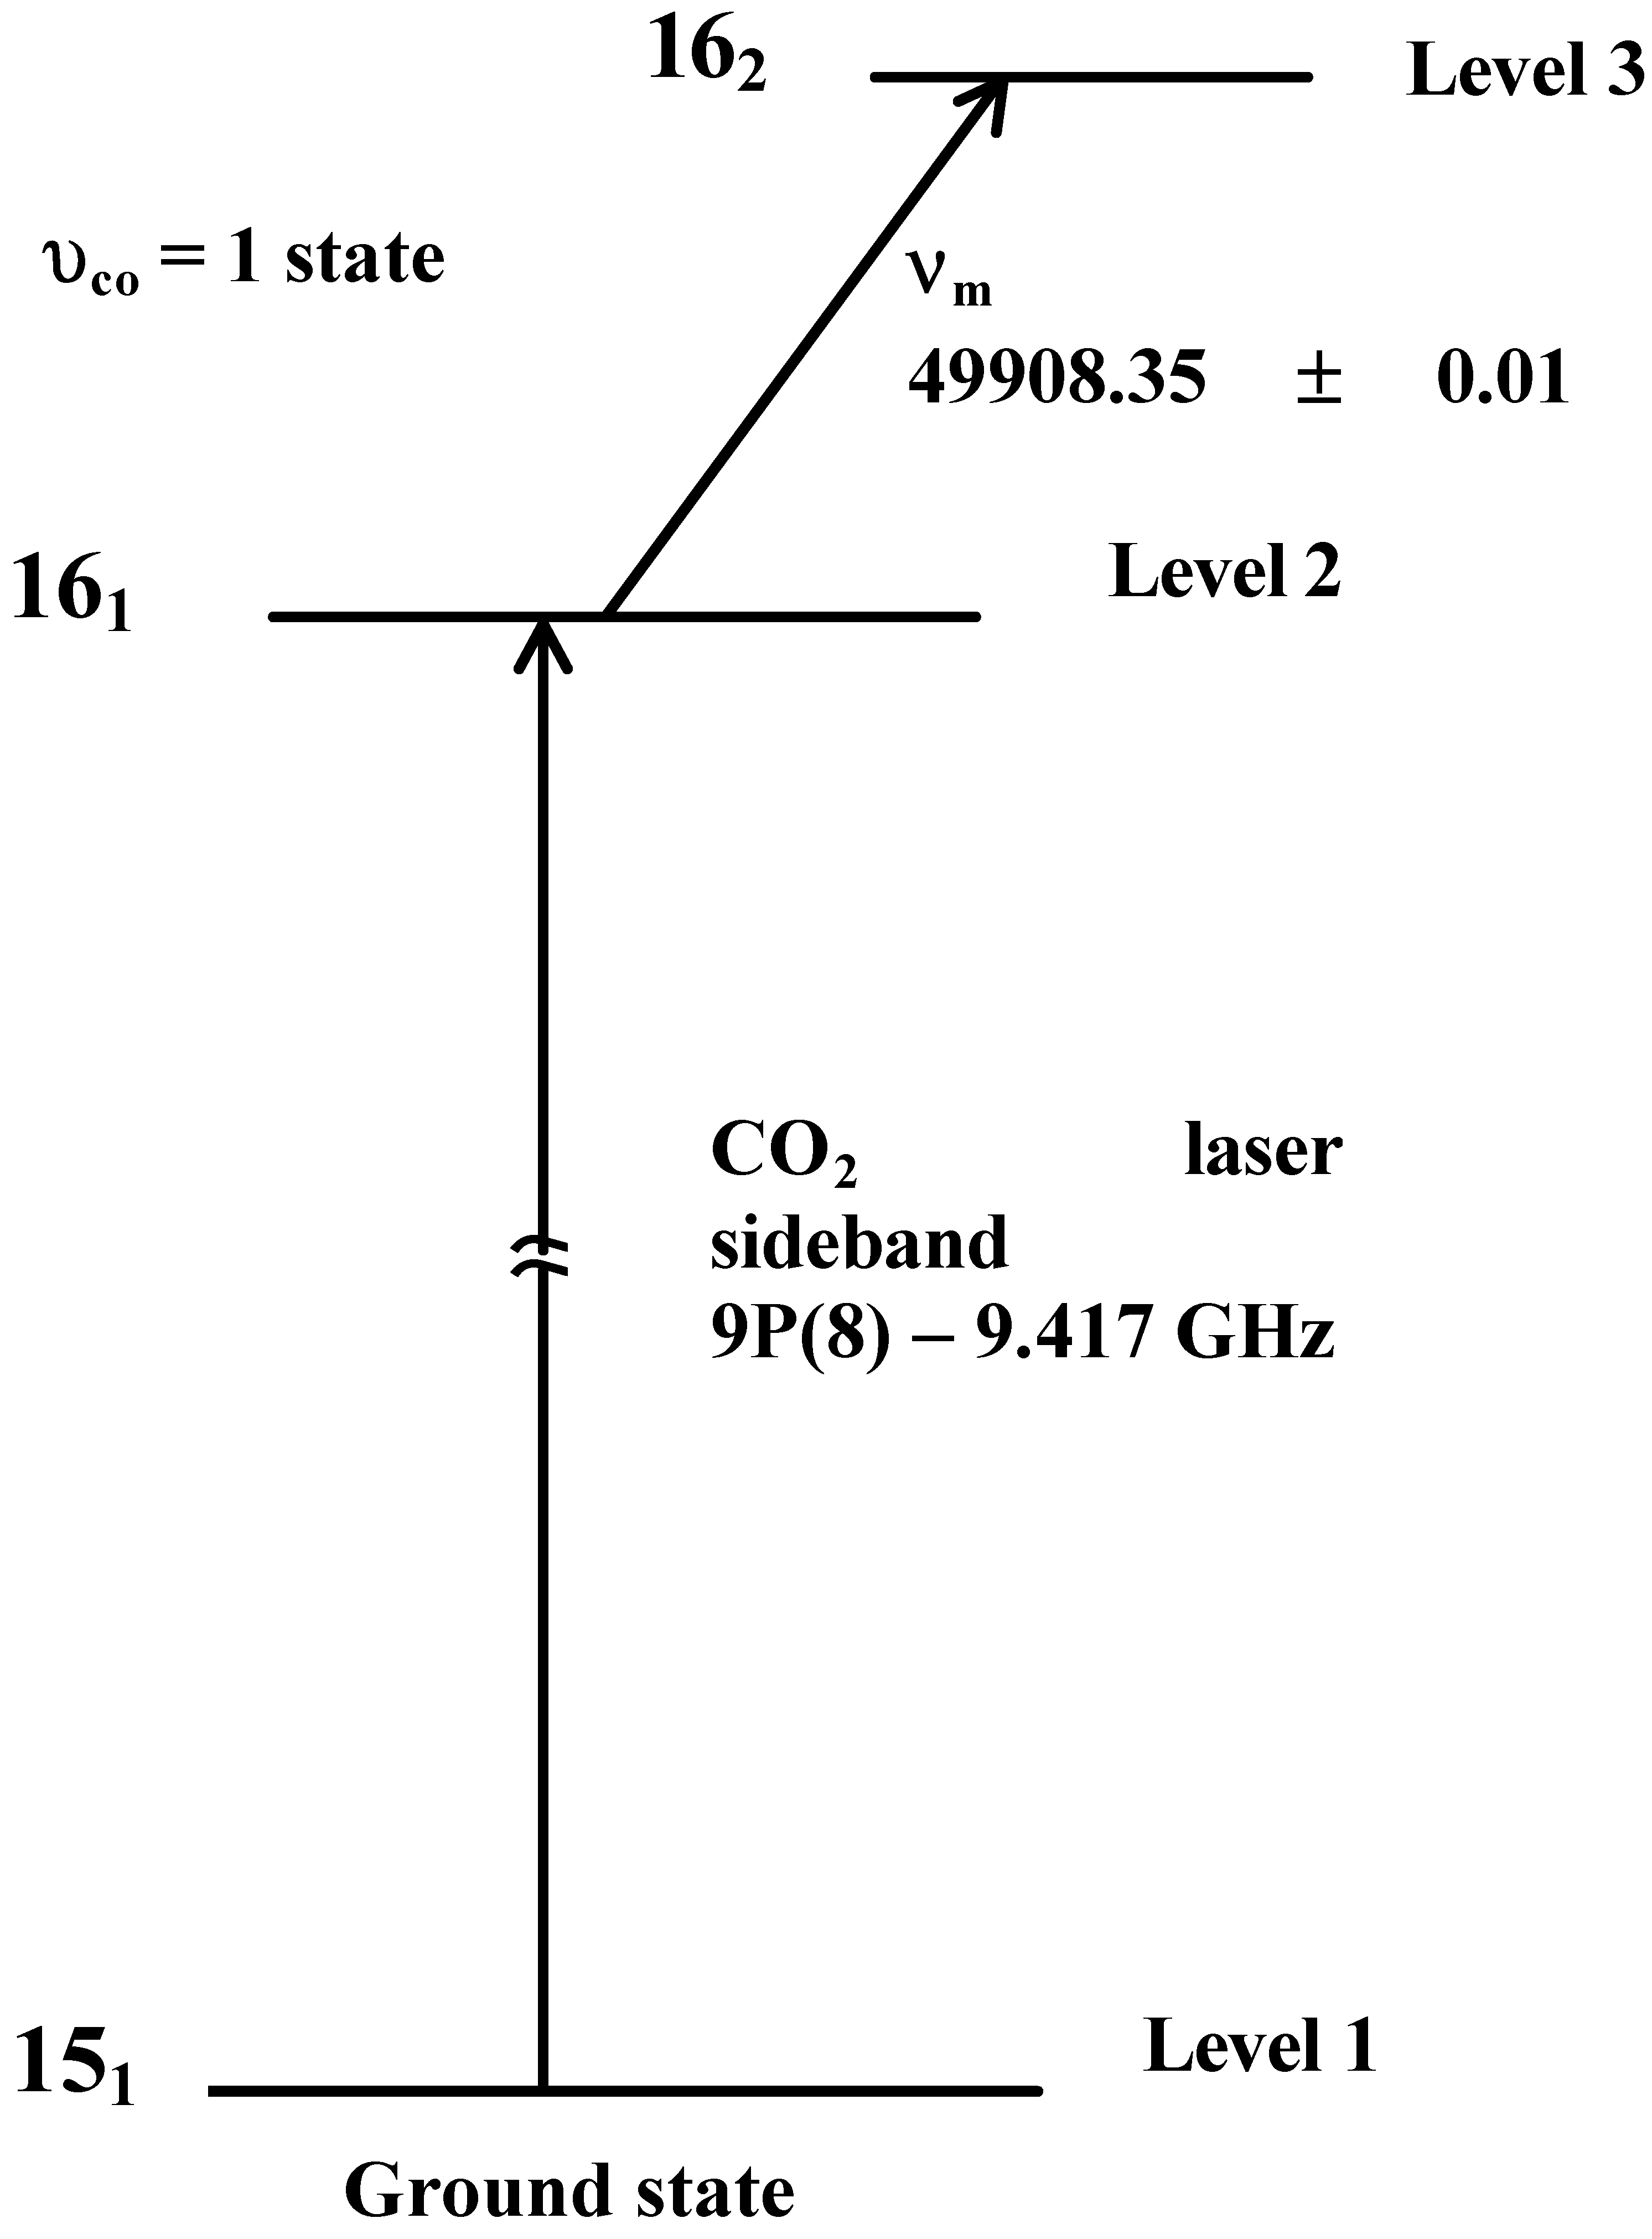
The relevant energy levels involved in the double resonance are shown in Figure 2. Many other rotational transitions in this excited vibrational state have been observed with high signal-to-noise ratios [2].
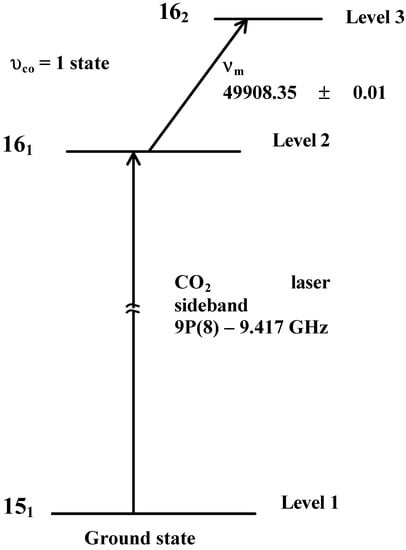
Figure 2.
Energy levels relevant to the signal shown in Figure 1.
Figure 2.
Energy levels relevant to the signal shown in Figure 1.
Theoretical calculation for the pressure dependence of the double resonance signal [2,5] shows that a signal is strongest at an optimum pressure where Δν~μE/h. The optimum pressures for many observed signals are ~10 mTorr, which show that Rabi-frequencies are ~0.2 MHz since the pressure broadening parameter of CH3OH is 20 MHz/Torr [6]. For the C-O stretching fundamental band, μv = 0.195 D [2]. When μ = μv ΦR is assumed to be 0.06 D, the infrared power is 4 mW for a beam width of 3 mm diameter, which agrees with the available power for our infrared source.
As an example of the double resonance signals in case that signals are observed due to the changes in populations in the ground state levels, a recorder tracing of the double resonance signal of CH3OH for E, (J, K) = (1, 0) ← (2, -1) at 60531.47 MHz in the ground state at a sample pressure of 167 mTorr is shown in Figure 3.
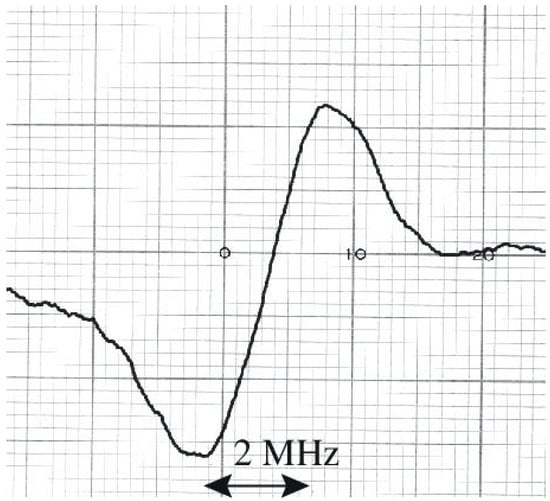
Figure 3.
Recorder tracing of the microwave transition E, 10 ← 2−1 in the ground state at 60531.47 MHz with the infrared transition 1−1, υco = 1 ← 2−1, υco = 0. The sample pressure is 167 mTorr. The maximum and the minimum of the signal are separated by 2 MHz in frequency, coming from the microwave frequency modulation.
The relevant energy levels are shown in Figure 4. It is noted that the sign of the signal in Figure 3 is inverted from that shown in Figure 1. When the sample pressure is increased from zero, the signal intensity increases with the pressure, reaches a maximum at 10 - 20 mTorr, decreases with the pressure until it becomes zero at the crossover pressure pc. The signal changes its sign at higher pressures, reaches a maximum (Figure 3) and then decreases with the pressure. A theoretical calculation shows that (μE/h)/Δν= 2δ1/2 at pc for δ = (N1 - N2)/N1 = 0.01 where N1 and N2 are the thermal equilibrium populations of levels 1 and 2, respectively. The transition moment μ for E, (J, K) = (1,-1), vCO = 1 ← (J, K) = (2, -1), vCO = 0 is ~0.08 D ( 0.076 D and 0.087 D for M = 1 and 0, respectively, where M is the magnetic quantum number). For an observed value of pc ~0.08 Torr the infrared power in the cell is 6 mW using a beam diameter of 3 mm, which also agrees with the available power of the infrared source.
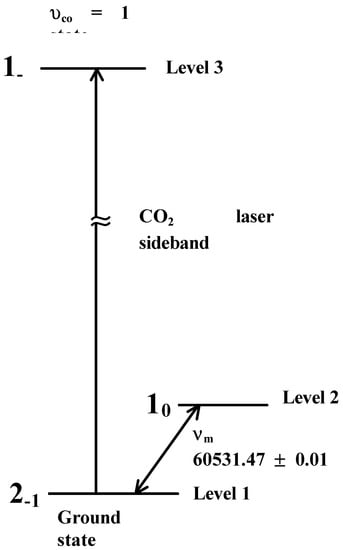
Figure 4.
Energy levels relevant to the signal shown in Figure 3.
Figure 4.
Energy levels relevant to the signal shown in Figure 3.

B. Saturation Spectroscopy - Observation of Inverse Lamb Dips for the (2, A, 4) Sequence Lines
Spectral lines for the (vt, A/E, K) = (2, A, 4) and (2, E, -2) sequences in the C-O stretching fundamental band were searched near the wave numbers listed in Ref. [1]. The (2, A, 4) sequence transitions have been assigned and their wave numbers have been measured with an uncertainty of 6 × 10⁻⁶ cm-1 (0.2 MHz) as are shown in Table 1.

Table 1.
Observed Transitions for the (2,A, 4) Sequence in the C − O Stretching Fundamental Band of Methanol
| Transition (J, K) | CO2 Laser Sideband (MHz) | νobsa (cm−1) | νcalcb (cm−1) | νobs − νcalc (MHz) | |
| P(5, 4) | 9P(40) +15994.38 | 1027.915686 | 1027.915693 | −0.21 | |
| Q(14, 4) | 9P(34) +16060.73 | 1034.023727 | 1034.023724 | 0.08 | |
| Q(10, 4) | 9P(32) −13067.16 | 1035.037742 | 1035.037751 | −0.27 | |
| Q(9, 4) | −6979.01 | 1035.240821 | 1035.240818 | 0.09 | |
| Q(6, 4) | +7644.13 | 1035.728597 | 1035.728618 | −0.62 | |
| Q(5, 4) | +11302.30 | 1035.850620 | 1035.850625 | −0.15 | |
| Q(4, 4) | +14351.03 | 1035.952315 | 1035.952293 | −0.65 | |
| R(5, 4) | 9P(22) +10506.94 | 1045.372144 | 1045.372158 | −0.41 | |
| R(7, 4) | 9P(18) −11406.03 | 1048.280346 | 1048.280305 | 1.23 | |
| R(10, 4) | 9P(14) +8781.12 | 1052.488452 | 1052.488471 | −0.57 | |
| R(12, 4) | 9P(10) −13012.84 | 1055.191006 | 1055.190996 | 0.29 | |
| R(14, 4) | 9P(8) +15321.56 | 1057.811234 | 1057.811237 | −0.09 | |
a The observed wave numbers were calculated from the measured frequencies of CO2 laser sidebands by use of 299 792 458 m/s for the speed of light. Frequencies of the CO2 laser lines listed by Freed et al. [8] were used;b νcalc refers to the calculated frequencies from the Taylor-series expansion coefficients in Table 3.
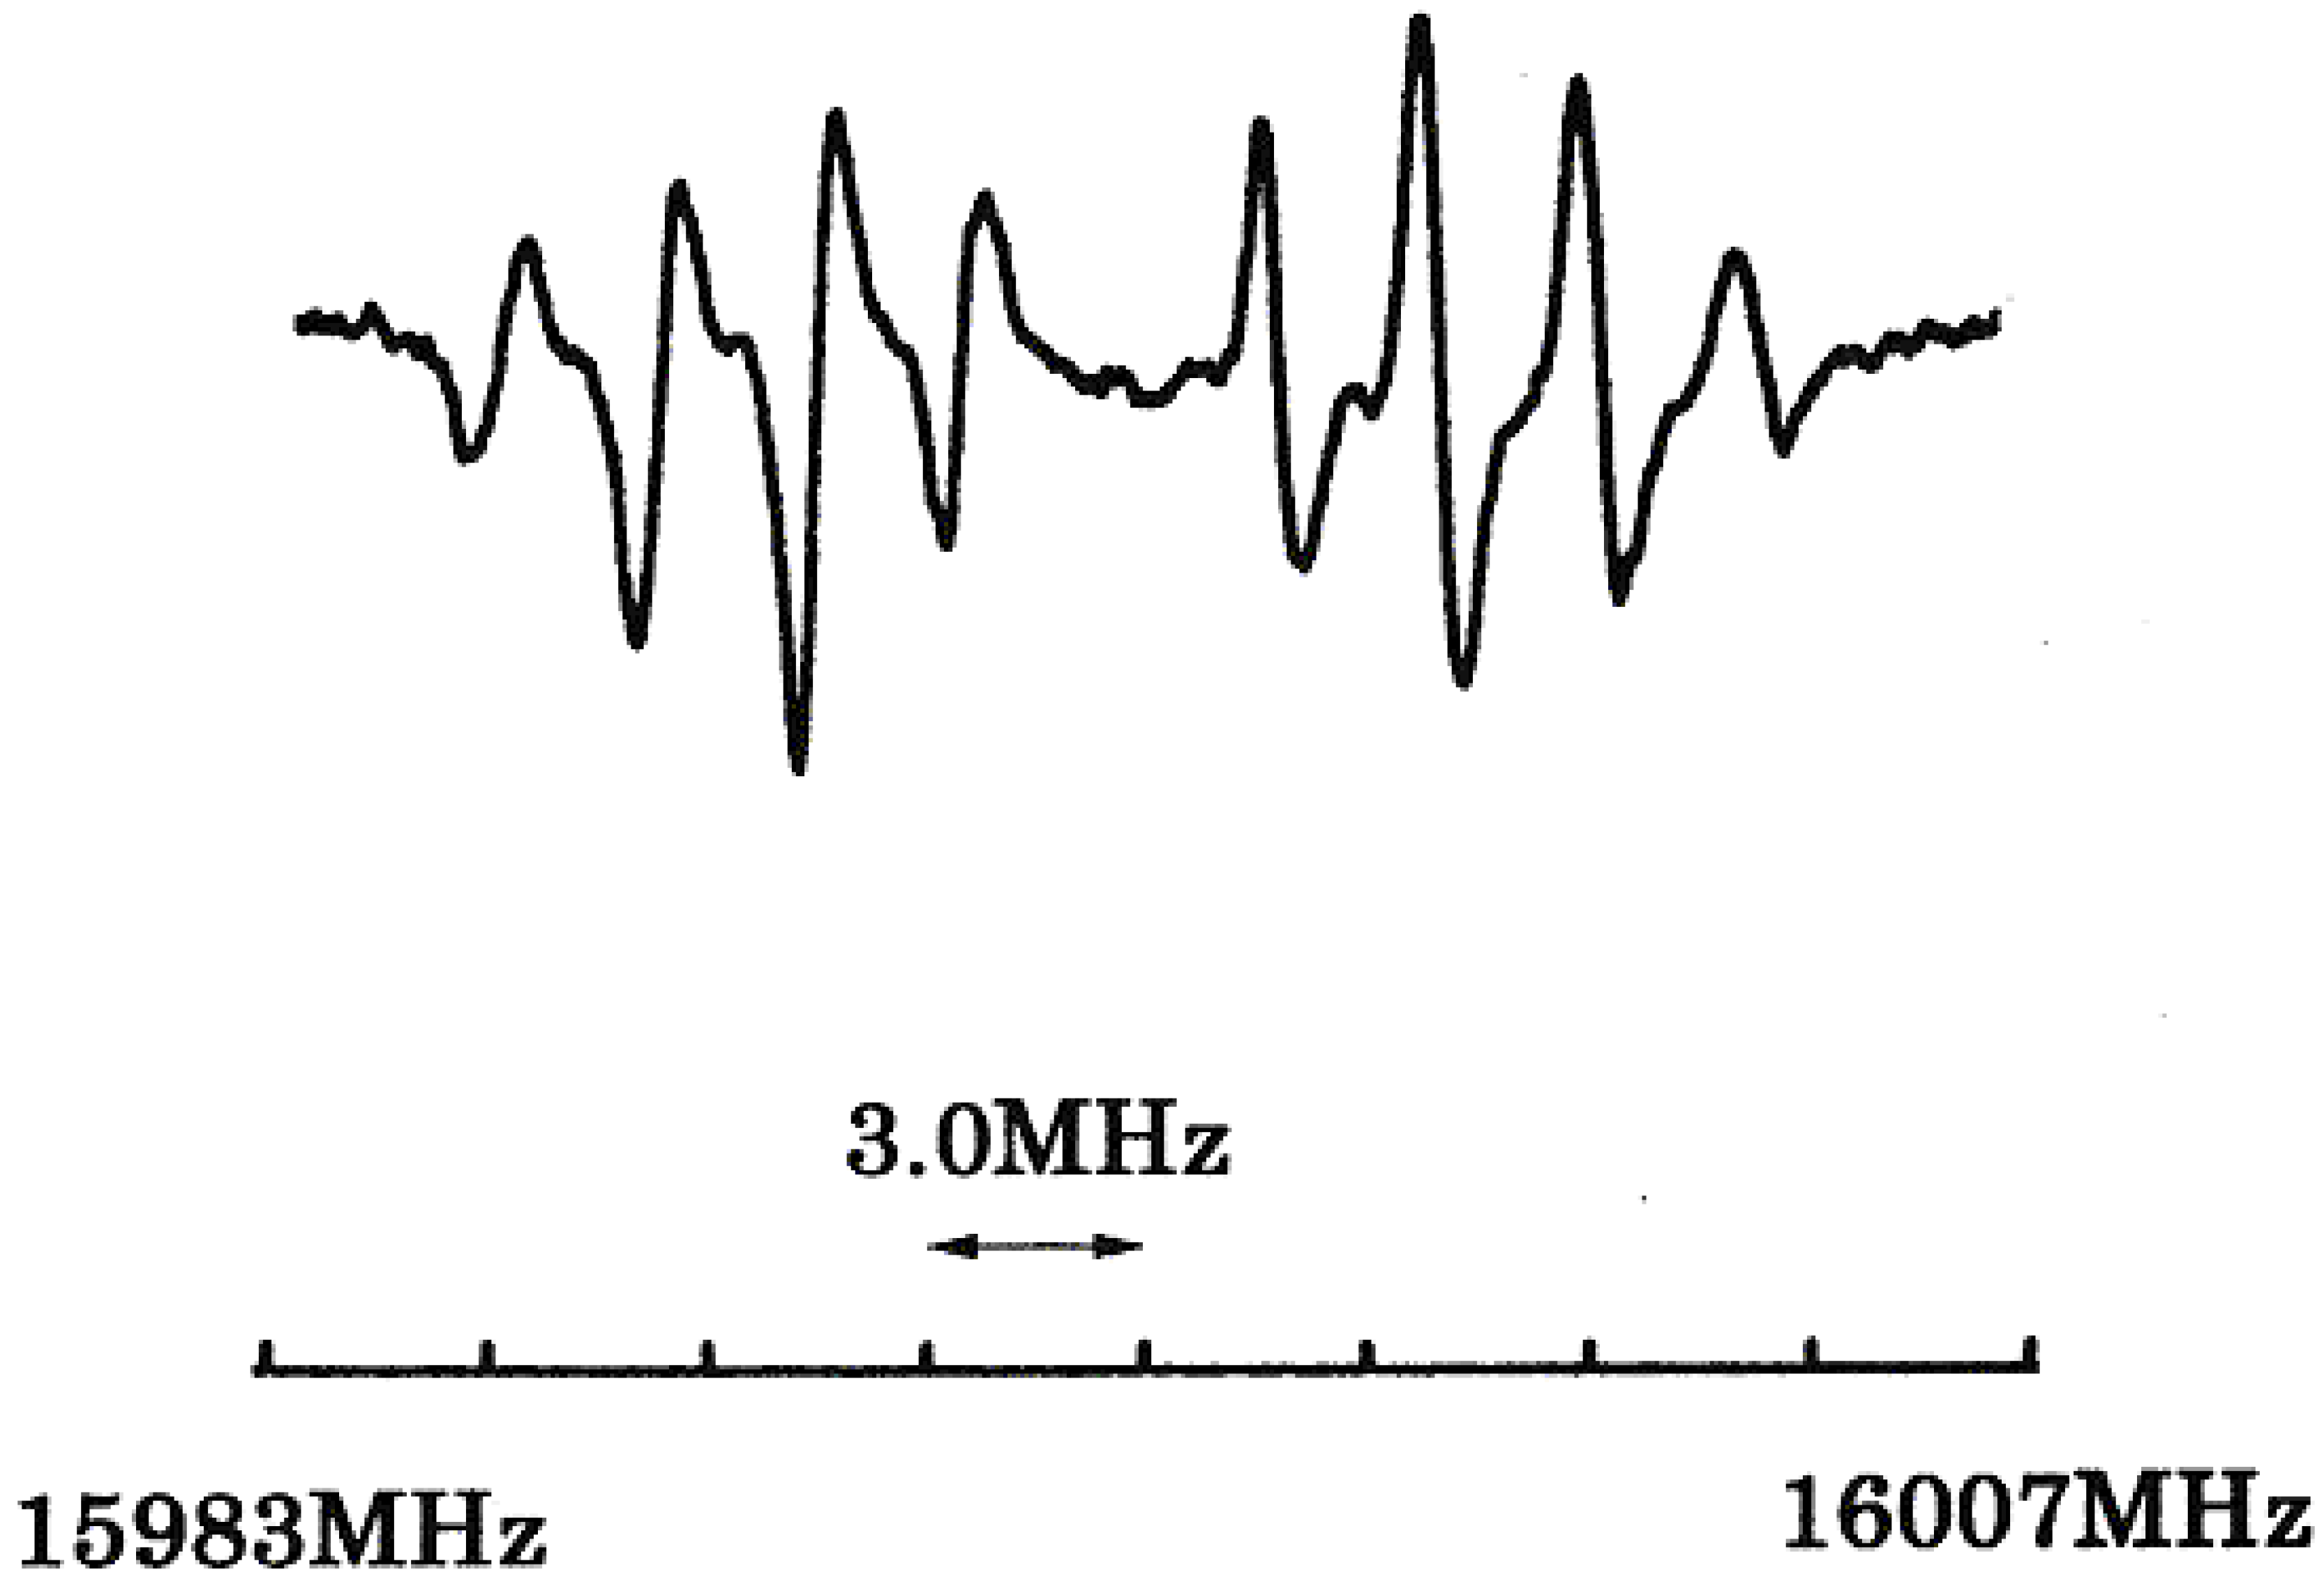
Stark effects on all the observed lines were observed to confirm their assignments. Figure 5 shows a Stark pattern of the P(5) line at the electric field of 62.5 V/cm. For a pair of P(5) and Q(4) and that of R(5) and Q(6), the assignments have been confirmed by use of the Ritz’s combination rule. For the former pair with a rotational frequency of 240932.018 MHz for the E, vt = 2, (J, K) = (5, 4) ← (4, 4) transition for vCO = 0 [7], the loop error is 0.06 MHz; the latter pair with a rotational frequency of 289106.109 MHz for the E, vt = 2, J, K = (6, 4) ← (5, 4) transition for vCO = 0 [7], the loop error is 0.16 MHz: the both errors are within an experimental uncertainty.

Figure 5.
Stark pattern of the P(5,4) line in the (2,A, 4) sequence observed with the upper sideband of 9P(40) CO2 laser line. The horizontal axis is the modulation frequency. The Stark field is dc-bias of 62.5 V/cm with sine-wave modulation of 12.5 V/cm p-p.
Figure 5.
Stark pattern of the P(5,4) line in the (2,A, 4) sequence observed with the upper sideband of 9P(40) CO2 laser line. The horizontal axis is the modulation frequency. The Stark field is dc-bias of 62.5 V/cm with sine-wave modulation of 12.5 V/cm p-p.
From observed wave numbers in Table 1 and term values in the vCO = 0 state [1], term values W (J) for the (2, A, 4) state have been determined as shown in Table 2. These term values are expanded to a Taylor series in J(J + l) as
and the expansion coefficients have been determined as shown in Table 3 with one standard deviation. The obs - calc values for the term values are a little larger than experimental uncertainties or the uncertainties in the ground state term values [1], showing small perturbation for this sequence lines. The (2, E, -2) sequence lines were searched for several tens megahertz near the (2, A, 4) lines but are yet to be observed. Intensities of these lines may be much weaker than those of the (2, A, 4) lines or their frequencies may be much more separated from those of (2, A, 4) lines than we expected.
W(J) = Σ am [J(J + 1)]m
Table 2.
Term Values W (J) of the (2,A, 4) Levels in the υco = 1 State of Methanol
| J | W obs a (cm−1) | Wobs – Wcalca (MHz) |
| 4 | 1607.101201 | 0.23 |
| 5 | 1615.036120 | –0.19 |
| 6 | 1624.557641 | –0.58 |
| 8 | 1648.359696 | 1.12 |
| 9 | 1662.639601 | 0.01 |
| 10 | 1678.505092 | –0.33 |
| 11 | 1695.955802 | –0.58 |
| 13 | 1735.611386 | 0.36 |
| 14 | 1757.815367 | 0.13 |
| 15 | 1781.602874 | –0.14 |
a The term values were calculated from the Taylor-series expansion coefficients in Table 3.
Table 3.
Taylor-Series Expansion Coefficients (in cm−1)a for the (2,A, 4) Levels in the υco = 1 State of Methanol
| na0 | na1 | na2 × 1010 | na3 × 1012 |
| 1591.230451(26) | 0.793566(1) | −14668(95) | 70(25) |
a Quoted numbers are one standard deviations in units of the last quoted digits.
Discussion and Conclusions
In the present study, the microwave sidebands of the CO2 laser lines were used as an infrared source in the 10-μm region for the infrared-microwave double resonance spectroscopy and infrared saturation spectroscopy. In both applications, frequencies were measured with a precision comparable with that of microwave spectroscopy.
It is obvious that the double resonance spectroscopy gives definite assignments of infrared transitions. In addition, saturation spectroscopy has two advantages over the Doppler-limited spectroscopy as to the assignment. The first advantage is that well-resolved Stark components of a line can be observed. The second advantage is that the combination rule is applied usefully to the assignment of spectral lines with the helps of wavelengths measured precisely. These two advantages have been shown in the study of the C-O stretching fundamental band of methanol.
References
- Moruzzi, G.; Winnewisser, B.P.; Winnewisser, M.; Mukhopadhyay, I.; Strumia, F. Microwave, Infrared and Laser Transitions of Methanol; CRC: Boca Raton, Fla., 1995). [Google Scholar]
- Sun, Z-D.; Matsushima, F.; Tsunekawa, S.; Takagi, K. J. Opt. Soc. Am. 1999, B 16, 1447–1454.
- Cheo, P.K.; Chu, Z.; Zhou, Y. Appl. Opt. 1993, 32, 836–841.
- Sun, Z-D.; Matsushima, F.; Tsunekawa, S.; Takagi, K. J. Opt. Soc. Am. 2000, B 17, 2068–2080.
- Takami, M.; Shimoda, K. Jpn. J. Appl. Phys. 1972, 11, 1648–1656.
- Lees, R. M.; Haque, S.S. Can. J. Phys. 1974, 52, 2250–2271.
- Anderson, T.; DeLucia, F.C.; Herbst, E. Astrophys. J. Suppl. 1990, 72, 797–814.
- Freed, C.; Bradley, L.C.; O’Donnell, R.G. IEEE J. Quantum Electron. 1980, QE-16, 1195–1206.
© 2003 by MDPI ( http://www.mdpi.org). Reproduction is permitted for noncommercial purposes