
Selective Extraction of Aromatics from Slurry Oil with Subcritical Water

 ,
,
Abstract
1. Introduction
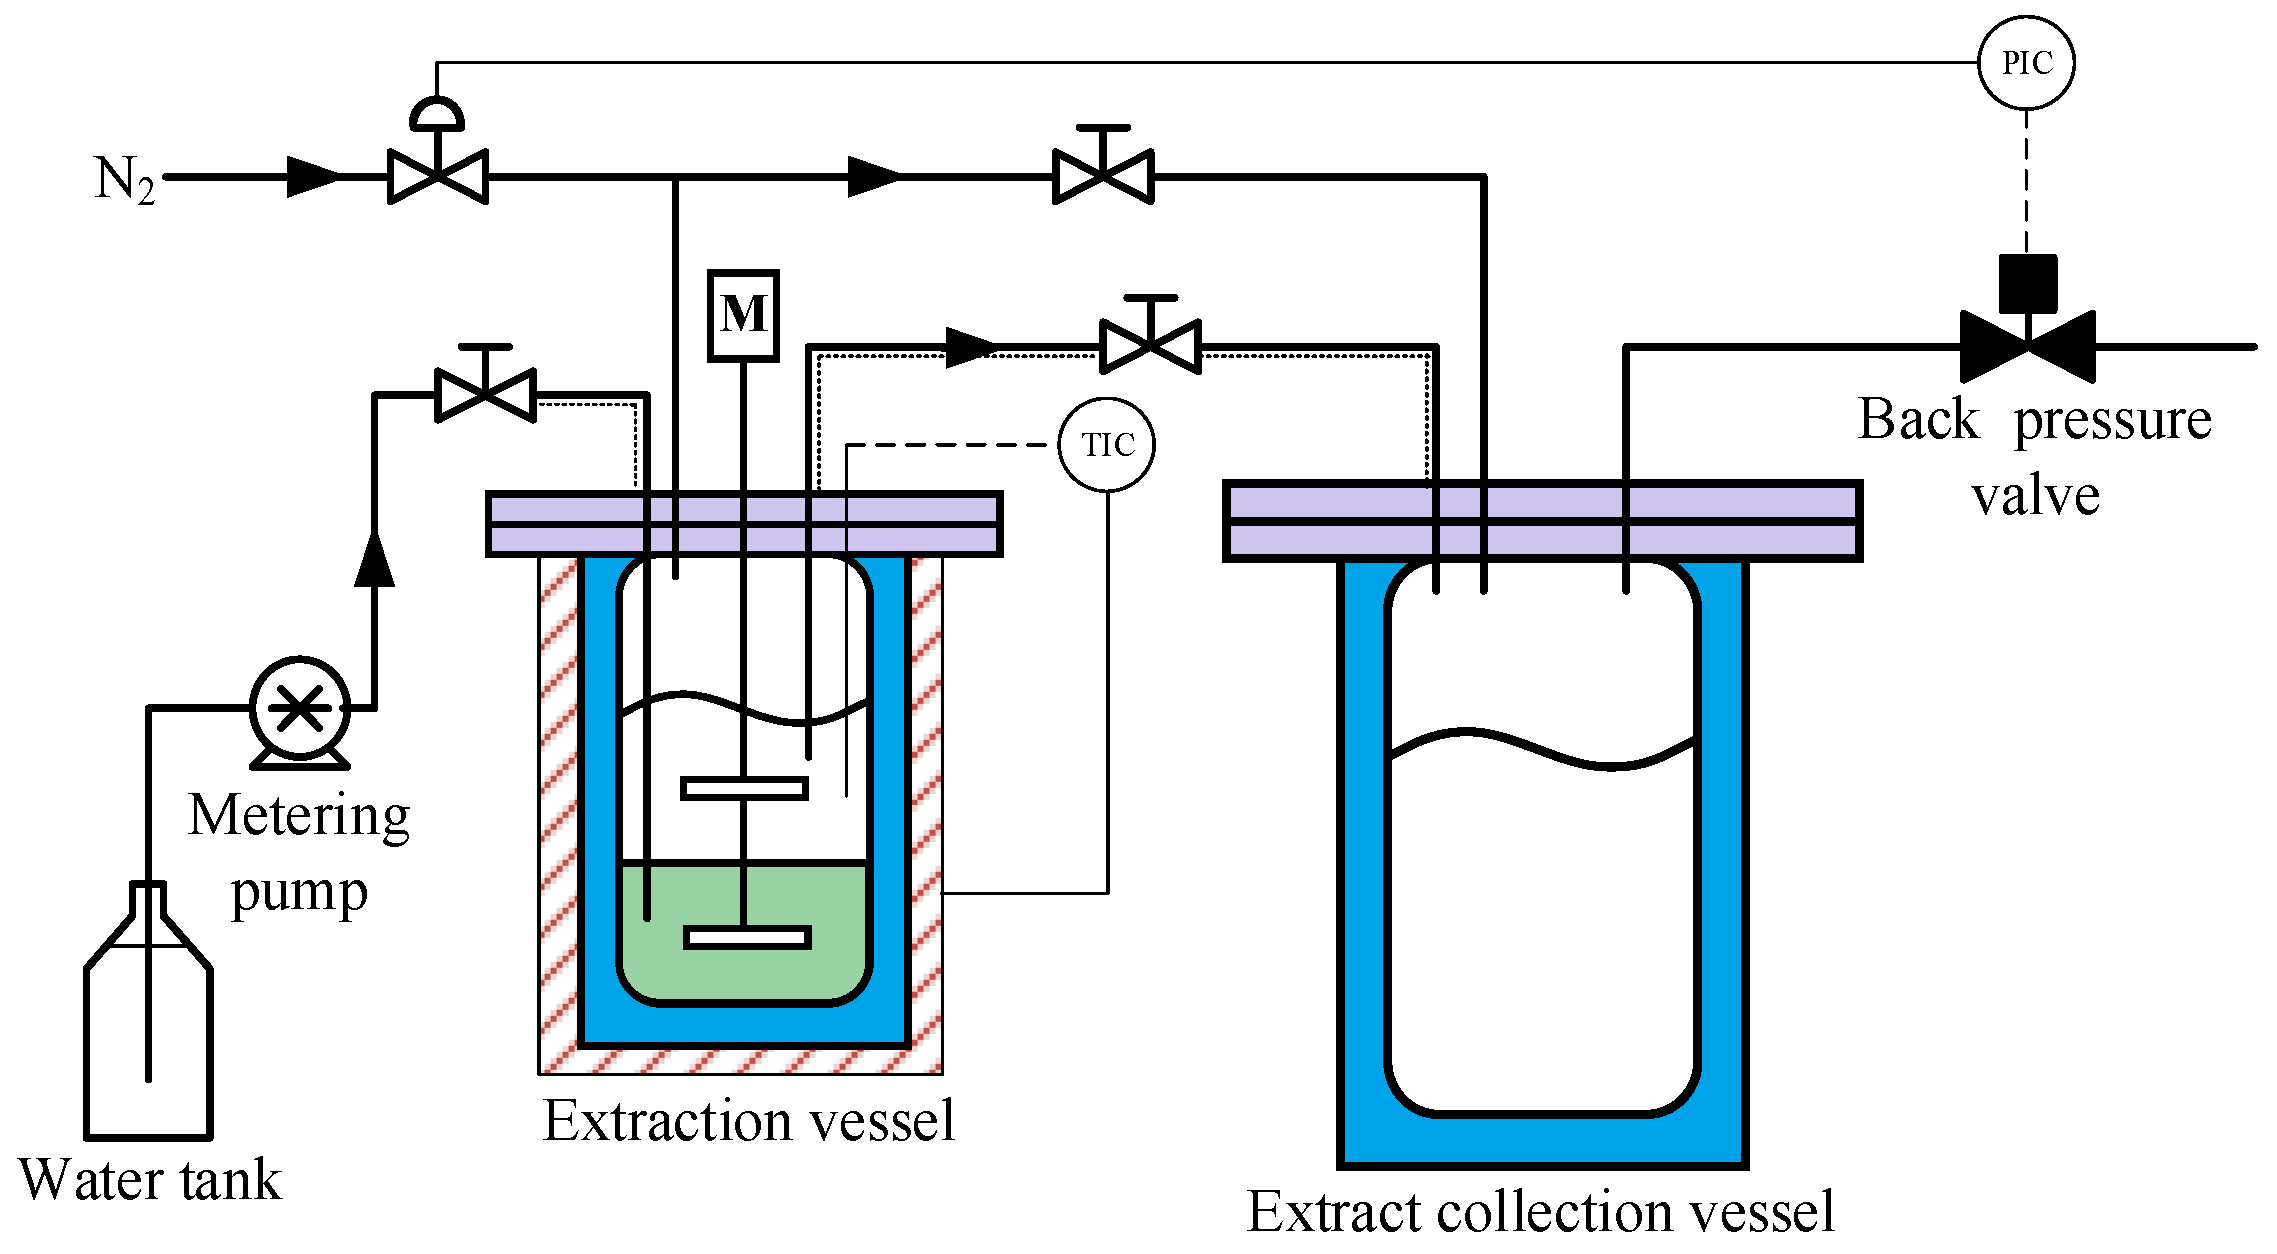
2. Experimental
- First, 100 g of SLO and 100 g of deionized water are loaded into the extraction vessel.
- The extraction system is purged with low-pressure high-purity nitrogen (>99.999 vol%) and then pressurized with high-pressure nitrogen to the preset extraction pressure of 5 MPa to 13 MPa.
- The extraction vessel is heated to the preset extraction temperature of 250 °C to 325 °C. Meanwhile, a stirring rate of 60 rpm is used to achieve limited mixing between the lower SLO phase and the upper water phase.
- Amounts of 200 mL to 600 mL of deionized water are injected into the SLO phase using a metering pump. To prevent disturbance at the oil/water interface, the water injection rate is controlled at 2 mL/min.
- Driven by the pressure difference, part of the water dissolved with oil components flows into the extract collection vessel.
3. Results and Discussion
3.1. Effect of Operating Conditions on Extraction Performance
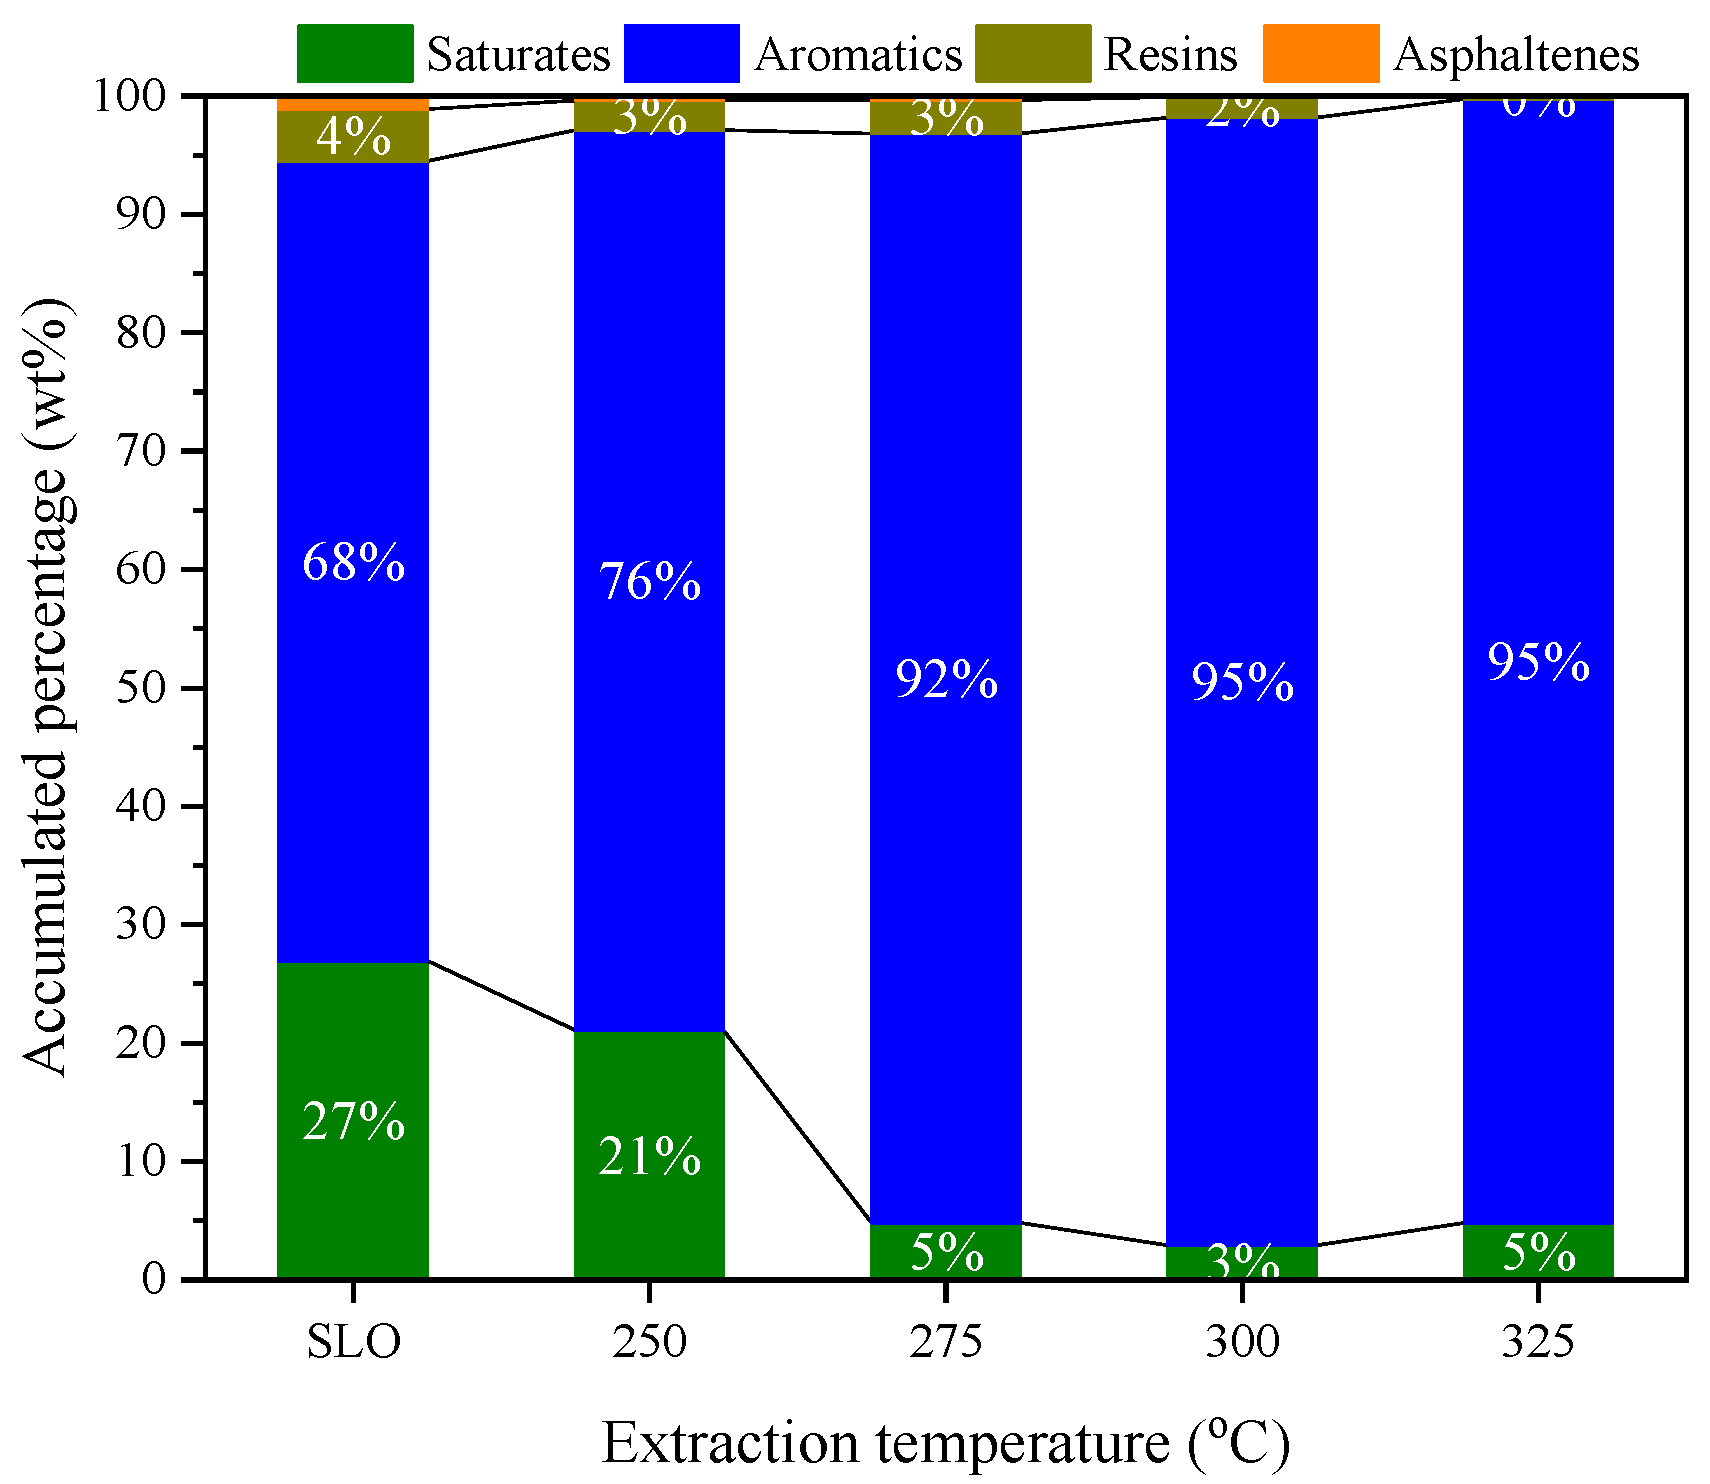
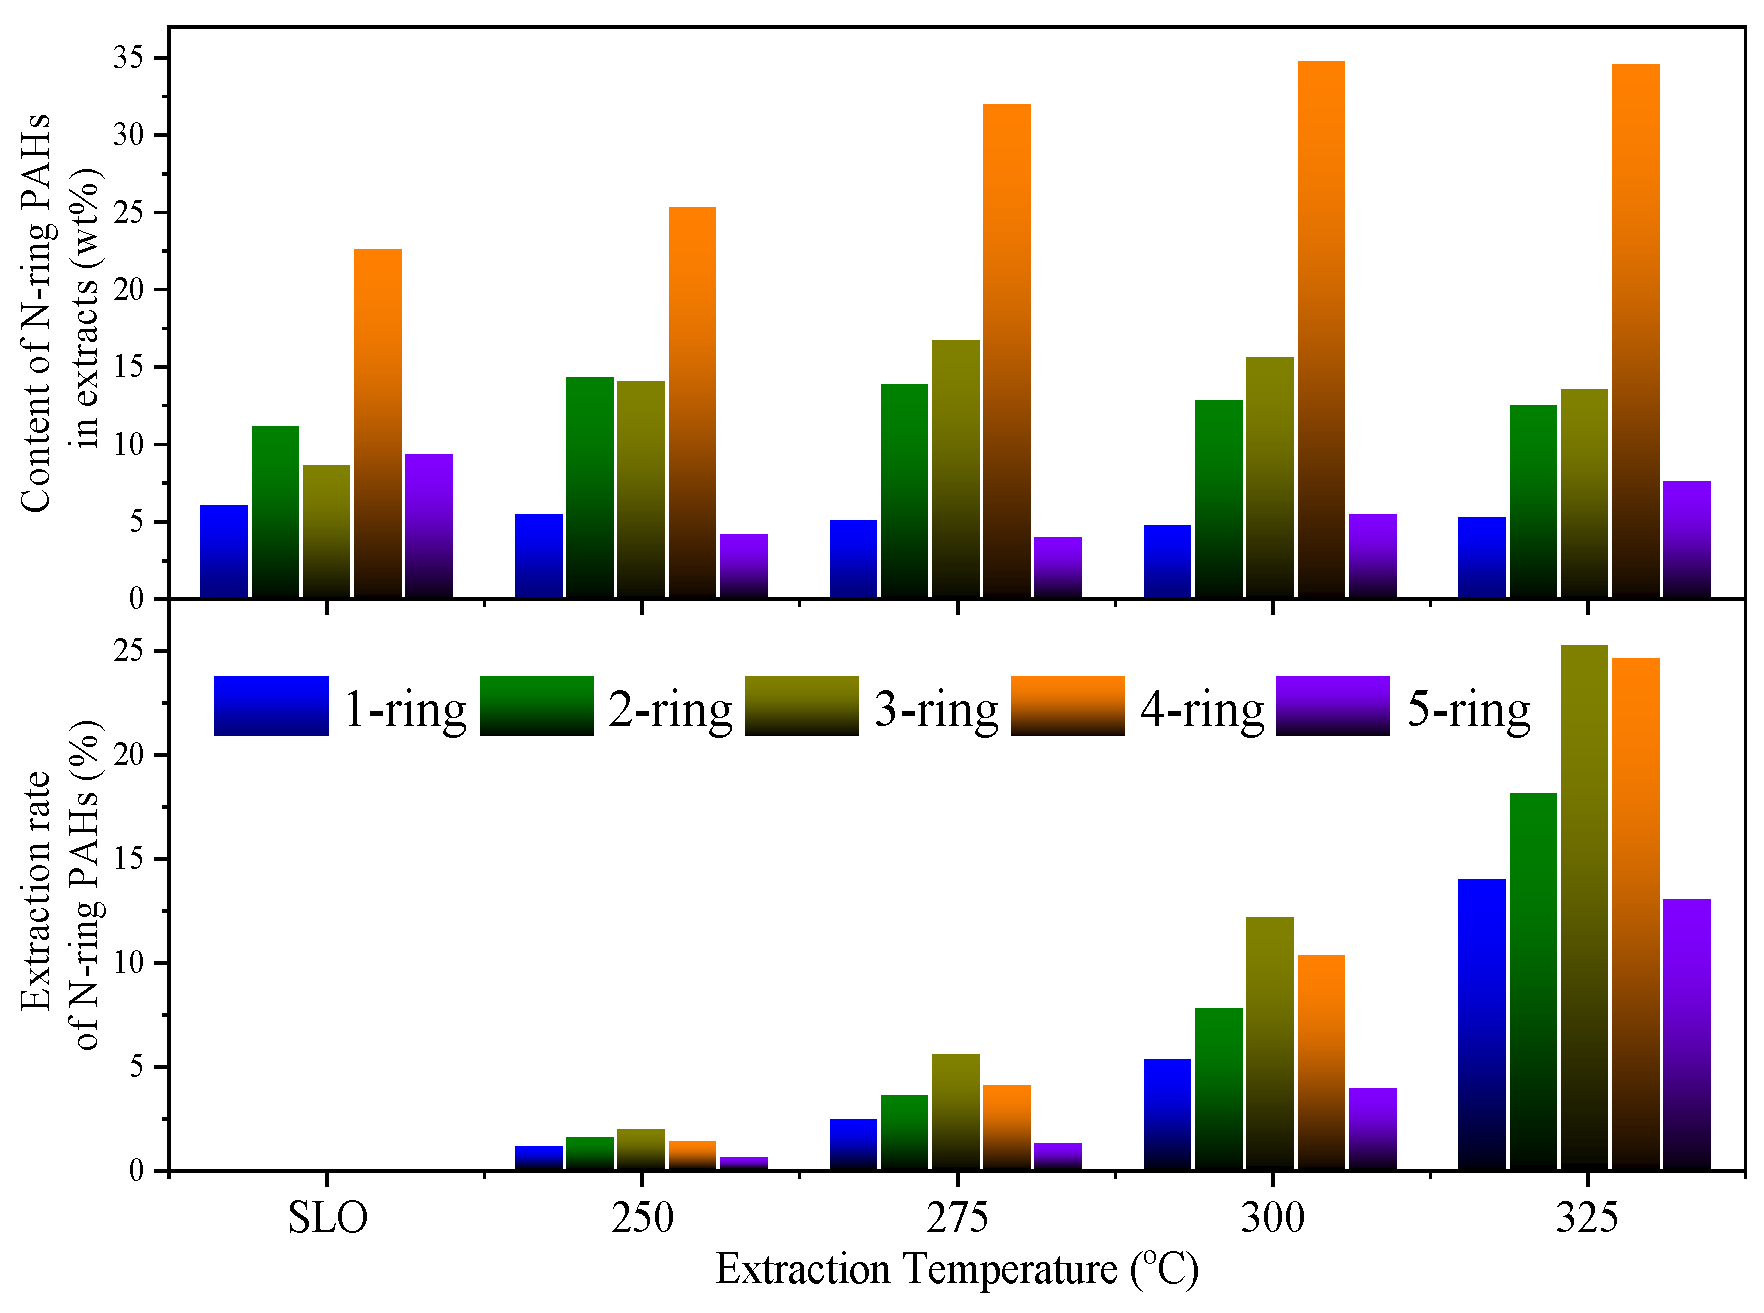
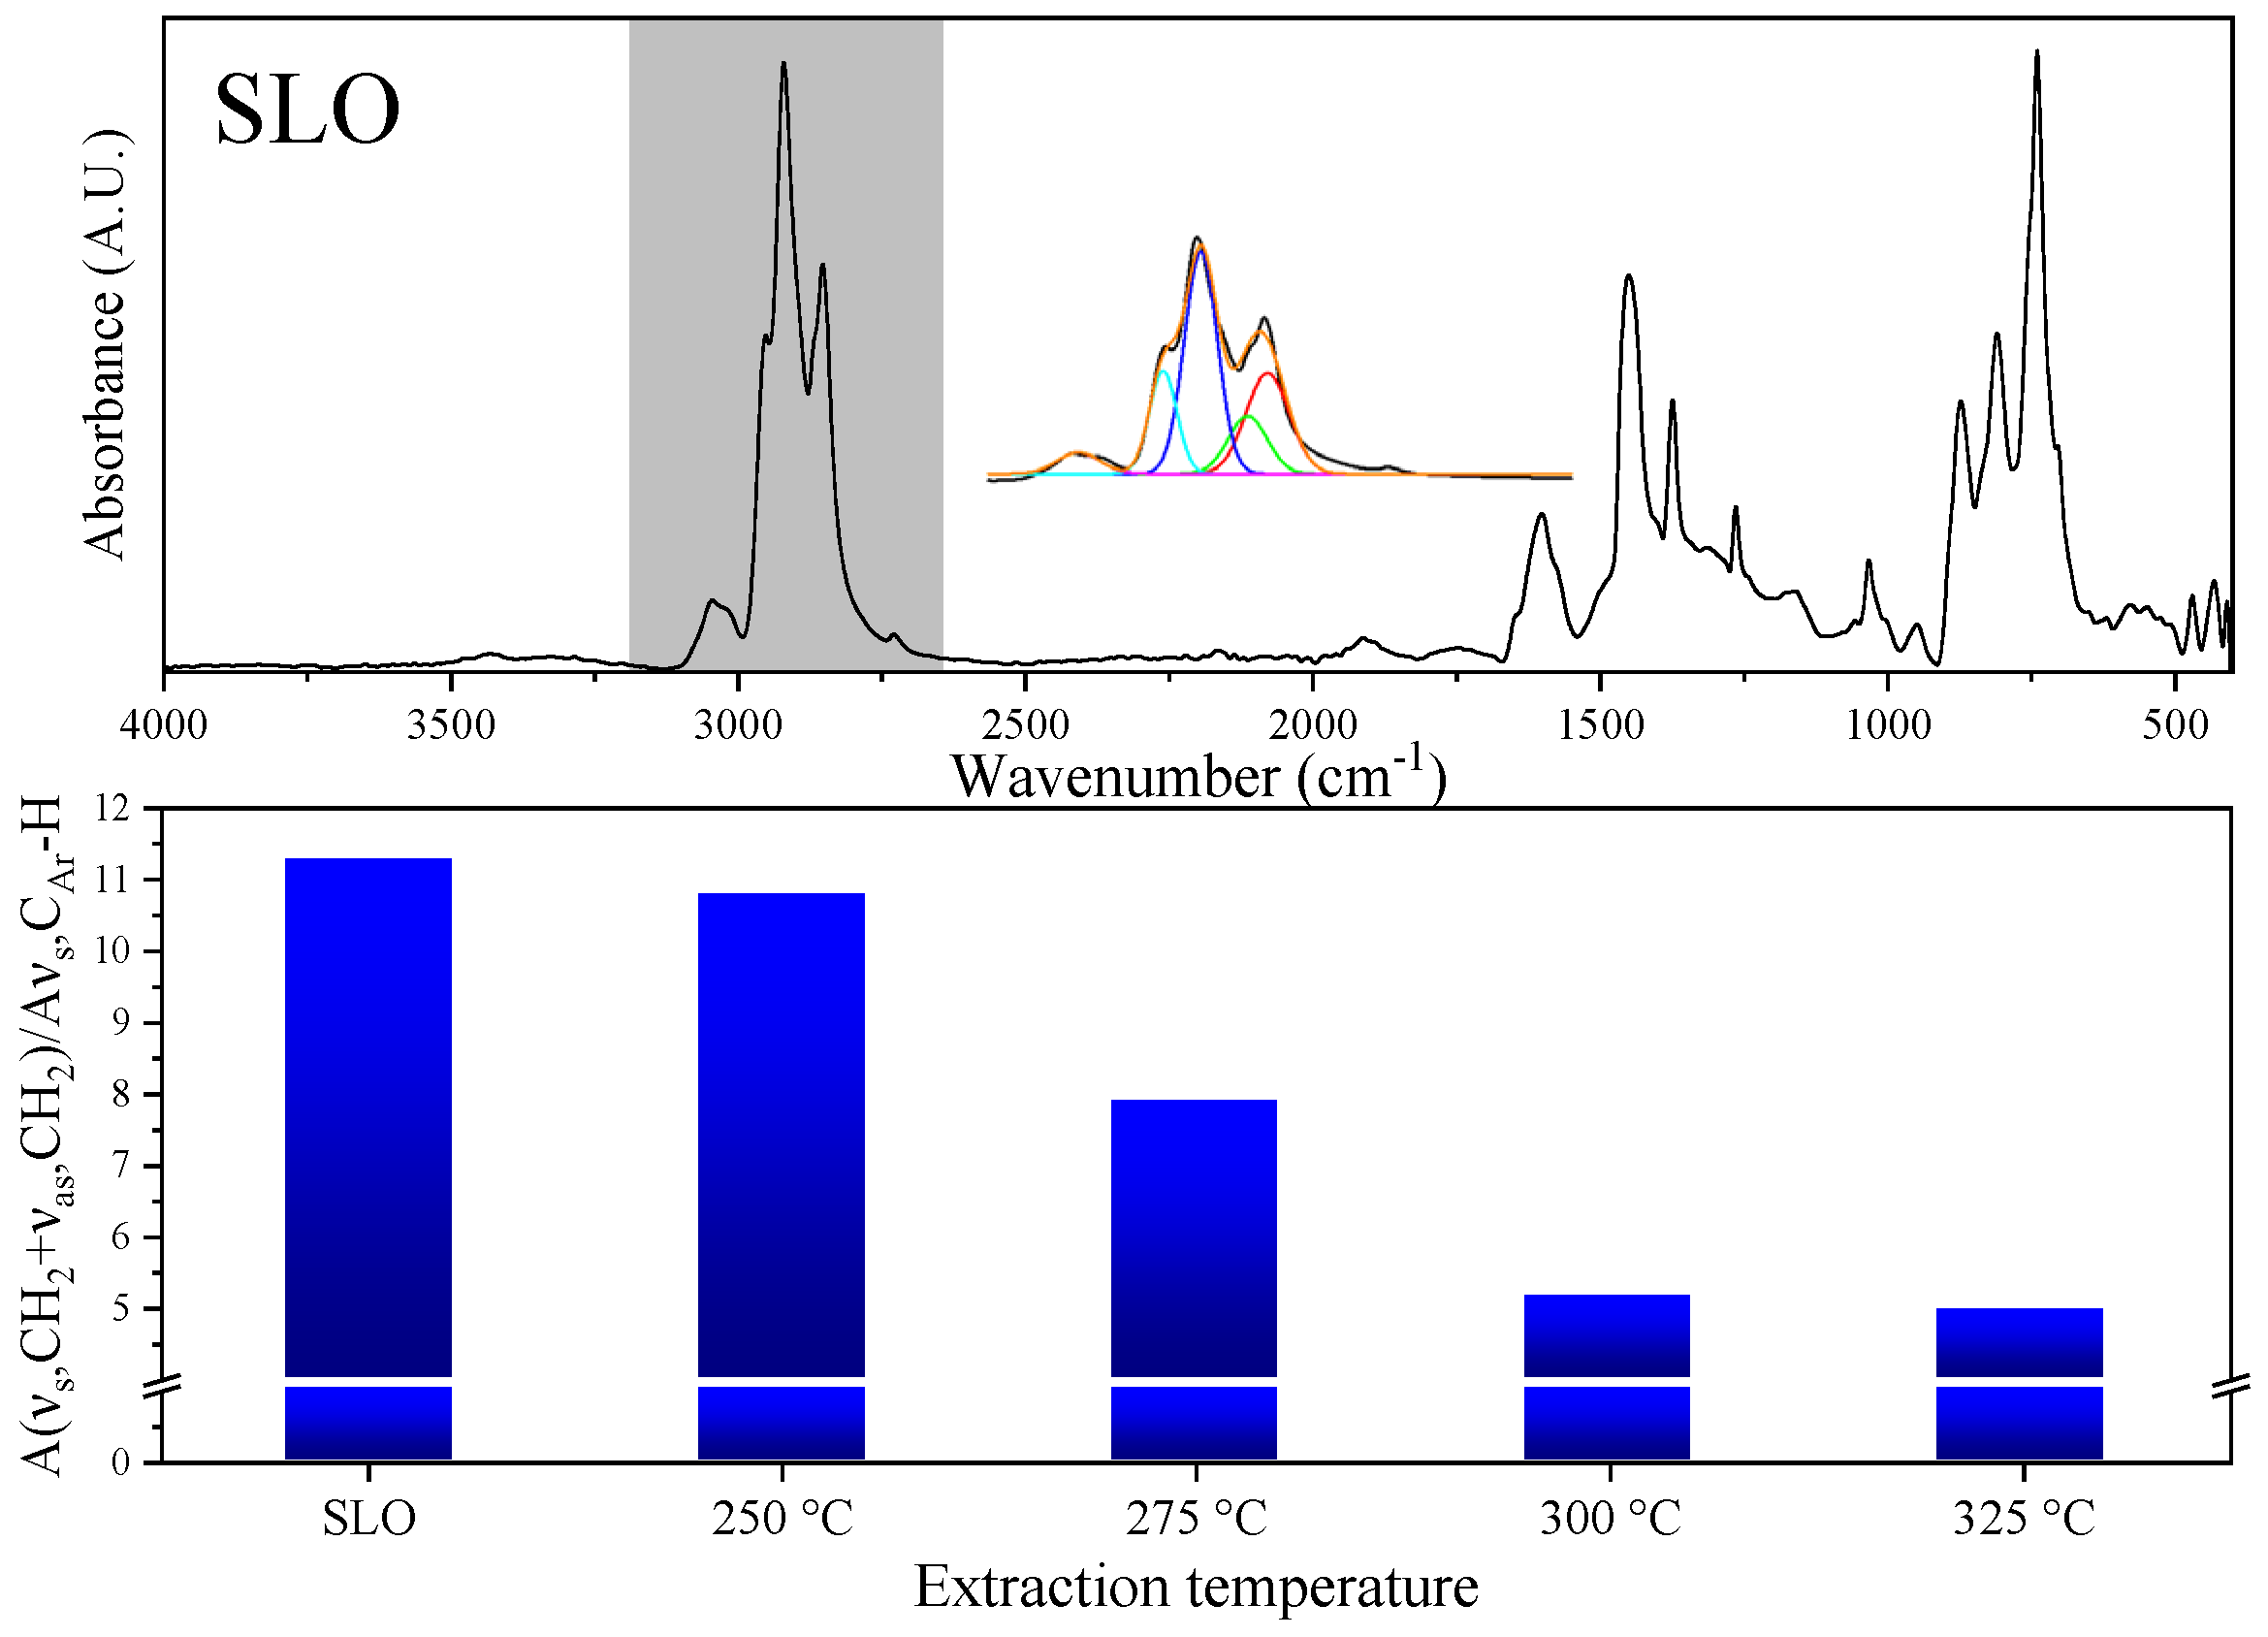
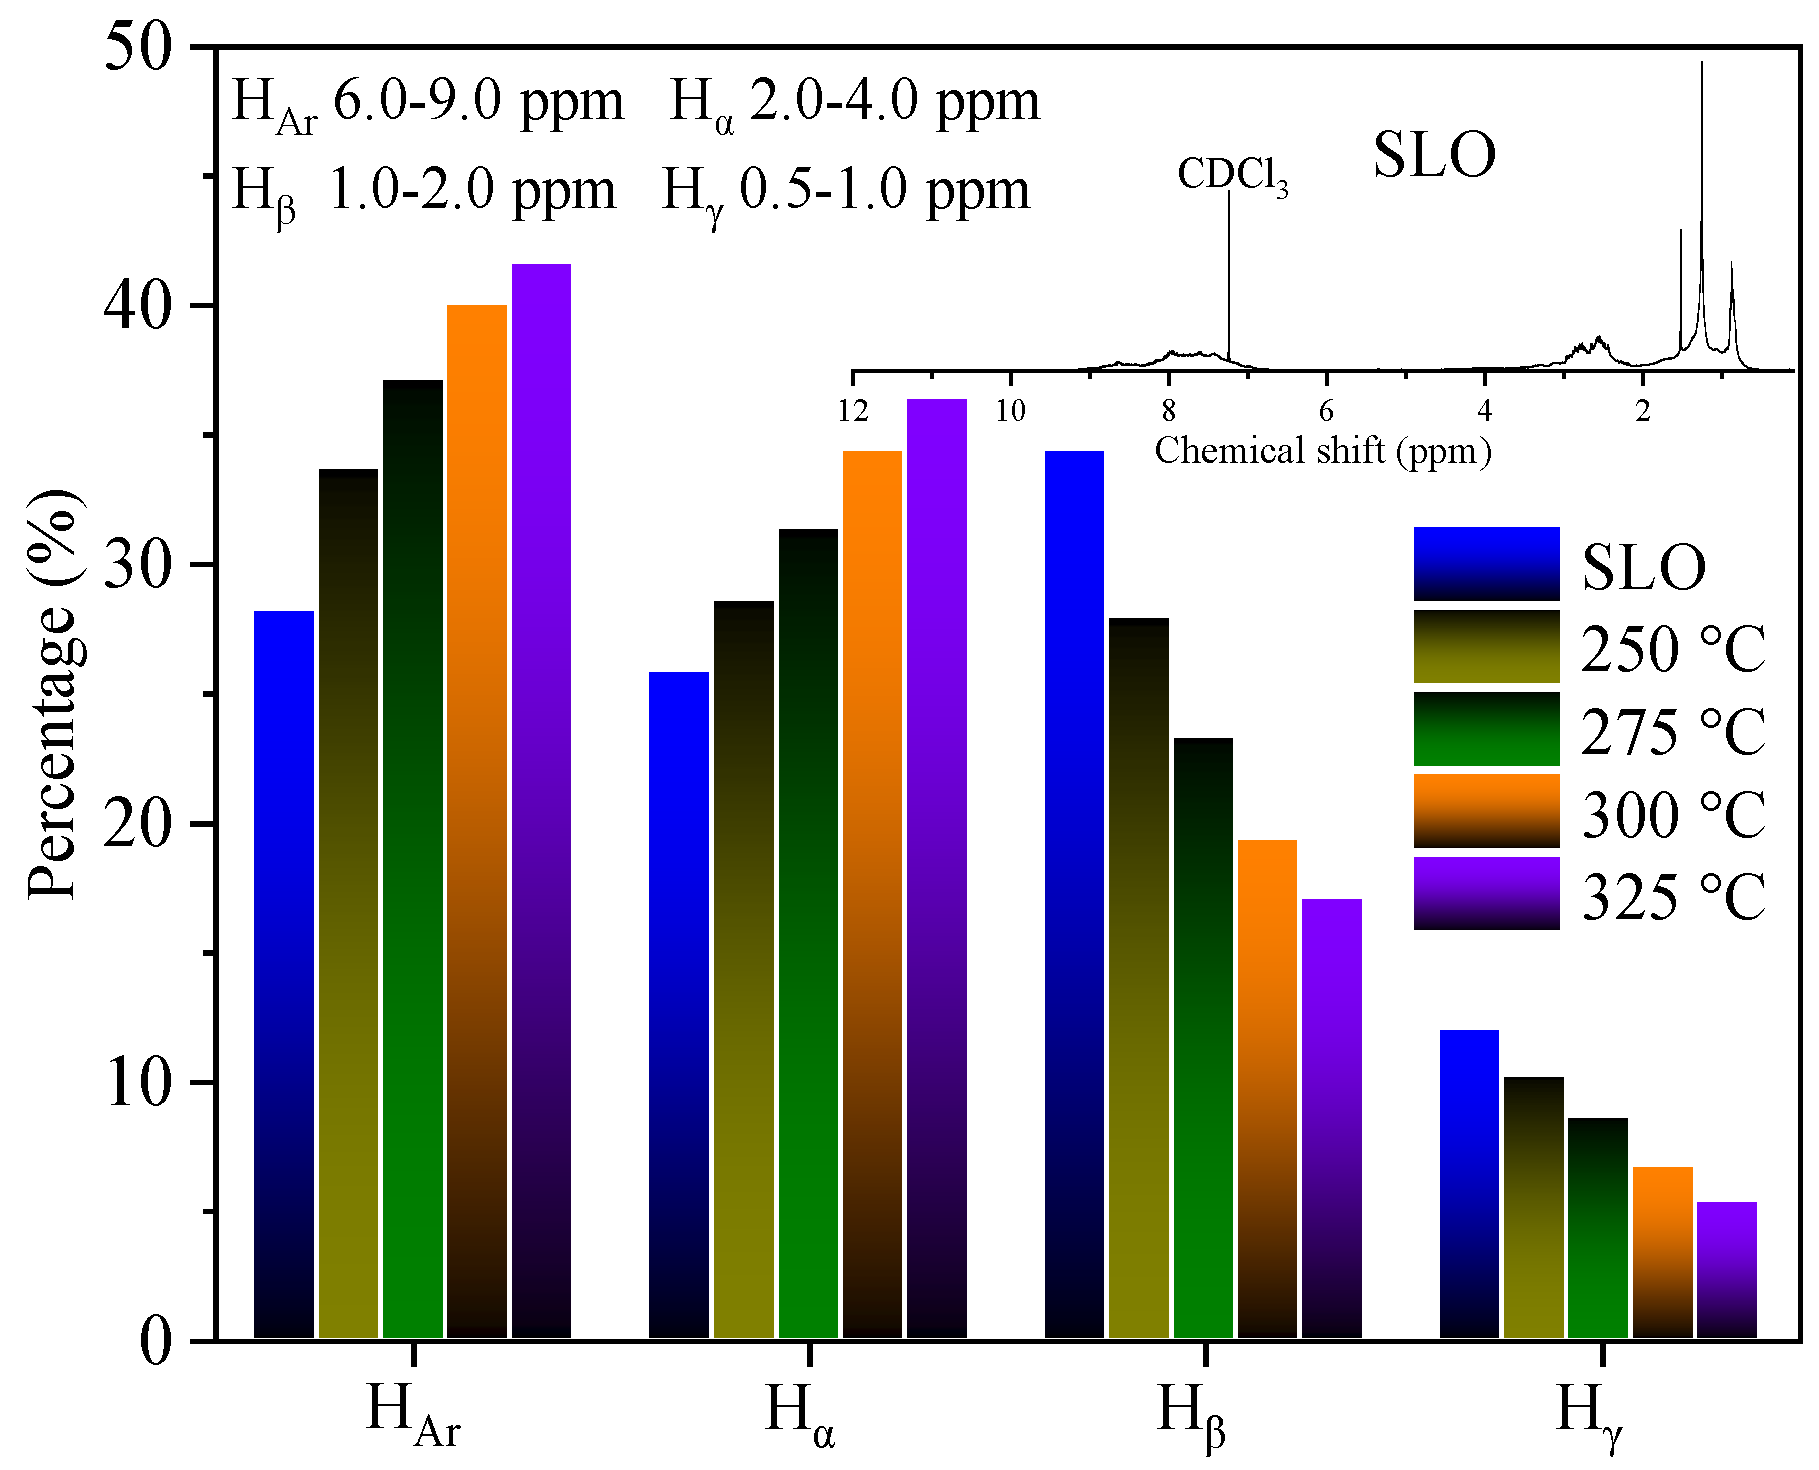
3.2. Selective Extraction of Aromatics from SLO
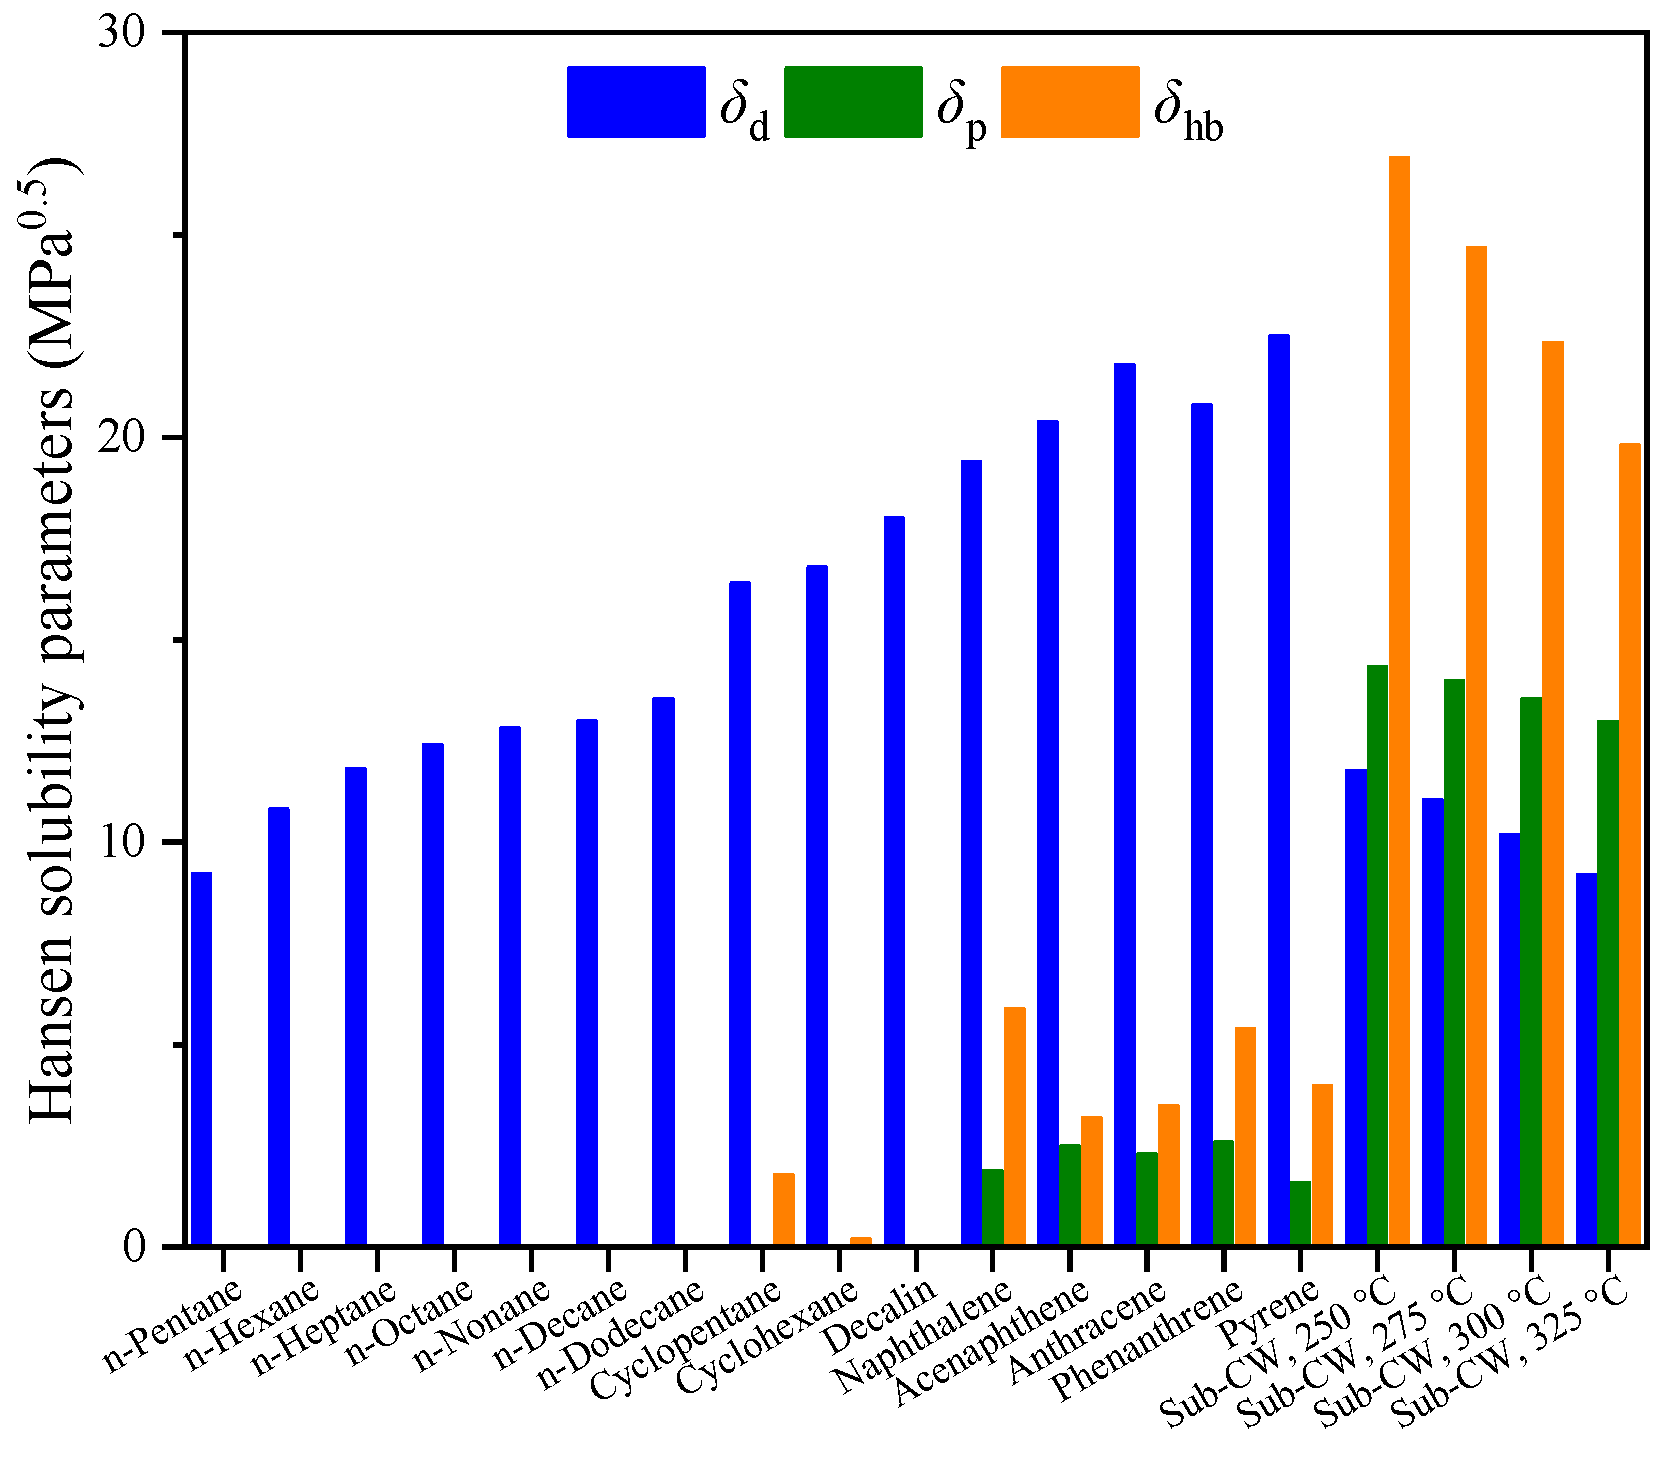
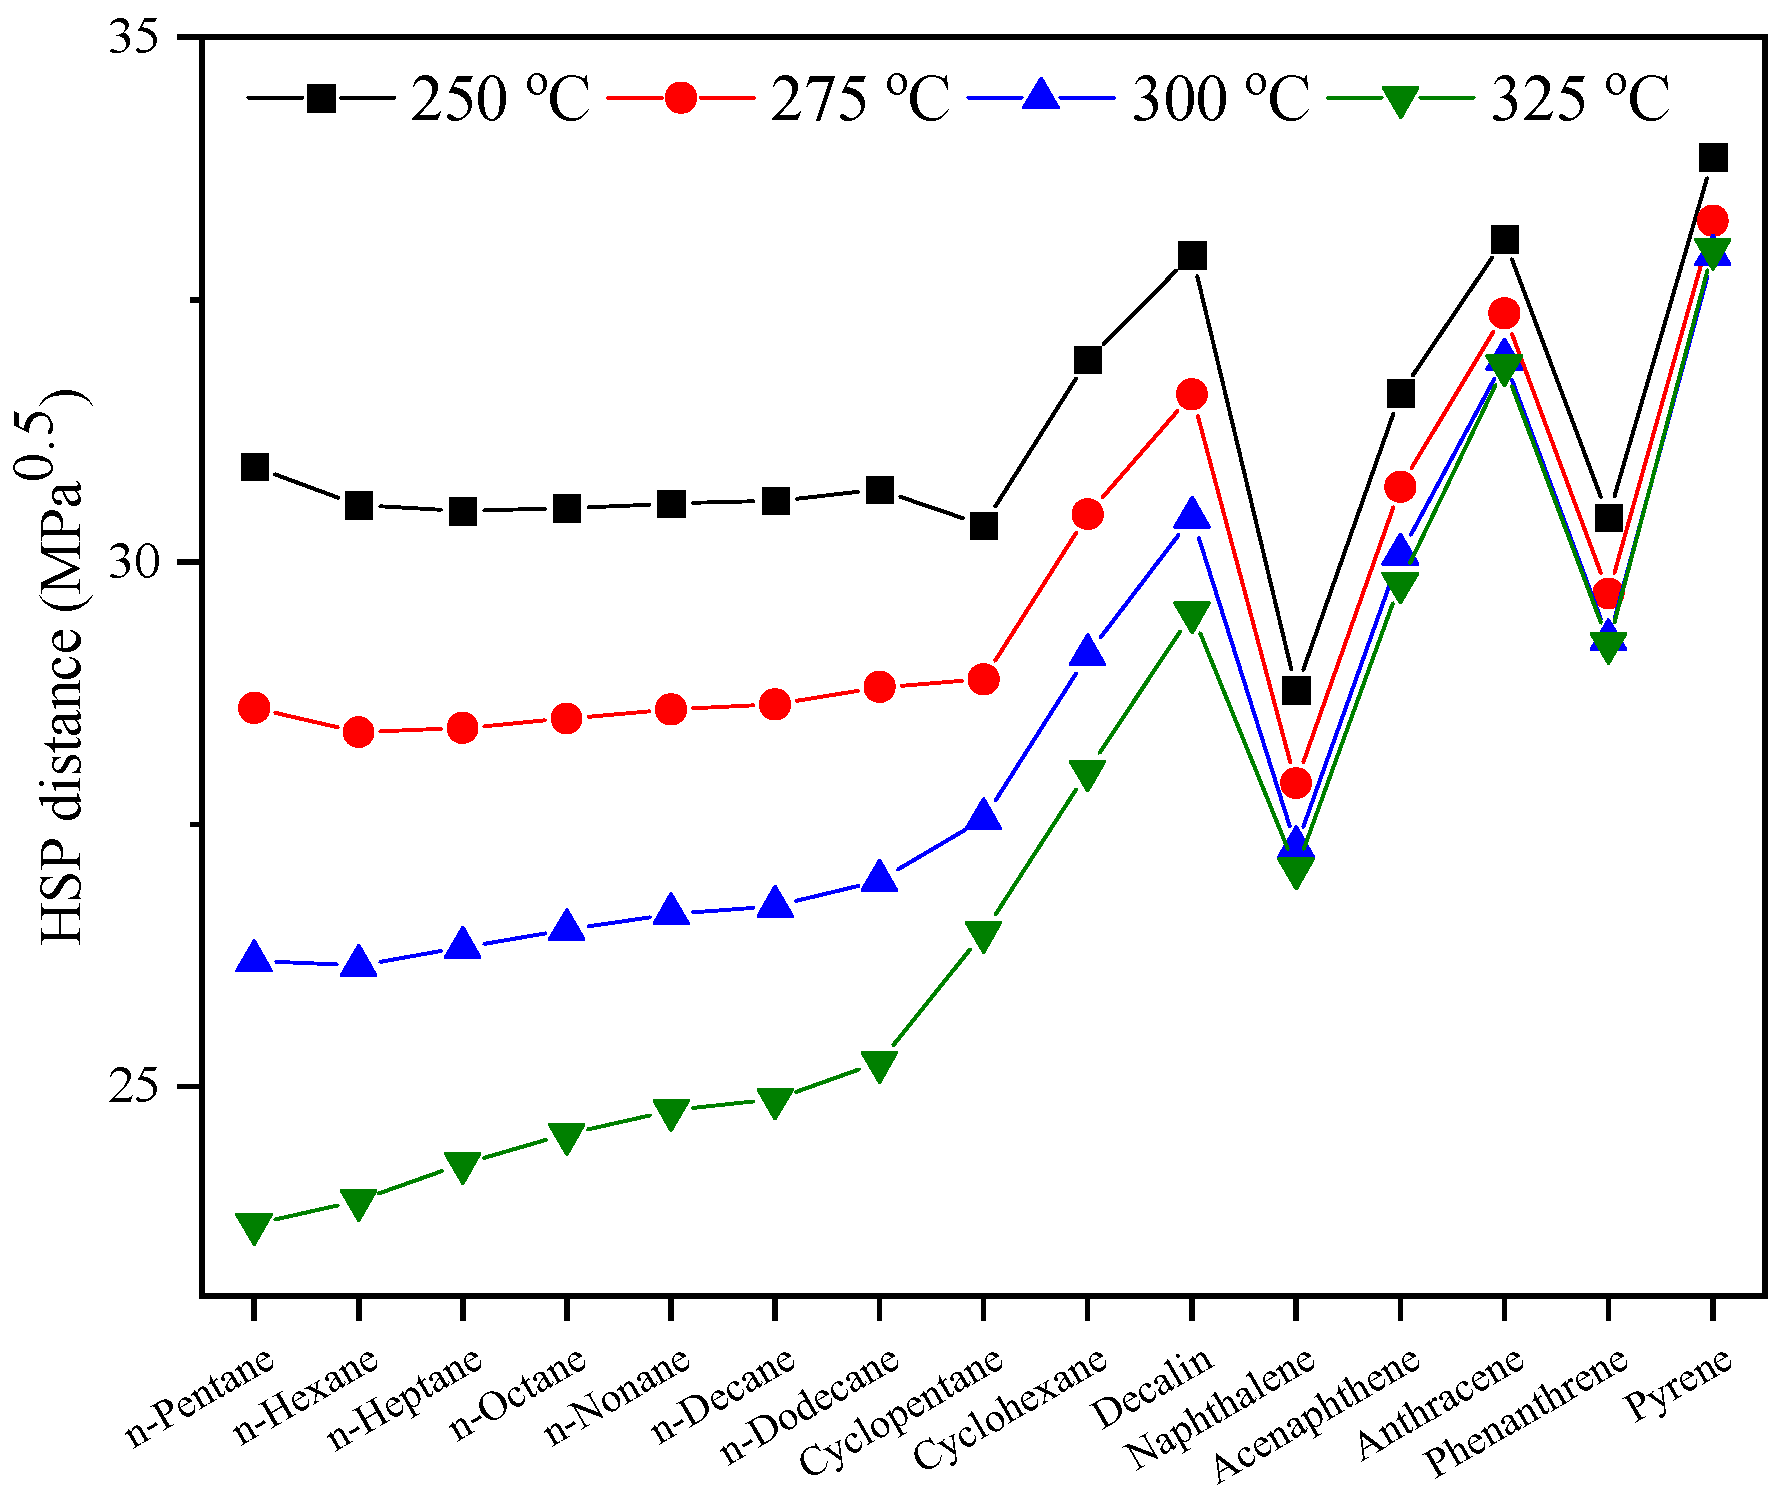
3.3. Solubility of Hydrocarbons in Sub-CW in Terms of HSP Distance
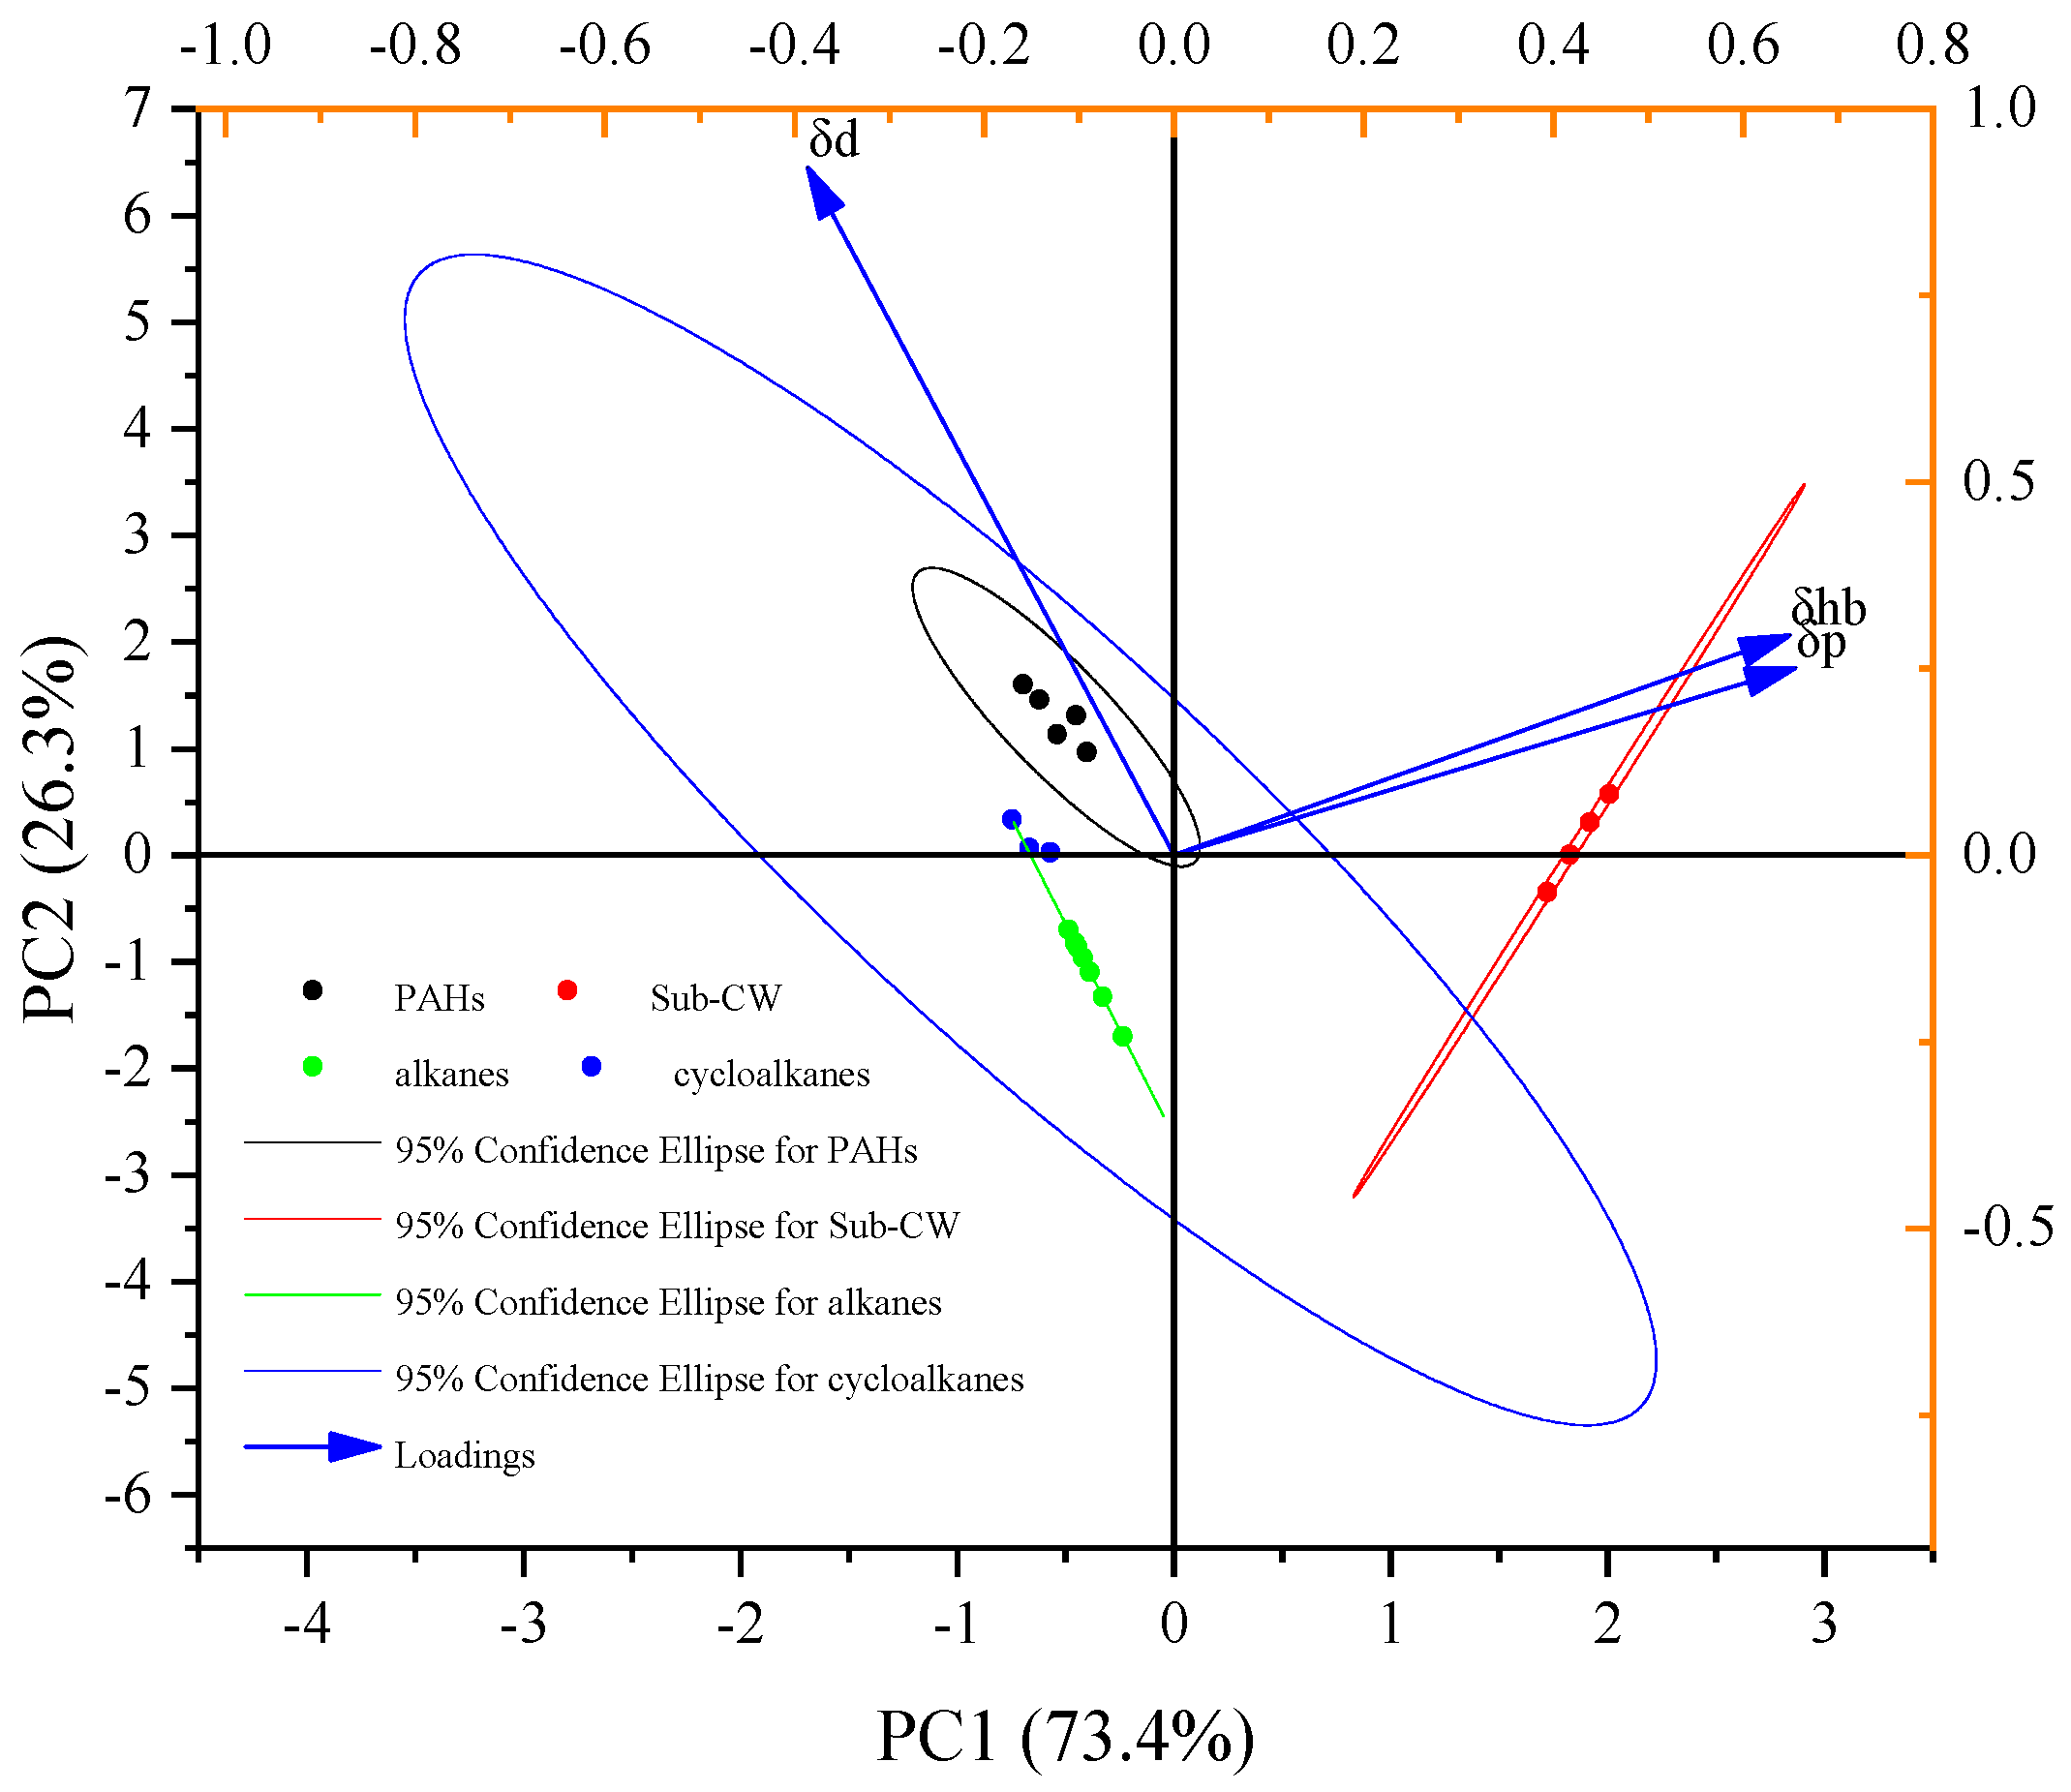
3.4. Modified HSP for SLO/Sub-CW Extraction System
4. Conclusions
Supplementary Materials
Author Contributions
Funding
Institutional Review Board Statement
Informed Consent Statement
Data Availability Statement
Conflicts of Interest
References
- Lu, D.Q.; Xin, J.; Zhu, Y.B.; Su, M.J. Analysis on integrated utilization of FCC slurry oil. Chem. Ind. Eng. Prog. 2021, 40, 142–149. [Google Scholar]
- Dai, X.; Ma, Y.; Zhang, L.; Xu, Z.; Sun, X.; Zhao, S. Optimization of Molecular Composition Distribution of Slurry Oil by Supercritical Fluid Extraction to Improve the Structure and Performance of Mesophase Pitch. Energies 2022, 15, 7041. [Google Scholar] [CrossRef]
- Li, S.B.; Sun, Q.Q.; Jiang, W.; Teng, C.L.; Wu, M.B. Process and Kinetics of Pyrolysis of COPNA Resin Synthesized from FCC Slurry. China Pet. Process. Petrochem. Technol. 2016, 18, 14–20. [Google Scholar]
- Zhao, F.; Song, F.X.; Chen, Q.L. Nitrogen/sulfur codoped FCC-slurry-based porous carbon materials in symmetric supercapacitors. Appl. Surf. Sci. 2021, 561, 150063. [Google Scholar] [CrossRef]
- Dong, P.; Wang, C.H.; Zhao, S.Q. Preparation of high performance electrorheological fluids with coke-like particles from FCC slurry conversion. Fuel 2005, 84, 685–689. [Google Scholar] [CrossRef]
- Zhang, C.L.; Peng, S.Y.; Chen, S.F.; Zhang, Y.X. Study on separation technology of FCC slurry mixed solvents refining. J. Lanzhou Petrochem. Coll. Technol. 2014, 14, 9–12. [Google Scholar]
- Gong, C.W.; Liu, G.X.; Hu, P.; Liang, W.J. Phase Equilibrium Separation of FCC Slurry with Furfural. Pet. Refin. Eng. 1999, 29, 2–8. [Google Scholar]
- Wang, F.; Zhao, D.Z.; Song, R.J.; Yue, K.X.; Zhao, R.X. Studies on pretreatment of catalytic cracking slurry oil with added furfural. Pet. Sci. Technol. 2005, 23, 1303–1312. [Google Scholar] [CrossRef]
- Wang, Y.Z.; Li, J.Y.; Dong, Y.L.; Duan, H.L. Prepration of environmental rubber oil and cracking material from fcc slurryy by solvent extraction. Pet. Process. Petrochem. 2014, 45, 35–39. [Google Scholar]
- Wang, C.; Yang, J.H. New Extraction Agent for PolycycIic Aromatics Developed. Petrochem. Ind. Technol. 2013, 20, 17–20. [Google Scholar]
- Zhang, D.K.; Zhang, L.Z.; Yu, Y.; Zhang, L.; Xu, Z.M.; Sun, X.W.; Zhao, S.Q. Mesocarbon Microbead Production from Fluid Catalytic Cracking Slurry Oil: Improving Performance through Supercritical Fluid Extraction. Energy Fuels 2018, 32, 12477–12485. [Google Scholar] [CrossRef]
- Li, W.D.; Chen, Y.L.; Zhang, L.Z.; Xu, Z.M.; Sun, X.W.; Zhao, S.Q.; Xu, C.M. Supercritical Fluid Extraction of Fluid Catalytic Cracking Slurry Oil: Bulk Property and Molecular Composition of Narrow Fractions. Energy Fuels 2016, 30, 10064–10071. [Google Scholar] [CrossRef]
- Shi, Q.; Xu, Z.M.; Liang, Y.M.; Zhang, L.; Wang, R.A. Analysis of Aromatic Types in FCC Slurry Oils and Their Separated Narrow Fractions. Acta Pet. Sin. 2000, 16, 90–94. [Google Scholar]
- Sun, Y.D.; Zhao, X.N.; Liu, Z.Y.; Feng, Y.; Han, Z.X. Analysis of Influence Factors for FCC Slurry Separation by Mixed Solvent Extraction. China Pet. Process. Petrochem. Technol. 2022, 24, 111–116. [Google Scholar]
- Plaza, M.; Luisa Marina, M. Pressurized hot water extraction of bioactives. Trac-Trends Anal. Chem. 2019, 116, 236–247. [Google Scholar] [CrossRef]
- Zhang, J.X.; Wen, C.T.; Zhang, H.H.; Duan, Y.Q.; Ma, H.L. Recent advances in the extraction of bioactive compounds with subcritical water: A review. Trends Food Sci. Technol. 2020, 95, 183–195. [Google Scholar] [CrossRef]
- Niu, A.; Sun, X.; Lin, C. Trend in Research on Characterization, Environmental Impacts and Treatment of Oily Sludge: A Systematic Review. Molecules 2022, 27, 7795. [Google Scholar] [CrossRef]
- Islam, M.N.; Park, H.-S.; Park, J.-H. Extraction of diesel from contaminated soil using subcritical water. Environ. Earth Sci. 2015, 74, 3059–3066. [Google Scholar] [CrossRef]
- Olukcu, N.; Yanik, J.; Saglam, M.; Yuksel, M.; Karaduman, M. Solvent effect on the extraction of Beypazari oil shale. Energy Fuels 1999, 13, 895–902. [Google Scholar] [CrossRef]
- Zhu, M.H.; Liu, Y.D.; Wang, L.T.; Huang, Z.B.; Yuan, P.Q. Selective extraction of aromatics from residual oil with subcritical water. Chem. Eng. Res. Des. 2024, 202, 444–454. [Google Scholar] [CrossRef]
- NB/SH/T 0509-2010; Test Method for Separation of Asphalt into Four Fractions. National Energy Administration: Beijing, China, 2010.
- Zhang, H.J.; Hu, Y.Y.; Wang, L.T.; Zhu, Y.K.; Huang, Z.B.; Yuan, P.Q. Reaction kinetics analysis of heavy oil visbreaking with reduced diffusion limitation. J. Anal. Appl. Pyrolysis 2021, 159, 105296. [Google Scholar] [CrossRef]
- ASTM D7169; Standard Test Method for Boiling Point Distribution of Samples with Residues Such as Crude Oils and Atmospheric and Vacuum Residues by High Temperature Gas Chromatography. ASTM: West Conshohocken, PA, USA, 2010.
- SH/T 0659; Standard Test Method for Hydrocarbon Types Analysis of Gas-Oil Saturates Fractions by High Ionizing Voltage Mass Spectrometry. China Petrochemical Corporation: Beijing, China, 1998.
- Liu, J.; Xing, Y.; Chen, Y.X.; Yuan, P.Q.; Cheng, Z.M.; Yuan, W.K. Visbreaking of Heavy Oil under Supercritical Water Environment. Ind. Eng. Chem. Res. 2018, 57, 867–875. [Google Scholar] [CrossRef]
- Xu, Y.J.; Sun, Y.F.; Yang, J.Y.; Huang, Z.B.; Yuan, P.Q. Continuous Visbreaking of Heavy Oil in the Presence of Hot Compressed Water. Ind. Eng. Chem. Res. 2022, 61, 5129–5140. [Google Scholar] [CrossRef]
- Cheng, Y.; Xue, F.; Yu, S.; Du, S.; Yang, Y. Subcritical Water Extraction of Natural Products. Molecules 2021, 26, 4004. [Google Scholar] [CrossRef]
- Borisova, D.R.; Statkus, M.A.; Tsizin, G.I.; Zolotov, Y.A. Subcritical water: Use in chemical analysis. J. Anal. Chem. 2017, 72, 823–836. [Google Scholar] [CrossRef]
- Tsonopoulos, C. Thermodynamic analysis of the mutual solubilities of normal alkanes and water. Fluid Phase Equilibria 1999, 156, 21–33. [Google Scholar] [CrossRef]
- Ibrahim, Y.A.; Abdelhameed, M.A.; Al-Sahhaf, T.A.; Fahim, M.A. Structural characterization of different asphaltenes of Kuwaiti origin. Pet. Sci. Technol. 2003, 21, 825–837. [Google Scholar] [CrossRef]
- Wang, Z.; Hu, J.; Shui, H.; Ren, S.; Wei, C.; Pan, C.X.; Lei, Z.P.; Cui, X.P. Study on the structure and association of asphaltene derived from liquefaction of lignite by fluorescence spectroscopy. Fuel 2013, 109, 94–100. [Google Scholar] [CrossRef]
- Novaes, F.J.M.; de Faria, D.C.; Ferraz, F.Z.; de Aquino Neto, F.R. Hansen Solubility Parameters Applied to the Extraction of Phytochemicals. Plants-Basel 2023, 12, 3008. [Google Scholar] [CrossRef]
- Ma, Q.; Yu, C.; Zhou, Y.; Hu, D.; Chen, J.; Zhang, X. A review on the calculation and application of lignin Hansen solubility parameters. Int. J. Biol. Macromol. 2024, 256, 128506. [Google Scholar] [CrossRef]
- del Pilar Sanchez-Camargo, A.; Bueno, M.; Parada-Alfonso, F.; Cifuentes, A.; Ibanez, E. Hansen solubility parameters for selection of green extraction solvents. Trac-Trends Anal. Chem. 2019, 118, 227–237. [Google Scholar] [CrossRef]
- Bonnet, J.; Suissa, G.; Raynal, M.; Bouteiller, L. Organogel formation rationalized by Hansen solubility parameters: Dos and don’ts. Soft Matter 2014, 10, 3154–3160. [Google Scholar] [CrossRef] [PubMed]
- Stefanis, E.; Panayiotou, C. Prediction of Hansen solubility parameters with a new group-contribution method. Int. J. Thermophys. 2008, 29, 568–585. [Google Scholar] [CrossRef]
- Levin, M.; Redelius, P. Determination of three-dimensional solubility parameters and solubility spheres for naphthenic mineral oils. Energy Fuels 2008, 22, 3395–3401. [Google Scholar] [CrossRef]
- Sreekanth, T.V.M.; Ramanaiah, S.; Lee, K.D.; Reddy, K.S. Hansen Solubility Parameters in the Analysis of Solvent-Solvent Interactions by Inverse Gas Chromatography. J. Macromol. Sci. Part B-Phys. 2012, 51, 1256–1266. [Google Scholar] [CrossRef]
- Lin, X.; Jiang, G.; Wang, Y. Hansen Solubility Parameters of Coal Tar-Derived Typical PAHs Using Turbidimetric Titration and an Extended Hansen Approach. J. Chem. Eng. Data 2017, 62, 954–960. [Google Scholar] [CrossRef]
- Marcus, Y. Hansen solubility parameters for supercritical water. J. Supercrit. Fluids 2012, 62, 60–64. [Google Scholar] [CrossRef]
- Pu, J.C.; Dari, M.D.; Tang, X.Q.; Yuan, P.Q. Diffusion of benzene through water film confined in silica mesopores: Effect of competitive adsorption of solvent. Chem. Eng. Sci. 2020, 224, 115793. [Google Scholar] [CrossRef]
- Osada, M.; Toyoshima, K.; Mizutani, T.; Minami, K.; Watanabe, M.; Adschiri, T.; Arai, K. Estimation of the degree of hydrogen bonding between quinoline and water by ultraviolet-visible absorbance spectroscopy in sub- and supercritical water. J. Chem. Phys. 2003, 118, 4573–4577. [Google Scholar] [CrossRef]
- Zhou, J.; Qi, H.; Chen, Y.; Wang, H. Progressive principle component analysis for compressing deep convolutional neural networks. Neurocomputing 2021, 440, 197–206. [Google Scholar] [CrossRef]
- Machlev, R.; Tolkachov, D.; Levron, Y.; Beck, Y. Dimension reduction for NILM classification based on principle component analysis. Electr. Power Syst. Res. 2020, 187, 106459. [Google Scholar] [CrossRef]
- Kala, K. An effective text mining framework using adaptive principle component analysis. Multimed. Tools Appl. 2022, 81, 44467–44485. [Google Scholar] [CrossRef]


| Density (kg/m3) | Dynamic Viscosity (Pa.s) | Carbon Residual (wt%) | H/C | S (wt%) | N (wt%) | Ni (ppm) | V (ppm) |
|---|---|---|---|---|---|---|---|
| 1082.6 | 51.17 | 15.36 | 1.02 | 1.67 | 0.19 | 2.38 | 4.25 |
| SARA Fractions (wt%) | Boiling Point Distributions | ||||||
| Saturates | Aromatics | Resins | Asphaltenes | IBP~500 °C | >500 °C | ||
| 27.0 | 67.6 | 4.4 | 1.0 | 58.4 | 41.6 | ||
Disclaimer/Publisher’s Note: The statements, opinions and data contained in all publications are solely those of the individual author(s) and contributor(s) and not of MDPI and/or the editor(s). MDPI and/or the editor(s) disclaim responsibility for any injury to people or property resulting from any ideas, methods, instructions or products referred to in the content. |
© 2025 by the authors. Licensee MDPI, Basel, Switzerland. This article is an open access article distributed under the terms and conditions of the Creative Commons Attribution (CC BY) license (https://creativecommons.org/licenses/by/4.0/).
Share and Cite
Zhou, N.-X.; Liu, Z.-Q.; Zhu, M.-H.; Huang, Z.-B.; Yang, J.-Y.; Wang, L.-T.; Yuan, P.-Q. Selective Extraction of Aromatics from Slurry Oil with Subcritical Water. Molecules 2025, 30, 2079. https://doi.org/10.3390/molecules30092079
Zhou N-X, Liu Z-Q, Zhu M-H, Huang Z-B, Yang J-Y, Wang L-T, Yuan P-Q. Selective Extraction of Aromatics from Slurry Oil with Subcritical Water. Molecules. 2025; 30(9):2079. https://doi.org/10.3390/molecules30092079
Chicago/Turabian StyleZhou, Nuo-Xin, Zhu-Qi Liu, Meng-Han Zhu, Zi-Bin Huang, Jing-Yi Yang, Li-Tao Wang, and Pei-Qing Yuan. 2025. "Selective Extraction of Aromatics from Slurry Oil with Subcritical Water" Molecules 30, no. 9: 2079. https://doi.org/10.3390/molecules30092079
APA StyleZhou, N.-X., Liu, Z.-Q., Zhu, M.-H., Huang, Z.-B., Yang, J.-Y., Wang, L.-T., & Yuan, P.-Q. (2025). Selective Extraction of Aromatics from Slurry Oil with Subcritical Water. Molecules, 30(9), 2079. https://doi.org/10.3390/molecules30092079