
Experimental Study of the Reactions of Br Atoms with Thiirane and Nitrosyl Chloride


Abstract
1. Introduction
2. Results and Discussion
2.1. Rate Constant of Reaction (1)
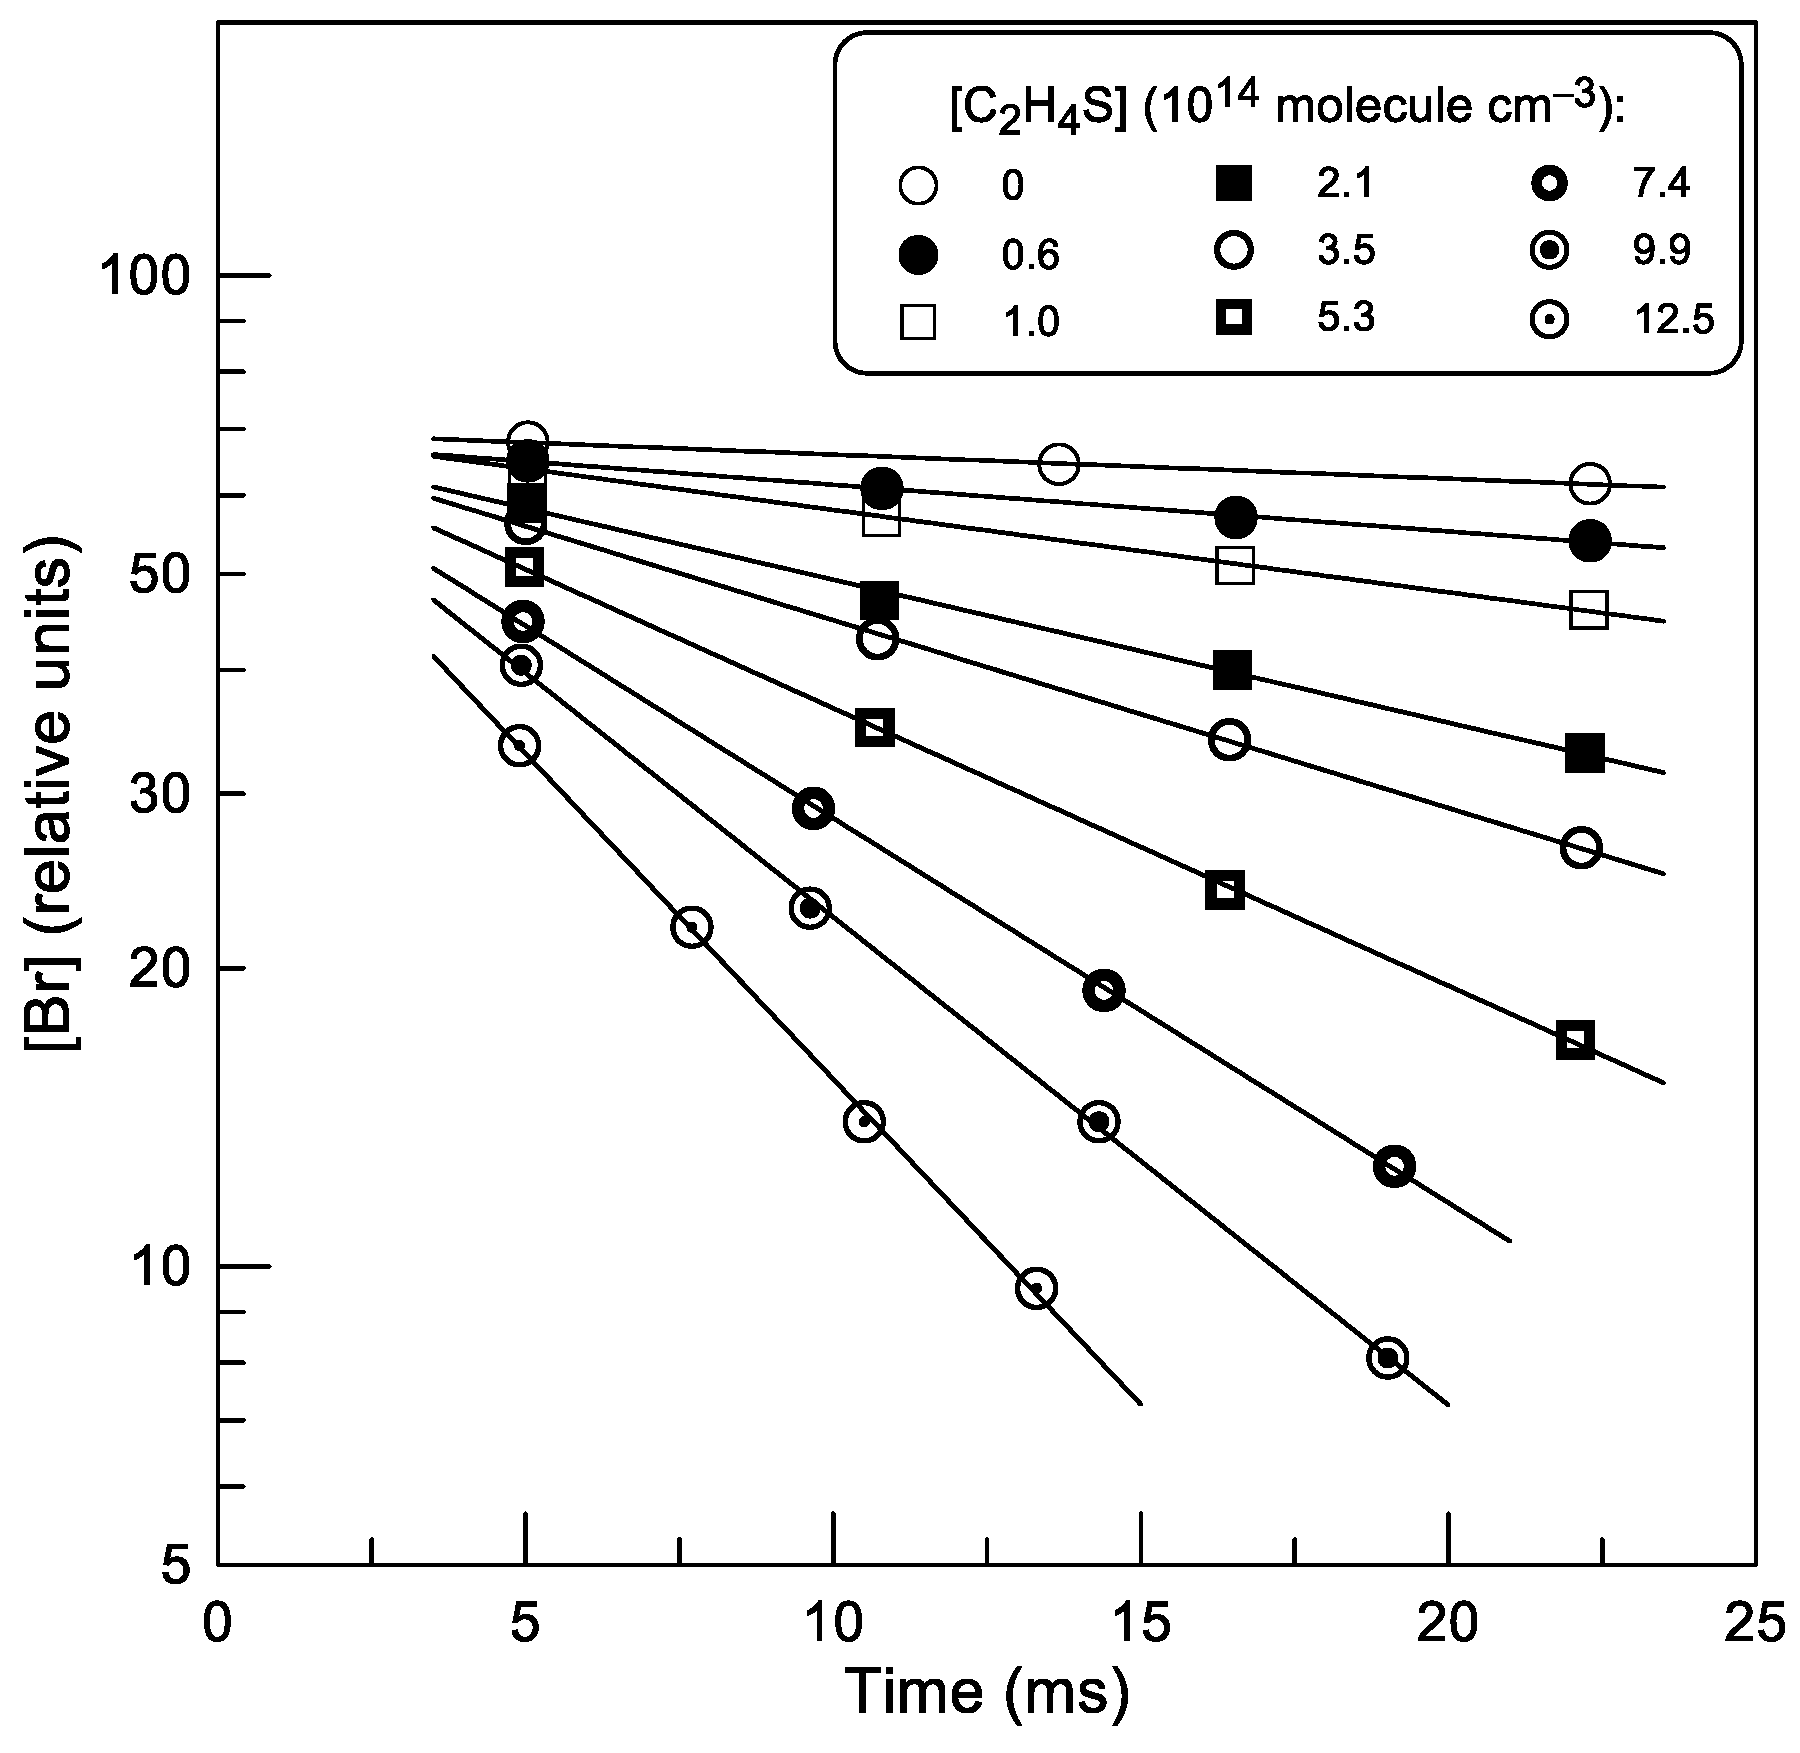
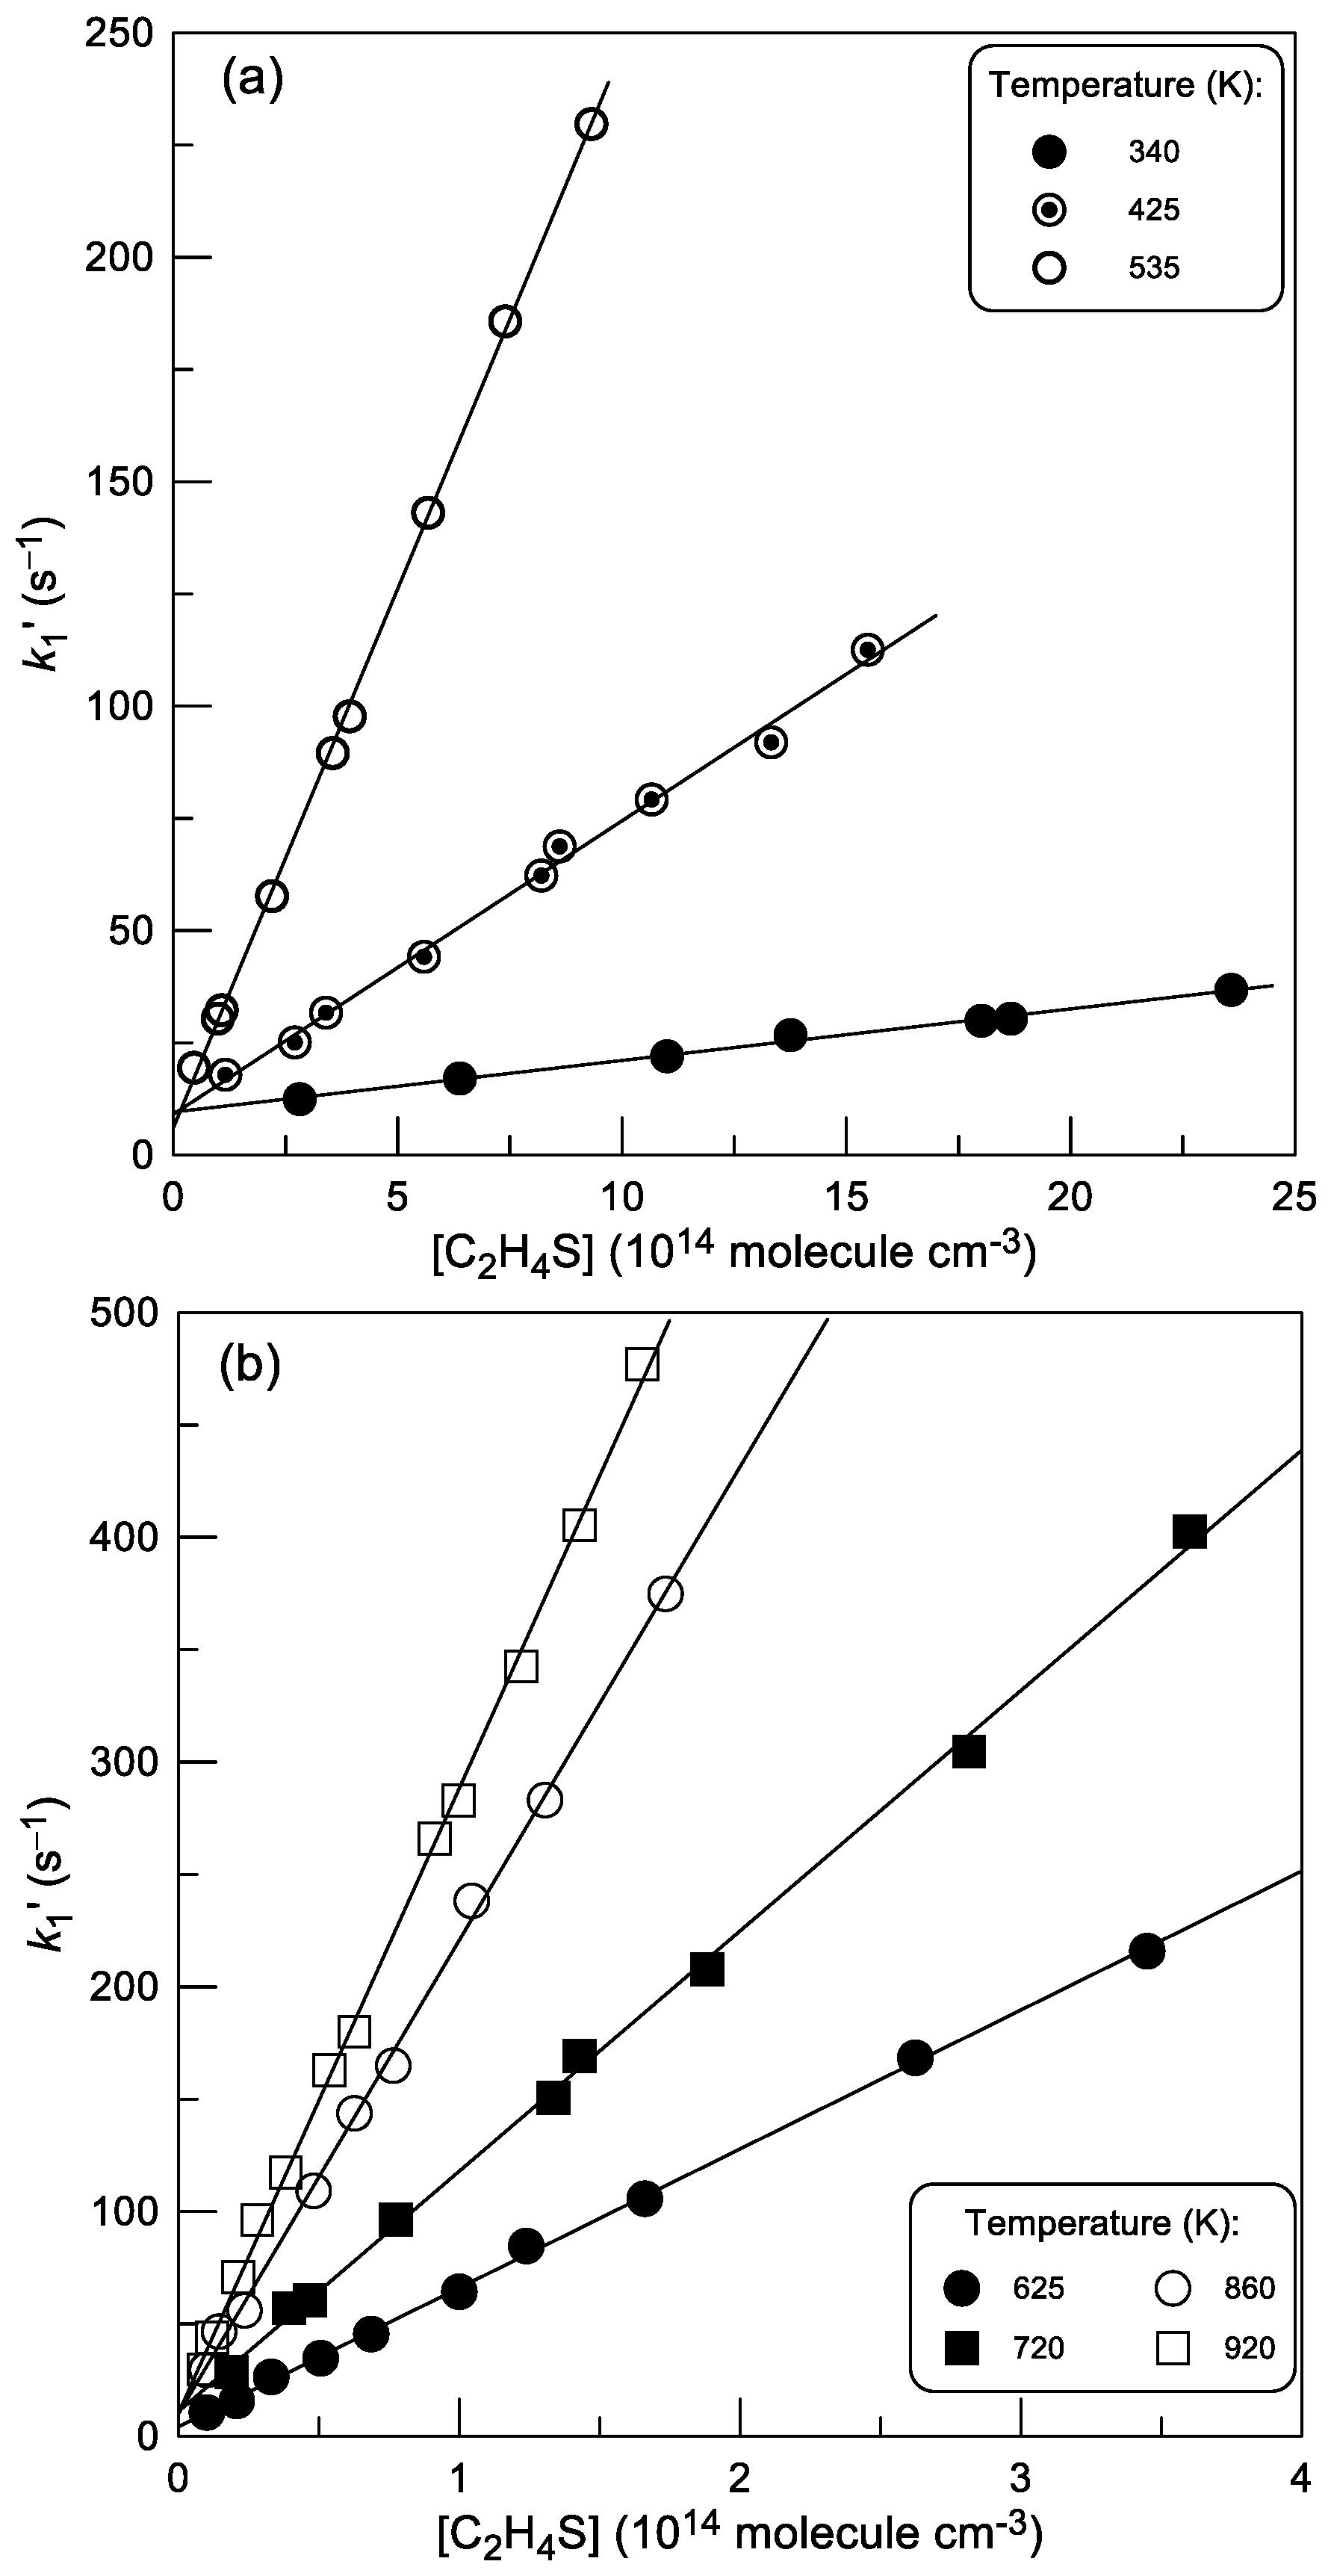
2.1.1. Absolute Measurements of k1: Kinetics of Br Atom Consumption
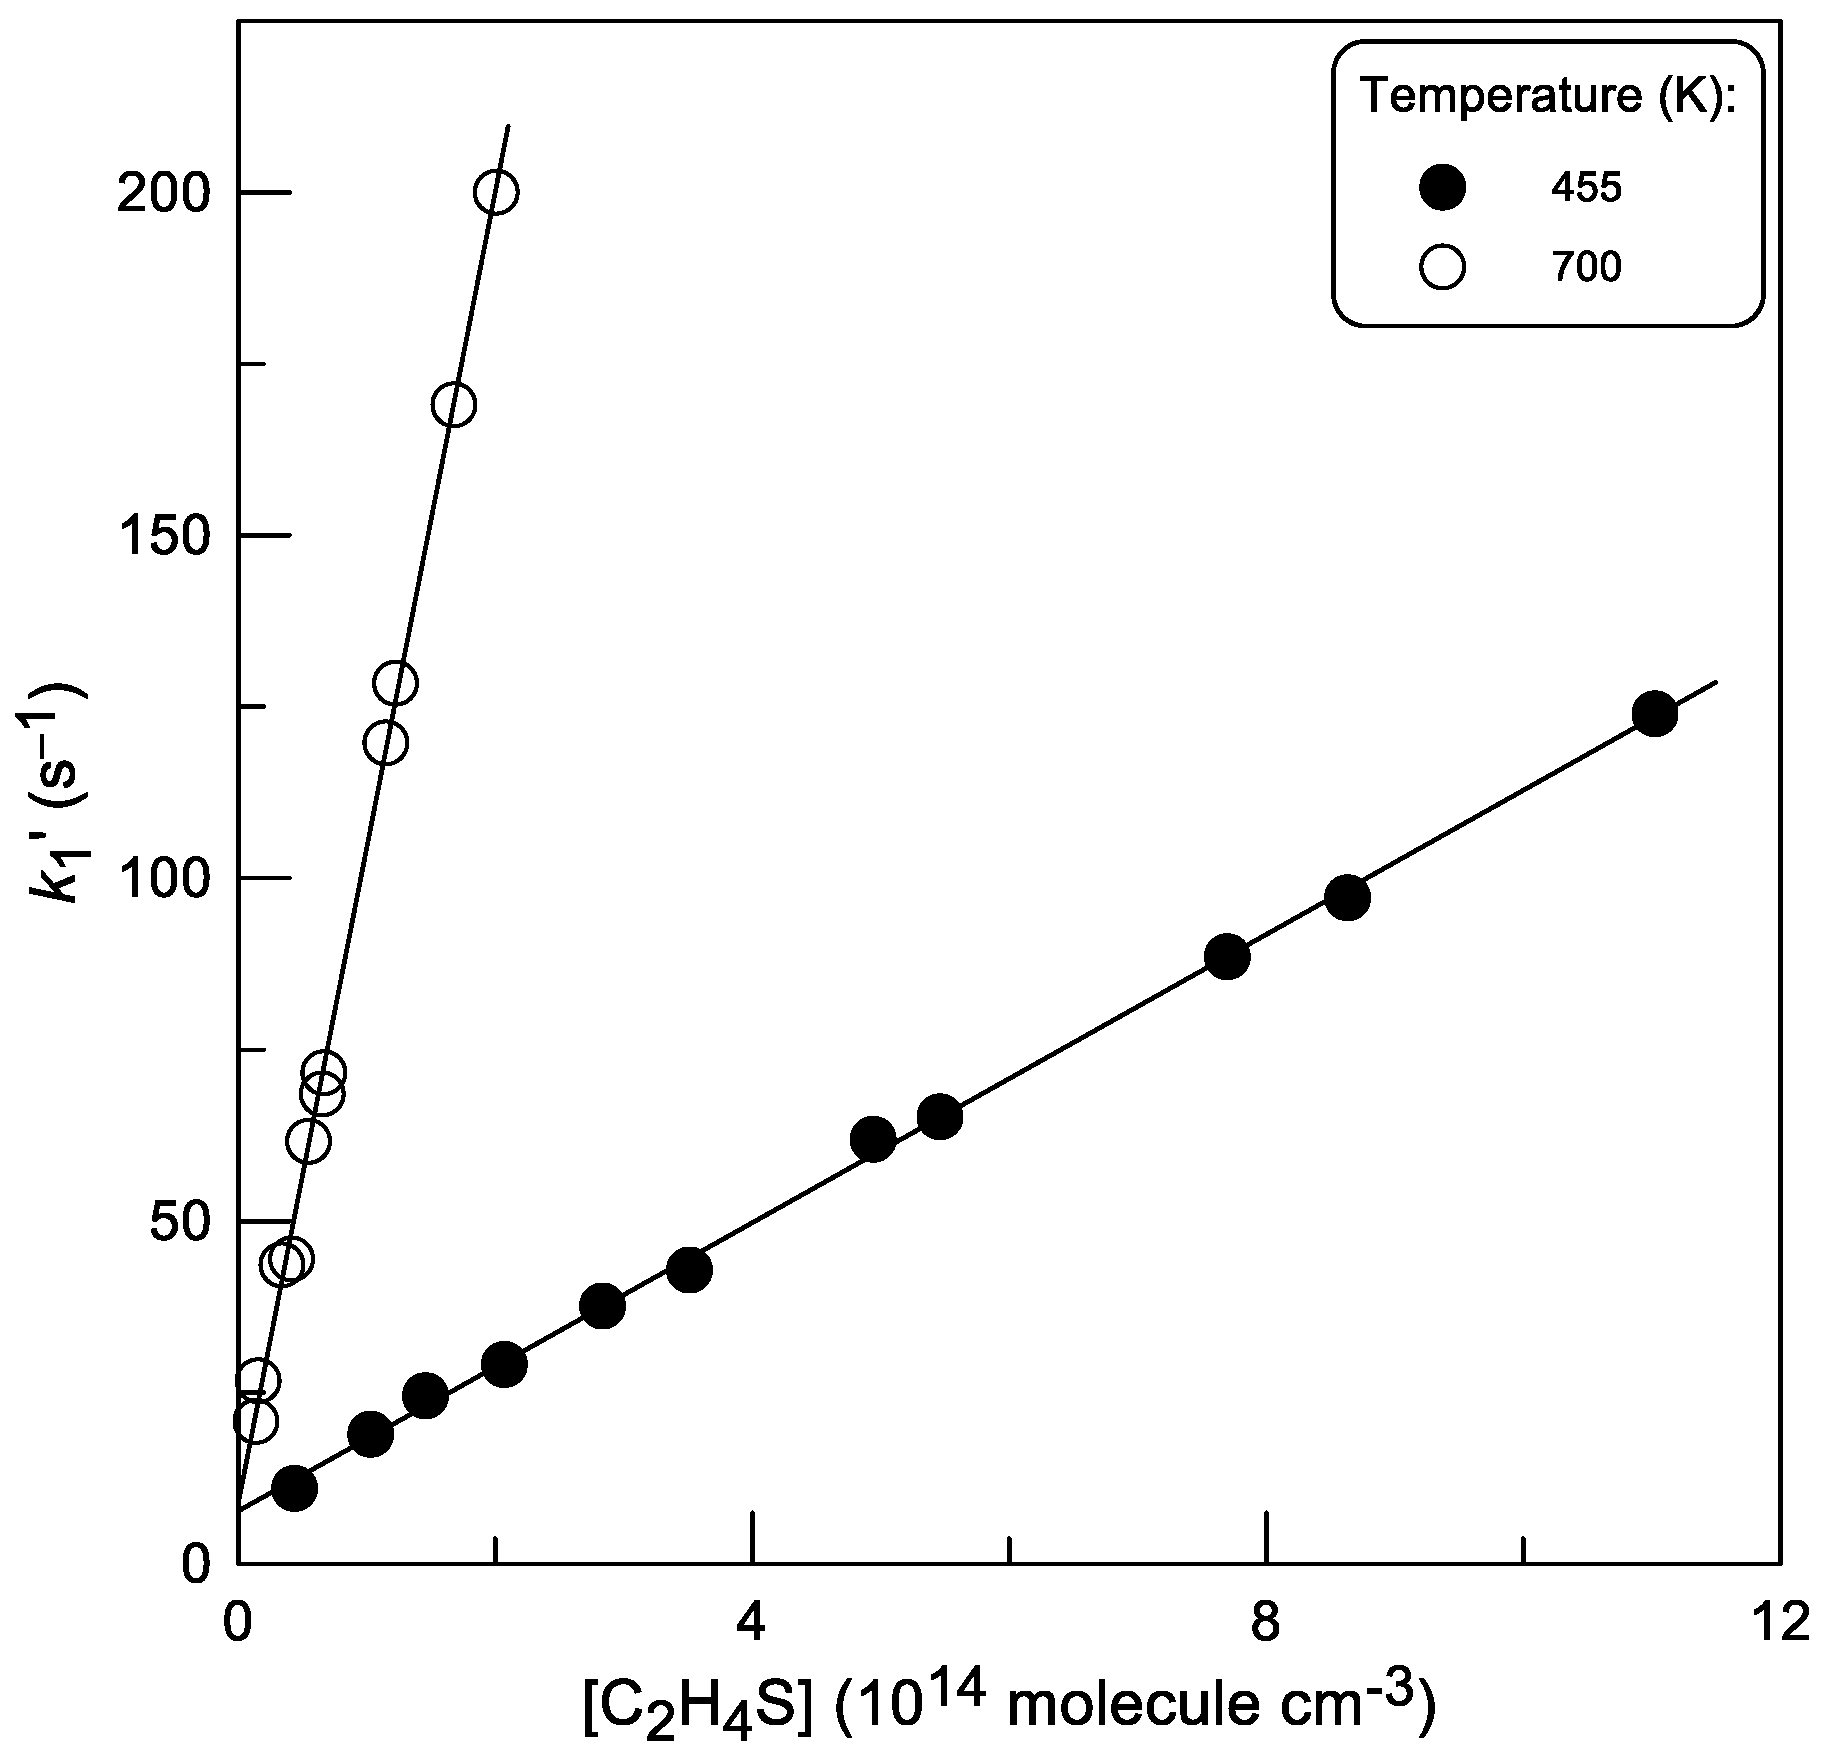
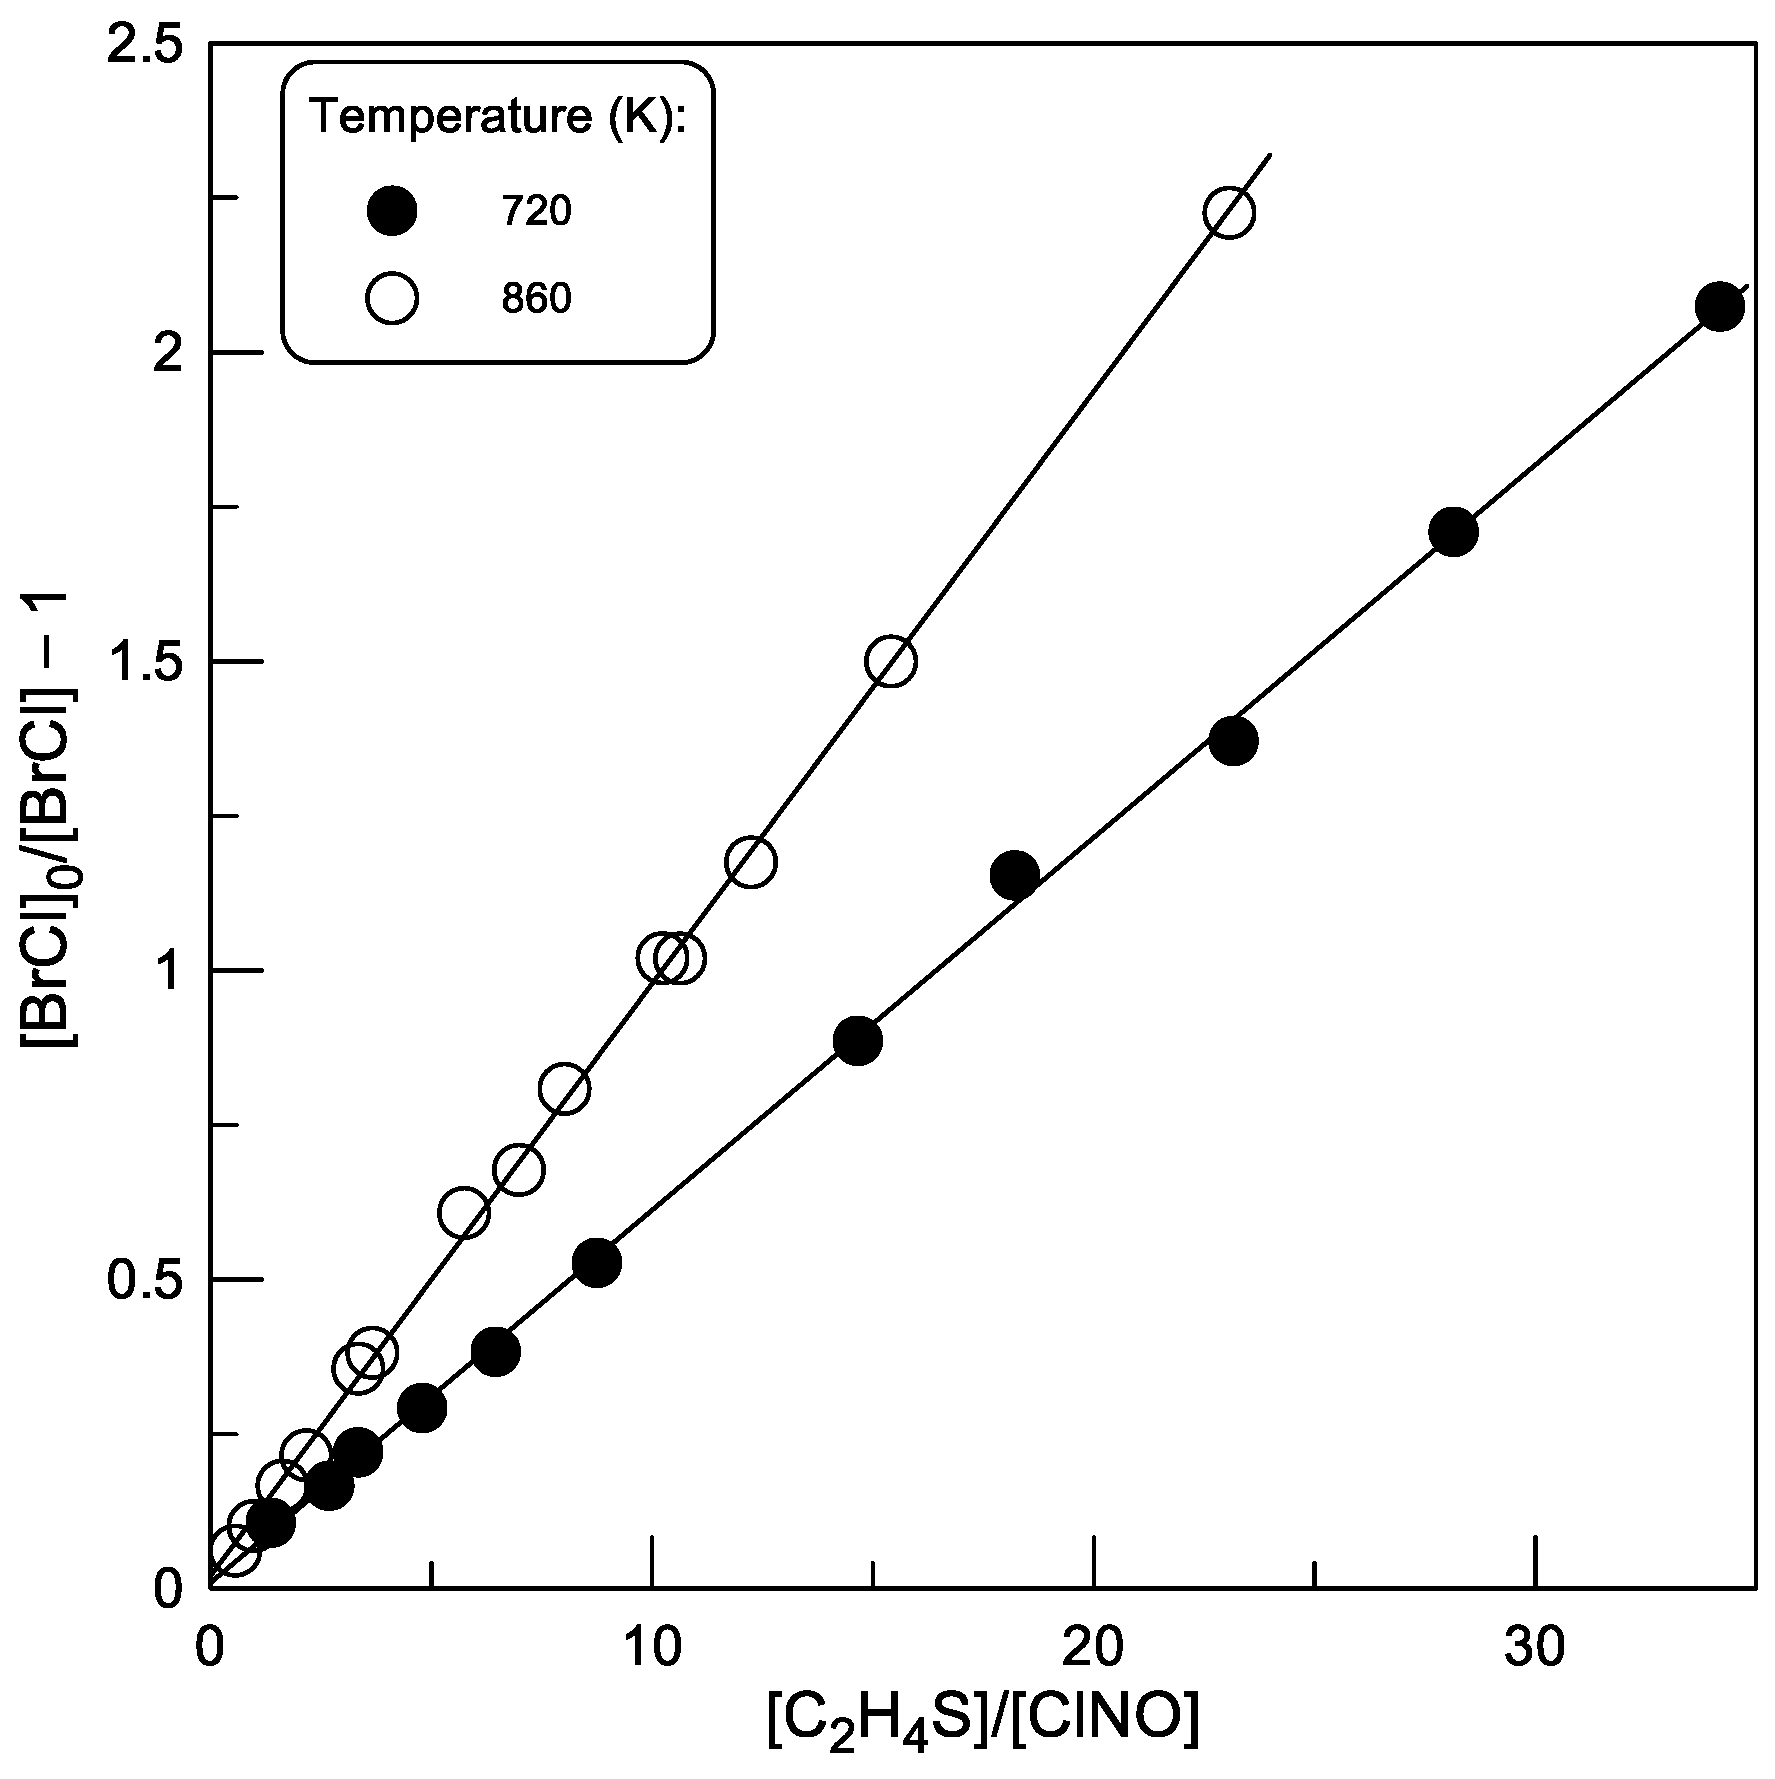
2.1.2. Absolute Measurements of k1: Kinetics of C2H4S Consumption
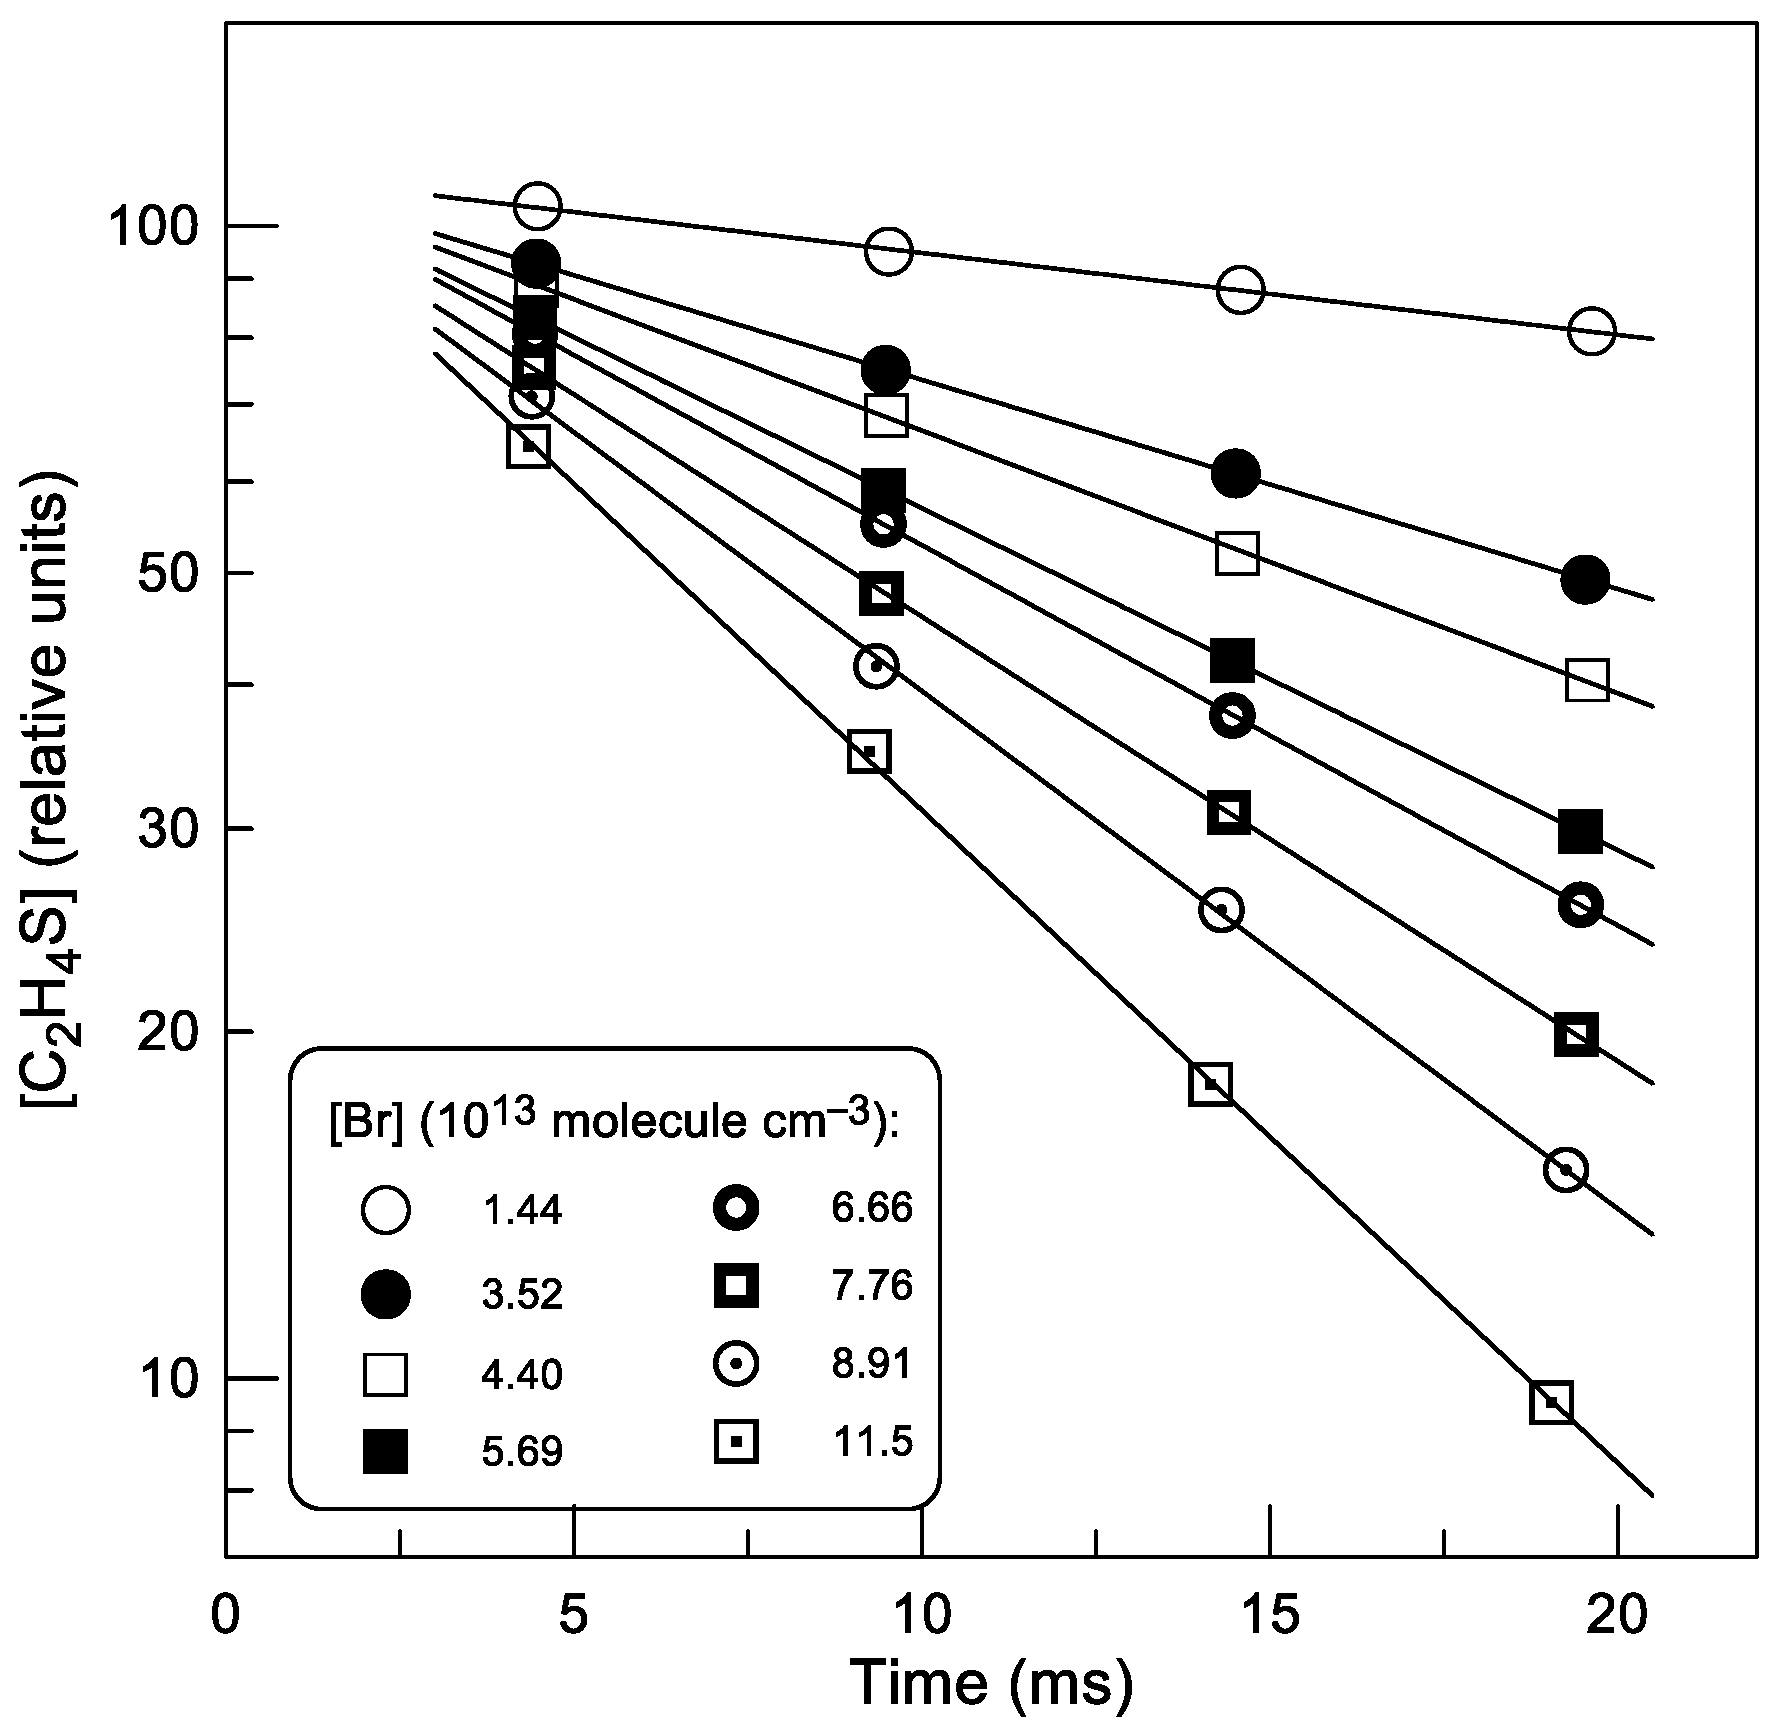
2.1.3. Relative Measurements of k1
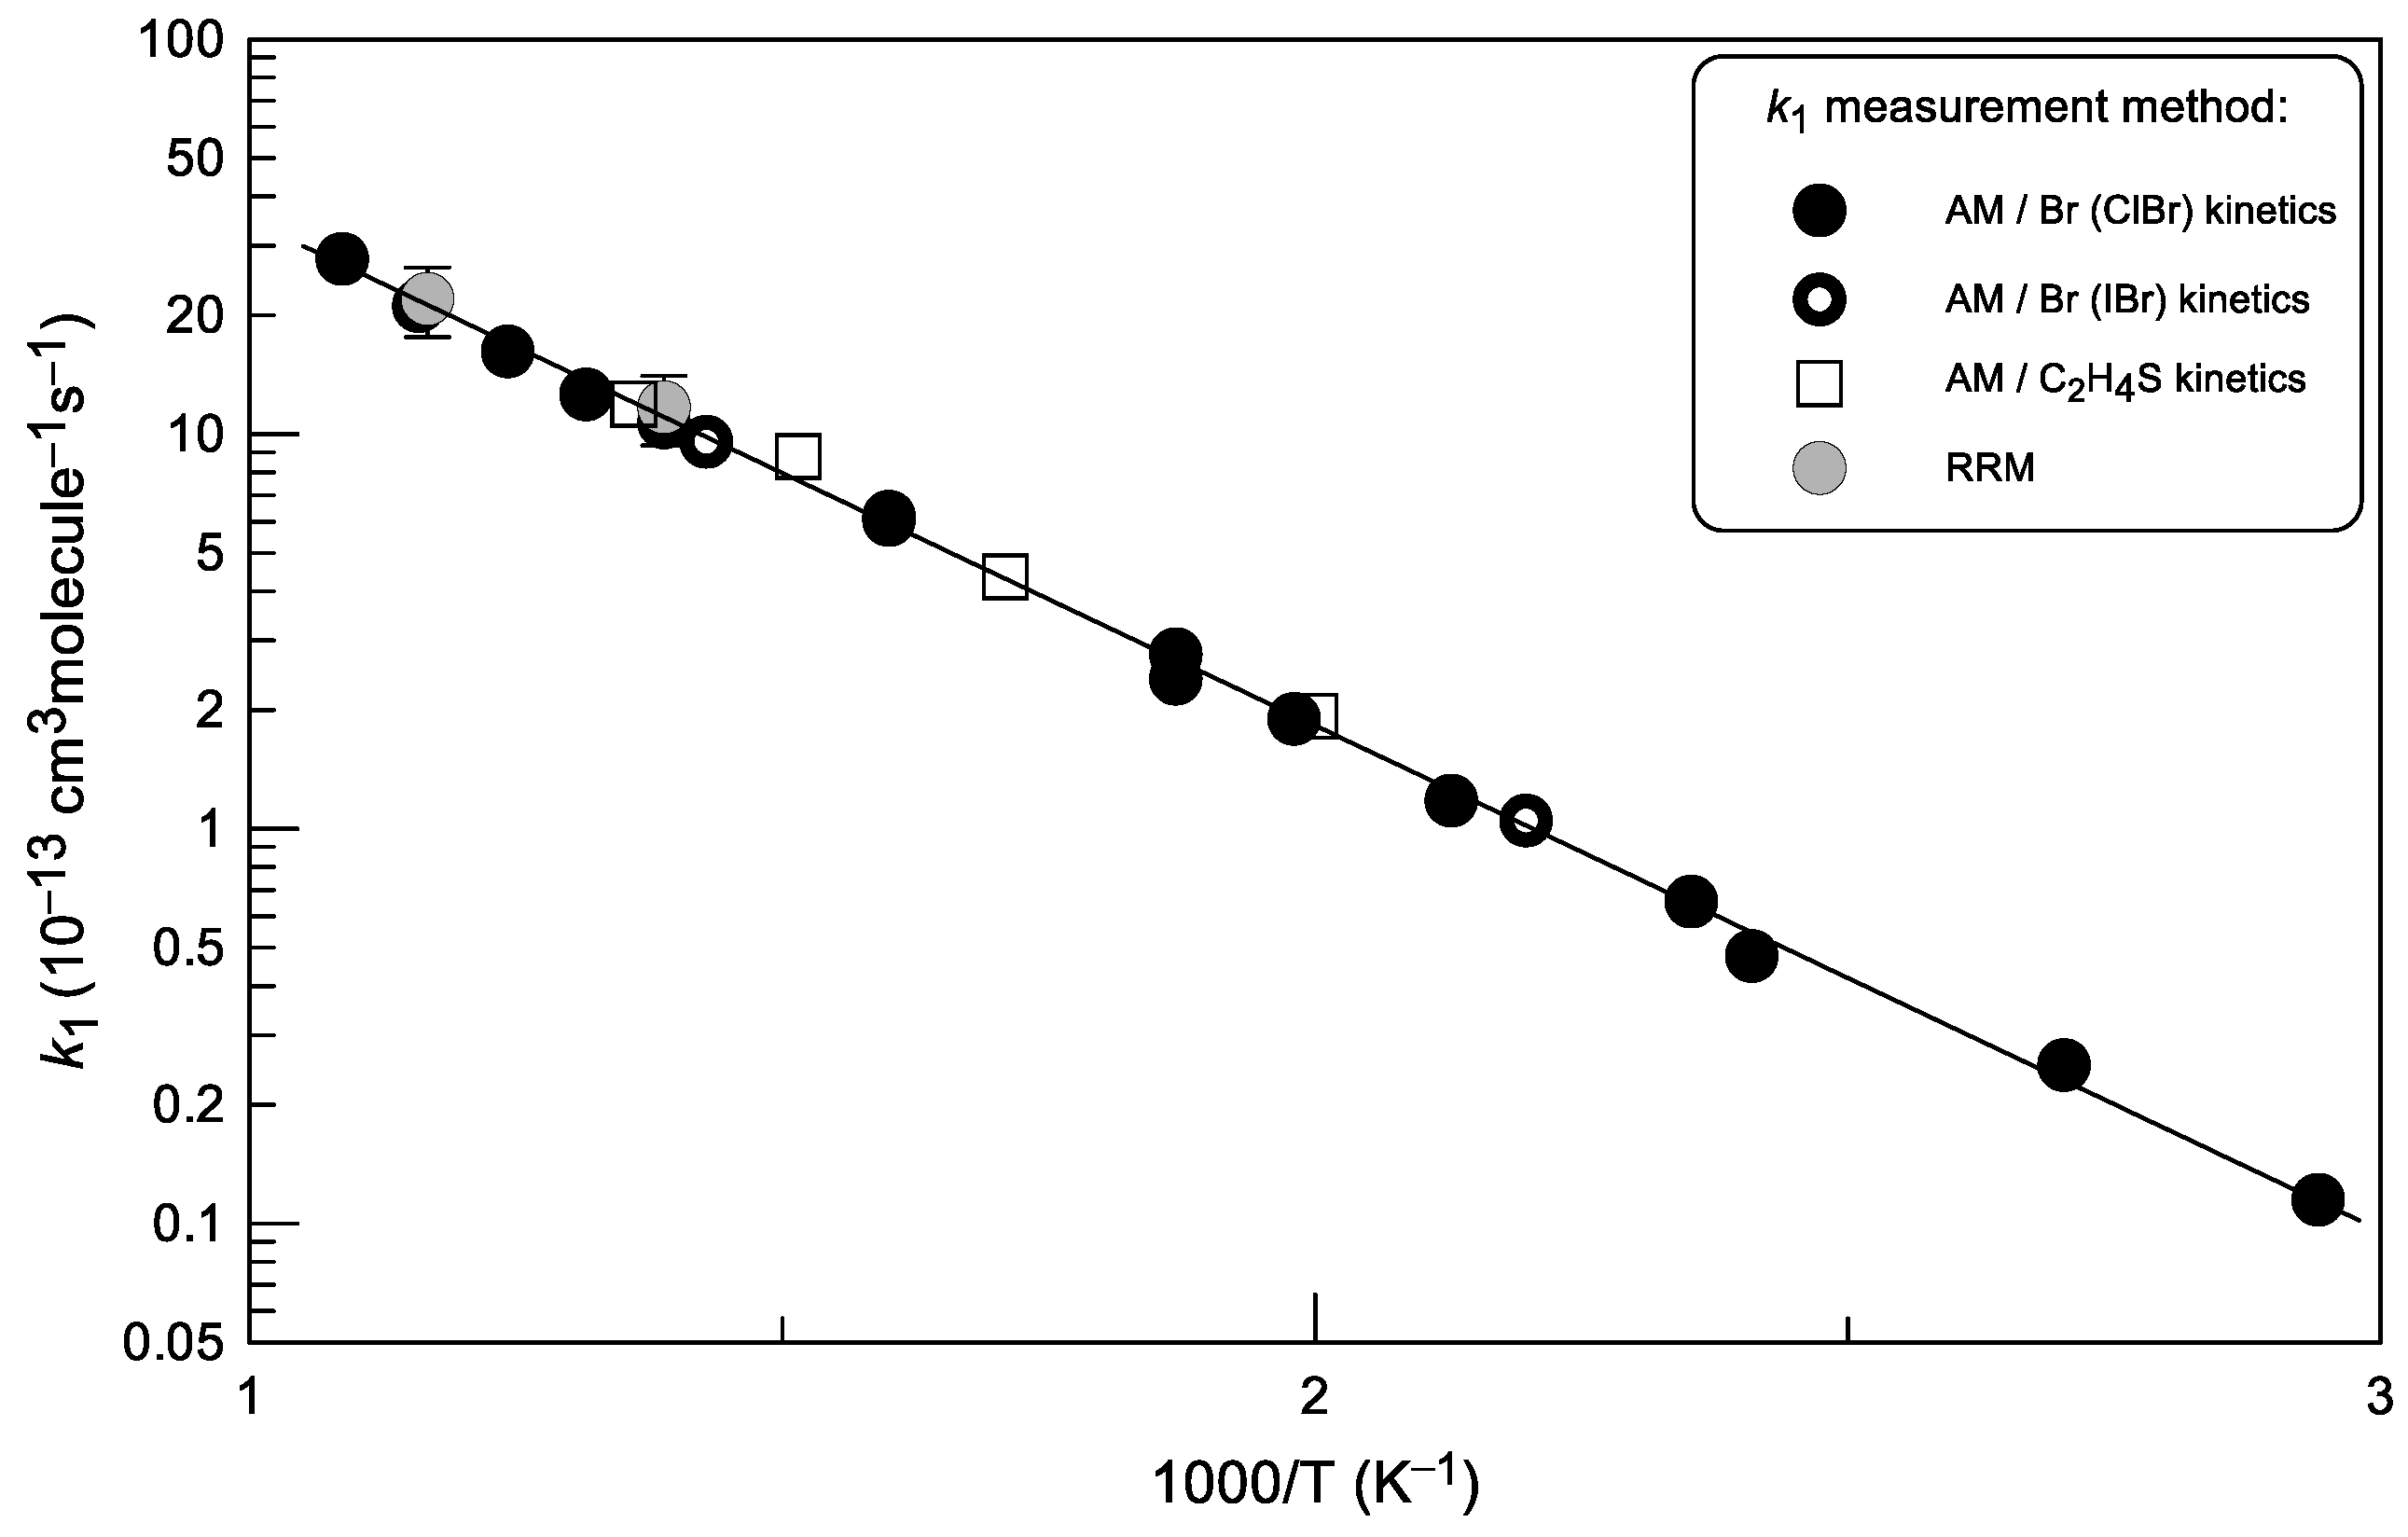
2.1.4. Temperature Dependence of k1
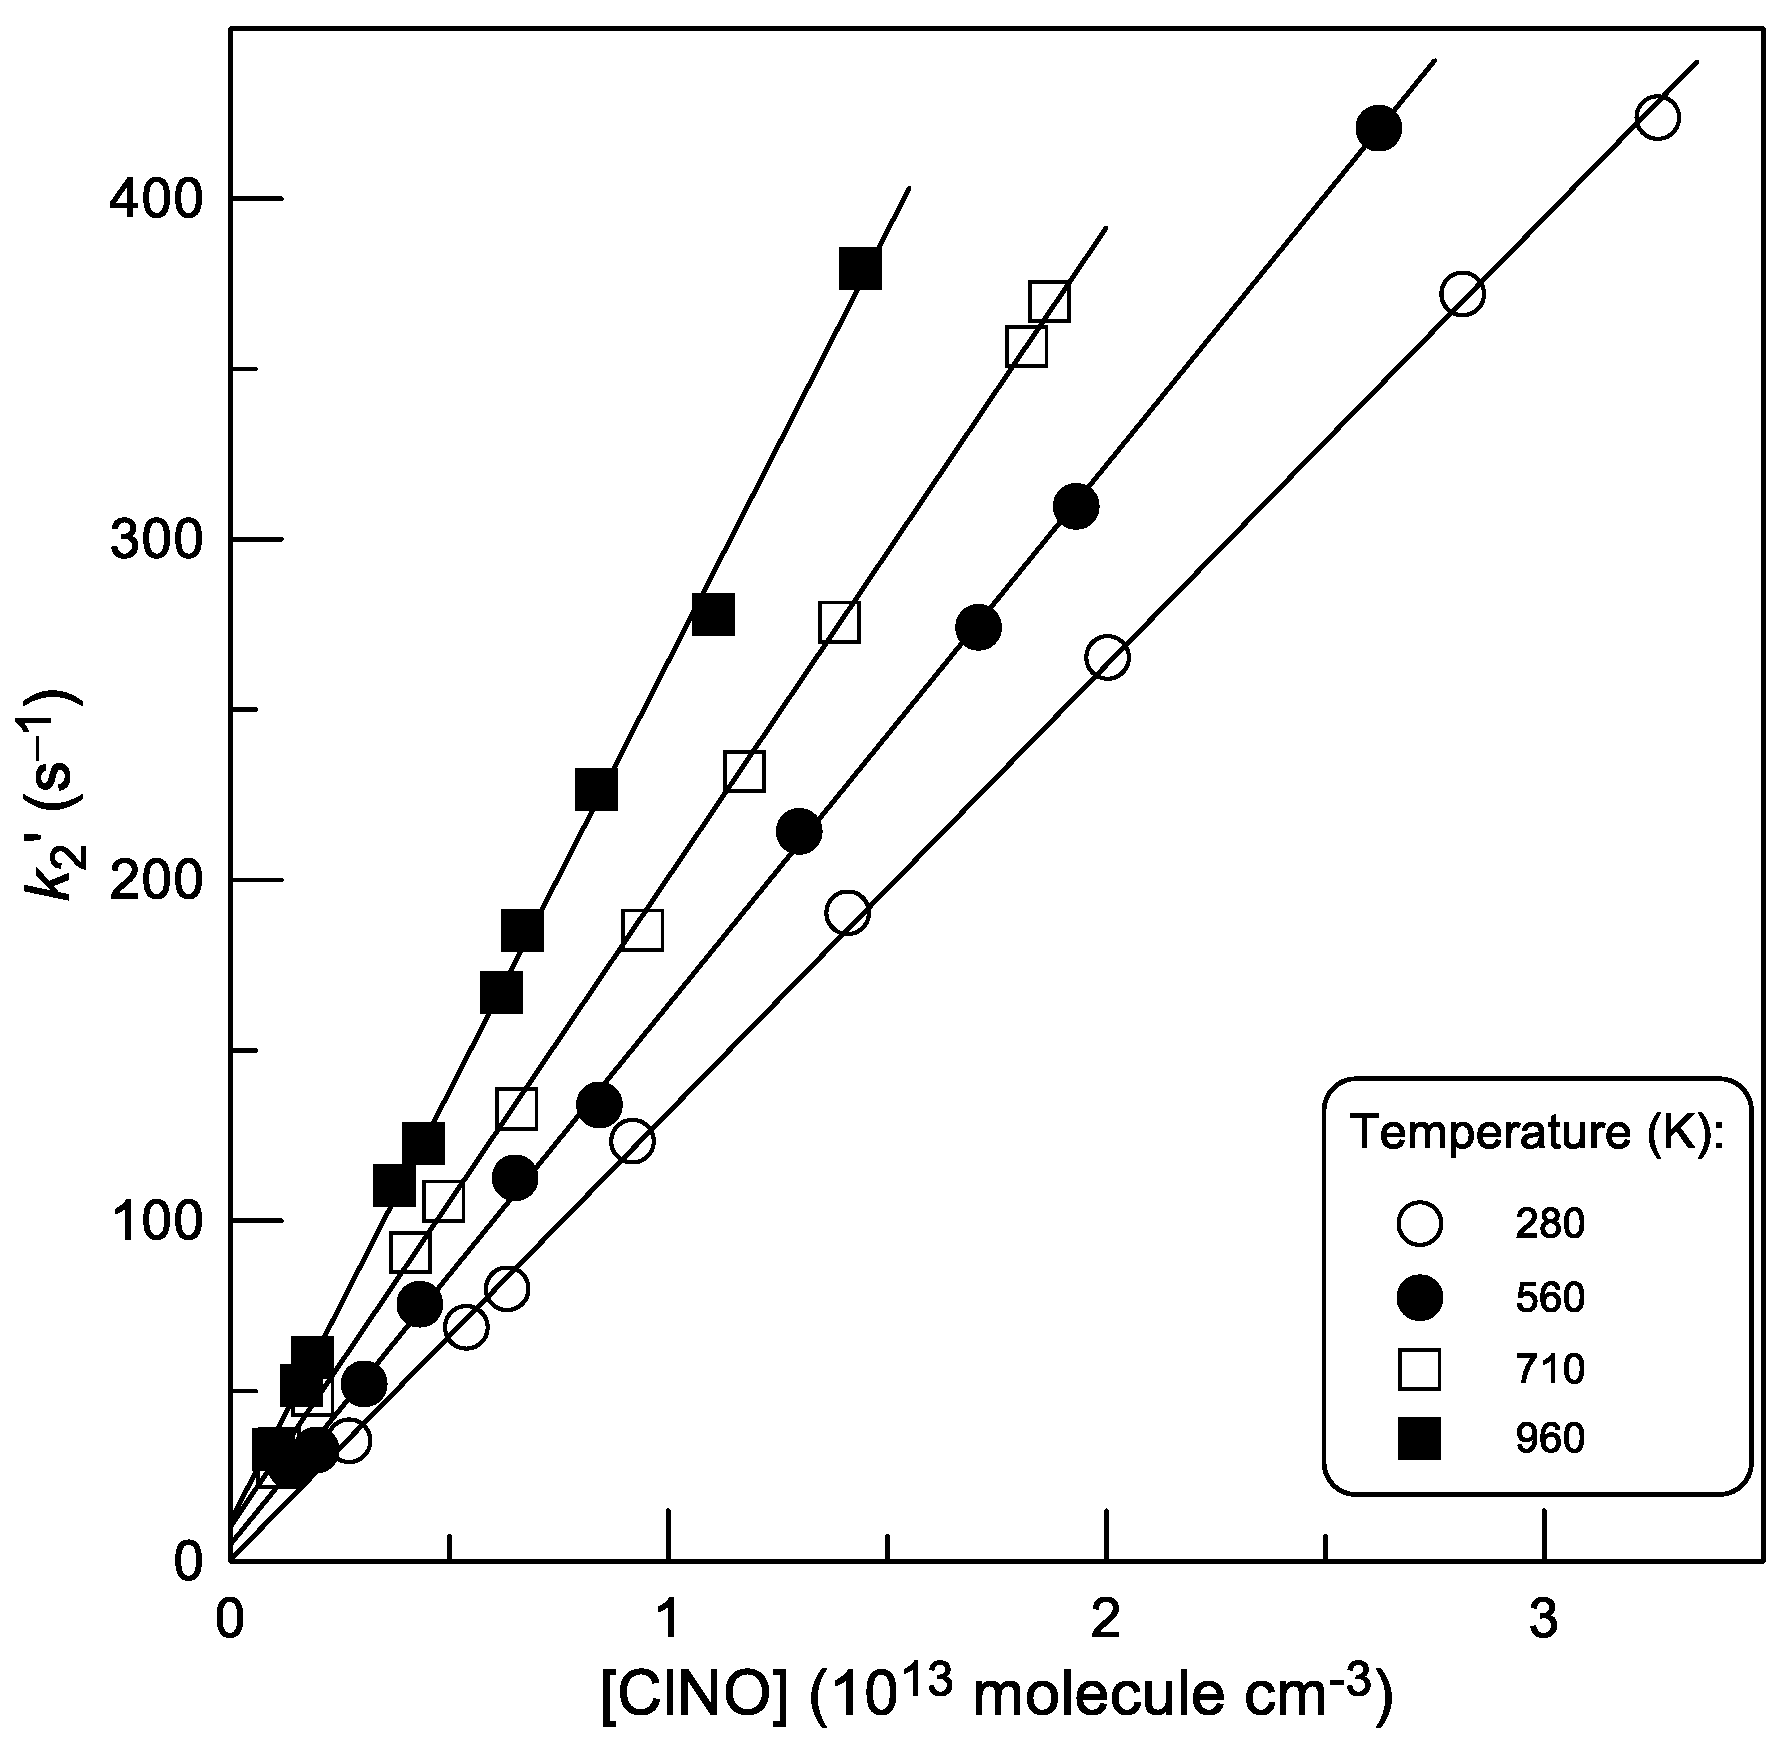
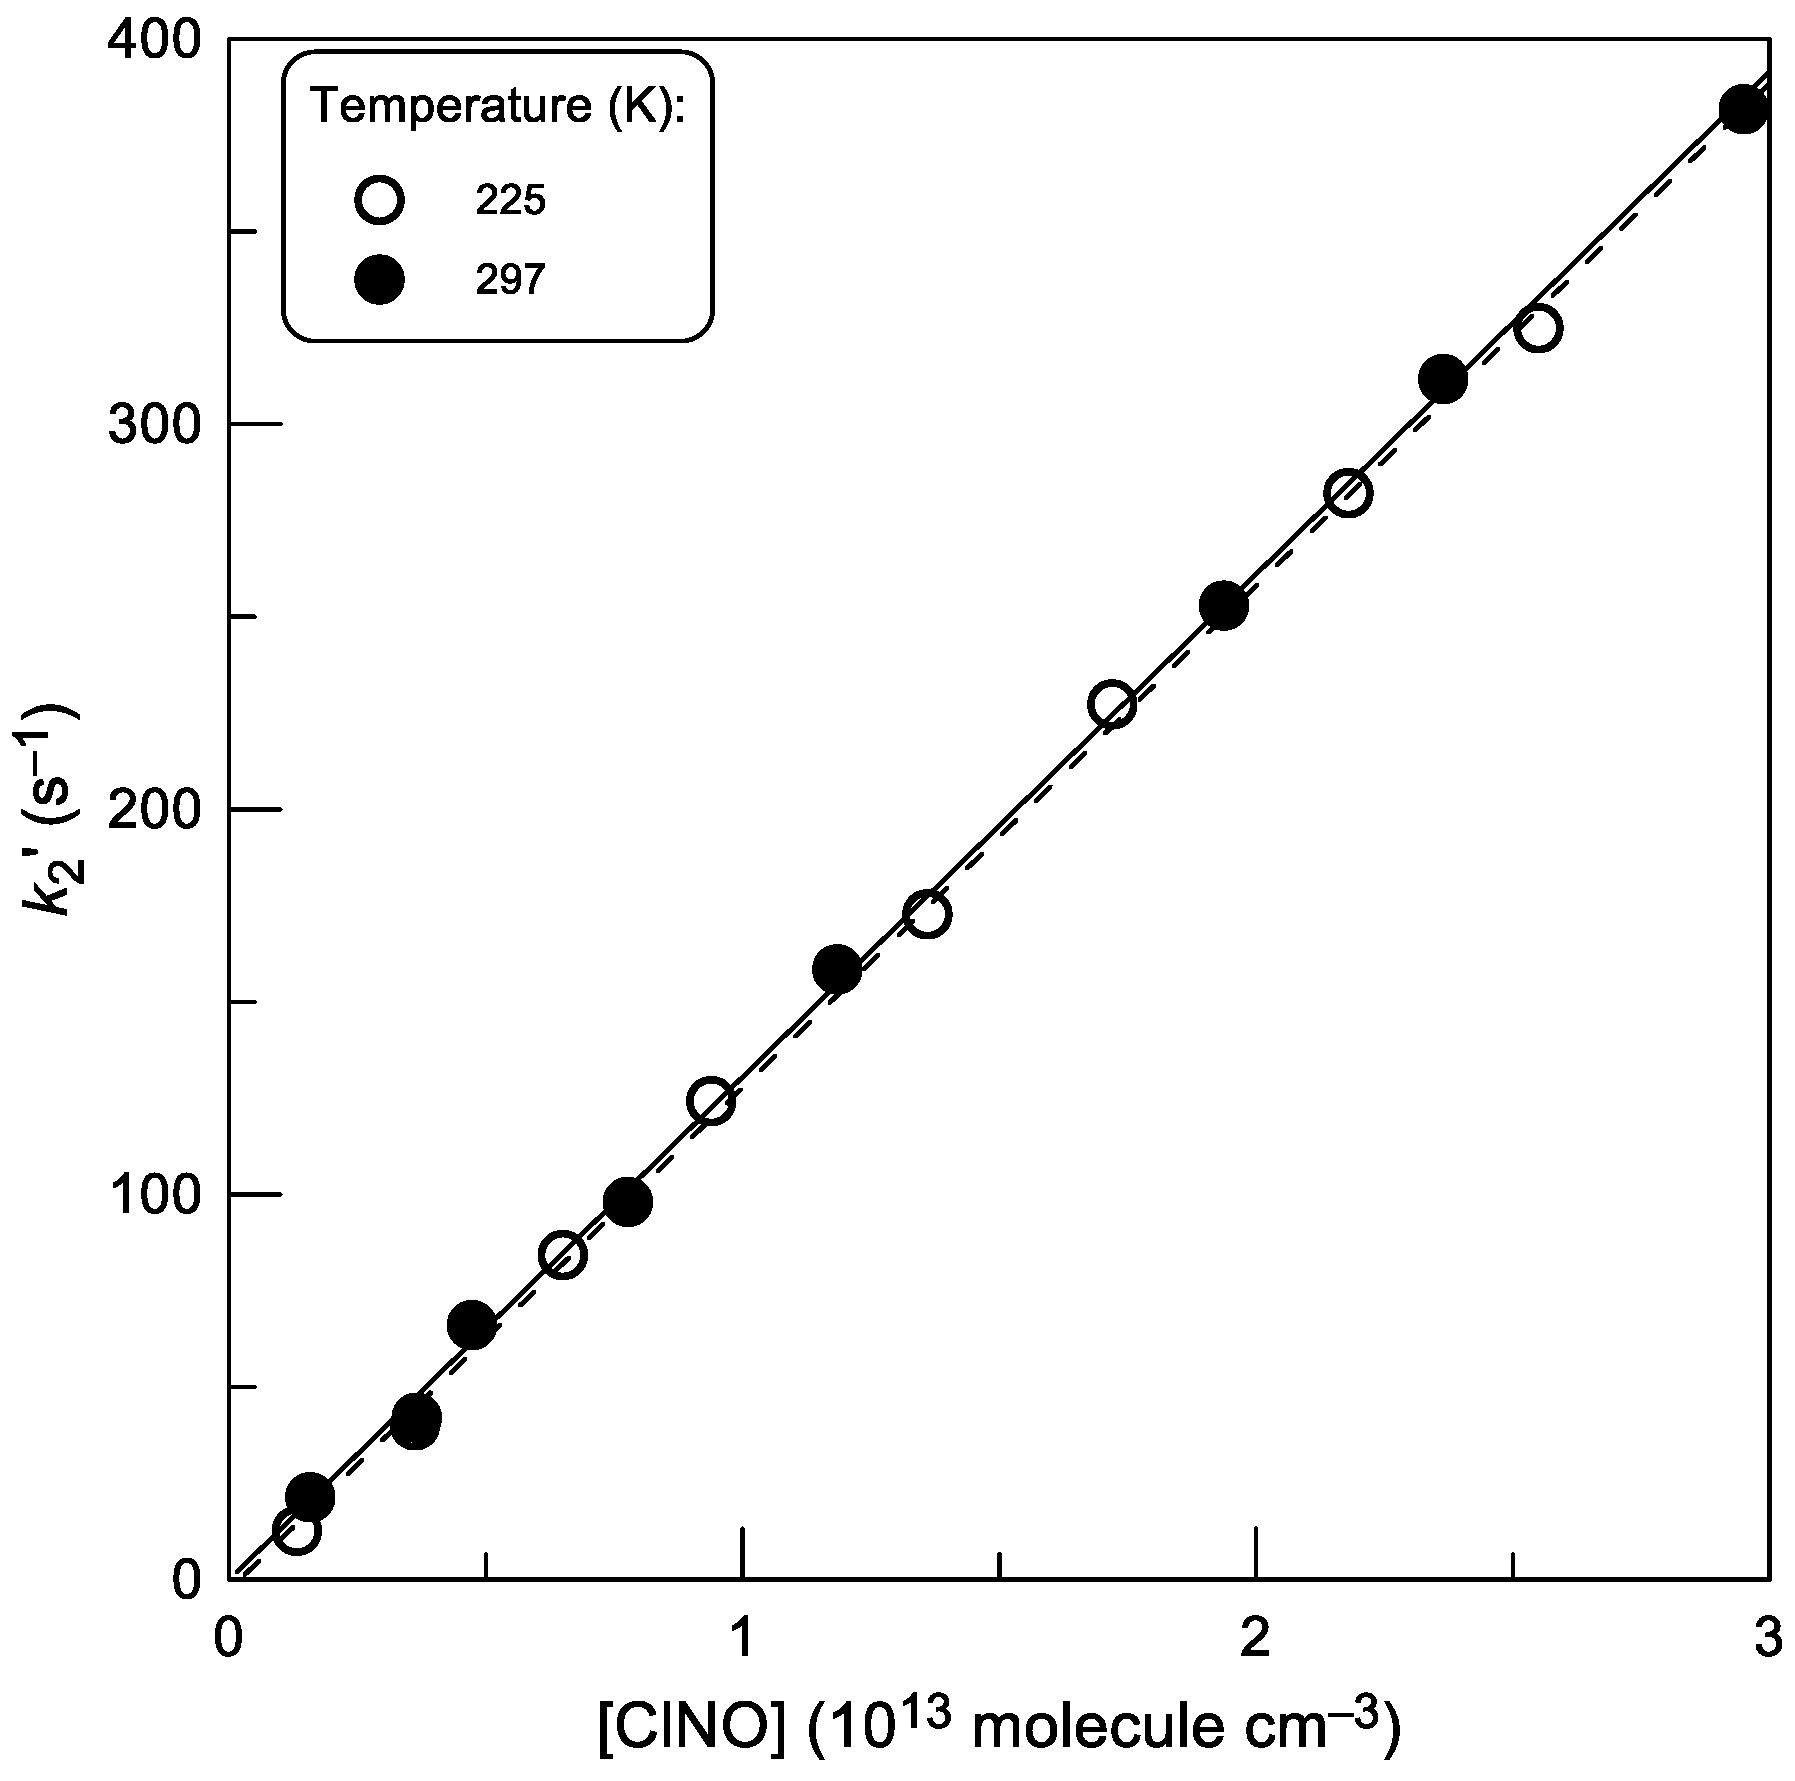
2.2. Rate Constant of Reaction (2)
2.2.1. Kinetics of Br Atom Consumption
2.2.2. Kinetics of BrCl Production
2.2.3. Temperature Dependence of k2
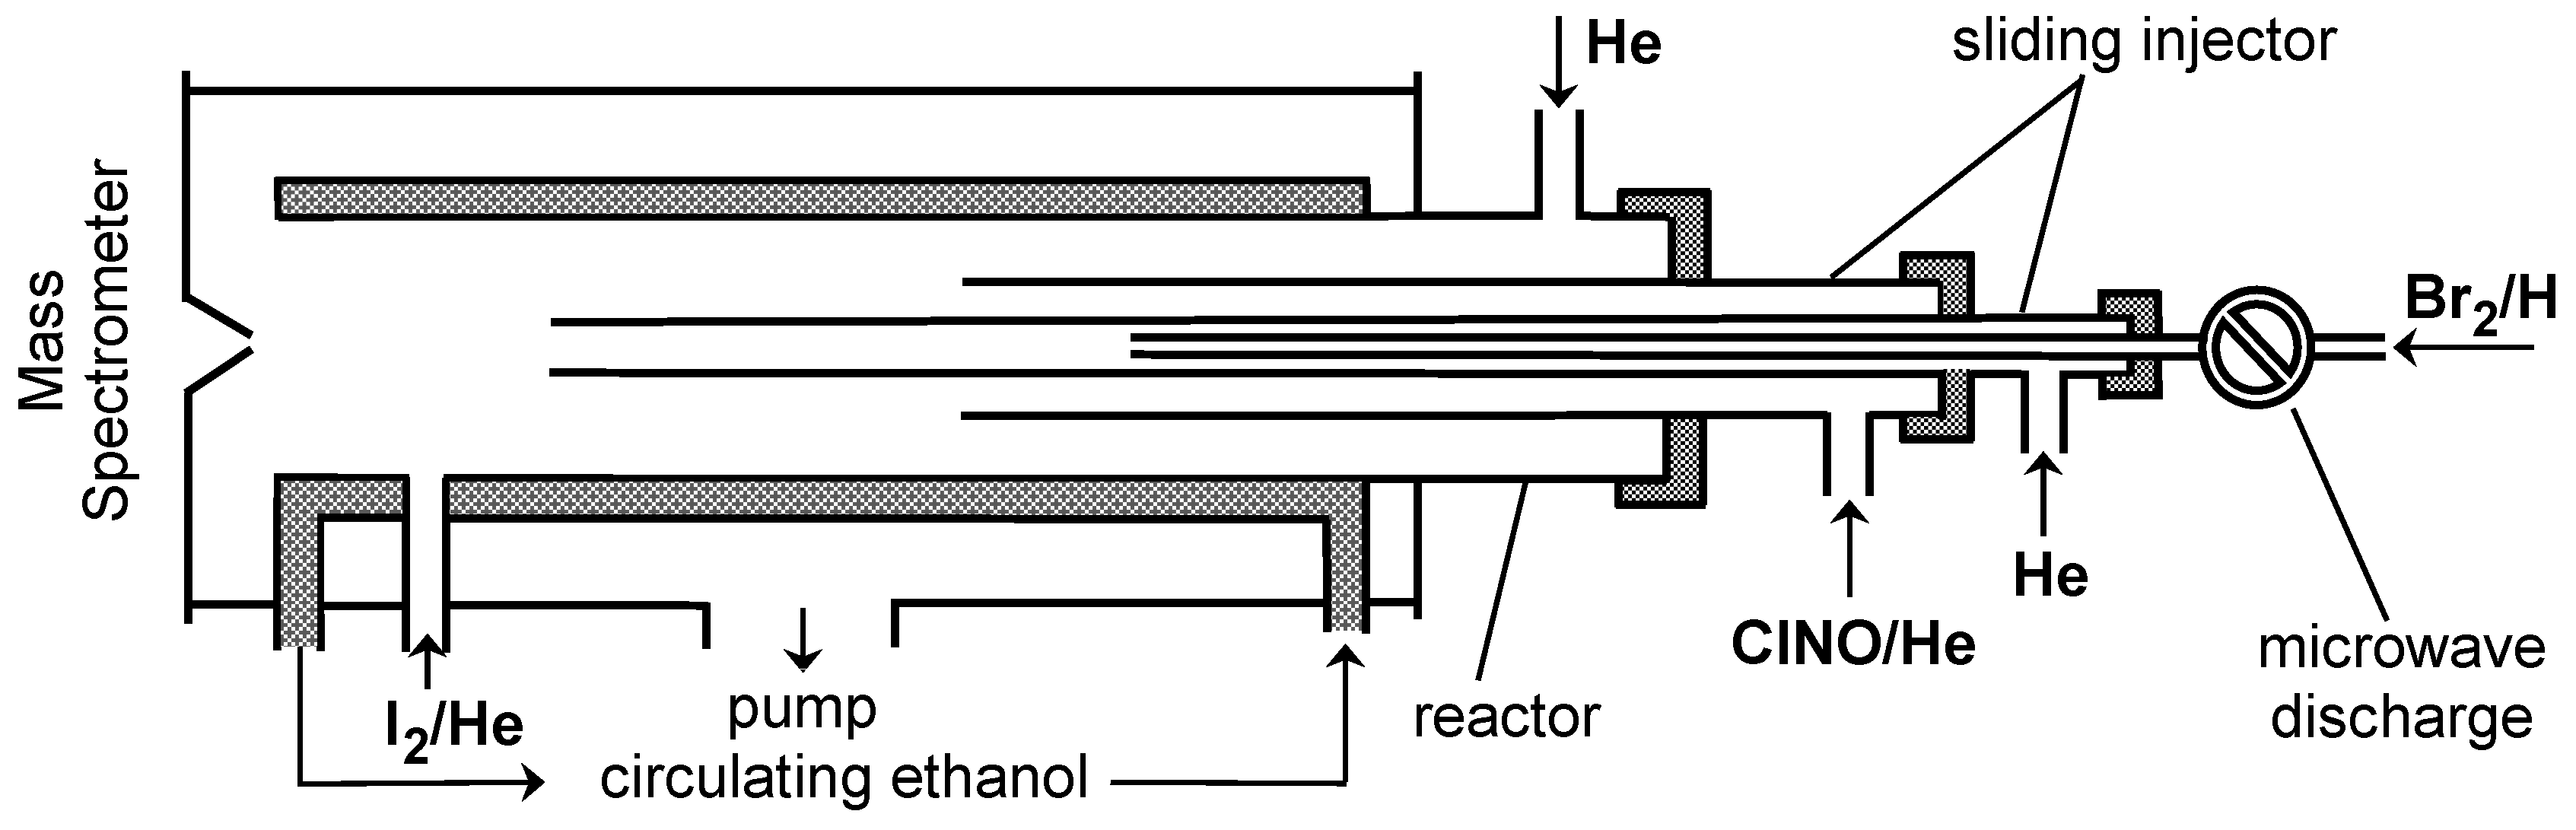
3. Materials and Methods
Funding
Institutional Review Board Statement
Informed Consent Statement
Data Availability Statement
Conflicts of Interest
References
- Bedjanian, Y. Temperature-Dependent Kinetic Study of the Reactions of Hydrogen Atoms with H2S and C2H4S. Molecules 2023, 28, 7883. [Google Scholar] [CrossRef] [PubMed]
- Lee, J.H.; Stief, L.J.; Timmons, R.B. Absolute rate parameters for the reaction of atomic hydrogen with carbonyl sulfide and ethylene episulfide. J. Chem. Phys. 1977, 67, 1705–1709. [Google Scholar] [CrossRef]
- Yokota, T.; Ahmed, M.G.; Safarik, I.; Strausz, O.P.; Gunning, H.E. Reaction of hydrogen atoms with thiirane. J. Phys. Chem. 1975, 79, 1758–1762. [Google Scholar] [CrossRef]
- Bedjanian, Y. Rate constant and products of the reaction of O(3P) atoms with thiirane over the temperature range 220–950 K. Int. J. Chem. Kinet. 2022, 54, 552–558. [Google Scholar] [CrossRef]
- Lee, J.H.; Timmons, R.B.; Stief, L.J. Absolute rate parameters for the reaction of ground state atomic oxygen with dimethyl sulfide and episulfide. J. Chem. Phys. 1976, 64, 300–305. [Google Scholar] [CrossRef]
- Van Roodselaar, A.; Safarik, I.; Strausz, O.P. The reactions of S(3PJ) atoms with thiiranes. Int. J. Chem. Kinet. 1984, 16, 899–907. [Google Scholar] [CrossRef]
- Klemm, R.B.; Davis, D.D. A flash photolysis resonance fluorescence kinetics study of ground-state sulfur atoms. III. Rate parameters for reaction of S(3P) with ethylene episulfide. Int. J. Chem. Kinet. 1973, 5, 149–153. [Google Scholar] [CrossRef]
- Donovan, R.J.; Husain, D.; Fair, R.W.; Strausz, O.P.; Gunning, H.E. Determination of the absolute rate for the addition of S(33P) to ethylene. Trans. Faraday Soc. 1970, 66, 1635–1641. [Google Scholar] [CrossRef]
- Murrells, T.P. Elementary reactions of the SCl radical. Part1.—Rate constants and mechanisms of the reaction Cl + C2H4S → SCl + C2H4, SCl + SCl → products and SCl + Cl2→ SCl2+ Cl. J. Chem. Soc. Faraday Trans. 2 1988, 84, 67–83. [Google Scholar] [CrossRef]
- Nava, D.F.; Brobst, W.D.; Stief, L.J. Temperature study of the rates of the reactions of atomic chlorine with hydrogen sulfide and C2H4S. J. Phys. Chem. 1985, 89, 4703–4707. [Google Scholar] [CrossRef]
- Burkholder, J.B.; Sander, S.P.; Abbatt, J.; Barker, J.R.; Cappa, C.; Crounse, J.D.; Dibble, T.S.; Huie, R.E.; Kolb, C.E.; Kurylo, M.J.; et al. Chemical Kinetics and Photochemical Data for Use in Atmospheric Studies, Evaluation No. 19, JPL Publication 19-5. Jet Propulsion Laboratory. Available online: http://jpldataeval.jpl.nasa.gov (accessed on 20 January 2025).
- NIST Chemistry WebBook. NIST Standard Reference Database Number 69. Available online: http://webbook.nist.gov/chemistry/ (accessed on 20 January 2025).
- Ornellas, F. Thermochemistry of new molecular species: SBr and HSBr. J. Chem. Phys. 2007, 126, 204314. [Google Scholar] [CrossRef] [PubMed]
- Clyne, M.A.A.; Cruse, H.W. Atomic resonance fluorescence spectrometry for rate constants of rapid bimolecular reactions. Part 1.—Reactions O + NO2, Cl + ClNO, Br + ClNO. J. Chem. Soc. Faraday Trans. 2 1972, 68, 1281–1299. [Google Scholar] [CrossRef]
- Abbatt, J.P.D.; Toohey, D.W.; Fenter, F.F.; Stevens, P.S.; Brune, W.H.; Anderson, J.G. Kinetics and mechanism of X + ClNO → XCl + NO (X = Cl, F, Br, OH, O, N) from 220 K to 450 K. Correlation of reactivity and activation energy with electron affinity of X. J. Phys. Chem. 1989, 93, 1022–1029. [Google Scholar] [CrossRef]
- Bedjanian, Y.; LeBras, G.; Poulet, G. Kinetic study of the Br+IO, I+BrO and Br+I2 reactions. Heat of formation of the BrO radical. Chem. Phys. Lett. 1997, 266, 233–238. [Google Scholar] [CrossRef]
- Kaufman, F. Kinetics of elementary radical reactions in the gas phase. J. Phys. Chem. 1984, 88, 4909–4917. [Google Scholar] [CrossRef]
- Tang, M.J.; Cox, R.A.; Kalberer, M. Compilation and evaluation of gas phase diffusion coefficients of reactive trace gases in the atmosphere: Volume 1. Inorganic compounds. Atmos. Chem. Phys. 2014, 14, 9233–9247. [Google Scholar] [CrossRef]
- Bedjanian, Y. Kinetics and Products of the Reaction of OH Radicals with ClNO from 220 to 940 K. J. Phys. Chem. A 2018, 122, 916–922. [Google Scholar] [CrossRef] [PubMed]
- Morin, J.; Romanias, M.N.; Bedjanian, Y. Experimental study of the reactions of OH radicals with propane, n-pentane, and n-heptane over a wide temperature range. Int. J. Chem. Kinet. 2015, 47, 629–637. [Google Scholar] [CrossRef]
- Wingen, L.M.; Barney, W.S.; Lakin, M.J.; Brauers, T.; Finlayson-Pitts, B.J. A Unique Method for Laboratory Quantification of Gaseous Nitrous Acid (HONO) Using the Reaction HONO + HCl → ClNO + H2O. J. Phys. Chem. A 2000, 104, 329–335. [Google Scholar] [CrossRef]

 : 2.0 × 10¹¹;
  : 5.0 × 10¹¹ molecule cm−3).
: 2.0 × 10¹¹; : 5.0 × 10¹¹ molecule cm−3).
: 5.0 × 10¹¹ molecule cm−3).
: 2.0 × 10¹¹; : 5.0 × 10¹¹ molecule cm−3).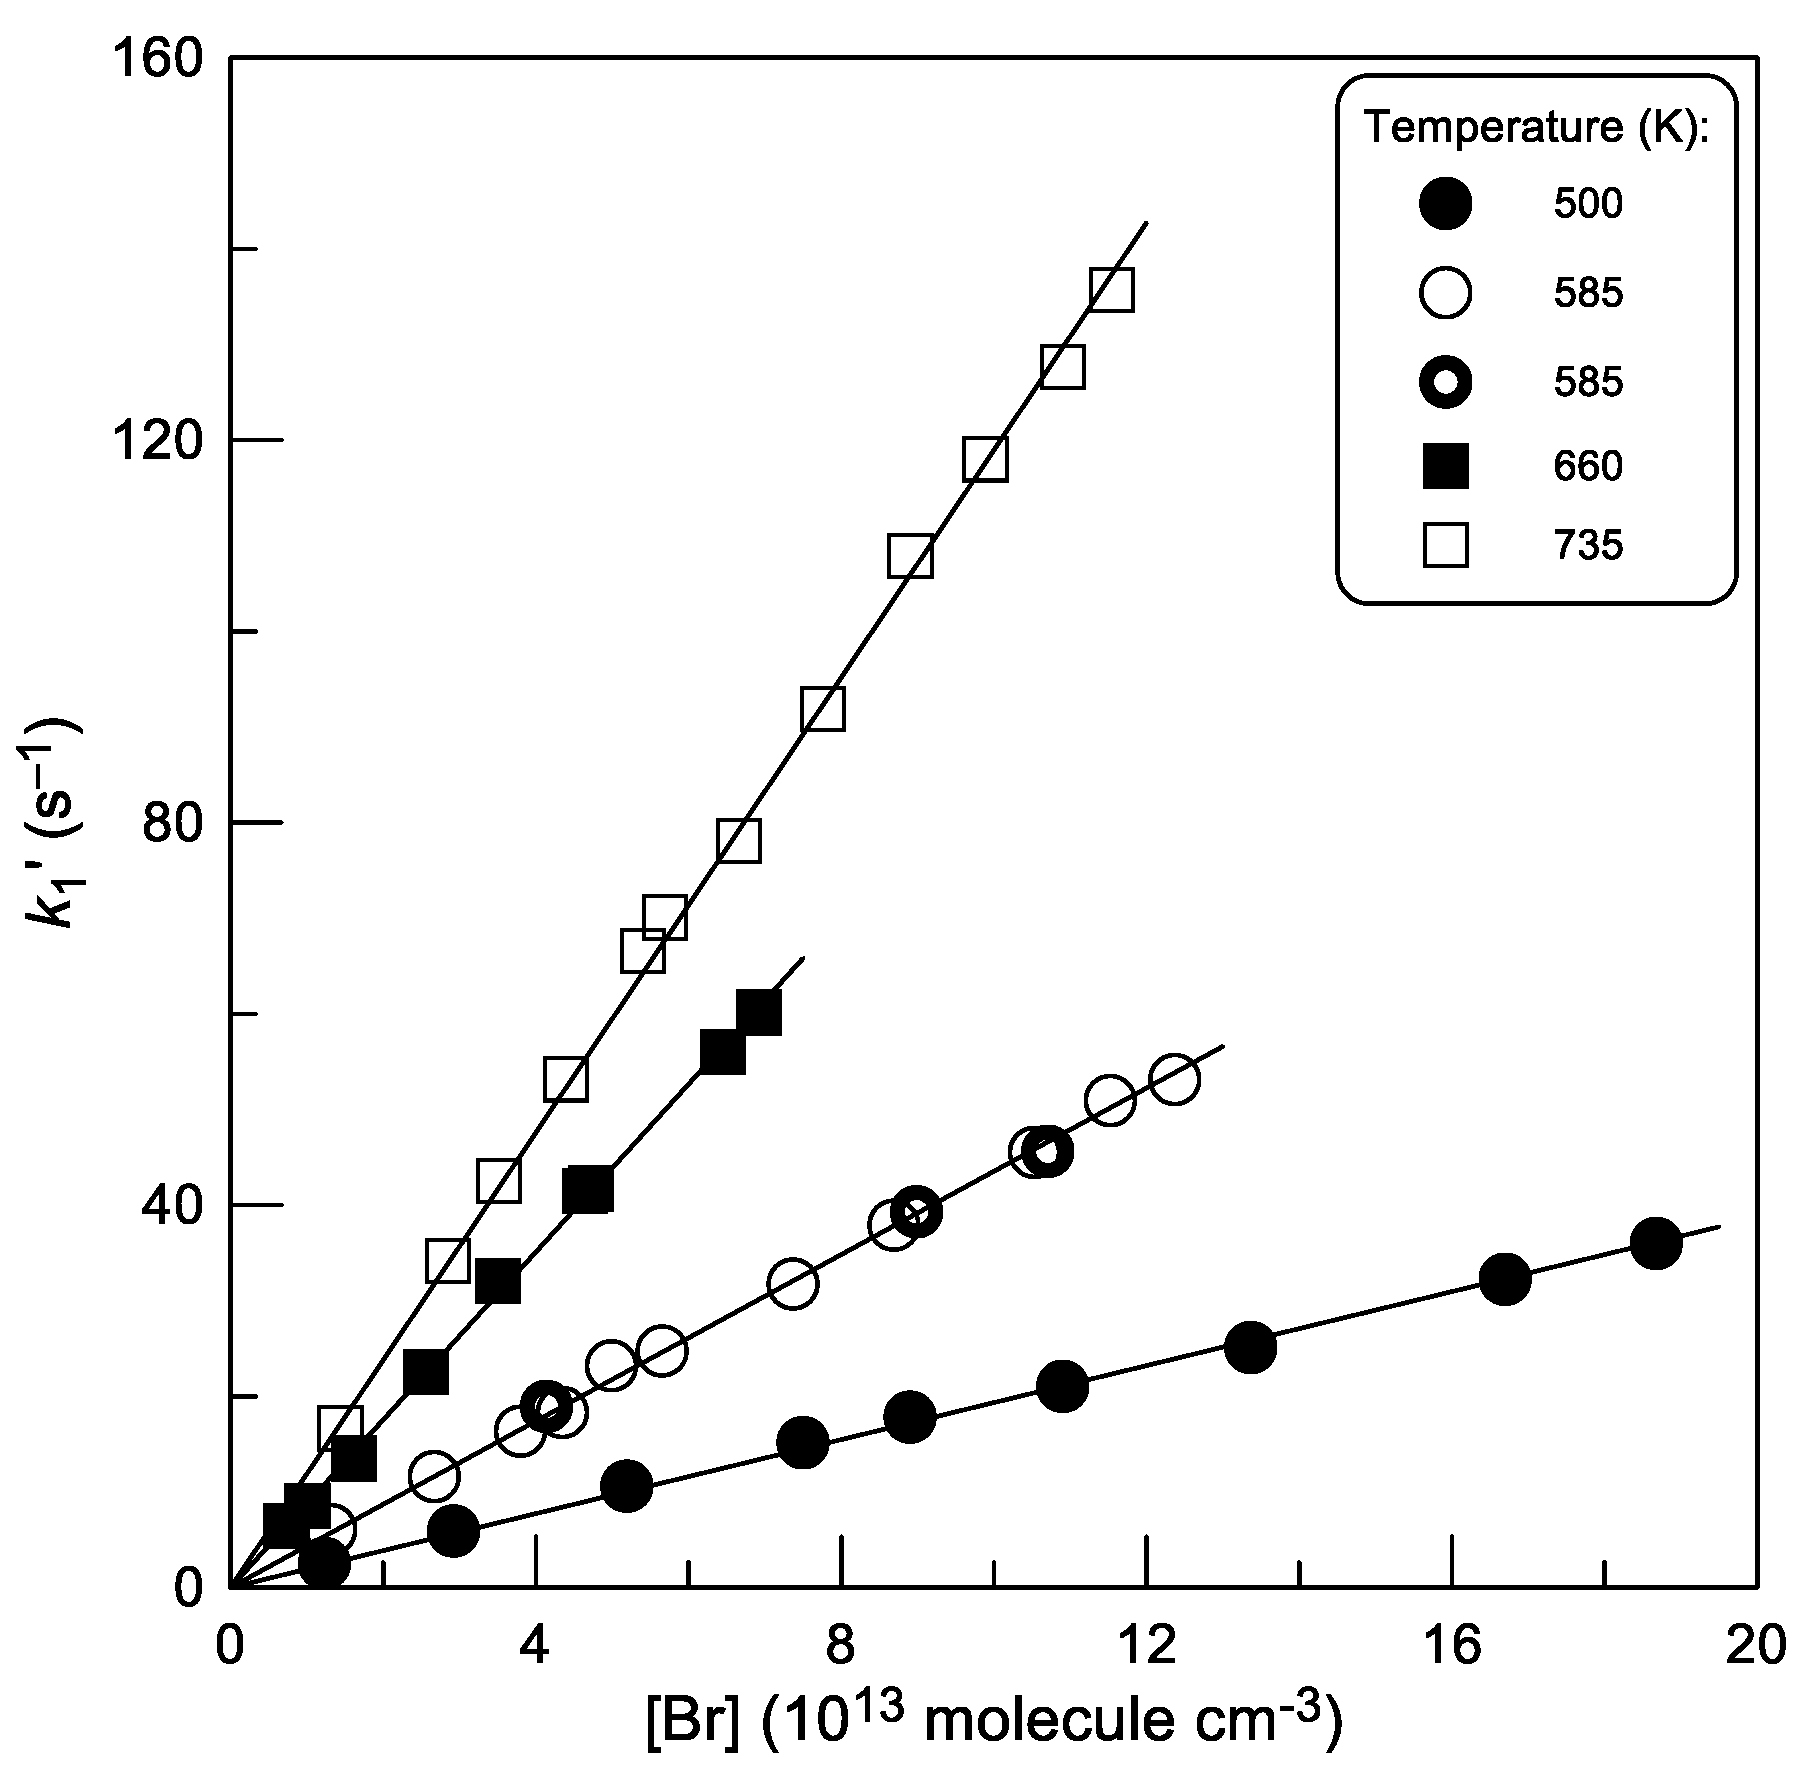


| T (K) | [Excess Reactant] a | k1 b | Method c |
|---|---|---|---|
| 340 | 2.82–23.6 | 0.115 | AM/Br (ClBr) kinetics |
| 370 | 0.48–8.31 | 0.252 | AM/Br (ClBr) kinetics |
| 415 | 0.70–12.4 | 0.476 | AM/Br (ClBr) kinetics |
| 425 | 1.16–15.5 | 0.654 | AM/Br (ClBr) kinetics |
| 455 | 0.44–11.0 | 1.05 | AM/Br (IBr) kinetics |
| 470 | 0.57–12.5 | 1.18 | AM/Br (ClBr) kinetics |
| 500 | 0.12–1.87 | 1.93 | AM/C2H4S kinetics |
| 505 | 0.79–6.50 | 1.90 | AM/Br (ClBr) kinetics |
| 535 | 0.40–6.02 | 2.77 | AM/Br (ClBr) kinetics |
| 535 | 0.46–9.32 | 2.40 | AM/Br (ClBr) kinetics |
| 585 | 0.13–1.24 | 4.35 | AM/C2H4S kinetics |
| 625 | 0.10–3.45 | 6.18 | AM/Br (ClBr) kinetics |
| 625 | 0.34–6.32 | 6.06 | AM/Br (ClBr) kinetics |
| 660 | 0.07–0.69 | 8.77 | AM/C2H4S kinetics |
| 700 | 0.14–2.01 | 9.56 | AM/Br (IBr) kinetics |
| 720 | 0.19–3.60 | 10.7 | AM/Br (ClBr) kinetics |
| 720 | 11.7 | RRM | |
| 735 | 0.14–1.15 | 11.9 | AM/C2H4S kinetics |
| 760 | 0.14–1.40 | 12.6 | AM/Br (ClBr) kinetics |
| 805 | 0.07–1.29 | 16.2 | AM/Br (ClBr) kinetics |
| 857 | 22.0 | RRM | |
| 863 | 0.10–1.73 | 21.1 | AM/Br (ClBr) kinetics |
| 920 | 0.09–1.65 | 27.8 | AM/Br (ClBr) kinetics |
| T (K) | [ClNO] a | k1 b | Reactor Surface c | Method d |
|---|---|---|---|---|
| 225 | 0.12–2.52 | 1.31 | HW | BrCl kinetics |
| 245 | 0.16–2.83 | 1.30 | HW | BrCl kinetics |
| 265 | 0.27–2.68 | 1.28 | HW | BrCl kinetics |
| 280 | 0.27–3.26 | 1.31 | HW | Br kinetics |
| 297 | 0.16–2.95 | 1.30 | HW | BrCl kinetics |
| 300 | 0.24–3.00 | 1.27 | Q | Br kinetics |
| 320 | 0.17–3.23 | 1.28 | HW | Br kinetics |
| 340 | 0.19–3.39 | 1.30 | Q | Br kinetics |
| 360 | 0.10–4.08 | 1.28 | Q | Br kinetics |
| 390 | 0.30–2.67 | 1.39 | Q | Br kinetics |
| 420 | 0.14–3.69 | 1.38 | Q | Br kinetics |
| 460 | 0.22–2.44 | 1.47 | Q | Br kinetics |
| 500 | 0.34–6.32 | 1.50 | Q | Br kinetics |
| 560 | 0.14–2.62 | 1.58 | Q | Br kinetics |
| 630 | 0.14–2.01 | 1.73 | Q | Br kinetics |
| 660 | 0.16–1.24 | 1.76 | Q | BrCl kinetics |
| 710 | 0.11–1.87 | 1.91 | Q | Br kinetics |
| 780 | 0.09–1.41 | 2.12 | Q | Br kinetics |
| 860 | 0.10–1.35 | 2.29 | Q | Br kinetics |
| 960 | 0.10–1.44 | 2.52 | Q | Br kinetics |
Disclaimer/Publisher’s Note: The statements, opinions and data contained in all publications are solely those of the individual author(s) and contributor(s) and not of MDPI and/or the editor(s). MDPI and/or the editor(s) disclaim responsibility for any injury to people or property resulting from any ideas, methods, instructions or products referred to in the content. |
© 2025 by the author. Licensee MDPI, Basel, Switzerland. This article is an open access article distributed under the terms and conditions of the Creative Commons Attribution (CC BY) license (https://creativecommons.org/licenses/by/4.0/).
Share and Cite
Bedjanian, Y. Experimental Study of the Reactions of Br Atoms with Thiirane and Nitrosyl Chloride. Molecules 2025, 30, 2058. https://doi.org/10.3390/molecules30092058
Bedjanian Y. Experimental Study of the Reactions of Br Atoms with Thiirane and Nitrosyl Chloride. Molecules. 2025; 30(9):2058. https://doi.org/10.3390/molecules30092058
Chicago/Turabian StyleBedjanian, Yuri. 2025. "Experimental Study of the Reactions of Br Atoms with Thiirane and Nitrosyl Chloride" Molecules 30, no. 9: 2058. https://doi.org/10.3390/molecules30092058
APA StyleBedjanian, Y. (2025). Experimental Study of the Reactions of Br Atoms with Thiirane and Nitrosyl Chloride. Molecules, 30(9), 2058. https://doi.org/10.3390/molecules30092058