

Bimodal Poly(lactic-co-glycolic acid) Nanocarrier with Zinc Oxide and Iron Oxide for Fluorescence and Magnetic Resonance Imaging

 , , , ,
Abstract

1. Introduction
2. Results and Discussion
2.1. Stability Assessment of the PLGA System: Hydrodynamic Diameter Distribution Analysis
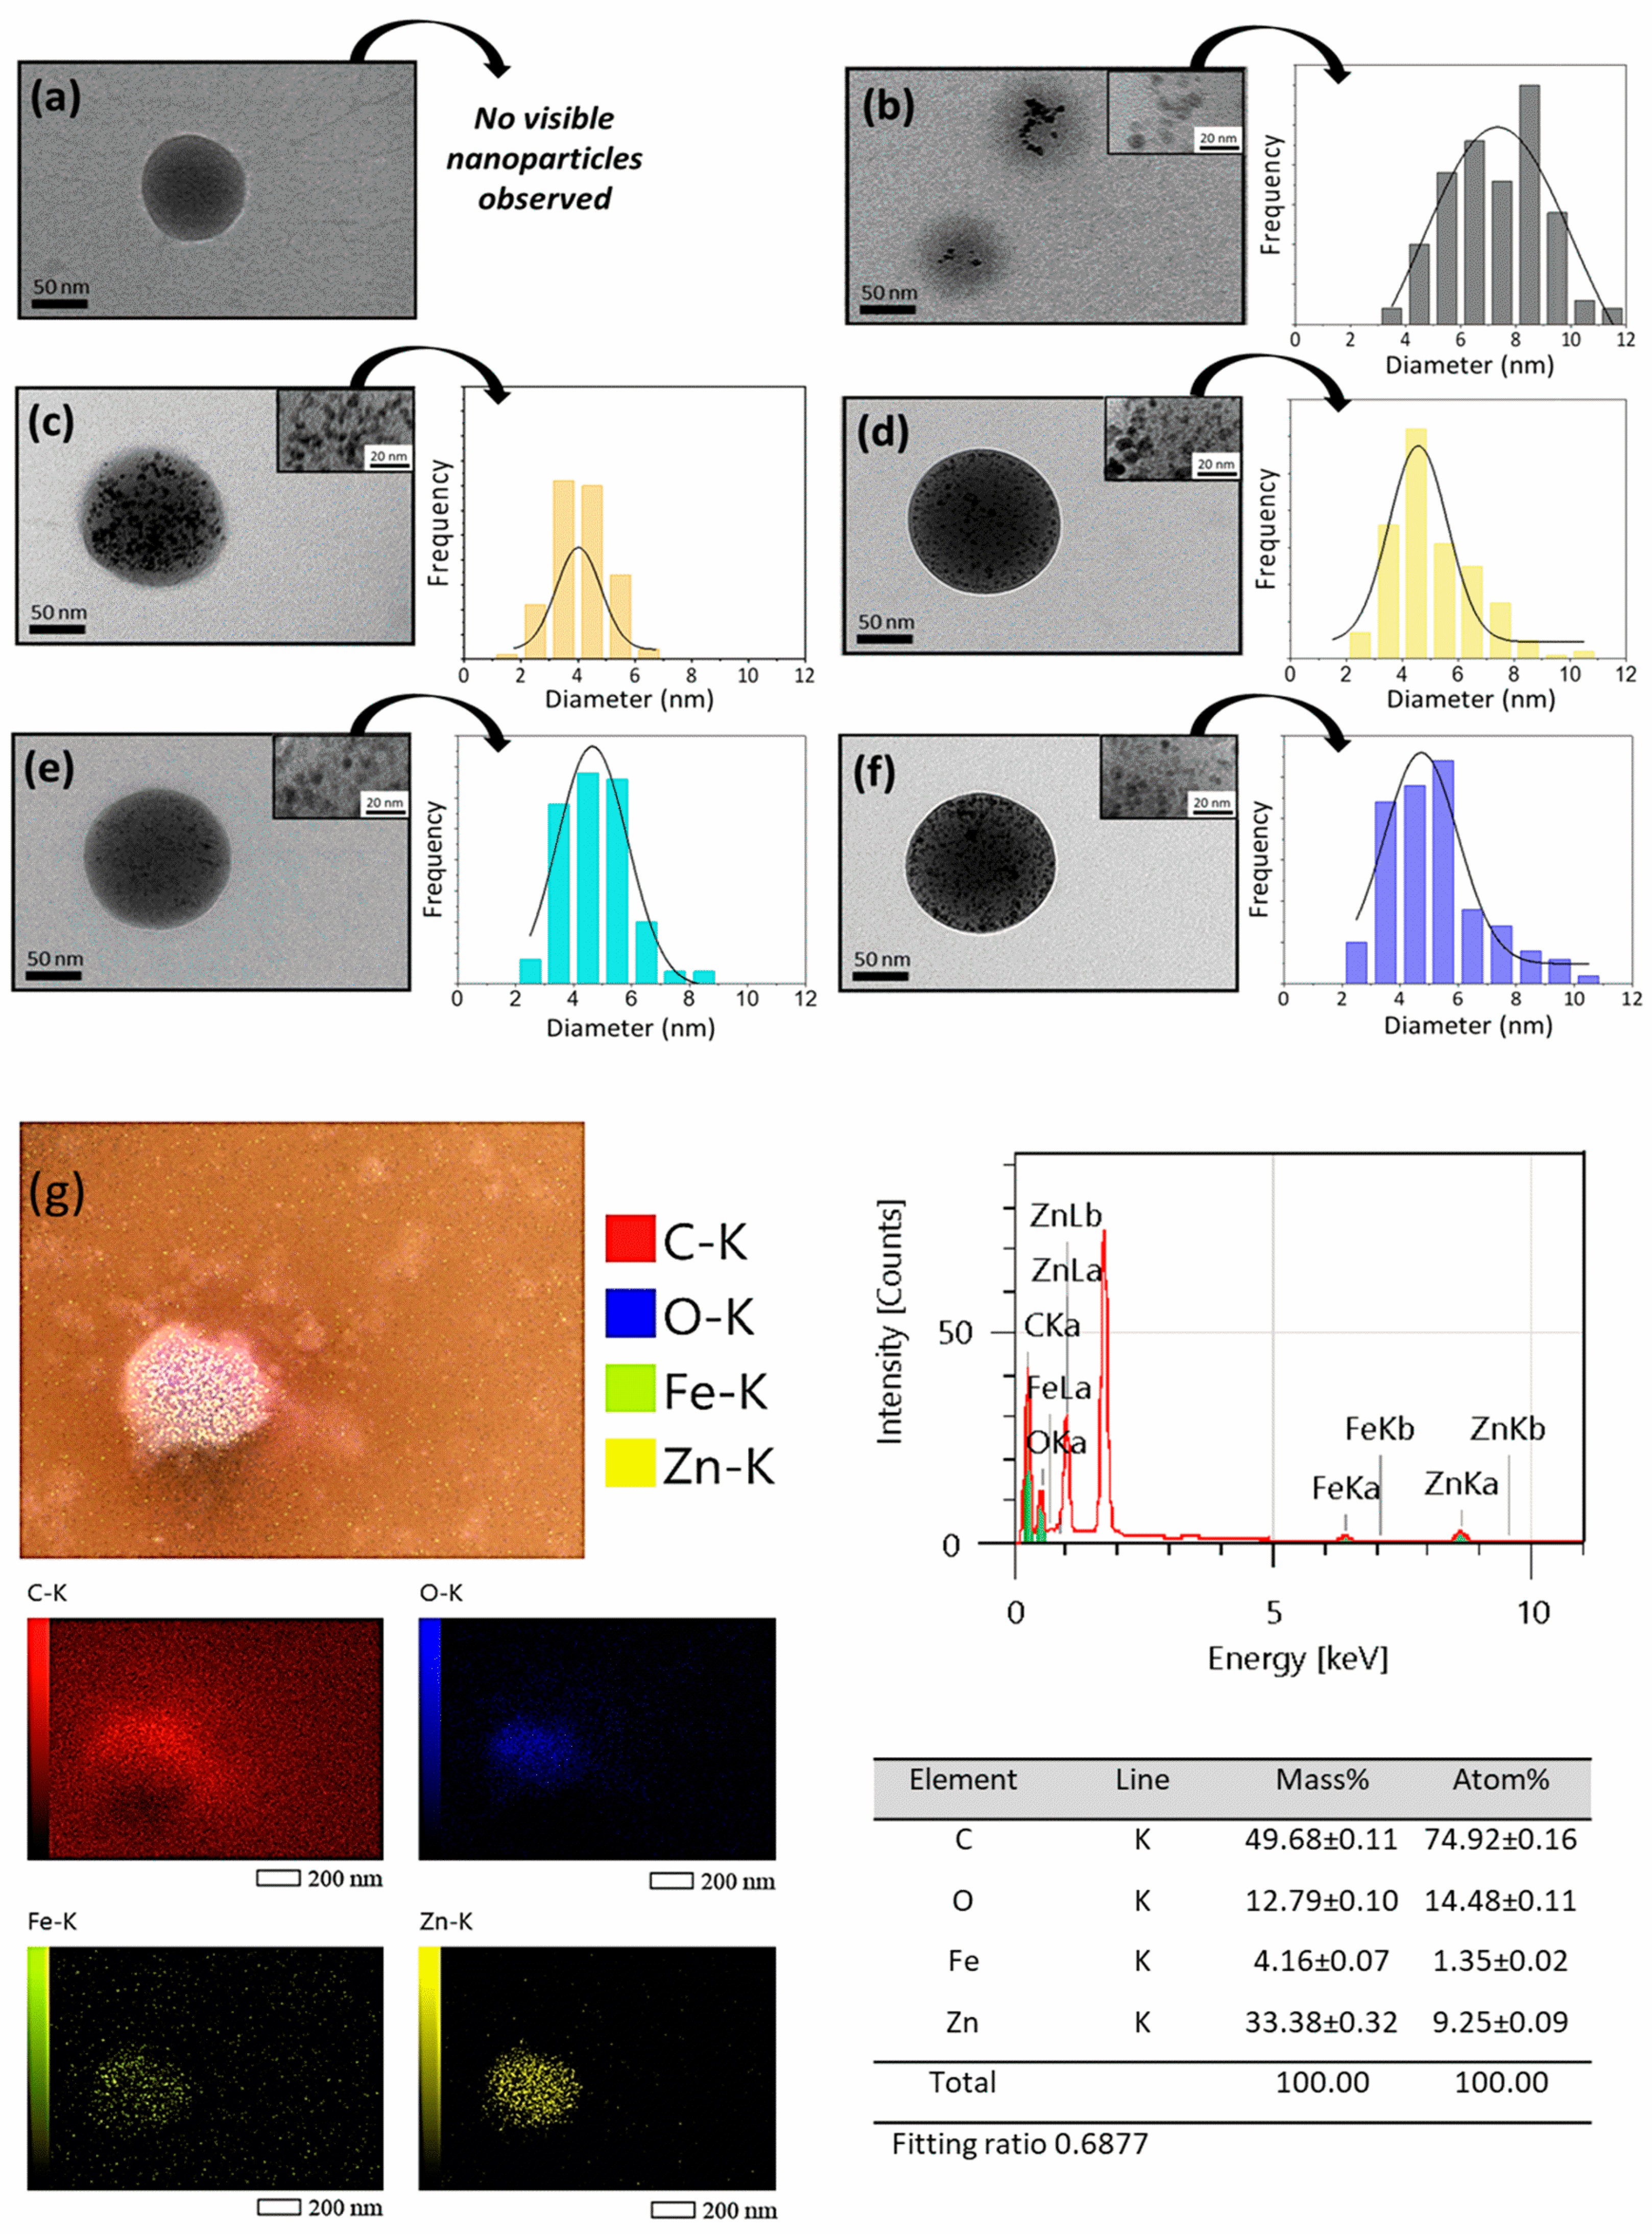
2.2. Characterization of the PLGA System: Transmission Electron Microscopy (TEM) and Scanning Electron Microscopy (SEM) Analysis
2.3. PLGA Particles Incorporating Zinc Oxide and Iron Oxide Nanoparticles: Analysis of Luminescent Properties
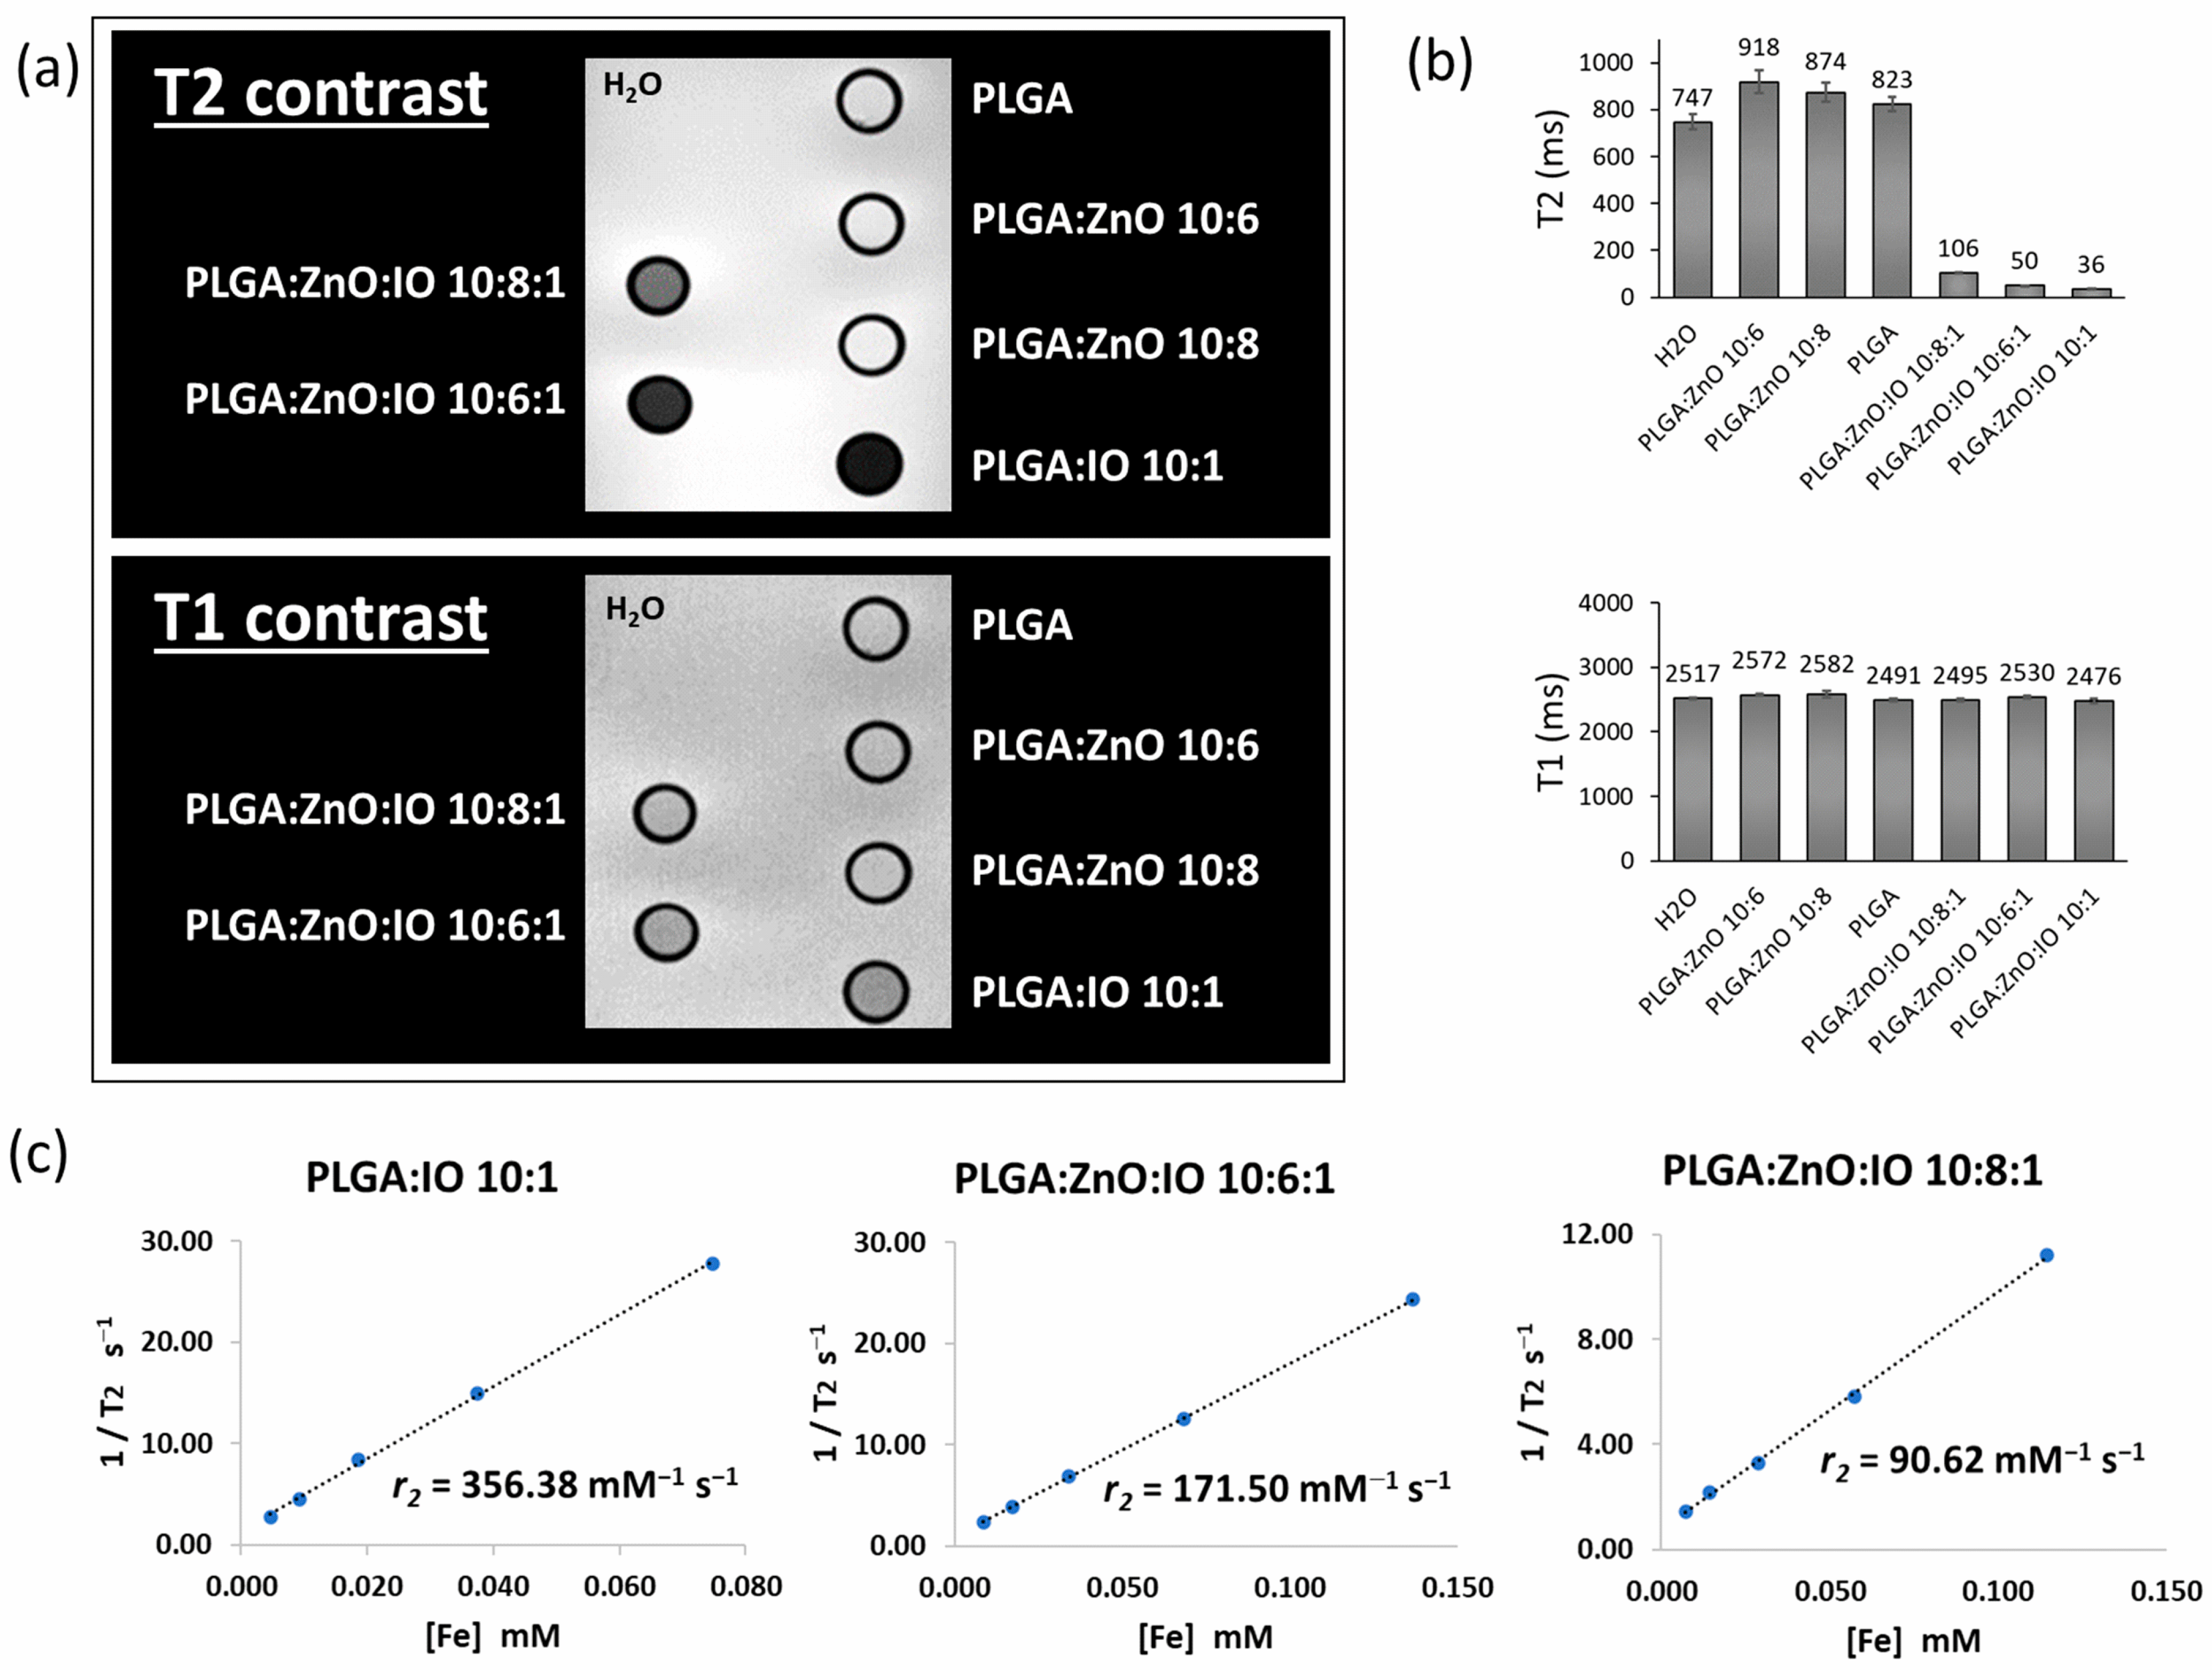
2.4. PLGA Particles Incorporating Zinc Oxide and Iron Oxide: Analysis of Magnetic Resonance Imaging Properties
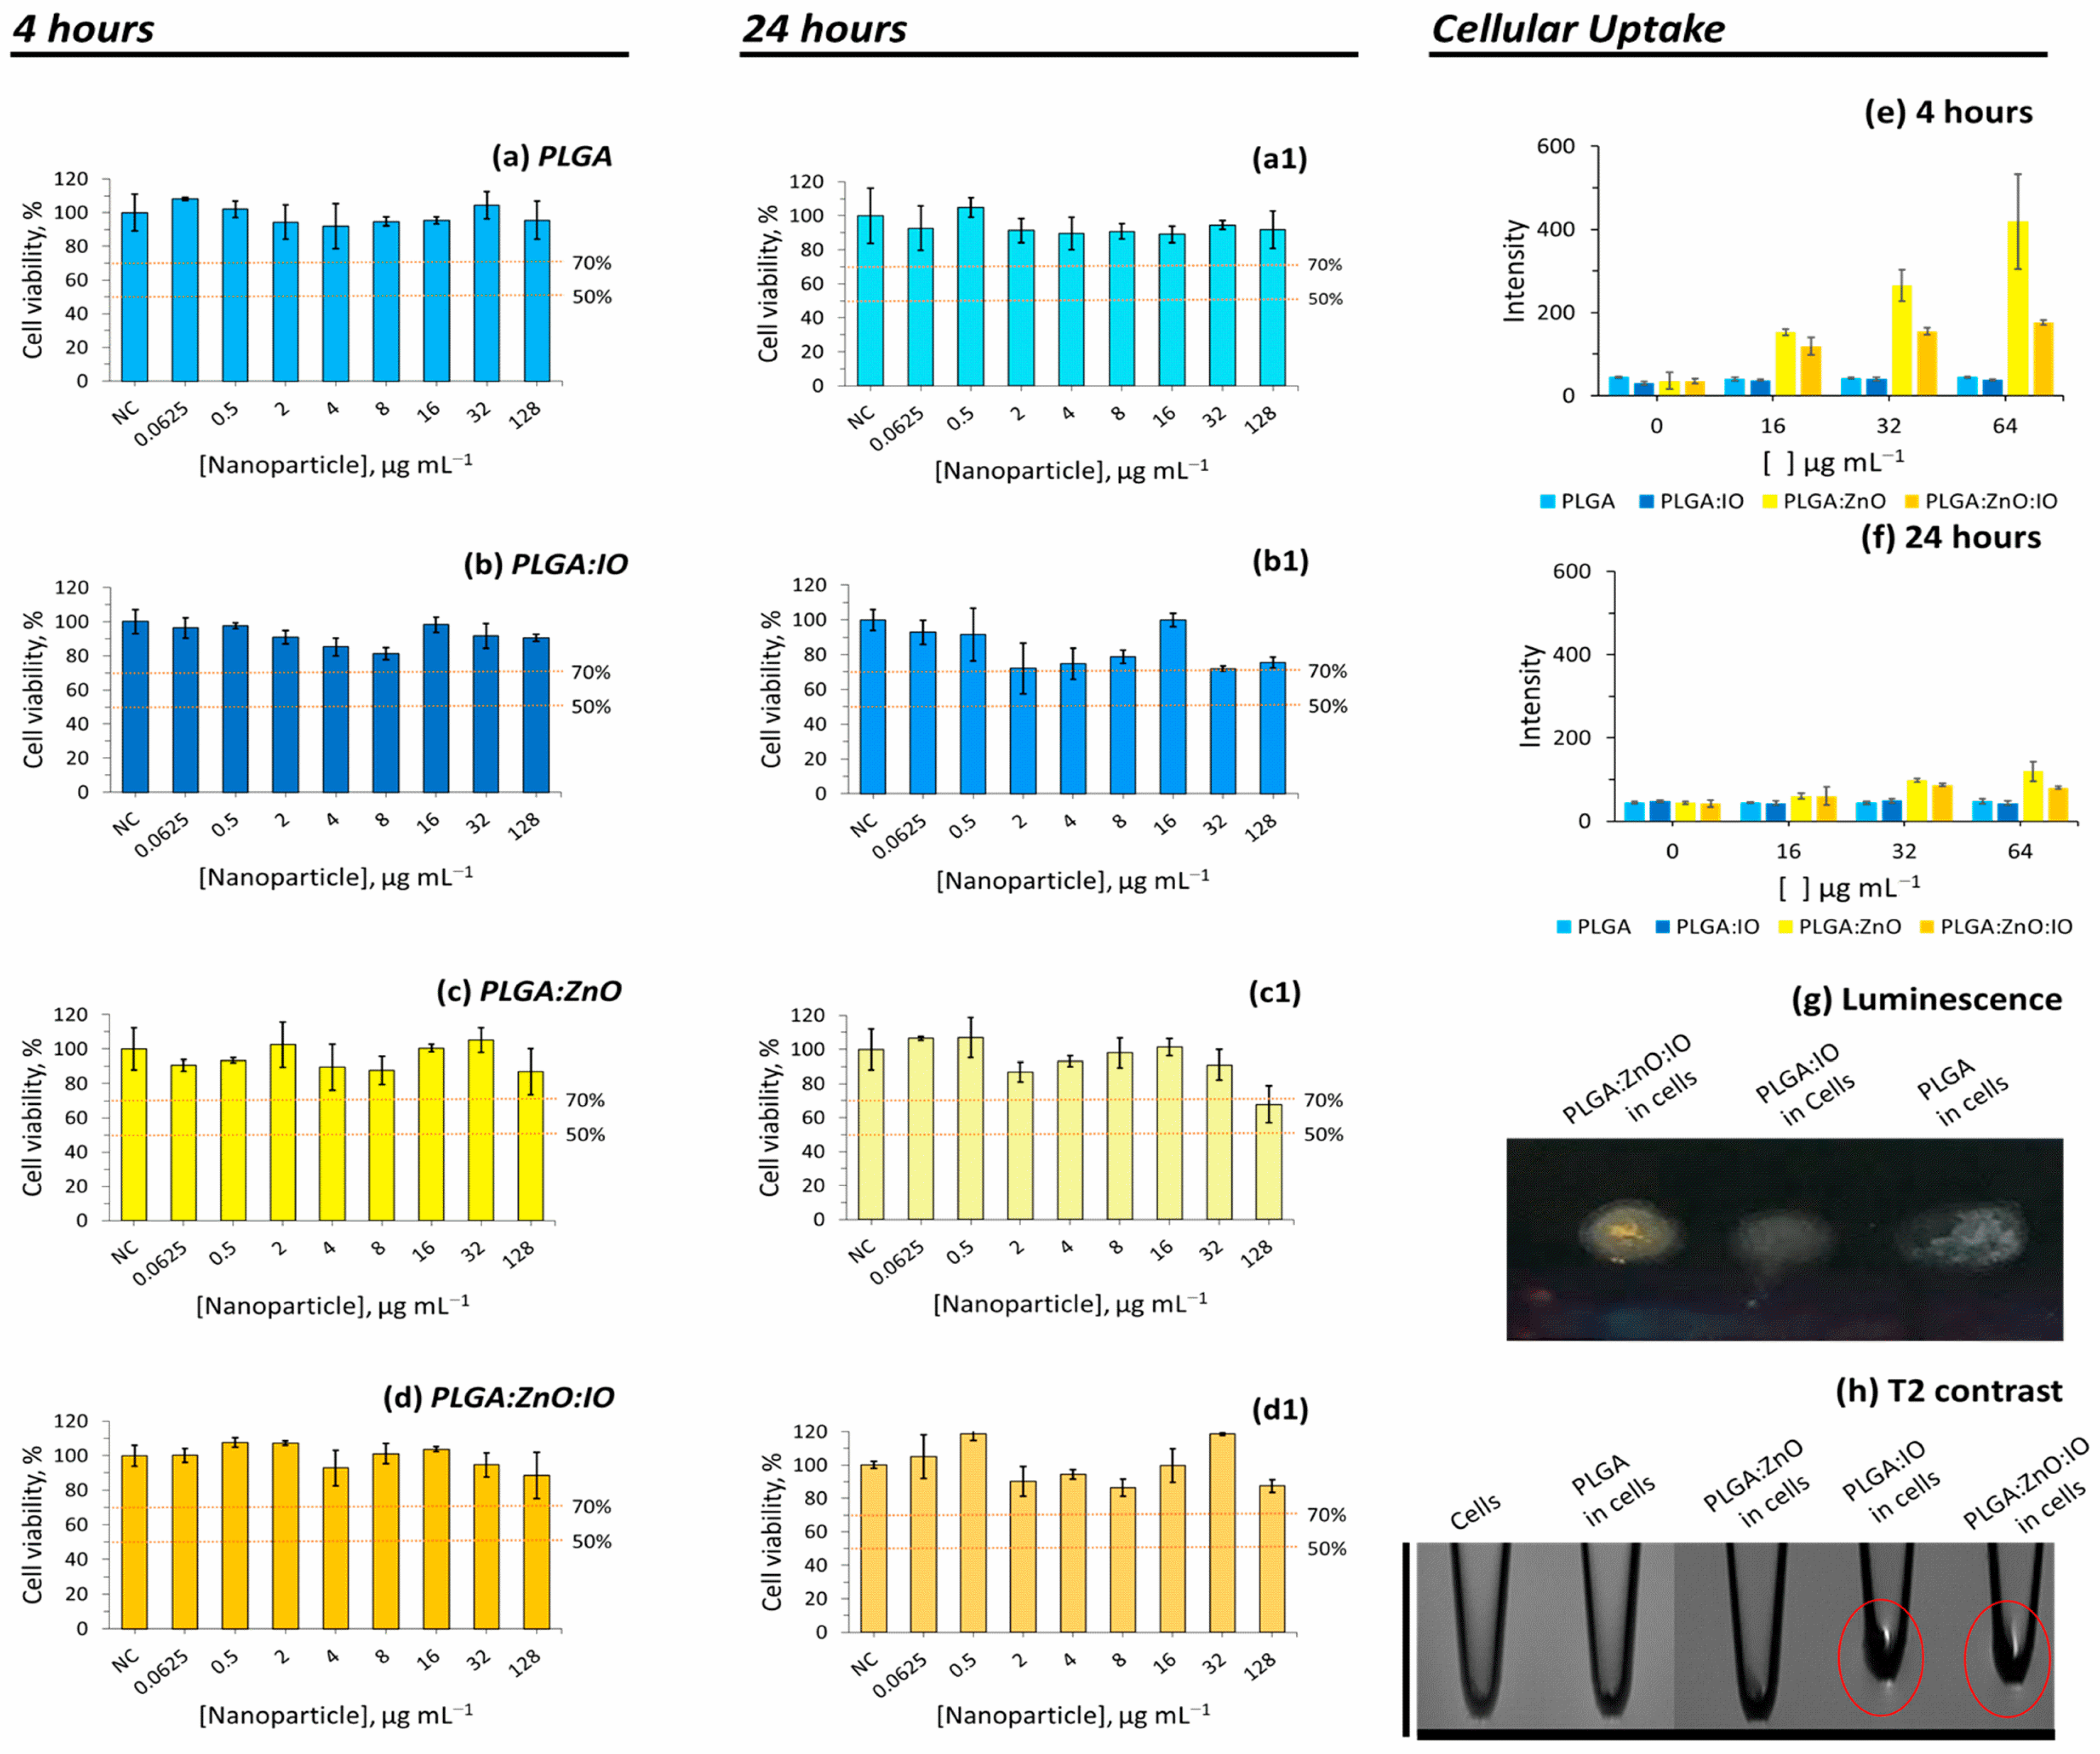
2.5. PLGA Particles Incorporating Zinc Oxide and Iron Oxide: Analysis of Cytotoxicity and Cellular Labelling
3. Materials and Methods
3.1. Materials
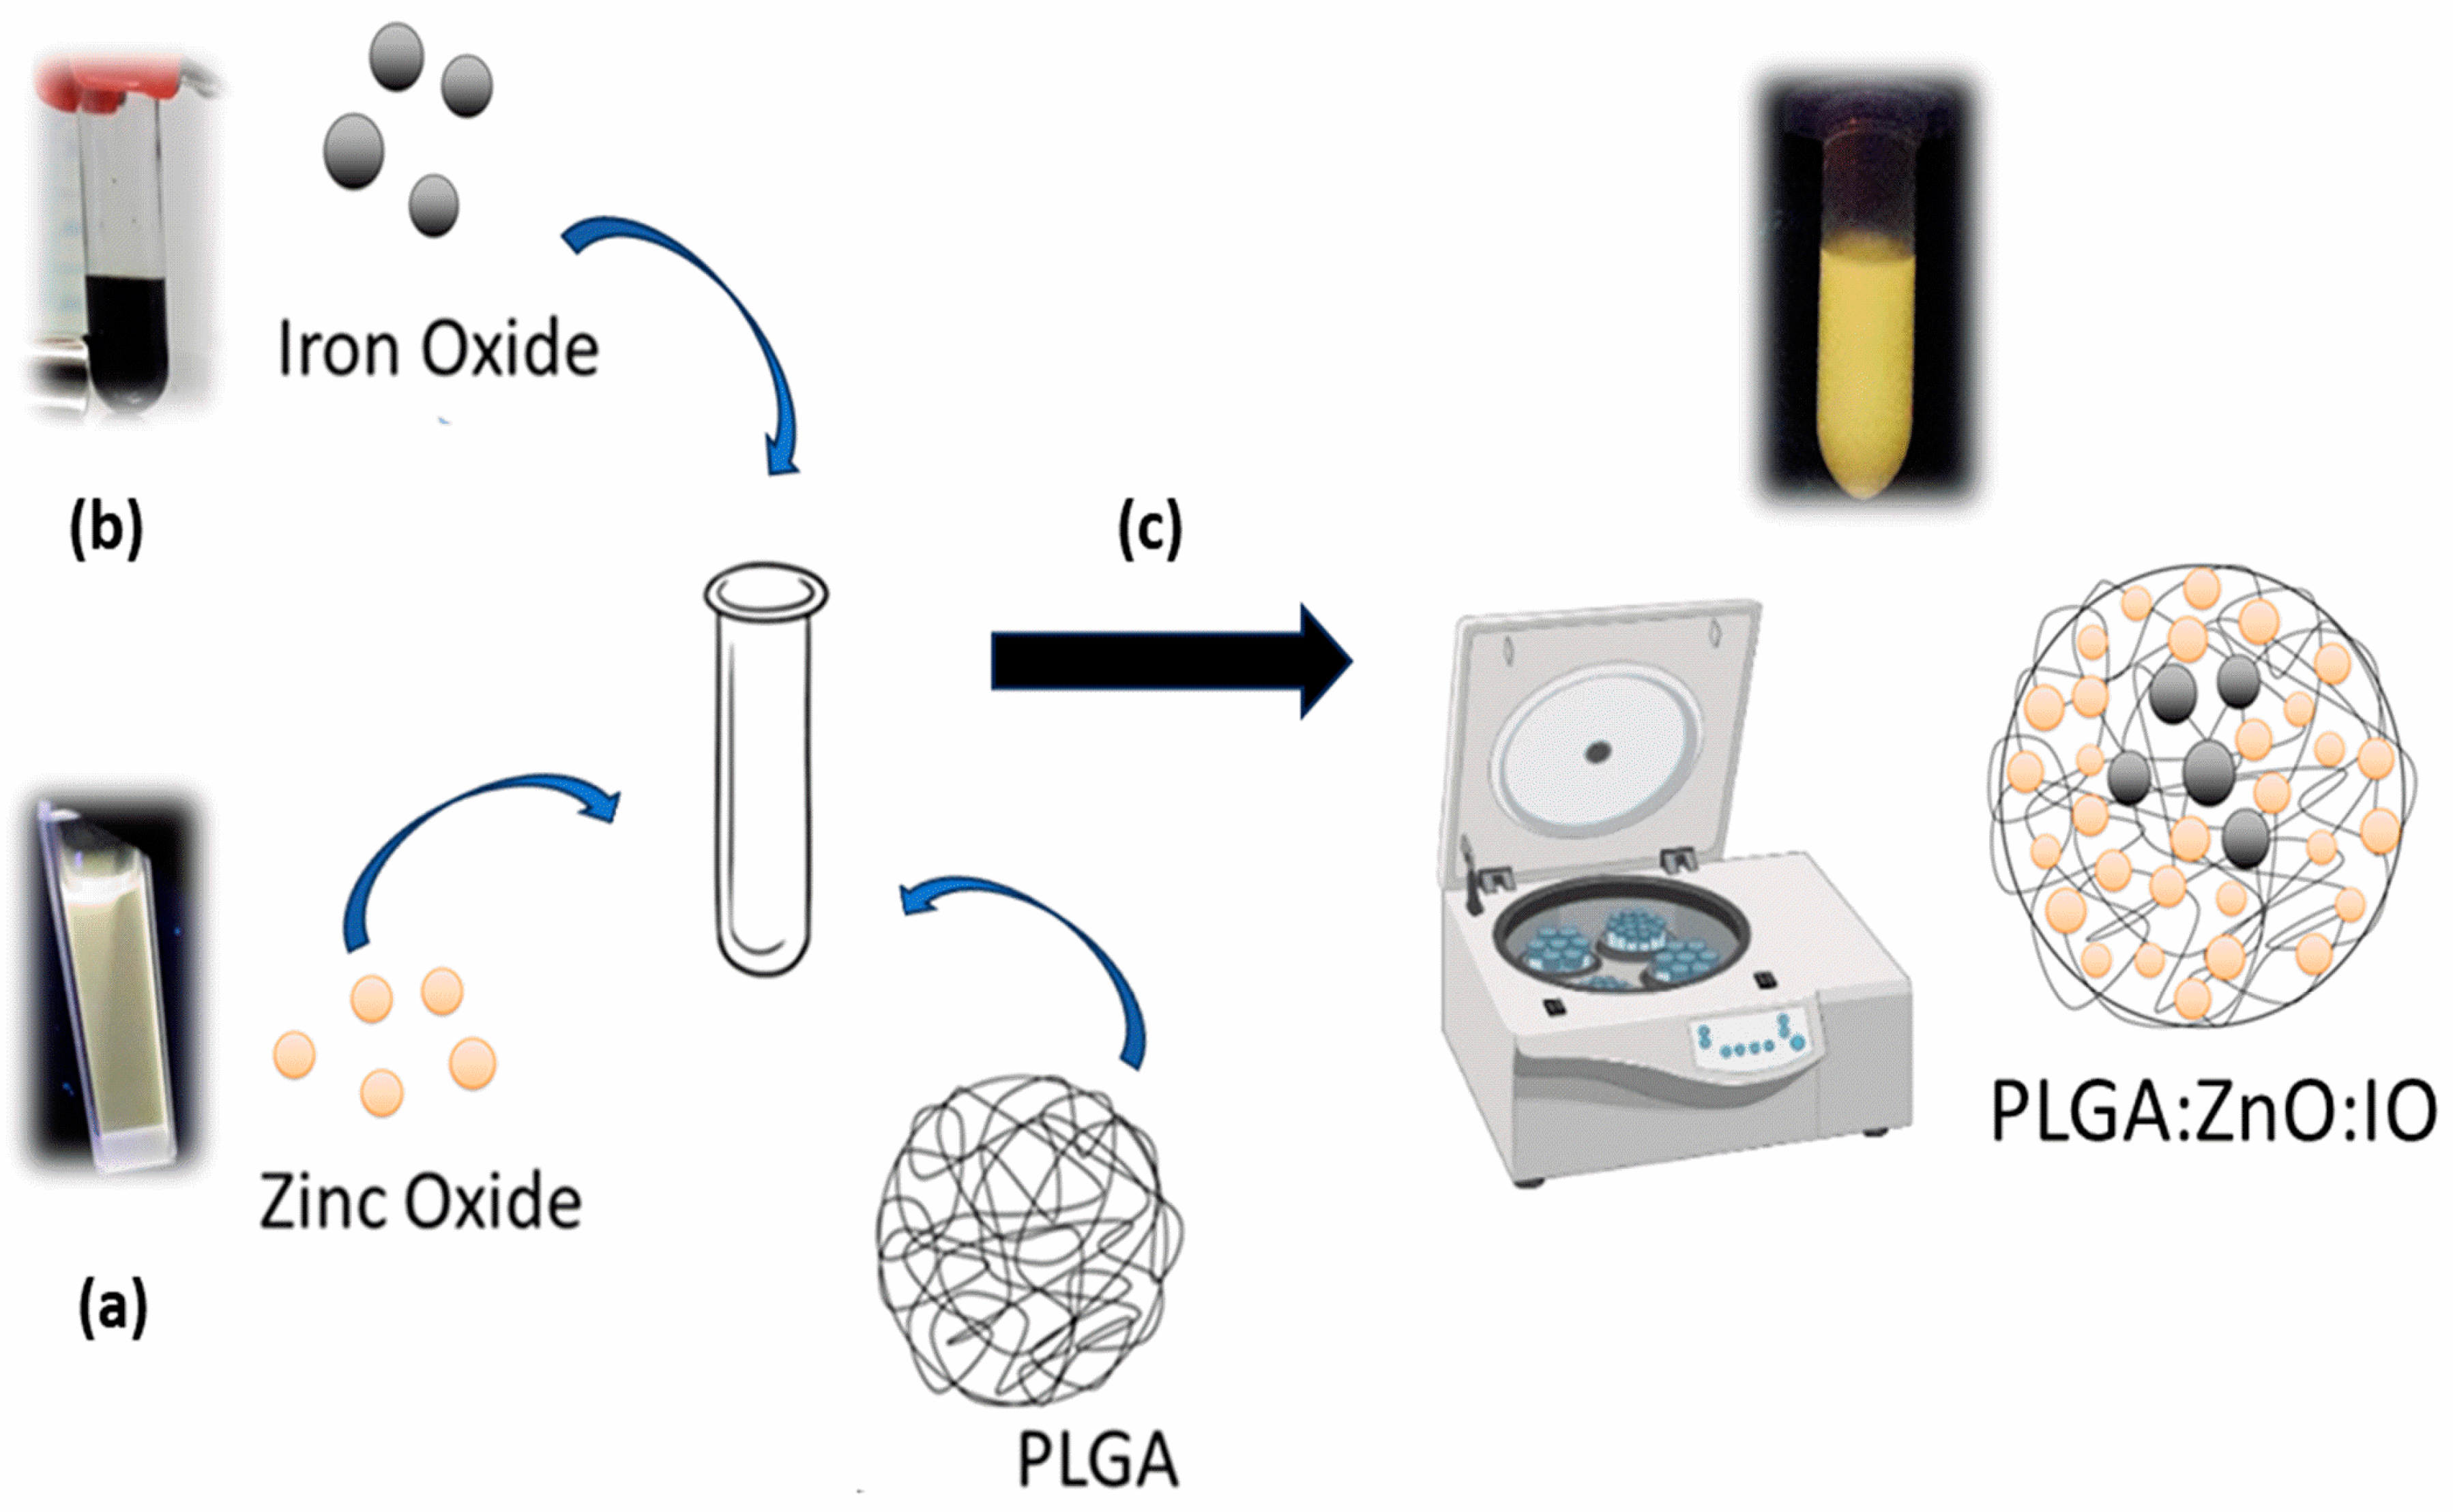
3.2. Synthesis
3.2.1. Zinc Oxide NPs
3.2.2. Superparamagnetic Iron Oxide NPs (SPIONs)
3.2.3. PLGA Particles
3.3. Characterization
3.3.1. Evaluation of Luminescent Properties
3.3.2. Transmission Electron Microscopy
3.3.3. Scanning Electron Microscopy and Energy-Dispersive X-Ray Spectroscopy (EDS)
3.3.4. Inductively Coupled Plasma Mass Spectrometry (ICP-MS)
3.3.5. Evaluation of Particle Diameter Distribution and Zeta Potential
3.3.6. Magnetic Resonance Imaging
3.4. Biological Analysis
3.4.1. Cytotoxicity Assay Using Resazurin Test
3.4.2. Cellular Uptake
4. Conclusions
Supplementary Materials
Author Contributions
Funding
Institutional Review Board Statement
Informed Consent Statement
Data Availability Statement
Acknowledgments
Conflicts of Interest
Abbreviations
| DCM | Dichloromethane |
| EDS | Energy-Dispersive Spectroscopy |
| IO | Iron Oxide |
| MRI | Magnetic Resonance Imaging |
| NC | Negative Control |
| NP | Nanoparticle |
| PDI | Polydispersity Index |
| PLGA | Poly(lactic-co-glycolic acid) |
| PVA | Polyvinyl Alcohol |
| RT | Room Temperature |
| SEM | Scanning Electronic Microscopy |
| SPION | Superparamagnetic Iron Oxide Nanoparticles |
| T80 | Tween 80 |
| TEM | Transmission Electronic Microscopy |
| TE | Echo Time |
| THP-1 | (Human monocytic cell line) |
| TR | Repetition Time |
| ZnO | Zinc Oxide |
References
- Yang, D.; Wei, X.; Piao, Z.; Cui, Z.; He, H.; Wen, Z.; Zhang, W.; Wang, L.; Mei, S.; Guo, R. Constructing Bimodal Nanoprobe Based on Gd:AgInS2/ZnS Quantum Dots for Fluorometric/Magnetic Resonance Imaging in Mesenchymal Stem Cells. J. Mater. Sci. Technol. 2023, 148, 116–122. [Google Scholar] [CrossRef]
- Molaei, M.J. Turmeric-Derived Gadolinium-Doped Carbon Quantum Dots for Multifunctional Fluorescence Imaging and MRI Contrast Agent. J. Lumin. 2023, 257, 119692. [Google Scholar] [CrossRef]
- Huang, X.; Wang, Z.; Li, S.; Lin, S.; Zhang, L.; Meng, Z.; Zhang, X.; Sun, S.K. Non-Invasive Diagnosis of Acute Kidney Injury Using Mn-Doped Carbon Dots-Based Magnetic Resonance Imaging. Biomater. Sci. 2023, 11, 4289–4297. [Google Scholar] [CrossRef]
- Jin, L.; Bai, W.; Yu, S.; Zhang, J. One-Pot Preparation of Mn3O4/GSH/CdTe Quantum Dots Complex for T1-Weighted MRI/Fluorescence Detection of H3PO4. Talanta 2023, 263, 124713. [Google Scholar] [CrossRef]
- Xu, Y.Q.; Zang, L.Y.; Gao, H.Y.; Peng, J.; Zheng, D.Y.; Liu, C.; Liu, X.J.; Cheng, D.B.; Zhu, C.N. Cu-In-S/ZnS:Gd3+ Quantum Dots with Isolated Fluorescent and Paramagnetic Modules for Dual-Modality Imaging in Vivo. Colloids Surf. B Biointerfaces 2023, 223, 113158. [Google Scholar] [CrossRef]
- Ren, C.; Hu, D.; Cui, Y.; Chen, P.; Xu, X.; Cheng, J.; He, T. Ag-Doped InP/ZnS Quantum Dots for Type-I Photosensitizers. Chem. Commun. 2023, 59, 2311–2314. [Google Scholar] [CrossRef]
- Liu, F.; Lin, J.; Luo, Y.; Xie, D.; Bian, J.; Liu, X.; Yue, J. Sialic Acid-Targeting Multi-Functionalized Silicon Quantum Dots for Synergistic Photodynamic and Photothermal Cancer Therapy. Biomater. Sci. 2023, 11, 4009–4021. [Google Scholar] [CrossRef] [PubMed]
- Bao, Y.; Wu, X.; Bo, B.; Qin, J.; Zhang, Y.; Wu, X.; Li, X.; Wang, Y.; Peng, H. Synthesis of NIR-II Fluorescent Hybrid Ag2S/ZnPc Nanoparticles for in Vitro Photodynamic Therapy. ChemNanoMat 2023, 9, e202200570. [Google Scholar] [CrossRef]
- Singh, B.; Singh, S.; Gautam, A.; Sutherland, A.; Pal, K. Preparation and Characterization of PLA Microspheres as Drug Delivery System for Controlled Release of Cetirizine with Carbon Dots as Drug Carrier. Polym. Bull. 2023, 80, 5741–5757. [Google Scholar] [CrossRef]
- Kurniawan, D.; Mathew, J.; Rahardja, M.R.; Pham, H.P.; Wong, P.C.; Rao, N.V.; Ostrikov, K.; Chiang, W.H. Plasma-Enabled Graphene Quantum Dot Hydrogels as Smart Anticancer Drug Nanocarriers. Small 2023, 19, 2206813. [Google Scholar] [CrossRef]
- Mohammed-Ahmed, H.K.; Nakipoglu, M.; Tezcaner, A.; Keskin, D.; Evis, Z. Functionalization of Graphene Oxide Quantum Dots for Anticancer Drug Delivery. J. Drug Deliv. Sci. Technol. 2023, 80, 104199. [Google Scholar] [CrossRef]
- Lv, Y.; Wang, P.; Li, J.; Li, N.; Xu, D.; Wu, R.; Shen, H.; Li, L.S. Establishment of a Ca(II) Ion-Quantum Dots Fluorescence Signal Amplification Sensor for High-Sensitivity Biomarker Detection. Anal. Chim. Acta 2023, 1237, 340534. [Google Scholar] [CrossRef] [PubMed]
- Magdy, G.; Elmansi, H.; Belal, F.; El-Deen, A.K. Doped Carbon Dots as Promising Fluorescent Nanosensors: Synthesis, Characterization, and Recent Applications. Curr. Pharm. Des. 2022, 29, 415–444. [Google Scholar] [CrossRef] [PubMed]
- Hardman, R. A Toxicologic Review of Quantum Dots: Toxicity Depends on Physicochemical and Environmental Factors. Environ. Health Perspect. 2006, 114, 165–172. [Google Scholar] [CrossRef]
- Winnik, F.M.; Maysinger, D. Quantum Dot Cytotoxicity and Ways to Reduce It. Acc. Chem. Res. 2013, 46, 672–680. [Google Scholar] [CrossRef]
- Hoshino, A.; Hanada, S.; Yamamoto, K. Toxicity of Nanocrystal Quantum Dots: The Relevance of Surface Modifications. Arch. Toxicol. 2011, 85, 707–720. [Google Scholar] [CrossRef]
- Ortiz-Casas, B.; Galdámez-Martínez, A.; Gutiérrez-Flores, J.; Baca Ibañez, A.; Kumar Panda, P.; Santana, G.; de la Vega, H.A.; Suar, M.; Gutiérrez Rodelo, C.; Kaushik, A.; et al. Bio-Acceptable 0D and 1D ZnO Nanostructures for Cancer Diagnostics and Treatment. Mater. Today 2021, 50, 533–569. [Google Scholar] [CrossRef]
- Norek, M. Approaches to Enhance UV Light Emission in ZnO Nanomaterials. Curr. Appl. Phys. 2019, 19, 867–883. [Google Scholar] [CrossRef]
- Xu, X.; Chen, Y.; Zhang, G.; Bian, H.; Zhao, M.; Ma, S. Optical Properties and the Band-Gap Variation in Diverse Zn1-XSnxO Nanostructures. Superlattices Microstruct. 2018, 123, 349–357. [Google Scholar] [CrossRef]
- Ibraheem, S.; Kadhim, A.A.; Kadhim, K.A.; Kadhim, I.A.; Jabir, M. Zinc Oxide Nanoparticles as Diagnostic Tool for Cancer Cells. Int. J. Biomater. 2022, 2022, 2807644. [Google Scholar] [CrossRef]
- Wanas, W.; Abd El-Kaream, S.A.; Ebrahim, S.; Soliman, M.; Karim, M. Cancer Bioimaging Using Dual Mode Luminescence of Graphene/FA-ZnO Nanocomposite Based on Novel Green Technique. Sci. Rep. 2023, 13, 27. [Google Scholar] [CrossRef] [PubMed]
- Rahman, M. Magnetic Resonance Imaging and Iron-Oxide Nanoparticles in the Era of Personalized Medicine. Nanotheranostics 2023, 7, 424–449. [Google Scholar] [CrossRef]
- Liu, M.; Ye, Y.; Ye, J.; Gao, T.; Wang, D.; Chen, G.; Song, Z. Recent Advances of Magnetite (Fe3O4)-Based Magnetic Materials in Catalytic Applications. Magnetochemistry 2023, 9, 110. [Google Scholar] [CrossRef]
- Egorova, K.S.; Ananikov, V.P. Toxicity of Metal Compounds: Knowledge and Myths. Organometallics 2017, 36, 4071–4090. [Google Scholar] [CrossRef]
- Edis, Z.; Wang, J.; Waqas, M.K.; Ijaz, M.; Ijaz, M. Nanocarriers-Mediated Drug Delivery Systems for Anticancer Agents: An Overview and Perspectives. Int. J. Nanomed. 2021, 16, 1313–1330. [Google Scholar] [CrossRef] [PubMed]
- Fernández-Barahona, I.; Muñoz-Hernando, M.; Ruiz-Cabello, J.; Herranz, F.; Pellico, J. Iron Oxide Nanoparticles: An Alternative for Positive Contrast in Magnetic Resonance Imaging. Inorganics 2020, 8, 28. [Google Scholar] [CrossRef]
- Calsolaro, F.; Garello, F.; Cavallari, E.; Magnacca, G.; Trukhan, M.V.; Valsania, M.C.; Cravotto, G.; Terreno, E.; Martina, K. Amphoteric β-Cyclodextrin Coated Iron Oxide Magnetic Nanoparticles: New Insights into Synthesis and Application in MRI. Nanoscale Adv. 2025, 7, 155–168. [Google Scholar] [CrossRef]
- Lu, K.; Zhang, R.; Wang, H.; Li, C.; Yang, Z.; Xu, K.; Cao, X.; Wang, N.; Cai, W.; Zeng, J.; et al. PEGylated Ultrasmall Iron Oxide Nanoparticles as MRI Contrast Agents for Vascular Imaging and Real-Time Monitoring. ACS Nano 2025, 19, 3519–3530. [Google Scholar] [CrossRef]
- Sreenan, B.; Kafil, V.; Hunt, T.; Shin, S.H.R.; Brennan, A.A.; Thallapally, P.K.; Tal-Gan, Y.; Zhu, X. Luminescent ZnO-Carbon Hybrid Nanomaterials: Synthesis, Characterization, Emission Mechanism, and Applications. ACS Appl. Opt. Mater. 2025, 3, 698–711. [Google Scholar] [CrossRef]
- Babayevska, N.; Kustrzyńska, K.; Przysiecka, Ł.; Jarek, M.; Jancelewicz, M.; Iatsunskyi, I.; Dydak, K.; Skupin-Mrugalska, P.; Janiszewska, E. Doxorubicin and ZnO-Loaded Gadolinium Oxide Hollow Spheres for Targeted Cancer Therapy and Bioimaging. Spectrochim. Acta Part A Mol. Biomol. Spectrosc. 2025, 333, 125903. [Google Scholar] [CrossRef]
- Mehto, A.; Shukla, P. Bioimaging Potential: Comparative Study of ZnO Nanoparticles Synthesized via Green and Chemical Routes. Next Nanotechnol. 2025, 7, 100118. [Google Scholar] [CrossRef]
- Verma, A.K.; Lakshmi, G.B.V.S.; Dhiman, T.K.; Hashmi, S.Z.H.; Kumar, A.; Solanki, P.R. Optical Tuning of Polymer Functionalized Zinc Oxide Quantum Dots as a Selective Probe for the Detection of Antibiotics. Sci. Rep. 2025, 15, 1648. [Google Scholar] [CrossRef]
- Gupta, J.; Hassan, P.A.; Barick, K.C. Core-Shell Fe3O4@ZnO Nanoparticles for Magnetic Hyperthermia and Bio-Imaging Applications. AIP Adv. 2021, 11, 25207. [Google Scholar] [CrossRef]
- Lai, L.; Jiang, X.; Han, S.; Zhao, C.; Du, T.; Rehman, F.U.; Zheng, Y.; Li, X.; Liu, X.; Jiang, H.; et al. In Vivo Biosynthesized Zinc and Iron Oxide Nanoclusters for High Spatiotemporal Dual-Modality Bioimaging of Alzheimer’s Disease. Langmuir 2017, 33, 9018–9024. [Google Scholar] [CrossRef]
- Rocha, C.V.; Gonçalves, V.; da Silva, M.C.; Bañobre-López, M.; Gallo, J. PLGA-Based Composites for Various Biomedical Applications. Int. J. Mol. Sci. 2022, 23, 2034. [Google Scholar] [CrossRef]
- Burmistrov, D.; Serov, D.; Grigorieva, D.; Simakin, A. Physicochemical, Antibacterial, and Cytotoxic Properties of Composite Materials Based on Biodegradable Poly (Lactic-Co-Glycolic Acid) Functionalized with ZnO Nanoparticles. BIO Web Conf. 2023, 57, 02005. [Google Scholar] [CrossRef]
- Ostovar, S.; Pourmadadi, M.; Zaker, M.A. Co-Biopolymer of Chitosan/Carboxymethyl Cellulose Hydrogel Improved by Zinc Oxide and Graphene Quantum Dots Nanoparticles as PH-Sensitive Nanocomposite for Quercetin Delivery to Brain Cancer Treatment. Int. J. Biol. Macromol. 2023, 253, 127091. [Google Scholar] [CrossRef]
- Li, S.; Yin, J.; Xu, L. Batch Fabrication and Characterization of ZnO/PLGA/PCL Nanofiber Membranes for Antibacterial Materials. Fibers Polym. 2022, 23, 1225–1234. [Google Scholar] [CrossRef]
- Stanković, A.; Sezen, M.; Milenković, M.; Kaišarević, S.; Andrić, N.; Stevanović, M. PLGA/Nano-ZnO Composite Particles for Use in Biomedical Applications: Preparation, Characterization, and Antimicrobial Activity. J. Nanomater. 2016, 2016, 9425289. [Google Scholar] [CrossRef]
- Mozaffari, A.; Mirzapour, S.M.; Rad, M.S.; Ranjbaran, M. Cytotoxicity of PLGA-Zinc Oxide Nanocomposite on Human Gingival Fibroblasts. J. Adv. Periodontol. Implant. Dent. 2023, 15, 27–33. [Google Scholar] [CrossRef]
- Ayyanaar, S.; Kesavan, M.P. Magnetic Iron Oxide Nanoparticles@lecithin/Poly (l-Lactic Acid) Microspheres for Targeted Drug Release in Cancer Therapy. Int. J. Biol. Macromol. 2023, 253, 127480. [Google Scholar] [CrossRef] [PubMed]
- Senturk, F.; Cakmak, S. Fabrication of Curcumin-Loaded Magnetic PEGylated-PLGA Nanocarriers Tagged with GRGDS Peptide for Improving Anticancer Activity. MethodsX 2023, 10, 102229. [Google Scholar] [CrossRef] [PubMed]
- Pereira, E.D.; de Souza Junior, F.G.; Pinto, J.C.; Filho, S.T.; Pal, K.; dos Santos Pyrrho, A.; da Costa, R.C.; da Cunha, B.P.; da Silveira Maranhão, F.; de Almeida, T.M. Evaluation of Hyperthermic Potential and Acute Toxicity of PLGA-PEG/Magnetite Microspheres Loaded with Oxaliplatin Using Mice as a Test System. Macromol. React. Eng. 2023, 17, 2300005. [Google Scholar] [CrossRef]
- Gupta, A.; Niveria, K.; Chandpa, H.H.; Singh, M.; Kumar, V.; Meena, J. Stimuli Responsive Magnetic-Silica-Poly Lactic-Co-Glycolic Acid Hybrid Nanoparticles for Targeted Cancer Chemo-Immunotherapy. Drug Deliv. Transl. Res. 2024, 14, 2712–2726. [Google Scholar] [CrossRef]
- Luque-Michel, E.; Lemaire, L.; Blanco-Prieto, M.J. SPION and Doxorubicin-Loaded Polymeric Nanocarriers for Glioblastoma Theranostics. Drug Deliv. Transl. Res. 2021, 11, 515–523. [Google Scholar] [CrossRef]
- Luque-Michel, E.; Sebastian, V.; Larrea, A.; Marquina, C.; Blanco-Prieto, M.J. Co-Encapsulation of Superparamagnetic Nanoparticles and Doxorubicin in PLGA Nanocarriers: Development, Characterization and in Vitro Antitumor Efficacy in Glioma Cells. Eur. J. Pharm. Biopharm. 2019, 145, 65–75. [Google Scholar] [CrossRef]
- Spanhel, L.; Anderson, M.A. Semiconductor Clusters in the Sol-Gel Process: Quantized Aggregation, Gelation, and Crystal Growth in Concentrated ZnO Colloids. J. Am. Chem. Soc. 1991, 113, 2826–2833. [Google Scholar] [CrossRef]
- Babes, L.; Denizot, B.; Tanguy, G.; Le Jeune, J.J.; Jallet, P. Synthesis of Iron Oxide Nanoparticles Used as MRI Contrast Agents: A Parametric Study. J. Colloid. Interface Sci. 1999, 212, 474–482. [Google Scholar] [CrossRef]
- Chiu, H.I.; Samad, N.A.; Fang, L.; Lim, V. Cytotoxicity of Targeted PLGA Nanoparticles: A Systematic Review. RSC Adv. 2021, 11, 9433–9449. [Google Scholar] [CrossRef]
- Baalousha, M. Aggregation and Disaggregation of Iron Oxide Nanoparticles: Influence of Particle Concentration, PH and Natural Organic Matter. Sci. Total Environ. 2009, 407, 2093–2101. [Google Scholar] [CrossRef]
- Mohd Omar, F.; Abdul Aziz, H.; Stoll, S. Aggregation and Disaggregation of ZnO Nanoparticles: Influence of PH and Adsorption of Suwannee River Humic Acid. Sci. Total Environ. 2014, 468–469, 195–201. [Google Scholar] [CrossRef]
- Lallo da Silva, B.; Caetano, B.L.; Chiari-Andréo, B.G.; Pietro, R.C.L.R.; Chiavacci, L.A. Increased Antibacterial Activity of ZnO Nanoparticles: Influence of Size and Surface Modification. Colloids Surf. B Biointerfaces 2019, 177, 440–447. [Google Scholar] [CrossRef] [PubMed]
- Lallo da Silva, B.; Garcia, M.M.; Oshiro-Junior, J.A.; Sato, M.R.; Caetano, B.L.; Chiavacci, L.A. Modified Zinc Oxide Nanoparticles against Multiresistant Enterobacteriaceae: Stability, Growth Studies, and Antibacterial Activity. J. Sol-Gel Sci. Technol. 2022, 101, 244–255. [Google Scholar] [CrossRef]
- Caetano, B.L.; Silva, M.N.; Santilli, C.V.; Briois, V.; Pulcinelli, S.H. Unified ZnO Q-Dot Growth Mechanism from Simultaneous UV–Vis and EXAFS Monitoring of Sol-Gel Reactions Induced by Different Alkali Base. Opt. Mater. 2016, 61, 92–97. [Google Scholar] [CrossRef]
- Ashley, J.; Manikova, P. Fluorescent Sensors. In Fundamentals of Sensor Technology: Principles and Novel Designs; Woodhead Publishing: Cambridge, UK, 2023; pp. 147–161. [Google Scholar] [CrossRef]
- Liang, L.; Chen, J.; Liu, X. Lanthanide-Doped Upconversion Nanomaterials. In Comprehensive Inorganic Chemistry III, 3rd ed.; Elsevier: Amsterdam, The Netherlands, 2023; Volume 1–10, pp. 439–485. [Google Scholar] [CrossRef]
- Ragheb, R.R.T.; Kim, D.; Bandyopadhyay, A.; Chahboune, H.; Bulutoglu, B.; Ezaldein, H.; Criscione, J.M.; Fahmy, T.M. Induced Clustered Nanoconfinement of Superparamagnetic Iron Oxide in Biodegradable Nanoparticles Enhances Transverse Relaxivity for Targeted Theranostics. Magn. Reson. Med. 2013, 70, 1748–1760. [Google Scholar] [CrossRef]
- Geraldes, C.F.G.C. Rational Design of Magnetic Nanoparticles as T1–T2 Dual-Mode MRI Contrast Agents. Molecules 2024, 29, 1352. [Google Scholar] [CrossRef]
- Fleutot, S.; Nealon, G.L.; Pauly, M.; Pichon, B.P.; Leuvrey, C.; Drillon, M.; Gallani, J.-L.; Guillon, D.; Donnio, B.; Begin-Colin, S. Spacing-Dependent Dipolar Interactions in Dendronized Magnetic Iron Oxide Nanoparticle 2D Arrays and Powders. Nanoscale 2013, 5, 1507. [Google Scholar] [CrossRef]
- Mudunkotuwa, I.A.; Rupasinghe, T.; Wu, C.M.; Grassian, V.H. Dissolution of ZnO Nanoparticles at Circumneutral PH: A Study of Size Effects in the Presence and Absence of Citric Acid. Langmuir 2012, 28, 396–403. [Google Scholar] [CrossRef]
- Cai, X.; Luo, Y.; Yan, H.; Du, D.; Lin, Y. PH-Responsive ZnO Nanocluster for Lung Cancer Chemotherapy. ACS Appl. Mater. Interfaces 2017, 9, 5739–5747. [Google Scholar] [CrossRef]
- Manaia, E.B.; Kaminski, R.C.K.; Caetano, B.L.; Briois, V.; Chiavacci, L.A.; Bourgaux, C. Surface Modified Mg-Doped ZnO QDs for Biological Imaging. Eur. J. Nanomed. 2015, 7, 109–120. [Google Scholar] [CrossRef]
- Ba-Abbad, M.M.; Kadhum, A.A.H.; Mohamad, A.B.; Takriff, M.S.; Sopian, K. Visible Light Photocatalytic Activity of Fe3+-Doped ZnO Nanoparticle Prepared via Sol-Gel Technique. Chemosphere 2013, 91, 1604–1611. [Google Scholar] [CrossRef] [PubMed]
- Sekar, A.D.; Muthukumar, H.; Chandrasekaran, N.I.; Matheswaran, M. Photocatalytic Degradation of Naphthalene Using Calcined Fe–ZnO/ PVA Nanofibers. Chemosphere 2018, 205, 610–617. [Google Scholar] [CrossRef] [PubMed]
- Krobthong, S.; Wongrerkdee, S.; Pimpang, P.; Moungsrijun, S.; Sujinnapram, S.; Nilphai, S.; Rungsawang, T.; Wongrerkdee, S. ZnO Nanoparticles Coprecipitation with Aluminum and Copper Ions for Efficient Photocatalytic Degradation of Commercial Glyphosate. Integr. Ferroelectr. 2022, 222, 69–83. [Google Scholar] [CrossRef]


| PLGA:IO (w:w, mg) | Synthesis | 15 Days | ||
|---|---|---|---|---|
| Z-Average (d.nm) | PDI | Z-Average (d.nm) | PDI | |
| 10:1 | 152.1 ± 0.907 | 0.099 ± 0.026 | 149.5 ± 0.411 | 0.120 ± 0.015 |
| 10:2 | 146.8 ± 0.800 | 0.128 ± 0.013 | 144.9 ± 3.107 | 0.174 ± 0.024 |
| 10:3 | 148.7 ± 1.457 | 0.106 ± 0.007 | 148.1 ± 0.818 | 0.136 ± 0.014 |
| 10:4 | 147.8 ± 0.568 | 0.184 ± 0.017 | 145.4 ± 2.931 | 0.164 ± 0.010 |
| PLGA:ZnO (w:w, mg) | Synthesis | 15 days | ||
| Z-average (d.nm) | PDI | Z-average (d.nm) | PDI | |
| 10:2 | 251.5 ± 1.473 | 0.118 ± 0.016 | 243.0 ± 1.082 | 0.096 ± 0.022 |
| 10:4 | 211.4 ± 10.95 | 0.205 ± 0.014 | 254.2 ± 1.950 | 0.189 ± 0.023 |
| 10:6 | 224.6 ± 2.948 | 0.078 ± 0.040 | 226.3 ± 1.952 | 0.069 ± 0.025 |
| 10:8 | 219.4 ± 1.266 | 0.093 ± 0.016 | 214.8 ± 1.450 | 0.095 ± 0.002 |
| PLGA:ZnO:IO (w:w:w, mg) | Synthesis | 15 days | ||
| Z-average (d.nm) | PDI | Z-average (d.nm) | PDI | |
| 10:8:1 | 247.0 ± 2.254 | 0.157 ± 0.020 | 236.0 ± 2.227 | 0.144 ± 0.019 |
| 10:8:2 | 280.3 ± 2.887 | 0.204 ± 0.042 | 270.1 ± 5.508 | 0.191 ± 0.022 |
| 10:8:3 | 236.1 ± 1.589 | 0.233 ± 0.006 | 277.1 ± 9.296 | 0.289 ± 0.109 |
| 10:8:4 | 264.6 ± 7.534 | 0.288 ± 0.034 | 318.6 ± 69.12 | 0.409 ± 0.113 |
| PLGA:ZnO:IO (w:w:w, mg) | Synthesis | 15 days | ||
| Z-average (d.nm) | PDI | Z-average (d.nm) | PDI | |
| 10:4:1 | 193.8 ± 0.265 | 0.061 ± 0.012 | 200.1 ± 0.448 | 0.091 ± 0.017 |
| 10:6:1 | 235.0 ± 0.758 | 0.066 ± 0.021 | 222.0 ± 1.778 | 0.096 ± 0.030 |
| 10:8:1 | 247.0 ± 2.254 | 0.157 ± 0.020 | 236.0 ± 2.227 | 0.144 ± 0.019 |
| PLGA:ZnO:IO | Average Diameter NPs (nm) | Zeta Potential |
|---|---|---|
| 10:0:0 | - | −21.3 ± 1.0 |
| 10:6:0 (ZnO) | 4.73 ± 0.16 | −12.2 ± 1.6 |
| 10:8:0 (ZnO) | 4.56 ± 0.16 | −17.5 ± 0.8 |
| 10:0:1 (IO) | 7.33 ± 0.28 | −25.4 ± 0.2 |
| 10:6:1 (ZnO + IO) | 4.03 ± 0.10 | −33.2 ± 1.4 |
| 10:8:1 (ZnO + IO) | 4.64 ± 0.14 | −31.9 ± 1.0 |
| Samples | Fe (µM) | Zn (µM) | Fe:Zn (mol:mol) | r2 (mM−1 s−1) |
|---|---|---|---|---|
| PLGA:IO 10:1 | 4.15 ± 0.33 | - | - | 356.38 |
| PLGA:ZnO:IO 10:6:1 | 4.98 ± 0.26 | 50.01 ± 0.34 | 1:10 | 171.50 |
| PLGA:ZnO:IO 10:8:1 | 3.44 ± 0.20 | 45.57 ± 0.42 | 1:13 | 90.62 |
Disclaimer/Publisher’s Note: The statements, opinions and data contained in all publications are solely those of the individual author(s) and contributor(s) and not of MDPI and/or the editor(s). MDPI and/or the editor(s) disclaim responsibility for any injury to people or property resulting from any ideas, methods, instructions or products referred to in the content. |
© 2025 by the authors. Licensee MDPI, Basel, Switzerland. This article is an open access article distributed under the terms and conditions of the Creative Commons Attribution (CC BY) license (https://creativecommons.org/licenses/by/4.0/).
Share and Cite
Barbosa, T.W.L.; Lemaire, L.; Verdu, I.; Santos, L.; de Freitas, N.G.; Salto, M.P.; Chiavacci, L.A. Bimodal Poly(lactic-co-glycolic acid) Nanocarrier with Zinc Oxide and Iron Oxide for Fluorescence and Magnetic Resonance Imaging. Molecules 2025, 30, 1818. https://doi.org/10.3390/molecules30081818
Barbosa TWL, Lemaire L, Verdu I, Santos L, de Freitas NG, Salto MP, Chiavacci LA. Bimodal Poly(lactic-co-glycolic acid) Nanocarrier with Zinc Oxide and Iron Oxide for Fluorescence and Magnetic Resonance Imaging. Molecules. 2025; 30(8):1818. https://doi.org/10.3390/molecules30081818
Chicago/Turabian StyleBarbosa, Thúlio Wliandon Lemos, Laurent Lemaire, Isabelle Verdu, Larissa Santos, Natália Galvão de Freitas, Mariana Picchi Salto, and Leila Aparecida Chiavacci. 2025. "Bimodal Poly(lactic-co-glycolic acid) Nanocarrier with Zinc Oxide and Iron Oxide for Fluorescence and Magnetic Resonance Imaging" Molecules 30, no. 8: 1818. https://doi.org/10.3390/molecules30081818
APA StyleBarbosa, T. W. L., Lemaire, L., Verdu, I., Santos, L., de Freitas, N. G., Salto, M. P., & Chiavacci, L. A. (2025). Bimodal Poly(lactic-co-glycolic acid) Nanocarrier with Zinc Oxide and Iron Oxide for Fluorescence and Magnetic Resonance Imaging. Molecules, 30(8), 1818. https://doi.org/10.3390/molecules30081818