
Seeking Correlation Among Porin Permeabilities and Minimum Inhibitory Concentrations Through Machine Learning: A Promising Route to the Essential Molecular Descriptors

 , , ,
, , ,  , , ,
, , ,  ,
,  and
and
Abstract

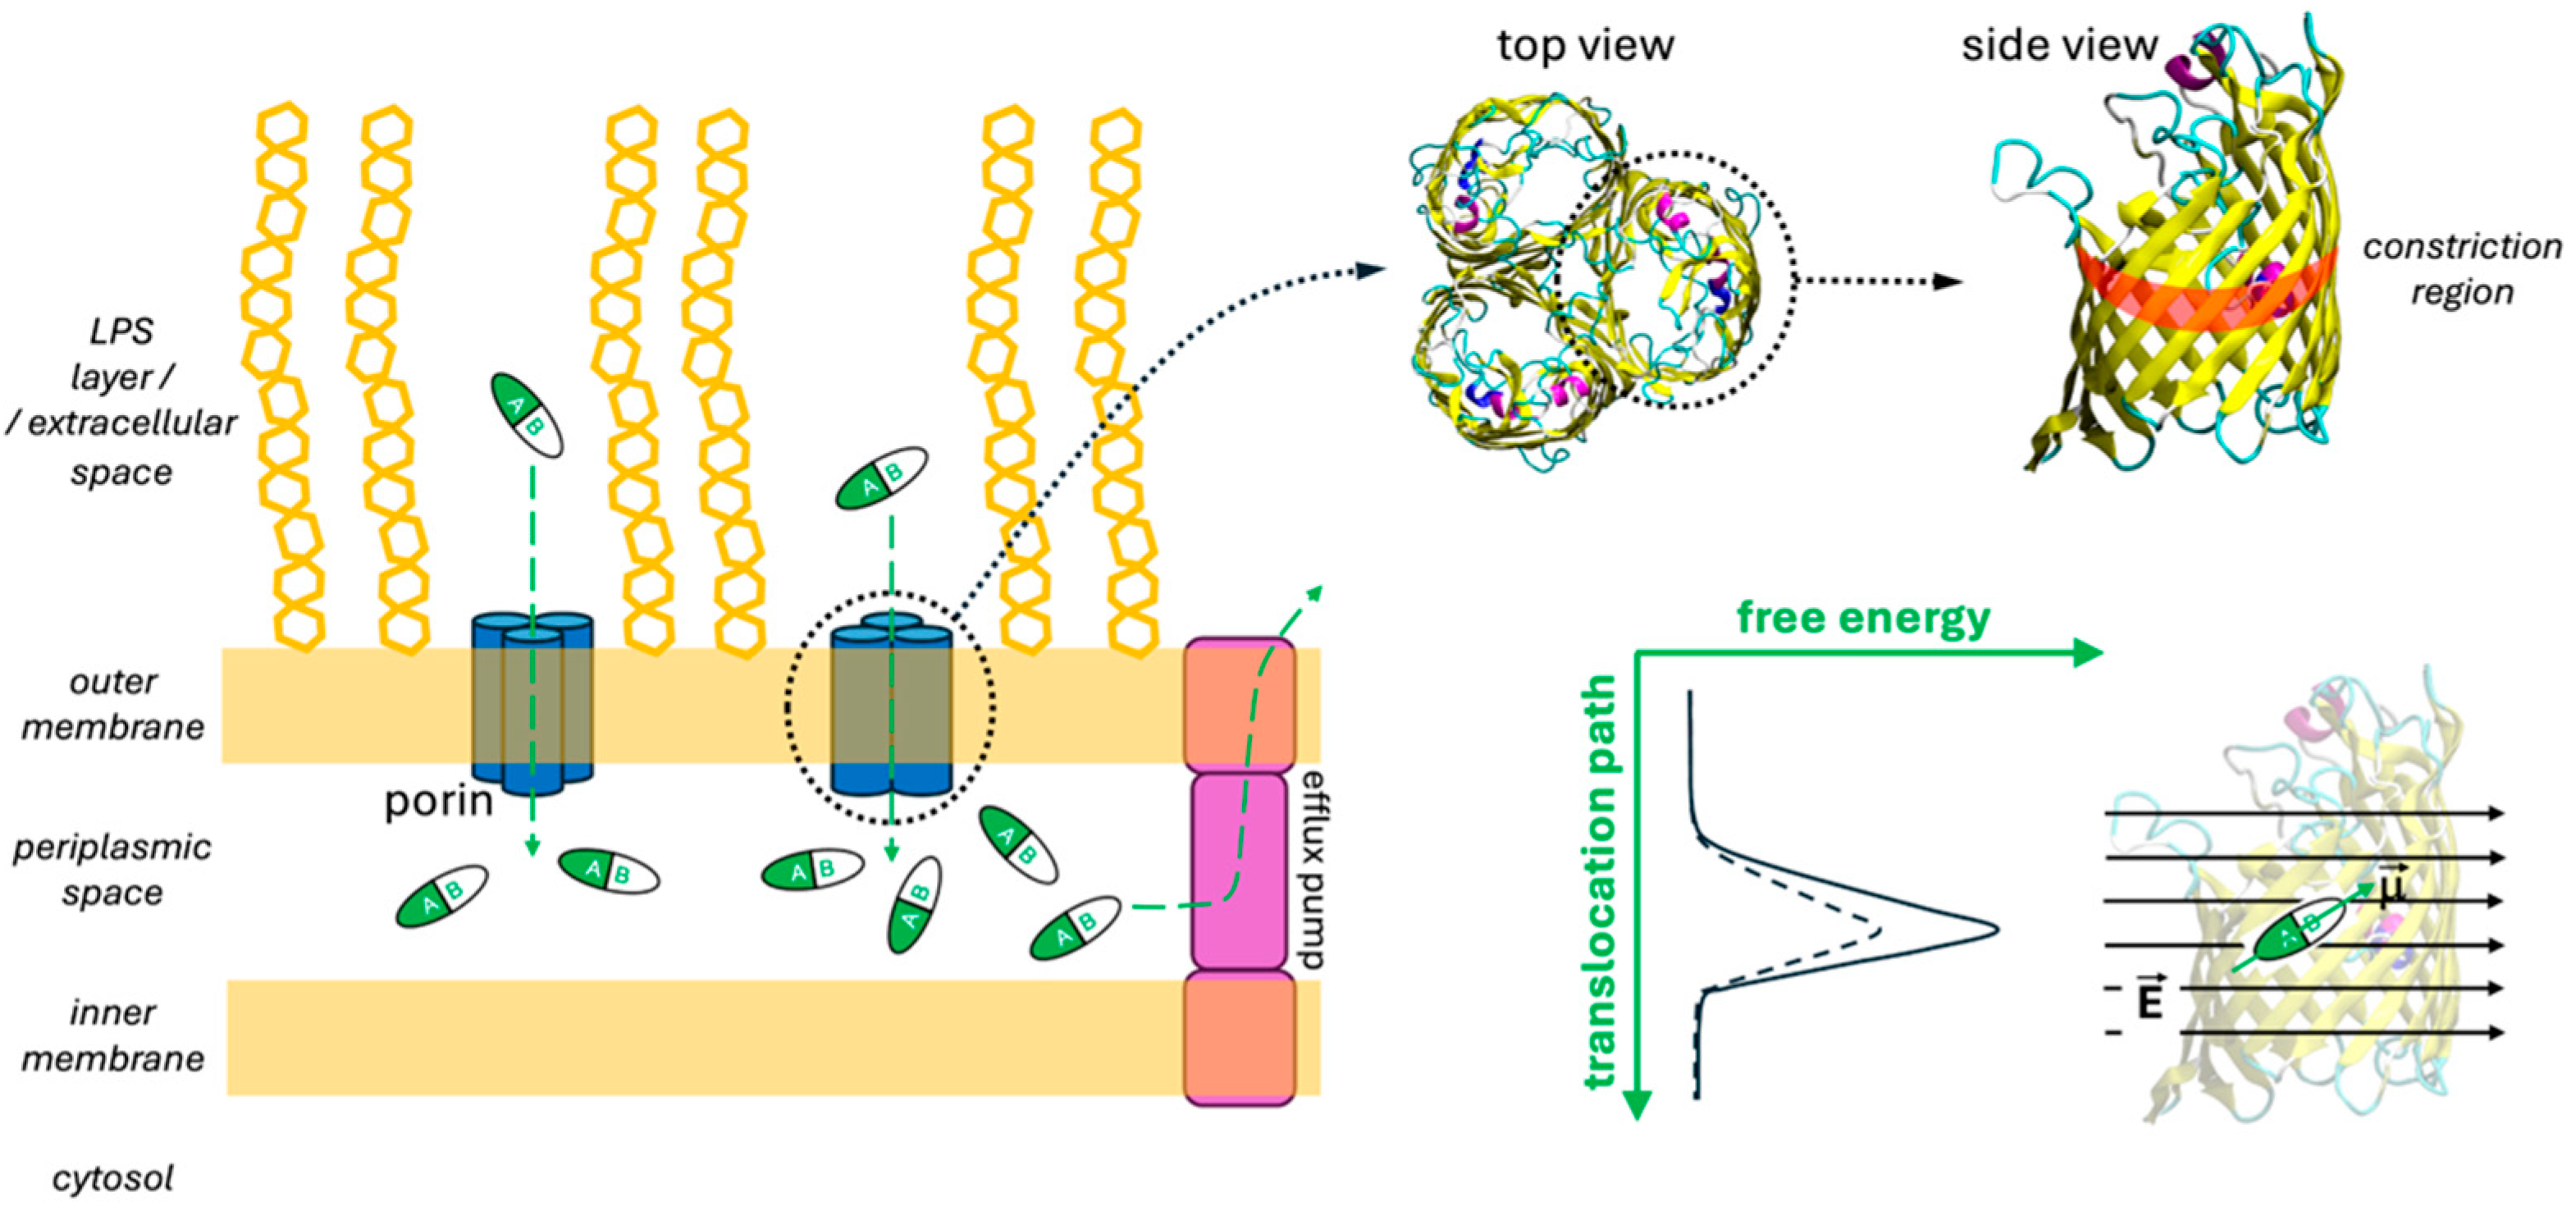
1. Introduction
2. Results and Discussion
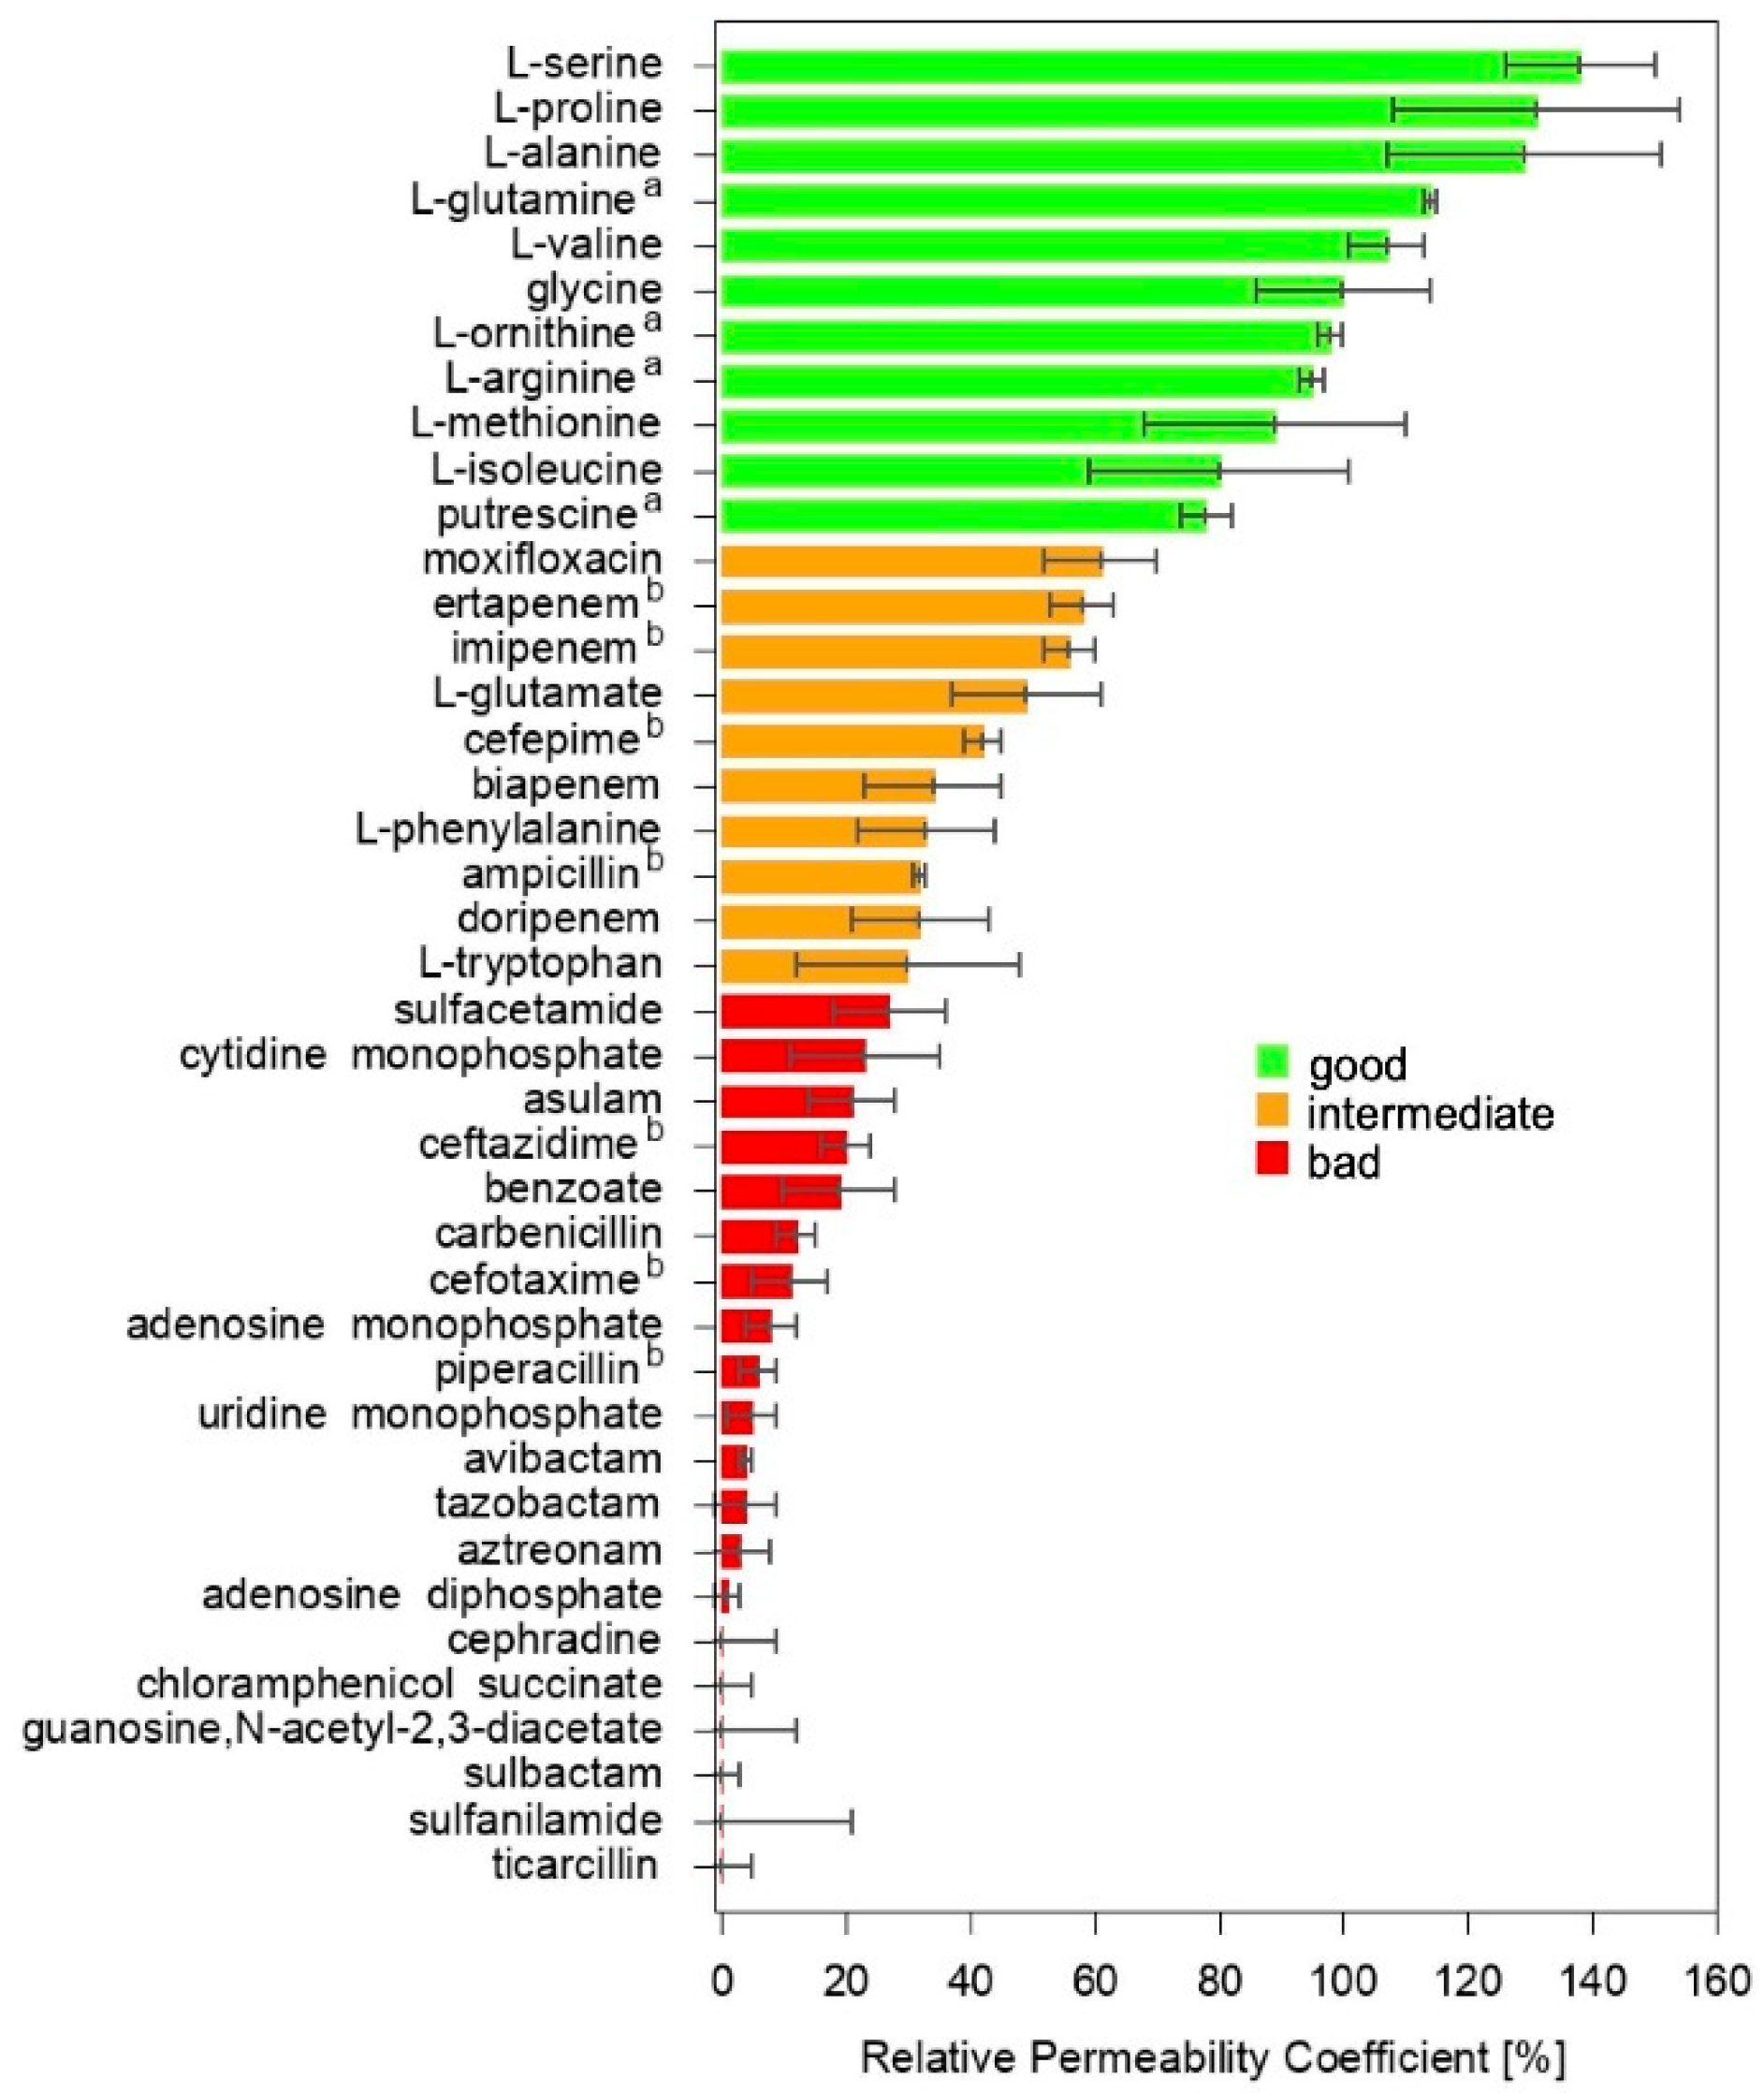
2.1. Liposome Swelling Assays
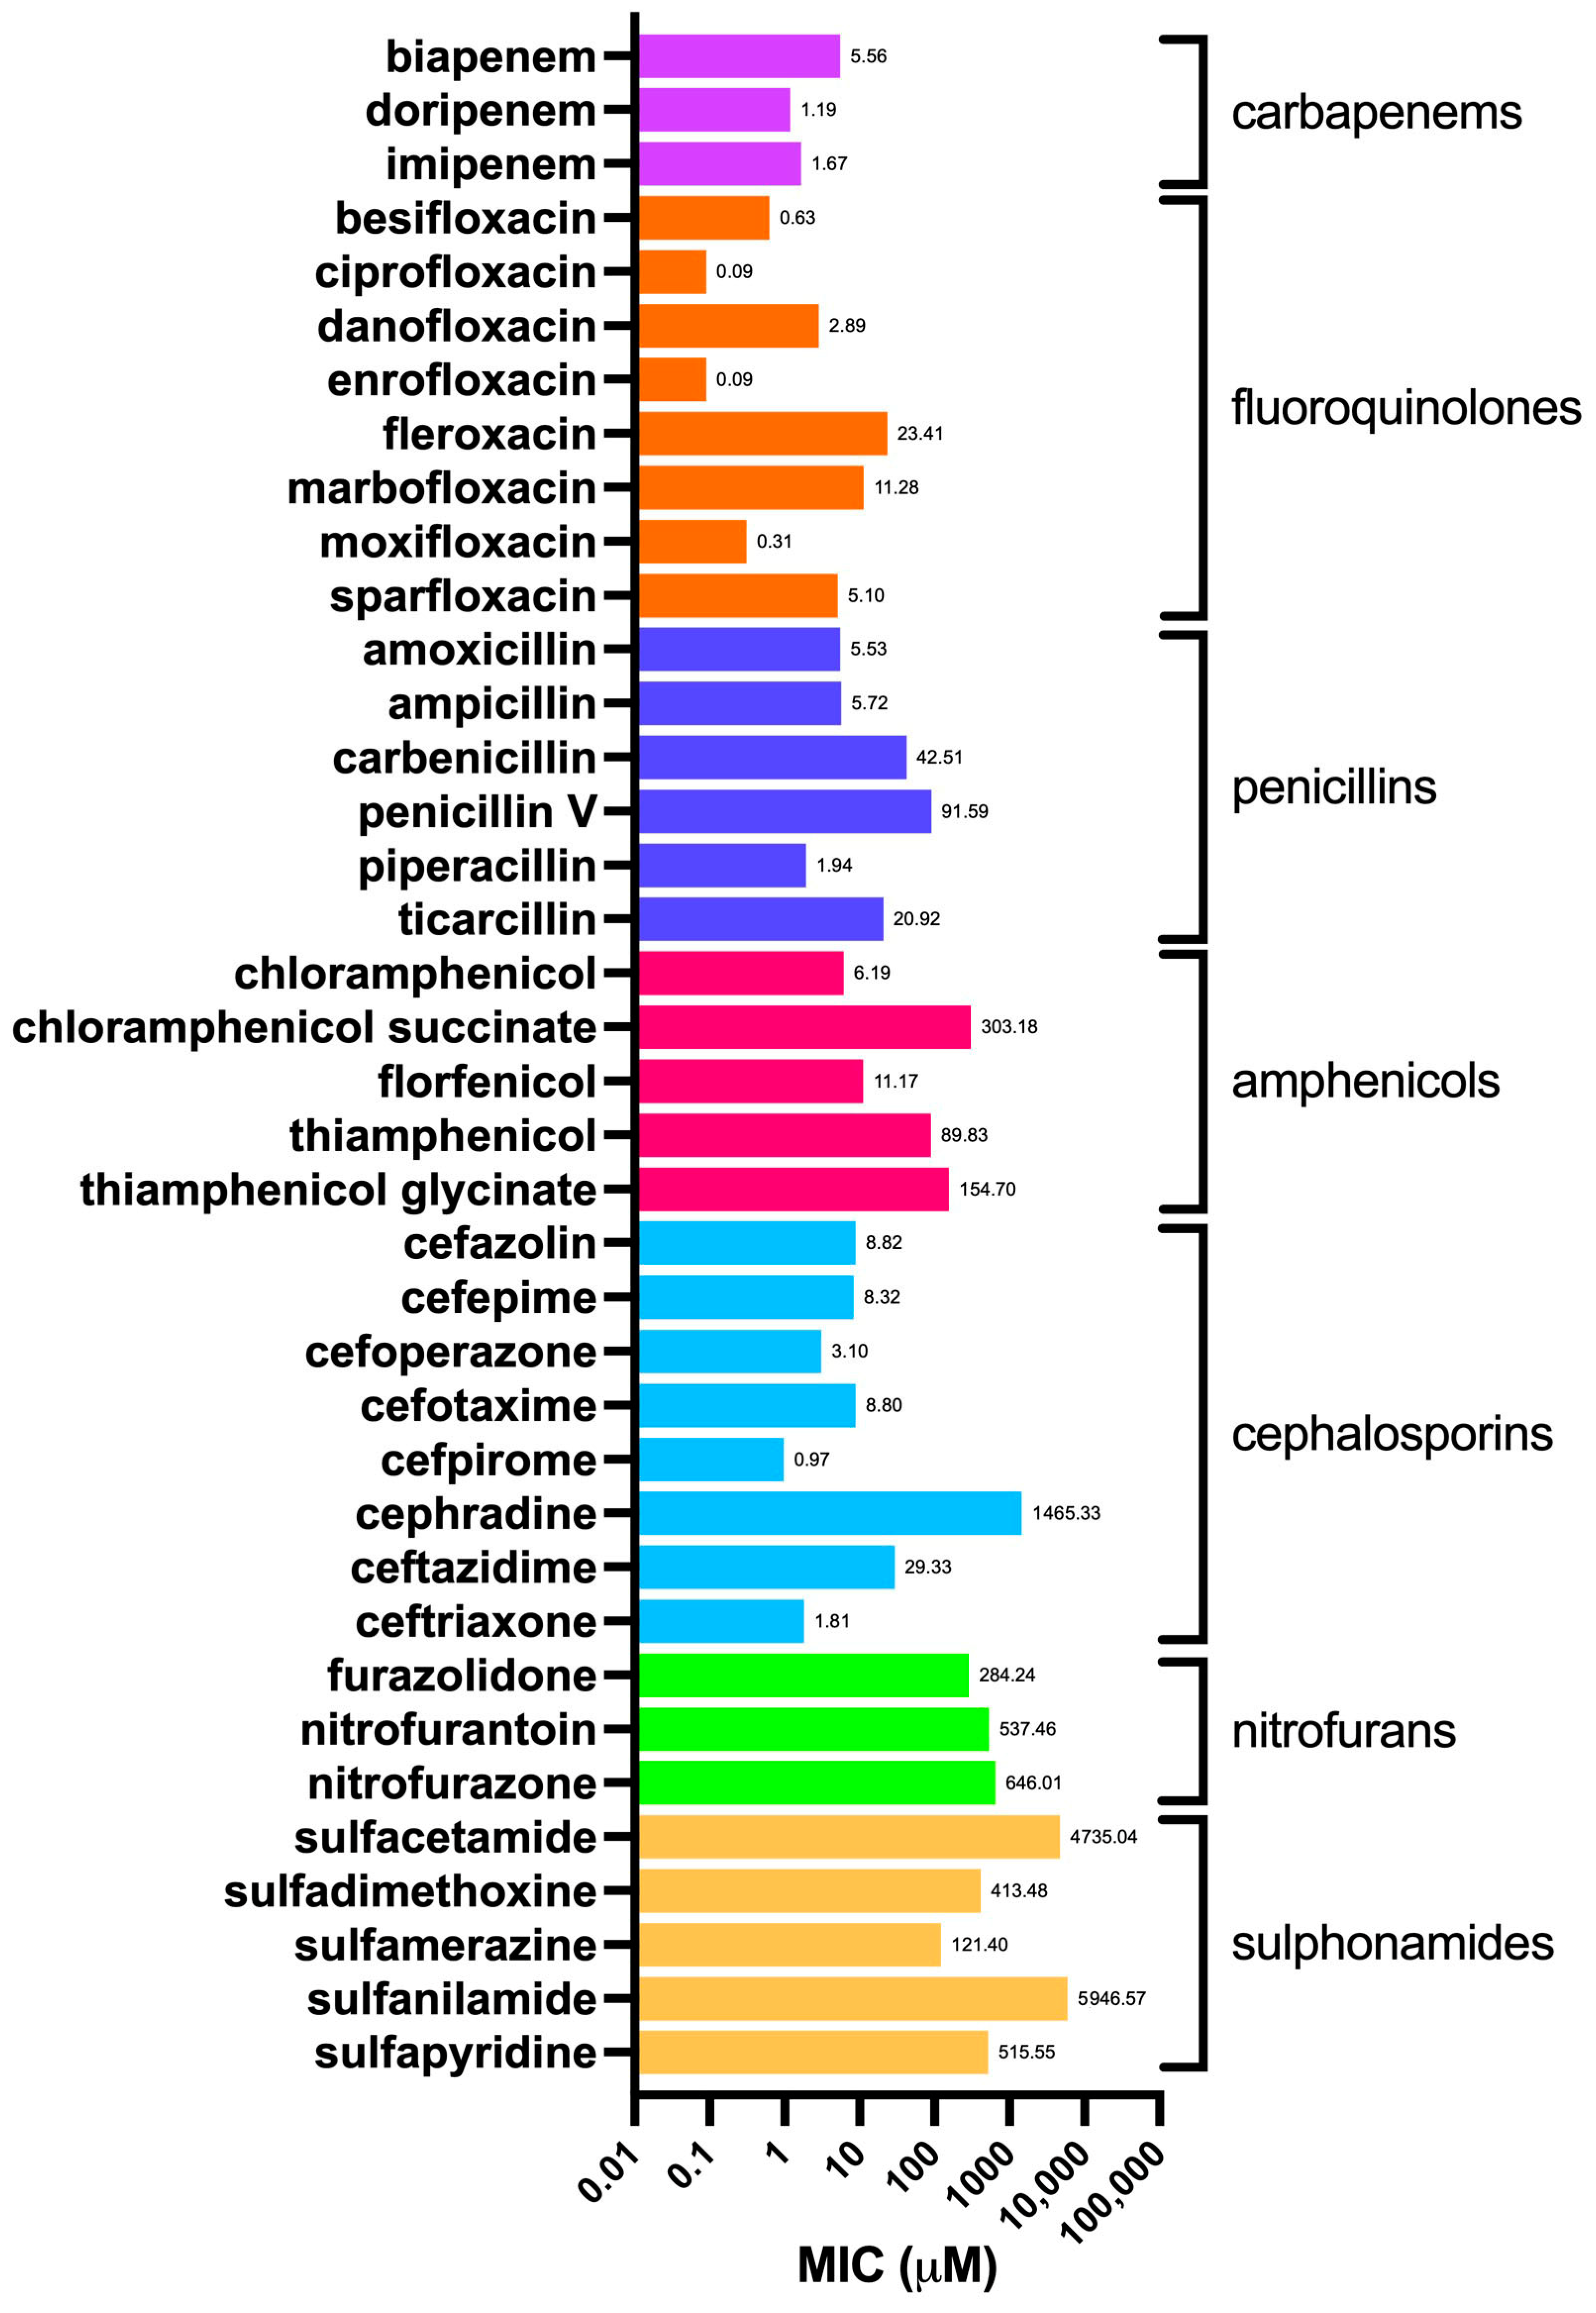
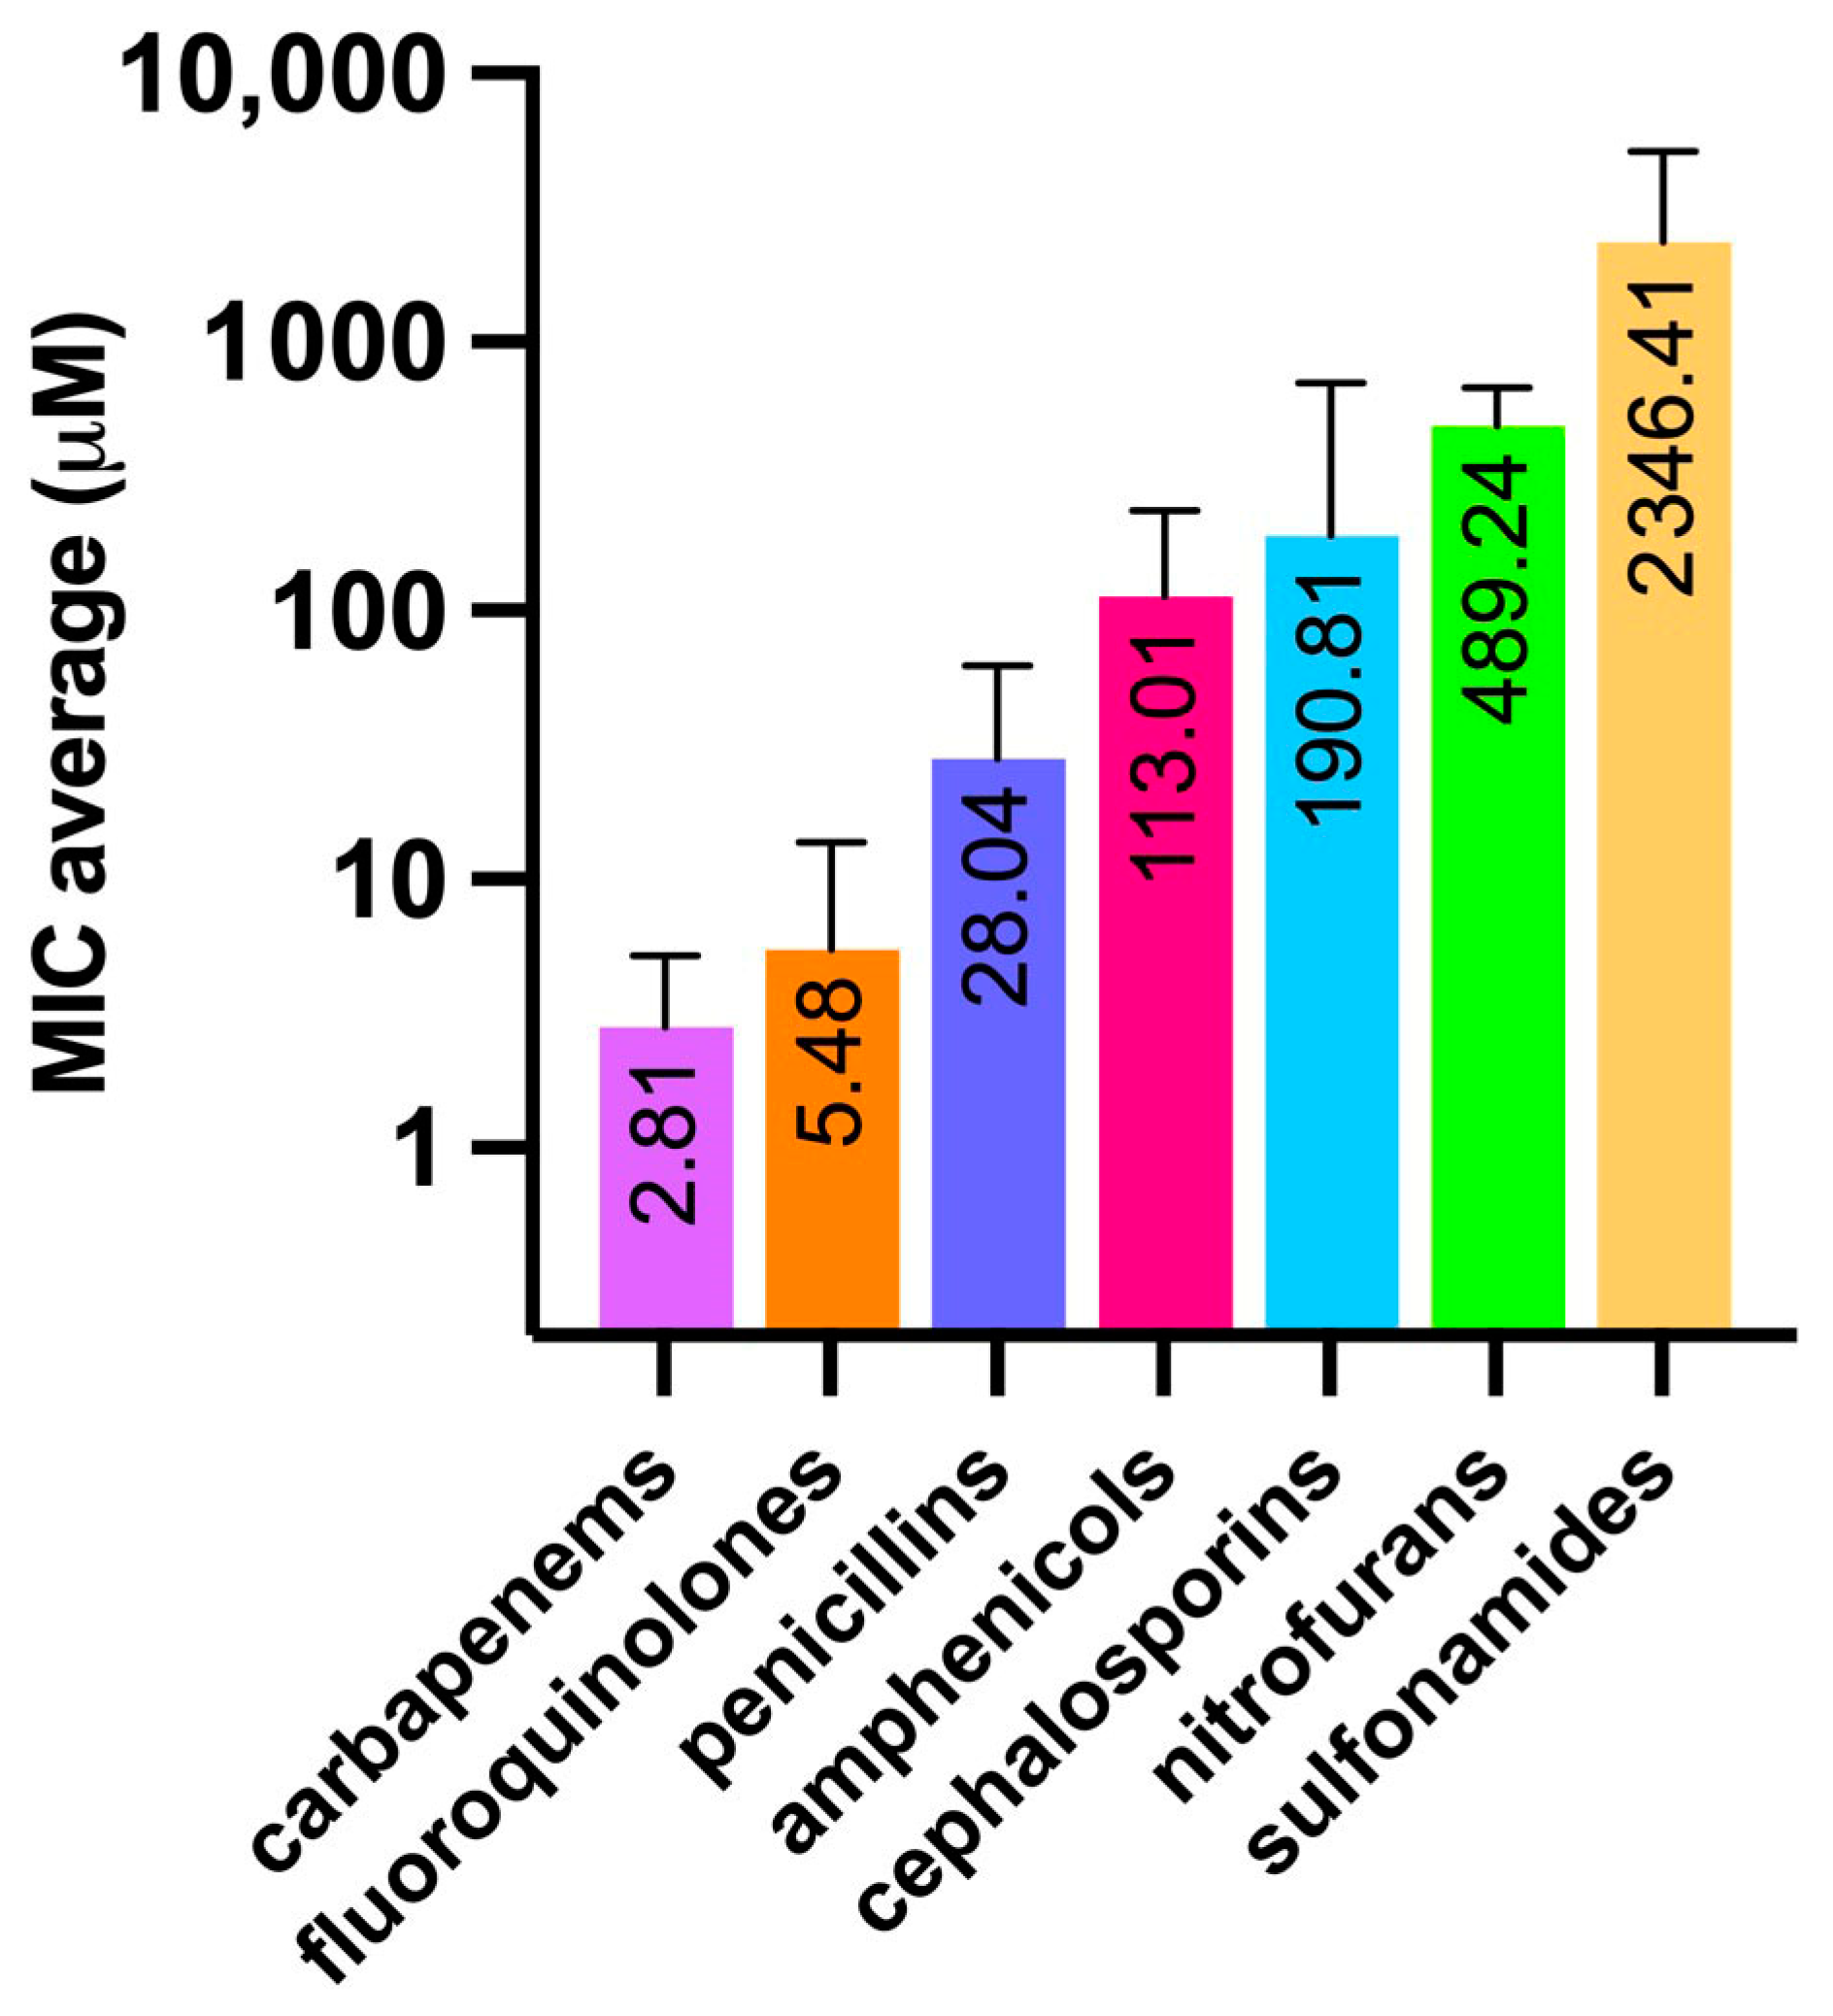
2.2. Minimum Inhibitory Concentrations
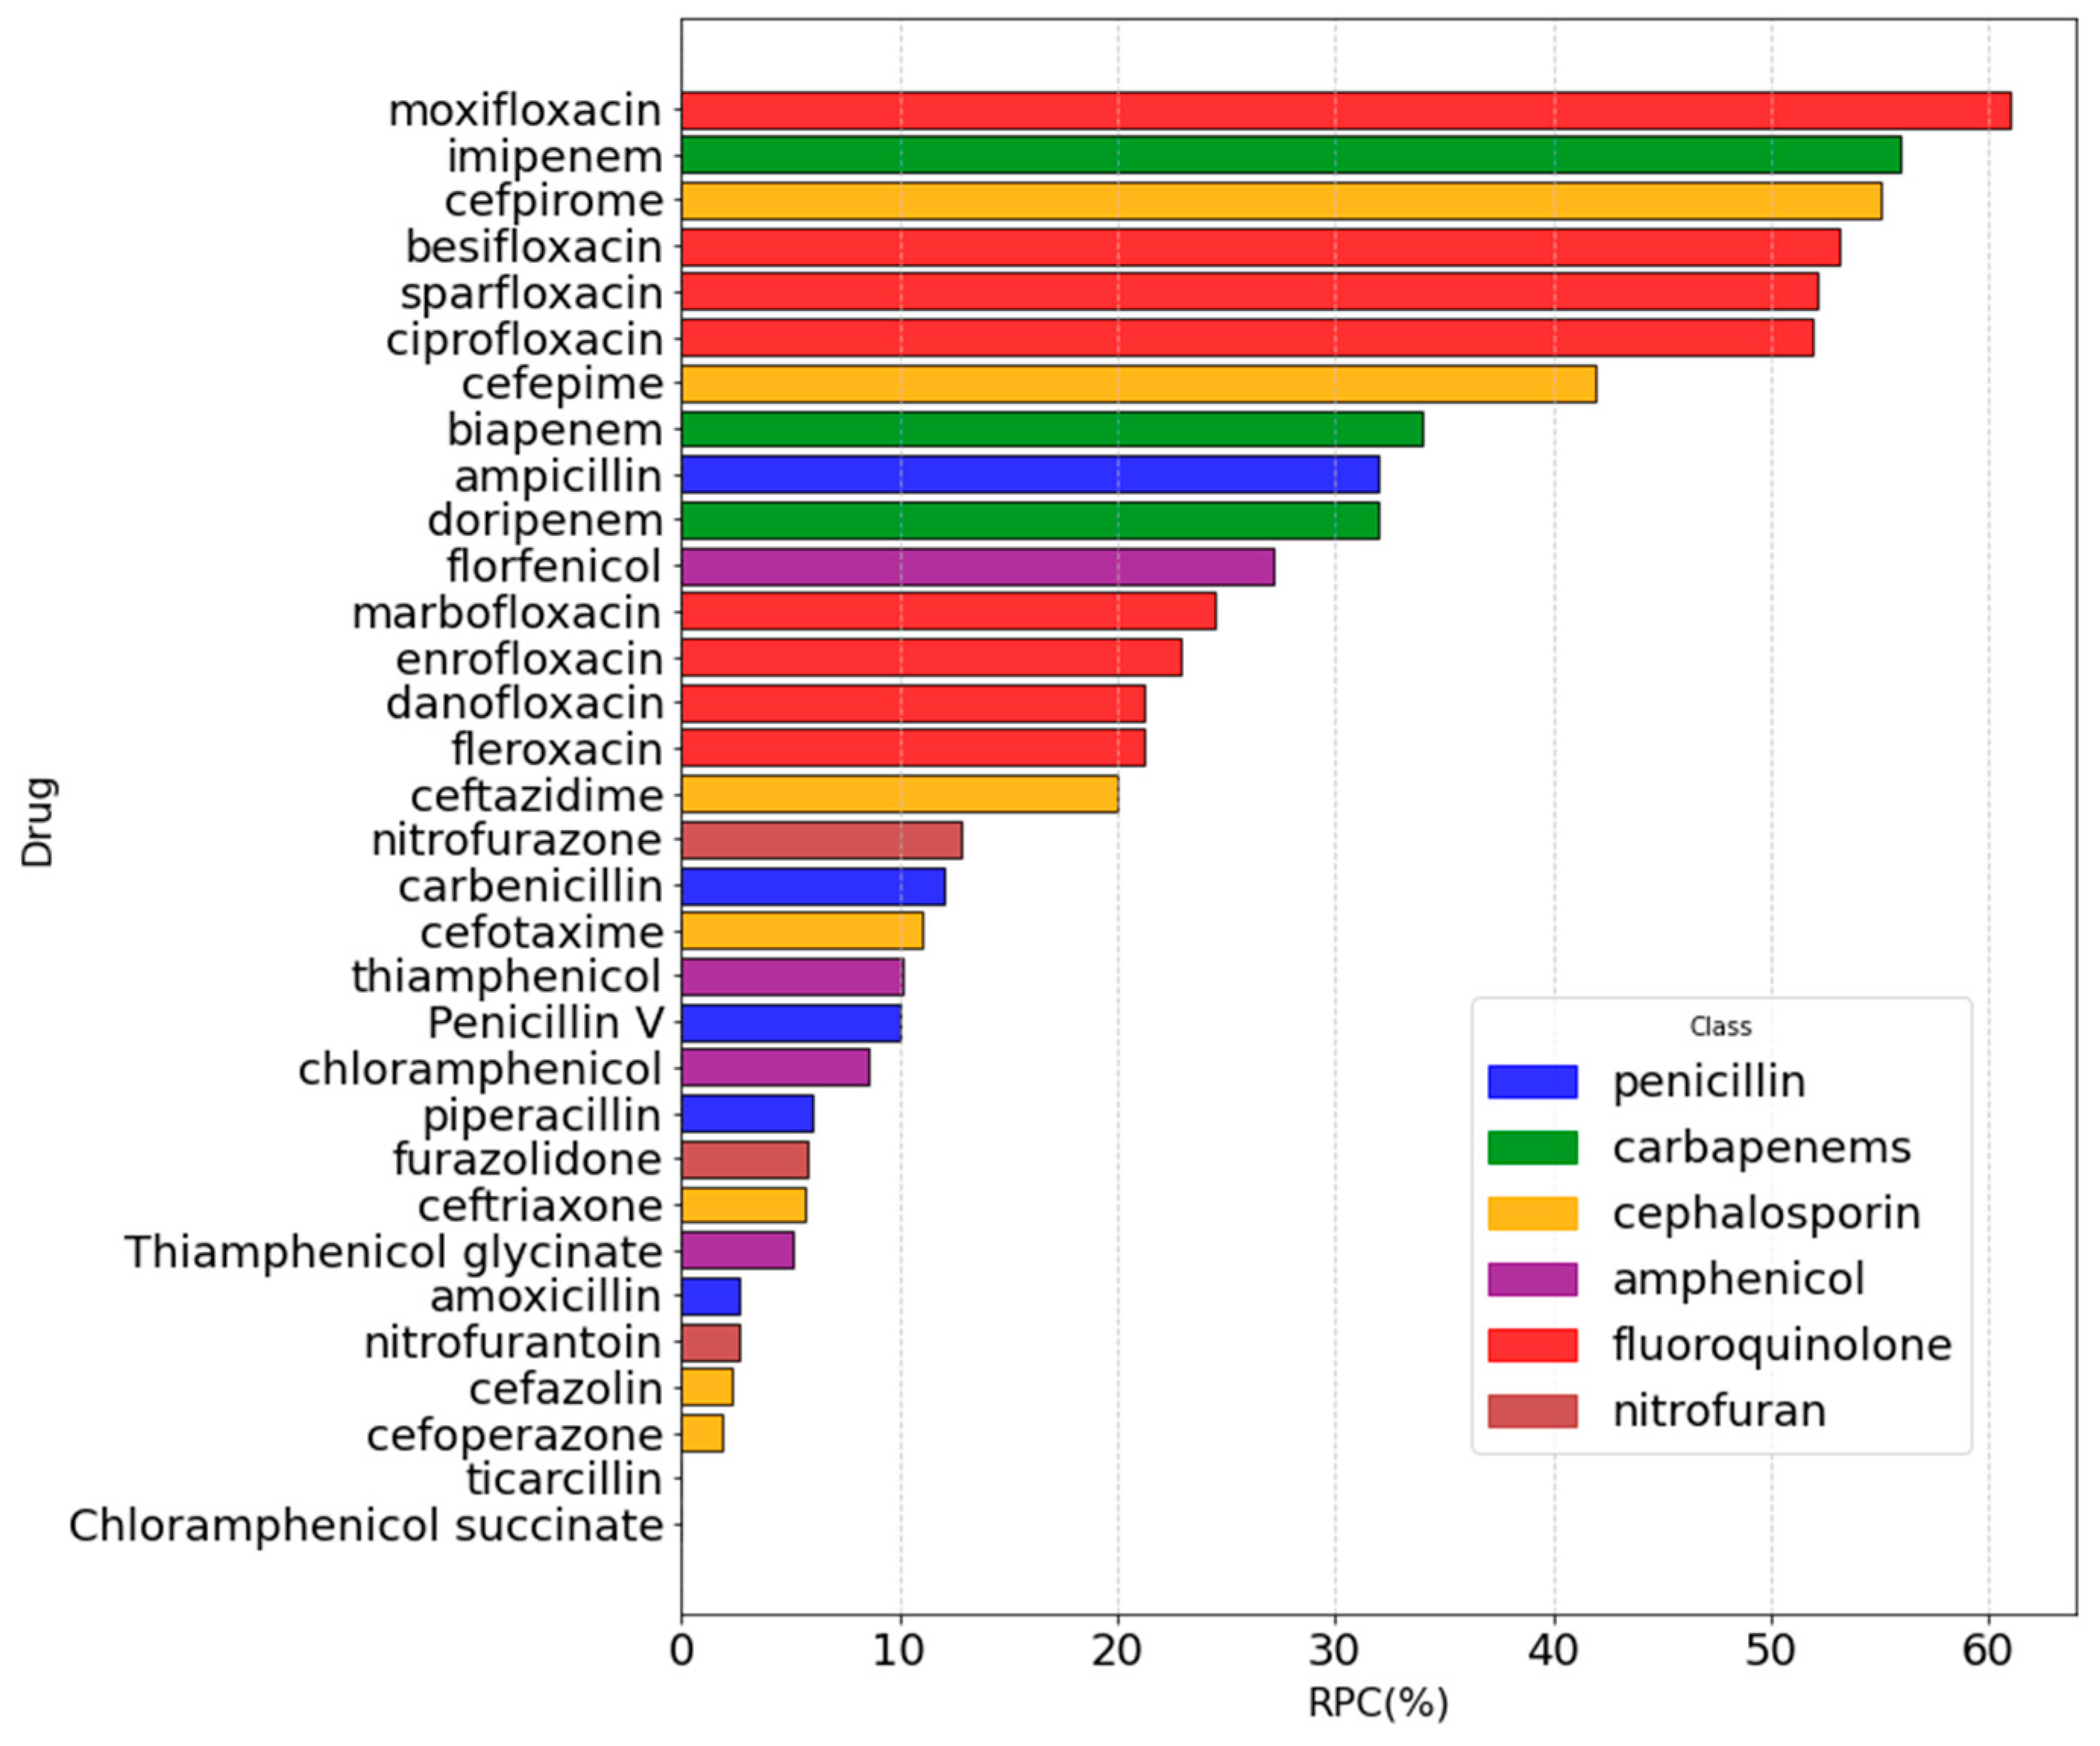
2.3. Machine Learning to Correlate MIC to RPC
3. Materials and Methods
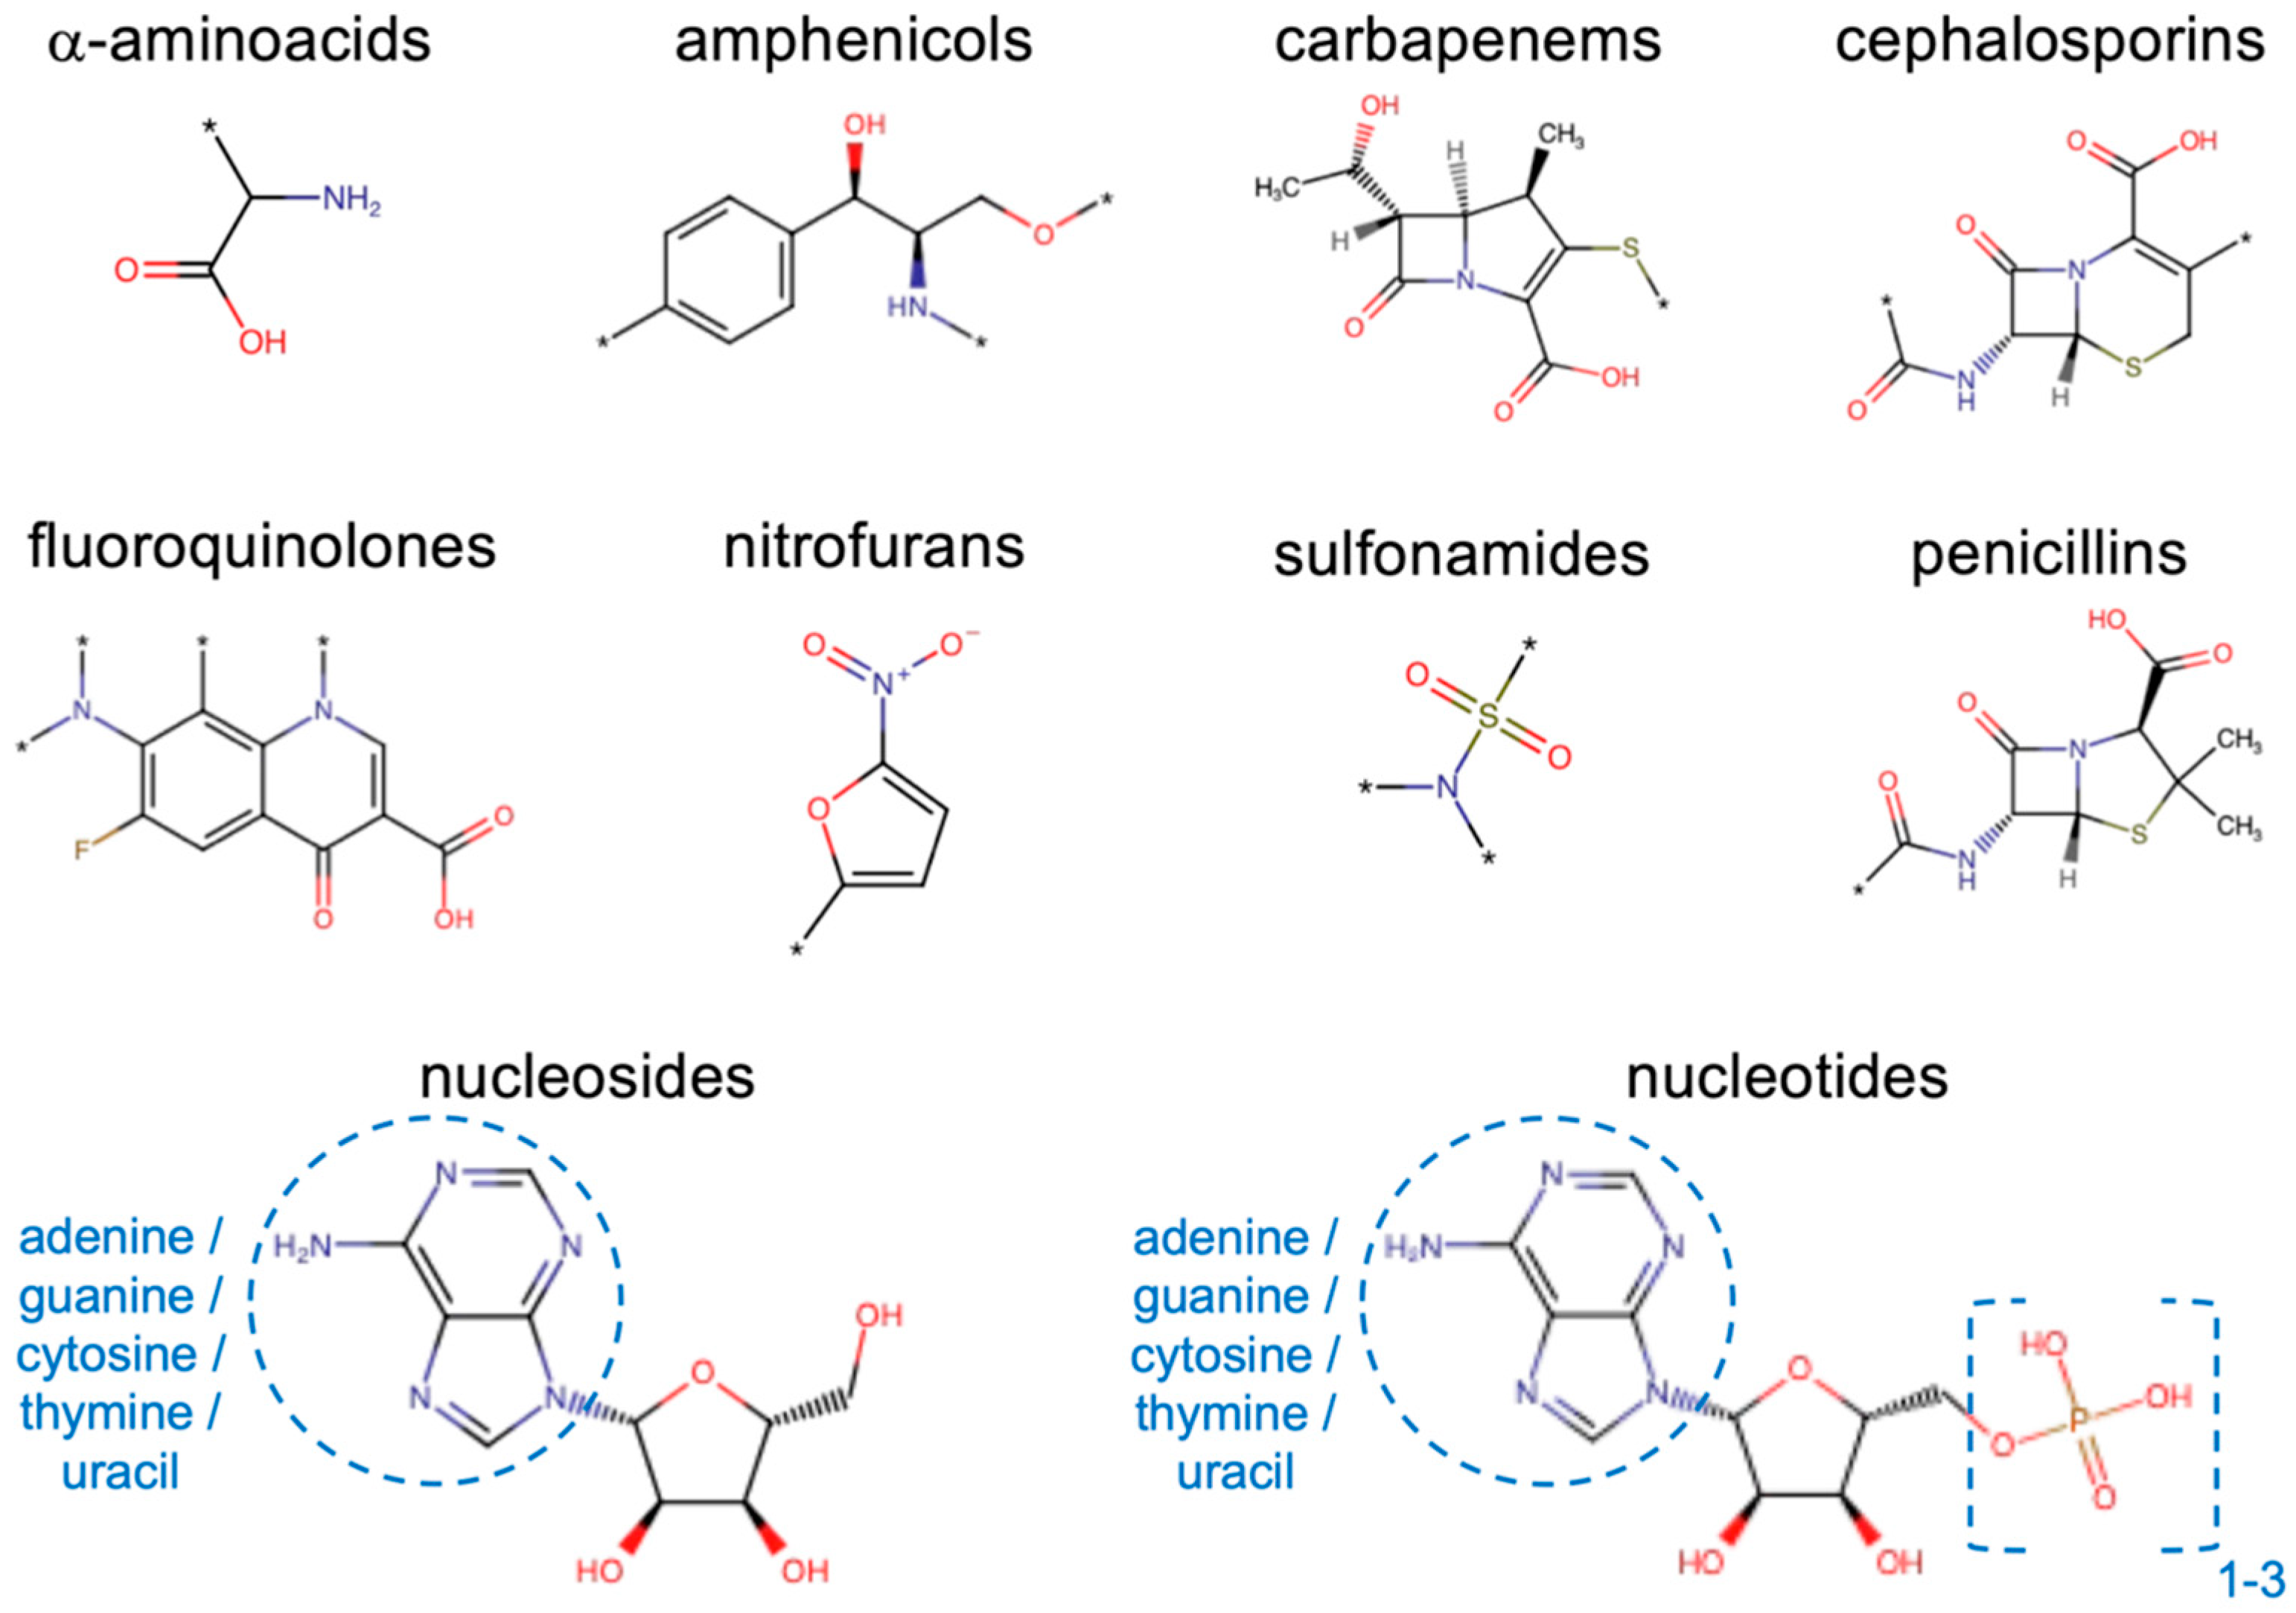
3.1. Drugs and Substrates
3.2. Protein Expression and Purification
3.3. Vesicle Preparation
3.4. Liposome Swelling Assay
3.5. Bacterial Cultures and Antimicrobial Activity Test
3.6. Cheminformatic Tools
3.7. Machine Learning
3.8. Molecular Dynamics Simulations
4. Conclusions
Supplementary Materials
Author Contributions
Funding
Institutional Review Board Statement
Informed Consent Statement
Data Availability Statement
Acknowledgments
Conflicts of Interest
References
- WHO. Global Antimicrobial Resistance and Use Surveillance System (GLASS) Report 2022, 1st ed.; World Health Organization: Geneva, Switzerland, 2022; ISBN 978-92-4-006270-2. [Google Scholar]
- Lack of New Antibiotics Threatens Global Efforts to Contain Drug-Resistant Infections. Available online: https://www.who.int/news/item/17-01-2020-lack-of-new-antibiotics-threatens-global-efforts-to-contain-drug-resistant-infections (accessed on 6 March 2025).
- Fernández, L.; Hancock, R.E.W. Adaptive and Mutational Resistance: Role of Porins and Efflux Pumps in Drug Resistance. Clin. Microbiol. Rev. 2012, 25, 661–681. [Google Scholar] [CrossRef] [PubMed]
- Delcour, A.H. Outer membrane permeability and antibiotic resistance. Biochim. Biophys. Acta 2009, 1794, 808–816. [Google Scholar] [CrossRef] [PubMed]
- Benz, R. Structure and Function of Porins from Gram-Negative Bacteria. Annu. Rev. Microbiol. 1988, 42, 359–393. [Google Scholar] [CrossRef]
- Pagès, J.-M.; James, C.E.; Winterhalter, M. The porin and the permeating antibiotic: A selective diffusion barrier in Gram-negative bacteria. Nat. Rev. Microbiol. 2008, 6, 893–903. [Google Scholar] [CrossRef]
- Richter, M.F.; Drown, B.S.; Riley, A.P.; Garcia, A.; Shirai, T.; Svec, R.L.; Hergenrother, P.J. Predictive compound accumulation rules yield a broad-spectrum antibiotic. Nature 2017, 545, 299–304. [Google Scholar] [CrossRef]
- Lewis, K. Platforms for antibiotic discovery. Nat. Rev. Drug Discov. 2013, 12, 371–387. [Google Scholar] [CrossRef]
- Isabella, V.M.; Campbell, A.J.; Manchester, J.; Sylvester, M.; Nayar, A.S.; Ferguson, K.E.; Tommasi, R.; Miller, A.A. Toward the rational design of carbapenem uptake in Pseudomonas aeruginosa. Chem. Biol. 2015, 22, 535–547. [Google Scholar] [CrossRef] [PubMed]
- Cowan, S.W.; Schirmer, T.; Rummel, G.; Steierf, M.; Ghosh, R.; Pauptitt, R.A.; Jansonius, J.N.; Rosenbusch, J.P. Crystal structures explain functional properties of two E. coli porins. Nature 1992, 358, 727–733. [Google Scholar] [CrossRef]
- Baslé, A.; Rummel, G.; Storici, P.; Rosenbusch, J.P.; Schirmer, T. Crystal structure of osmoporin OmpC from E. coli at 2.0 A. J. Mol. Biol. 2006, 362, 933–942. [Google Scholar] [CrossRef]
- Masi, M.; Pagès, J.-M. Structure, Function and Regulation of Outer Membrane Proteins Involved in Drug Transport in Enterobactericeae: The OmpF/C—TolC Case. Open Microbiol. J. 2013, 7, 22–33. [Google Scholar] [CrossRef]
- Kojima, S.; Nikaido, H. High salt concentrations increase permeability through OmpC channels of Escherichia coli. J. Biol. Chem. 2014, 289, 26464–26473. [Google Scholar] [CrossRef] [PubMed]
- Kojima, S.; Nikaido, H. Permeation rates of penicillins indicate that Escherichia coli porins function principally as nonspecific channels. Proc. Natl. Acad. Sci. USA 2013, 110, E2629–E2634. [Google Scholar] [CrossRef] [PubMed]
- Winterhalter, M.; Ceccarelli, M. Physical methods to quantify small antibiotic molecules uptake into Gram-negative bacteria. Eur. J. Pharm. Biopharm. 2015, 95, 63–67. [Google Scholar] [CrossRef]
- Nestorovich, E.M.; Danelon, C.; Winterhalter, M.; Bezrukov, S.M. Designed to penetrate: Time-resolved interaction of single antibiotic molecules with bacterial pores. Proc. Natl. Acad. Sci. USA 2002, 99, 9789–9794. [Google Scholar] [CrossRef] [PubMed]
- Karshikoff, A.; Spassov, V.; Cowan, S.W.; Ladenstein, R.; Schirmer, T. Electrostatic properties of two porin channels from Escherichia coli. J. Mol. Biol. 1994, 240, 372–384. [Google Scholar] [CrossRef]
- Im, W.; Roux, B. Ion Permeation and Selectivity of OmpF Porin: A Theoretical Study Based on Molecular Dynamics, Brownian Dynamics, and Continuum Electrodiffusion Theory. J. Mol. Biol. 2002, 322, 851–869. [Google Scholar] [CrossRef]
- Gutiérrez, S.A.; Bodrenko, I.; Scorciapino, M.A.; Ceccarelli, M. Macroscopic electric field inside water-filled biological nanopores. Phys. Chem. Chem. Phys. 2016, 18, 8855–8864. [Google Scholar] [CrossRef]
- Bajaj, H.; Scorciapino, M.A.; Moynié, L.; Page, M.G.P.; Naismith, J.H.; Ceccarelli, M.; Winterhalter, M. Molecular Basis of Filtering Carbapenems by Porins from β-Lactam-resistant Clinical Strains of Escherichia coli. J. Biol. Chem. 2016, 291, 2837–2847. [Google Scholar] [CrossRef]
- Ceccarelli, M.; Milenkovic, S.; Bodrenko, I.V. The Effect of Lipopolysaccharides on the Electrostatic Properties of Gram-Negative General Porins from Enterobacteriaceae. Chemphyschem 2024, 25, e202400147. [Google Scholar] [CrossRef]
- Acosta-Gutierrez, S.; Scorciapino, M.A.; Bodrenko, I.; Ceccarelli, M. Filtering with Electric Field: The Case of E. coli Porins. J. Phys. Chem. Lett. 2015, 6, 1807–1812. [Google Scholar] [CrossRef]
- Acosta-Gutiérrez, S.; Ferrara, L.; Pathania, M.; Masi, M.; Wang, J.; Bodrenko, I.; Zahn, M.; Winterhalter, M.; Stavenger, R.A.; Pagès, J.-M.; et al. Getting Drugs into Gram-Negative Bacteria: Rational Rules for Permeation through General Porins. ACS Infect. Dis. 2018, 4, 1487–1498. [Google Scholar] [CrossRef] [PubMed]
- Acosta-Gutiérrez, S.; Bodrenko, I.V.; Ceccarelli, M. The Influence of Permeability through Bacterial Porins in Whole-Cell Compound Accumulation. Antibiotics 2021, 10, 635. [Google Scholar] [CrossRef] [PubMed]
- Milenkovic, S.; Boi, S.; Scorciapino, M.A.; Bodrenko, I.V.; Ceccarelli, M. Machine Learning Prediction of Small Molecule Accumulation in Escherichia coli Enhanced with Descriptor Statistics. J. Chem. Theory Comput. 2024, 20, 6695–6705. [Google Scholar] [CrossRef]
- Zahn, M.; Bhamidimarri, S.P.; Baslé, A.; Winterhalter, M.; van den Berg, B. Structural Insights into Outer Membrane Permeability of Acinetobacter baumannii. Structure 2016, 24, 221–231. [Google Scholar] [CrossRef]
- Tran, Q.-T.; Williams, S.; Farid, R.; Erdemli, G.; Pearlstein, R. The translocation kinetics of antibiotics through porin OmpC: Insights from structure-based solvation mapping using WaterMap. Proteins 2013, 81, 291–299. [Google Scholar] [CrossRef]
- Nikaido, H.; Rosenberg, E.Y. Porin channels in Escherichia coli: Studies with liposomes reconstituted from purified proteins. J. Bacteriol. 1983, 153, 241–252. [Google Scholar] [CrossRef] [PubMed]
- Perlmutter, S.J.; Geddes, E.J.; Drown, B.S.; Motika, S.E.; Lee, M.R.; Hergenrother, P.J. Compound Uptake into E. coli Can Be Facilitated by N-Alkyl Guanidiniums and Pyridiniums. ACS Infect. Dis. 2021, 7, 162–173. [Google Scholar] [CrossRef]
- Ruggiu, F.; Yang, S.; Simmons, R.L.; Casarez, A.; Jones, A.K.; Li, C.; Jansen, J.M.; Moser, H.E.; Dean, C.R.; Reck, F.; et al. Size Matters and How You Measure It: A Gram-Negative Antibacterial Example Exceeding Typical Molecular Weight Limits. ACS Infect. Dis. 2019, 5, 1688–1692. [Google Scholar] [CrossRef]
- Lin, X.; Kück, U. Cephalosporins as key lead generation beta-lactam antibiotics. Appl. Microbiol. Biotechnol. 2022, 106, 8007–8020. [Google Scholar] [CrossRef]
- Narendrakumar, L.; Chakraborty, M.; Kumari, S.; Paul, D.; Das, B. β-Lactam potentiators to re-sensitize resistant pathogens: Discovery, development, clinical use and the way forward. Front. Microbiol. 2022, 13, 1092556. [Google Scholar] [CrossRef]
- Prilipov, A.; Phale, P.S.; Van Gelder, P.; Rosenbusch, J.P.; Koebnik, R. Coupling site-directed mutagenesis with high-level expression: Large scale production of mutant porins from E. coli. FEMS Microbiol. Lett. 1998, 163, 65–72. [Google Scholar] [CrossRef]
- Farci, D.; Kereïche, S.; Pangeni, S.; Haniewicz, P.; Bodrenko, I.V.; Ceccarelli, M.; Winterhalter, M.; Piano, D. Structural analysis of the architecture and in situ localization of the main S-layer complex in Deinococcus radiodurans. Structure 2021, 29, 1279–1285.e3. [Google Scholar] [CrossRef]
- Molnar, C.; Casalicchio, G.; Bischl, B. Interpretable Machine Learning—A Brief History, State-of-the-Art and Challenges. In Joint European Conference on Machine Learning and Knowledge Discovery in Databases; Communications in Computer and Information Science; Springer: Berlin/Heidelberg, Germany, 2020; Volume 1323, pp. 417–431. [Google Scholar]
- Molnar, C. Interpretable Machine Learning—A Guide for Making Black Box Models Explainable; Leanpub, Ruboss Technology Corporation: Victoria, BC, Canada, 2022; ISBN 979-8411463330. [Google Scholar]
- Stone, M. Cross-Validatory Choice and Assessment of Statistical Predictions. J. R. Stat. Soc. Ser. B Stat. Methodol. 1974, 36, 111–133. [Google Scholar] [CrossRef]
- Pedregosa, F.; Varoquaux, G.; Gramfort, A.; Michel, V.; Thirion, B.; Grisel, O.; Blondel, M.; Prettenhofer, P.; Weiss, R.; Dubourg, V.; et al. Scikit-learn: Machine Learning in Python. J. Mach. Learn. Res. 2011, 12, 2825–2830. [Google Scholar]
- Zenodo. Available online: https://zenodo.org/ (accessed on 6 March 2025).
- Pearson, K. Method of Moments and Method of Maximum Likelihood. Biometrika 1936, 28, 34–47. [Google Scholar] [CrossRef]
- Weininger, D. Smiles. 3. Depict. Graphical depiction of chemical structures. J. Chem. Inf. Comput. Sci. 1990, 30, 237–243. [Google Scholar] [CrossRef]
- Rappe, A.K.; Casewit, C.J.; Colwell, K.S.; Goddard, W.A.I.; Skiff, W.M. UFF, a full periodic table force field for molecular mechanics and molecular dynamics simulations. J. Am. Chem. Soc. 1992, 114, 10024–10035. [Google Scholar] [CrossRef]
- Case, D.A.; Aktulga, H.M.; Belfon, K.; Cerutti, D.S.; Cisneros, G.A.; Cruzeiro, V.W.D.; Forouzesh, N.; Giese, T.J.; Götz, A.W.; Gohlke, H.; et al. AmberTools. J. Chem. Inf. Model. 2023, 63, 6183–6191. [Google Scholar] [CrossRef]
- Wang, J.; Wang, W.; Kollman, P.A.; Case, D.A. Automatic atom type and bond type perception in molecular mechanical calculations. J. Mol. Graph. Model. 2006, 25, 247–260. [Google Scholar] [CrossRef]
- Wang, J.; Wolf, R.M.; Caldwell, J.W.; Kollman, P.A.; Case, D.A. Development and testing of a general amber force field. J. Comput. Chem. 2004, 25, 1157–1174. [Google Scholar] [CrossRef]
- Jorgensen, W.L.; Chandrasekhar, J.; Madura, J.D.; Impey, R.W.; Klein, M.L. Comparison of simple potential functions for simulating liquid water. J. Chem. Phys. 1983, 79, 926–935. [Google Scholar] [CrossRef]
- Parrinello, M.; Rahman, A. Polymorphic transitions in single crystals: A new molecular dynamics method. J. Appl. Phys. 1981, 52, 7182–7190. [Google Scholar] [CrossRef]


| Method | Model ID | Accuracy | RMSE (%RPC) |
|---|---|---|---|
| Logistic Regression (L2) | LR-I | 0.81 | 28.6 |
| Logistic Regression (L1) | LR-II | 0.78 | 28.0 |
| Logistic Regression (ElasticNet) | LR-III | 0.86 | 22.6 |
| Logistic Regression (No Regularization) | LR-IV | 0.81 | 28.6 |
| XGBoost (Standard) | XG-I | 0.78 | 37.6 |
| XGBoost (L2 Regularization) | XG-II | 0.78 | 37.6 |
| XGBoost (L1 Regularization) | XG-III | 0.73 | 32.6 |
| XGBoost (ElasticNet—L1 and L2) | XG-IV | 0.73 | 34.5 |
| Model | Model ID | Slope | Intercept |
|---|---|---|---|
| Logistic Regression (L2) | LR-I | −0.071 | 4.265 |
| Logistic Regression (L1) | LR-II | −0.068 | 4.152 |
| Logistic Regression (ElasticNet) | LR-III | −0.074 | 4.041 |
| Logistic Regression (No Regularization) | LR-IV | −0.071 | 4.265 |
| XGBoost (Standard) | XG-I | −0.075 | 4.021 |
| XGBoost (L2 Regularization) | XG-II | −0.075 | 4.021 |
| XGBoost (L1 Regularization) | XG-III | −0.085 | 4.353 |
| XGBoost (ElasticNet—L1 and L2) | XG-IV | −0.079 | 4.117 |
Disclaimer/Publisher’s Note: The statements, opinions and data contained in all publications are solely those of the individual author(s) and contributor(s) and not of MDPI and/or the editor(s). MDPI and/or the editor(s) disclaim responsibility for any injury to people or property resulting from any ideas, methods, instructions or products referred to in the content. |
© 2025 by the authors. Licensee MDPI, Basel, Switzerland. This article is an open access article distributed under the terms and conditions of the Creative Commons Attribution (CC BY) license (https://creativecommons.org/licenses/by/4.0/).
Share and Cite
Boi, S.; Puxeddu, S.; Delogu, I.; Farci, D.; Piano, D.; Manzin, A.; Ceccarelli, M.; Angius, F.; Scorciapino, M.A.; Milenkovic, S. Seeking Correlation Among Porin Permeabilities and Minimum Inhibitory Concentrations Through Machine Learning: A Promising Route to the Essential Molecular Descriptors. Molecules 2025, 30, 1224. https://doi.org/10.3390/molecules30061224
Boi S, Puxeddu S, Delogu I, Farci D, Piano D, Manzin A, Ceccarelli M, Angius F, Scorciapino MA, Milenkovic S. Seeking Correlation Among Porin Permeabilities and Minimum Inhibitory Concentrations Through Machine Learning: A Promising Route to the Essential Molecular Descriptors. Molecules. 2025; 30(6):1224. https://doi.org/10.3390/molecules30061224
Chicago/Turabian StyleBoi, Sara, Silvia Puxeddu, Ilenia Delogu, Domenica Farci, Dario Piano, Aldo Manzin, Matteo Ceccarelli, Fabrizio Angius, Mariano Andrea Scorciapino, and Stefan Milenkovic. 2025. "Seeking Correlation Among Porin Permeabilities and Minimum Inhibitory Concentrations Through Machine Learning: A Promising Route to the Essential Molecular Descriptors" Molecules 30, no. 6: 1224. https://doi.org/10.3390/molecules30061224
APA StyleBoi, S., Puxeddu, S., Delogu, I., Farci, D., Piano, D., Manzin, A., Ceccarelli, M., Angius, F., Scorciapino, M. A., & Milenkovic, S. (2025). Seeking Correlation Among Porin Permeabilities and Minimum Inhibitory Concentrations Through Machine Learning: A Promising Route to the Essential Molecular Descriptors. Molecules, 30(6), 1224. https://doi.org/10.3390/molecules30061224