Article

Differential Analysis of Anthocyanins in Red and Yellow Hawthorn (Crataegus pinnatifida) Peel Based on Ultra-High Performance Liquid Chromatography-Electrospray Ionization Tandem Mass Spectrometry

1
Hebei Province Yanshan Agriculture Characteristic Industry Technology Research Institute, Hebei Normal University of Science and Technology, Qinhuangdao 066004, China
2
Hebei Key Laboratory of Horticultural Germplasm Excavation and Innovative Utilization, Hebei Normal University of Science and Technology, Qinhuangdao 066600, China
3
Hebei Higher Institute Application Technology Research and Development Center of Horticultural Plant Biological Breeding, Qinhuangdao 066004, China
4
State Key Laboratory of Tree Genetics and Breeding, Key Laboratory of Tree Breeding and Cultivation of State Forestry and Grassland Administration, Research Institute of Forestry, Chinese Academy of Forestry, Beijing 100091, China
*
Author to whom correspondence should be addressed.
Molecules 2025, 30(5), 1149; https://doi.org/10.3390/molecules30051149
Submission received: 18 January 2025 / Revised: 26 February 2025 / Accepted: 27 February 2025 / Published: 3 March 2025

Abstract

:
Anthocyanins constitute the primary pigment components in hawthorn (Crataegus pinnatifida) peel, yet their specific composition and concentration profiles remain poorly characterized. This study employed ultra-performance liquid chromatography–electrospray ionization–tandem mass spectrometry (UPLC-ESI-MS/MS)-based metabolomics to systematically compare anthocyanin profiles between red-peel (CPR) and yellow-peel (CPY) hawthorn cultivars. Our analysis identified 26 anthocyanin metabolites in CPR and 24 in CPY, with cyanidin-3-O-galactoside and cyanidin-3-O-arabinoside being the predominant compounds in both. Multivariate analysis revealed seven significantly differential metabolites, including cyanidin-3-O-galactoside, cyanidin-3-O-arabinoside, pelargonidin-3-O-galactoside, pelargonidin-3-O-glucoside, pelargonidin-3-O-arabinoside, and peonidin-3-O-galactoside. Notably, all the differential metabolites exhibited reductions in CPY compared to CPR. Chromatic analysis demonstrated that CPR possessed highly significantly lower hue angle values (hab) than CPY (47.7093 ± 4.1706, 83.6427 ± 1.4604, p < 0.01), showing strong negative correlations with key anthocyanins. These findings enhance the scientific understanding of anthocyanin biosynthesis in hawthorn peel and provide a certain reference for the development and utilization of anthocyanins in hawthorn peel.

1. Introduction

The genus Crataegus (Rosaceae), commonly known as hawthorn, comprises approximately 1000 species distributed across Europe, North America, and East Asia [1]. This genus has gained recognition as a valuable source for natural pigment extraction and antioxidant-rich functional food development [2]. Among the 12 species and six varieties native to China, C. pinnatifida Bge. var. major N.E.Br. (Chinese hawthorn) dominates commercial cultivation. While primarily consumed fresh or processed, its peel exhibits significant anthocyanidin accumulation, with most cultivars displaying red pigmentation and rare occurrences of yellow/orange phenotypes [3,4].
Anthocyanidins, the glycosylated precursors of anthocyanins, encompass six major aglycones: cyanidin, delphinidin, peonidin, pelargonidin, malvidin, and petunidin [5,6]. These water-soluble pigments typically conjugate with glucose, arabinose, or galactose via O-glycosidic bonds, conferring both chromatic properties (cyanidin/peonidin: purple-red; pelargonidin: red-orange; delphinidin/malvidin/petunidin: blue-purple) and potent antioxidant capacities [7]. Despite their pivotal role in peel pigmentation, previous phytochemical analyses of Chinese hawthorn have prioritized organic acids, triterpenoids, and flavonoids [8,9,10], with limited attention to anthocyanin profiling. Current knowledge remains restricted to red-peel cultivars, while the anthocyanin composition of yellow-peel variants persists as a scientific enigma.
Modern metabolomics employs chromatography–mass spectrometry platforms to achieve high-resolution metabolite profiling, combining separation efficiency, analytical precision, and environmental sustainability [11,12,13]. One anthocyanin, cyanidin-3-O-galactoside, was identified when Liu et al. [14] analyzed the phenolic compounds in Chinese hawthorn fruits using HPLC-DAD-ESI/MS (high-performance liquid chromatography–diode array detector–mass spectrometry). Moreover, Wang, et al. [15] isolated and identified cyanidin-3-O-β-galactoside and cyanidin-3-O-α-arabinoside of C. pinnatifida Bge. var. major fruits. Subsequently, cyanidin-3-O-galactoside and cyanidin-3-O-arabinoside were extracted from Chinese hawthorn peel and analyzed using HPLC-MS [16]. Eight anthocyanins were separated and identified in the fruit of C. pinnatifida Bge. var. major; this is by far the most complete study of anthocyanins in the species [17]. Wang et al. [18] revealed two additional derivatives—cyanidin-3-xyloside and cyanidin-3-O-glucoside—with broad-spectrum metabolomics at five developmental stages. Ultra-high-performance liquid chromatography–tandem mass spectrometry (UHPLC-MS/MS) is becoming increasingly widely used in the analysis of metabolites [19,20].
Notwithstanding these advancements, the systematic profiling of hawthorn peel anthocyanins—particularly comparative analyses between chromatic phenotypes—remains unaddressed. This study employs UPLC-ESI-MS/MS-based metabolomics to qualitatively and quantitatively analyze the major anthocyanins of red- and yellow-skinned C. pinnatifida Bge. var. major and to identify phenotype-specific differential anthocyanins. Our findings are helpful in revealing the reason for the coloration of hawthorn peel and in understanding the mechanism of the color change of hawthorn peel.

2. Results

2.1. Quality Control (QC) Analysis of Samples

The total ion chromatogram (TIC) profiles exhibited comprehensive ion intensity distribution across the analytical time course (Figure S1a). A mixed solution was used as the quality control (QC) sample; the QC sample was inserted every 10 test samples during the analysis process. High overlap of the QC-derived TIC curves (Figure S1b) confirmed excellent system stability and method reproducibility. The target anthocyanins showed well-resolved peaks in extracted ion chromatograms (Figure S1c). The method validation demonstrated limits of detection (LOD) and quantification (LOQ) ranging from 0.1909 to 0.5342 ng/g and 0.6592 to 1.8445 ng/g, respectively, meeting the stringent sensitivity requirements for plant metabolite analysis.

2.2. Qualitative and Quantitative Analysis of Anthocyanin

A total of 26 anthocyanin metabolites in six categories were detected in CPR and CPY, including cyanidin derivatives (n = 4), delphinidin derivatives (n = 6), malvidin derivatives (n = 2), pelargonidin derivatives (n = 6), peonidin derivatives (n = 4), and petunidin derivatives (n = 4) (Table 1). Ten compounds were authenticated using reference standards: cyanidin-3-O-galactoside, cyanidin-3-O-arabinoside, cyanidin-3-O-(6-O-malonyl-β-D-glucoside), delphinidin-3-O-galactoside, malvidin-3-O-arabinoside, malvidin-3-O-galactoside, pelargonidin-3-O-glucoside, peonidin-3-O-glucoside, peonidin-3-O-arabinoside, and petunidin-3-O-glucoside. The remaining compounds were identified through spectral library matching (Maiwei Biotechnology Co., Ltd., Wuhan, China). The CPR-exclusive metabolites included pelargonidin-3-O-glucoside and pelargonidin-3-O-arabinoside. The total anthocyanin content differed significantly between CPR (2411.76 μg/g) and CPY (53.967 μg/g), with cyanidin-3-O-galactoside (45.3-fold higher in CPR) and cyanidin-3-O-arabinoside (51.0-fold higher) being predominant in both cultivars.

2.3. Principal Component Analysis

Principal component analysis (PCA) is an unsupervised discriminant method that can evaluate the clustering relationship of red-peel (CPR) and yellow-peel (CPY) hawthorn samples. PCA analysis was performed on the anthocyanin metabolites of CPR and CPY (Figure 1). The samples in the same group were clustered together, and there were great differences between CPR and CPY, indicating that the samples within the group had good repeatability, the data of the samples were reliable, and the subsequent differential metabolite analysis could be performed. The scores of PC1 and PC2 were 70.27% and 13.67%, respectively. This result showed that the representative features of most metabolites were well aggregated.

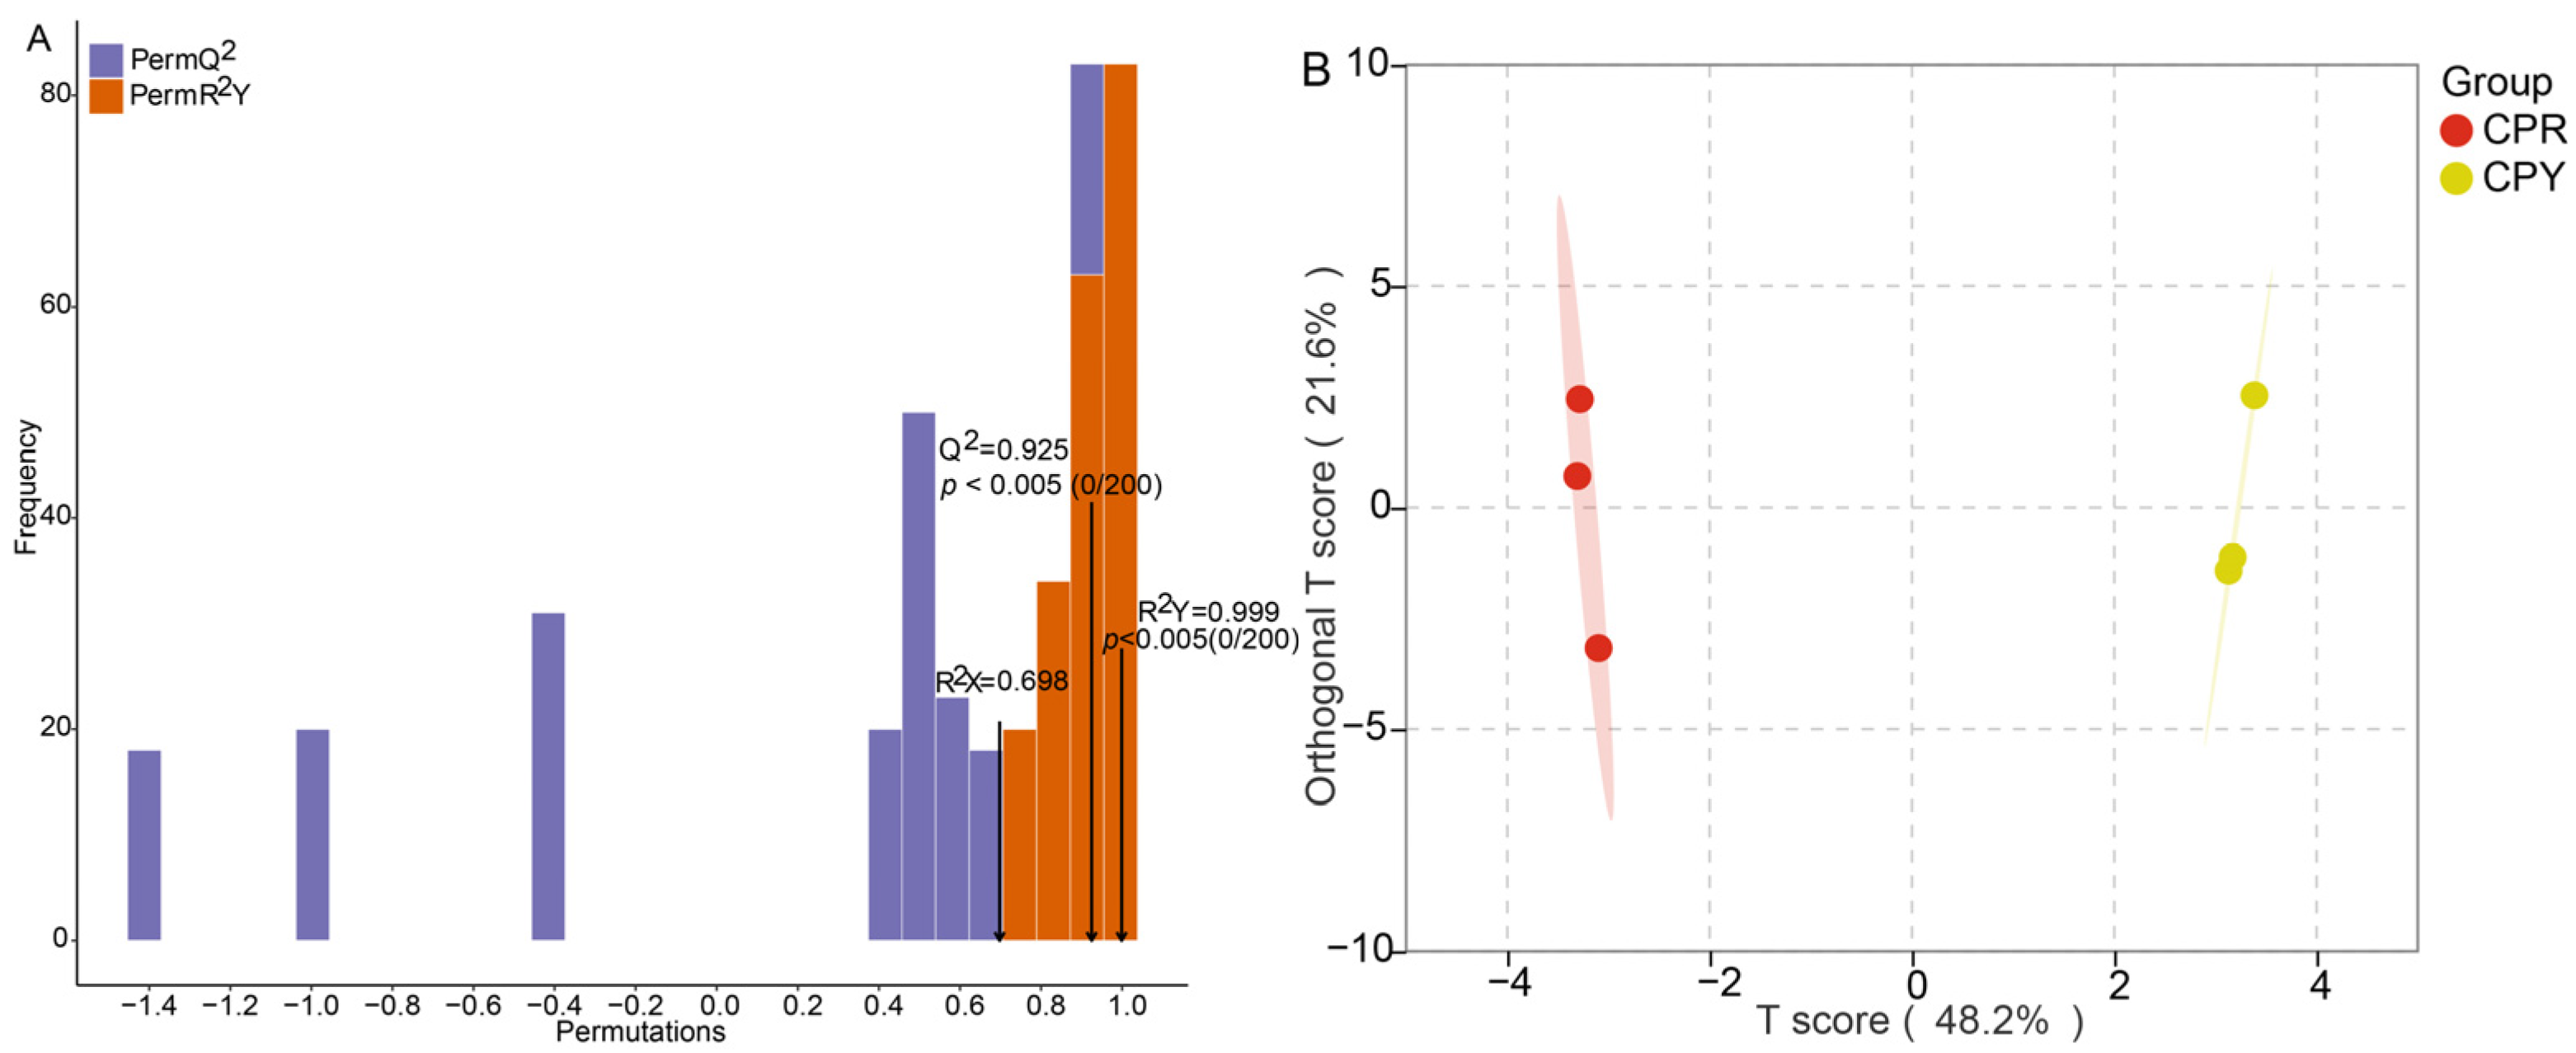
2.4. OPLS-DA Analysis and Permutation Test Analysis

Orthogonal partial least squares discriminant analysis (OPLS-DA) was also used to show the difference between CPR and CPY and to further screen differential metabolites. The results showed that the parameters R2X and R2Y of the OPLS-DA model were 0.698 and 0.999, respectively (Figure 2A), which indicated that the interpretation rate of the model was good. Q2 was 0.925, indicating that the prediction ability of the model was high. In the OPLS-DA model score plot, the T score of the principal component in the OSC (orthogonal signal correction) process was 48.2%, showing that the difference between the two groups was obvious. The orthogonal T score was 21.6%, indicating that the difference within the group was small (Figure 2B). The permutation test results showed that as the replacement retention decreased, R2 and Q2 decreased, and the regression line showed an upward trend, which indicated that the model did not have overfitting and was effective and repeatable (Figure 3).

2.5. Analysis of Differential Anthocyanin Metabolites

Differential anthocyanin metabolites were screened according to the following criteria: VIP (variable importance in project value) ≥ 1, p-value ≤ 0.05, and fold change (FC) ≥ 2 or fold change ≤ 0.5. Cyanidin-3-O-galactoside, cyanidin-3-O-arabinoside, pelargonidin-3-O-galactoside, pelargonidin-3-O-glucoside, pelargonidin-3-arabinoside, peonidin-3-O-galactoside and peonidin-3-O-arabinoside were identified as differential metabolites. Compared with CPR, all the differential metabolites in CPY showed a downward trend (Table 2).

2.6. Correlation Analysis Between Anthocyanin Differential Metabolites and Hue Angle

CPR displayed significantly lower hue angles (47.7093 ± 4.1706°) compared to CPY (83.6427 ± 1.4604°, p < 0.01), correlating with visual phenotypes (Table 3). Strong negative correlations (r = −0.9023 to −0.9955) between hue angle and differential anthocyanin content were observed (Table 4), confirming that anthocyanin accumulation drives red pigmentation intensity.

3. Discussion

Traditional approaches for identifying bioactive components in Crataegus species have primarily relied on HPLC systems coupled with detectors such as DAD, MS, and photodiode arrays (PAD) [21,22,23,24]. Anthocyanins, which are critical pigments responsible for the coloration of hawthorn fruit peel, remain under-characterized in these studies, with significant discrepancies existing across reported identifications. For instance, Zorzi et al. [21] identified delphinidin-hexoside in Crataegus monogyna Jacq. using HPLC-DAD-ESI-HRMS, while Simirgiotis [23] detected four anthocyanin derivatives in the same species via HPLC-DAD-MS. To date, the most comprehensive profiling was achieved using HPLC-DAD-ESI/MS in C. pinnatifida Bge. var. major N.E.Br., revealing eight distinct anthocyanins [17], the highest number reported to date.
UHPLC-ESI-MS/MS has emerged as a cornerstone technology for targeted metabolomic profiling, particularly in fruit phytochemical characterization [18,25,26]. Recent applications of this platform include the identification of 17 anthocyanins in Kadsura coccinea (Lem.) A. C. Smith [27] and 26 distinct anthocyanin derivatives in cashew apple (Anacardium occidentale) [28]. Aligning with these advances, our LC-MS analysis revealed 26 anthocyanin metabolites in C. pinnatifida red-fruited varieties (CPR) and 24 in their yellow-fruited counterparts (CPY). Notably, 24 anthocyanins were common to both varieties, with pelargonidin-3-O-glucoside and pelargonidin-3-O-arabinoside being uniquely detected in CPR.
Previous studies on C. pinnatifida have identified diverse anthocyanin profiles. Liu et al. [14] quantified cyanidin-3-O-galactoside in red hawthorn dry weight (0.06–0.66 mg/g), while Liu et al. [17] isolated eight anthocyanins, including cyanidin-3,5-dihexoside, pelargonidin-3-rutinoside, cyanidin-3-galactoside, cyanidin-3-glucoside, cyanidin-3-rutinoside, cyanidin-3-arabinoside, pelargonidin-3-glucoside, and malvidin-3-glucoside. Recent work by Wang et al. [18] further confirmed cyanidin-3-xyloside and cyanidin-3-O-glucoside. Some anthocyanins were also identified in other hawthorn fruits. C. monogyna Jacq. contains acylated derivatives, such as malvidin-3-O-(4′′′coumaroyl)-rutinose-5-O-glucose [23], while C. monogyna fruits exhibit cyanidin-O-hexoxide and cyanidin-3-O-glucoside and peonidin-O-hexoxide [24]. Notably, this study represents the first comprehensive anthocyanin analysis of yellow Chinese hawthorn, revealing only two undetected anthocyanins compared to the red varieties. Furthermore, delphinidin and petunidin derivatives were newly identified in Chinese hawthorn.
Cyanidin-3-O-galactoside emerged as the predominant anthocyanin in both CPR and CPY, constituting 98.2% and 96.7% of total anthocyanins when combined with cyanidin-3-O-arabinoside. This aligns with Liu et al.’s [17] findings in C. pinnatifida and parallels observations in red-skinned C. monogyna, where cyanidin-3-O-glucoside predominates [24]. Anthocyanin absence in yellow C. azarolus [29] and distinct profiles in black-skinned C. maximowiczii [30] further underscore the species-specific patterns. The cyanidin dominance (80% total anthocyanins) in apples [31] suggests conserved metabolic pathways across Rosaceae.
Quantitative analysis revealed that CPR’s total anthocyanin content (TAC) exceeded that of CPY by 44.69-fold, which is consistent with Qi et al.’s [32] report of ≥20-fold differences between red and yellow hawthorn cultivars. It has been reported that the reduction in anthocyanins leads to a change in the color of the flowers from coral to pink, then to yellow [33,34]. The positive values of a* indicate red, and the positive values of b* indicate yellow. For hue angle, zero degrees (0°) represents red and 90° represents yellow [35,36]. Thus, this TAC disparity directly correlates with peel coloration, as evidenced by the colorimetric parameters: CPR exhibited 4.43× higher a* (redness) and 1.83× lower b* (yellowness) versus CPY. Hue angle (hab) values further confirmed phenotypic differences (CPR: 47.7 vs. CPY: 83.6), with significant negative correlations between hab and differential anthocyanin metabolites (Table 4). These findings align with apricot coloration studies [37] and anthocyanin degradation patterns in strawberries [38].
Multivariate analysis (PCA/OPLS-DA) effectively distinguished CPR and CPY metabolomes (Figure 1 and Figure 2B). The screening criteria were slightly different in the studies. Differential metabolites were mined by p < 0.05 and VIP > 1 [39]. In another report, p ≤ 0.05 and fold change ≥ 2 were applied [40]. Differential metabolites were screened using stringent criteria (VIP ≥ 1, p ≤ 0.05, FC ≤ 0.5), identifying seven key anthocyanins: cyanidin-3-O-galactoside, cyanidin-3-O-arabinoside, pelargonidin-3-O-galactoside, pelargonidin-3-O-glucoside, pelargonid-in-3-O-arabinoside, peonidin-3-O-galactoside, and peonidin-3-O-arabinoside. All the metabolites showed reduced accumulation in CPY. Notably, despite cyanidin-3-O-galactoside predominance in CPY, its chromatic expression may be masked by co-occurring flavonoids [35,41] through co-pigmentation effects. Additional factors, including pH fluctuations, metal ion interactions [42], and environmental conditions [43], likely contribute to coloration differences, highlighting the need for process/storage condition studies.

4. Materials and Methods

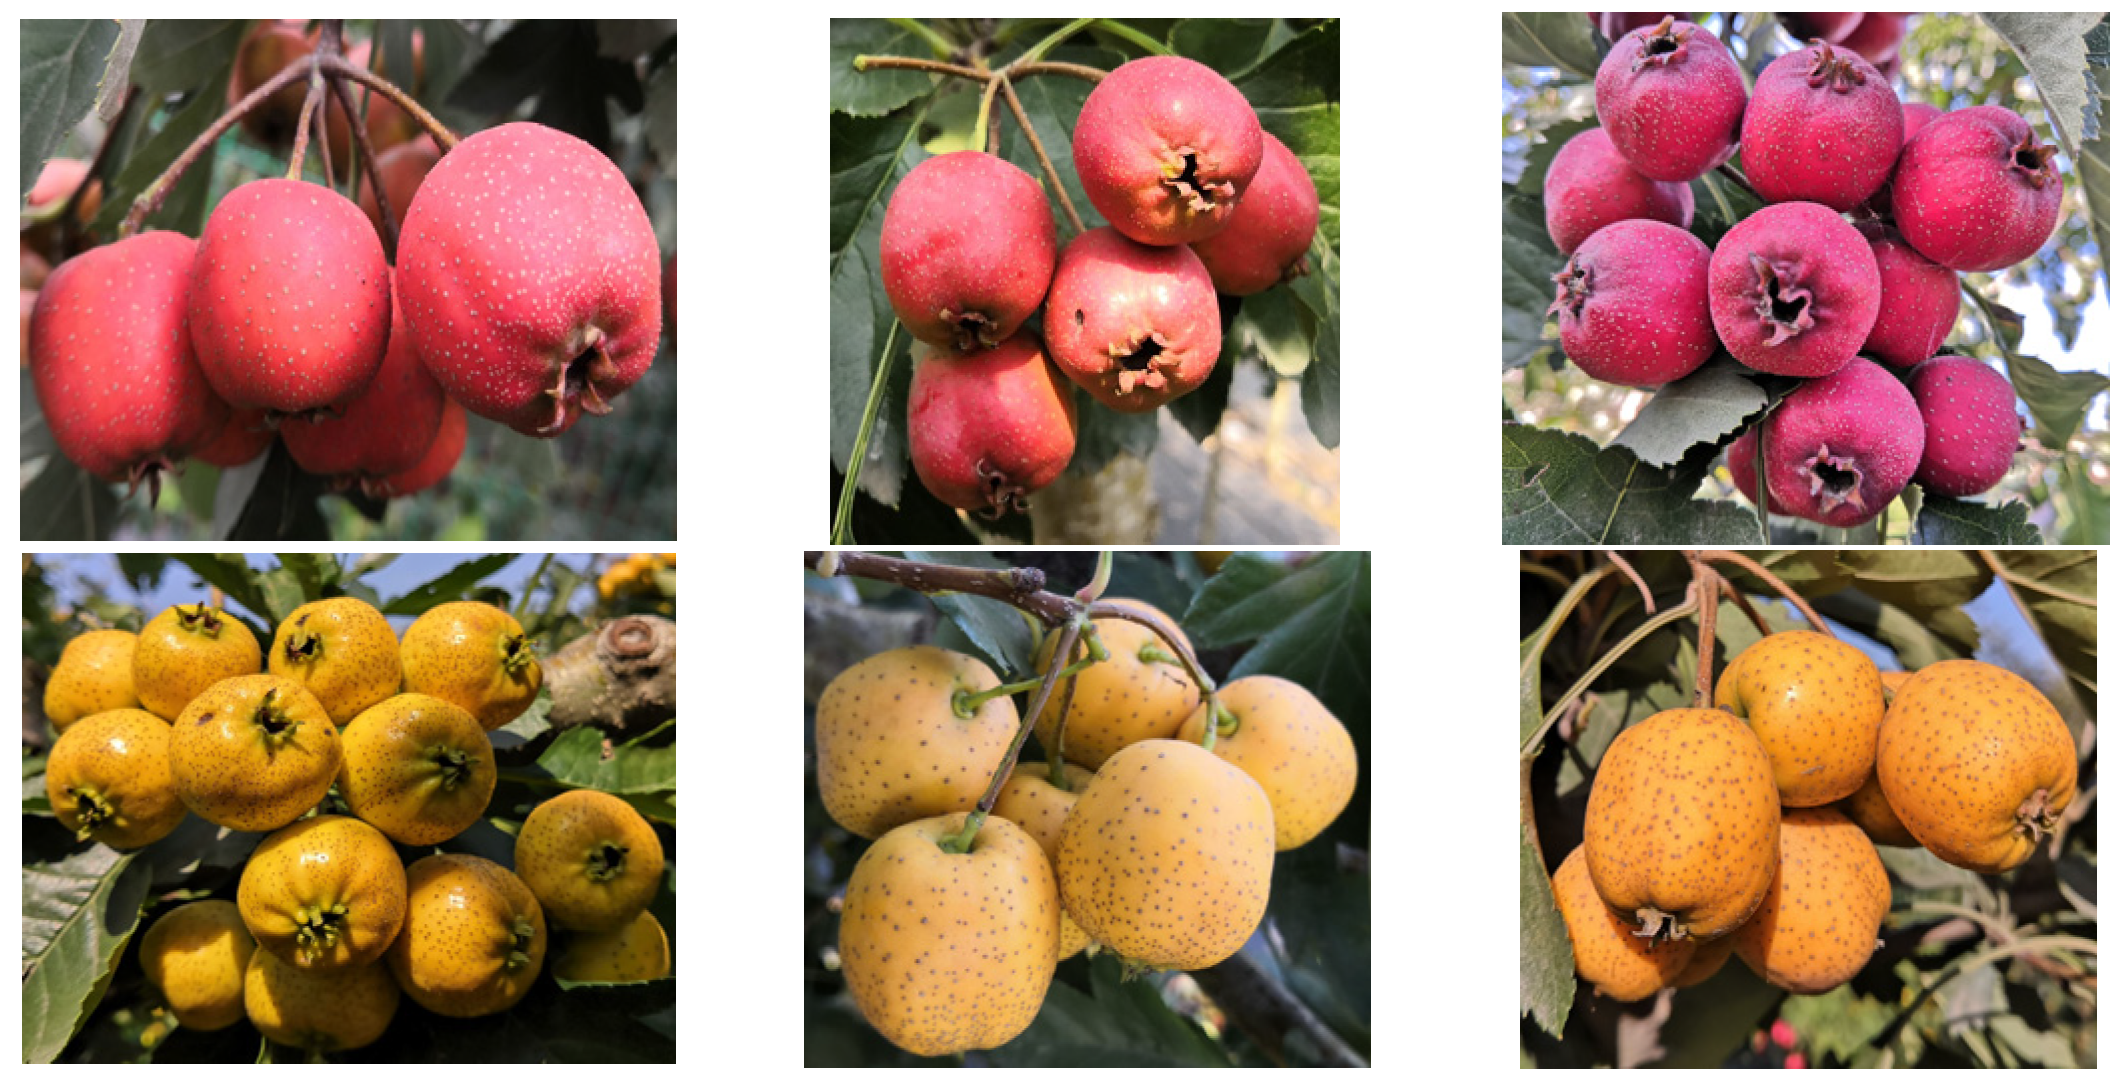
4.1. Plant Materials and Color Parameters Determination

Six elite hybrid progeny with red peel (designated CPR1, CPR2, CPR3) and yellow peel (CPY1, CPY2, CPY3) were selected from crosses between C. pinnatifida Bge. var. major ‘Damianqiu’ and C. pinnatifida Bge. var. major ‘Dahuangmianzha’ (Figure 4). These seedlings were uniformly grafted onto ‘Damianqiu’ rootstocks in 2017 and initiated fruiting by 2021. All the grafted plants were cultivated in identical plots under standardized horticultural management. At 140 days after anthesis in 2022, ten fully illuminated mature fruits were harvested from the upper canopy of each tree for color parameter analysis and anthocyanin quantification. Five fruits per tree were subjected to color measurements, with three technical replicates per fruit. The remaining five fruits per plant were pooled for anthocyanin extraction.
Peel color indices (a* and b*) at the equatorial region were recorded using an X-Rite SP60 portable spectrophotometer under ambient natural illumination. Hue angle (hab) was calculated as hab = arctan (b*/a*) [44].

4.2. Extraction of Hawthorn Peel Anthocyanin

The fruits were peeled and frozen in liquid nitrogen for the determination of anthocyanin metabolites. First, freeze-dried peel was ground into powder by a Mixer mill mm 400 (30 Hz, 1.5 min, Retsch, Haan, Germany); then, 50mg of peel powder was dissolved in 500 μL of extracting solution (methanol/water/hydrochloric acid = 500:500:1 (V/V/V)). The extract was sonicated at 4 °C for 5 min (KQ5200E, Kunshan Shumei, Kunshan, China) and centrifuged at 12,000 rpm for 3 min (5424R, Eppendorf, Hamburg, Germany). The supernatant was filtered through 0.22 μm nylon membranes (Doudian, Shenzhen, China) prior to LC-MS/MS analysis.

4.3. UHPLC and ESI-MS/MS Conditions

The extracts were detected and analyzed using an UHPLC-ESI-MS/MS system (UPLC, ExionLC™ AD, Framingham, MA, USA; MS, SCIEX OTRAP 6500+, Framingham, MA, USA). An Acquity beh C18 chromatographic column (1.7 µm, 2.1 mm × 100 mm) was used. Ultrapure water containing 0.1% formic acid (Sigma-Aldrich, St Louis, MO, USA) and methanol with 0.1% formic acid (Merck, Darmstadt, Germany) were used as mobile phases A and B, respectively. Elution gradient: At 0.00 min, the proportion of phase B was 5%, increased to 50% at 6.00 min, further increased to 95% at 12.00 min, maintained for 2 min, decreased to 5% at 14 min, and equilibrated for 2 min. The column temperature was 40 °C, and the injection volume was 2 μL.
ESI+ was used as an ion source with a positive ion mode; the temperature was set at 550 °C, the ion spray voltage (IS) was 5500 V, and the curtain gas was 35 psi. Anthocyanins were quantified via multiple reaction monitoring (MRM), with optimized declustering potentials (DP) and collision energies (CE) for target ion pairs (Table 1). Parent ions were fragmented in the collision cell, and characteristic product ions were selected for quantification.

4.4. Anthocyanin Content Calculation and Statistical Analysis

There were 11 standards in total, including cyanidin-3-O-galactoside, cyanidin-3-O-arabinoside, cyanidin-3-O-(6-O-malonyl-beta-D-glucoside), delphinidin-3-O-galactoside, malvidin-3-O-arabinoside, malvidin-3-O-galactoside, pelargonidin-3-O-glucoside, peonidin-3-O-glucoside, peonidin-3-O-arabinoside, petunidin-3-O-glucoside, and delphinidin-3,5-O-diglucoside. All the standards (isoReag, Shanghai, China) were first prepared into a 1mg/mL stock solution with 50% methanol and stored at −20 °C. Before analysis, the working solution was diluted with 50% methanol to 0.01 ng/mL, 0.02 ng/mL, 0.05 ng/mL, 0.1 ng/mL, 0.5 ng/mL, 1 ng/mL, 5 ng/mL, 10 ng/mL, 50 ng/mL, 100 ng/mL, 500 ng/mL, 1000 ng/mL, 2000 ng/mL, and 5000 ng/mL. Then, the standard curve was drawn with the standard concentration as the abscissa and the peak area as the ordinate. With reference to the retention time of the standard, the mass spectrometry data were qualitatively analyzed based on the self-built database (Maiwei Biotechnology Co., Ltd., Wuhan, China). Analyst 1.6.3 (Sciex, Framingham, MA, USA) was used for data analysis and, MultiQuant 3.0.3 (Sciex) further performed integral correction on the mass spectrometry peaks to ensure qualitative and quantitative accuracy. Afterwards, it was combined with the standard curve, and the peak area of the component was used to obtain the concentration; then, the formula for quantitative analysis was as follows: (μg/g) = C × V/1,000,000/m. (C: concentration value (μg/mL); V: the volume of the solution used for extraction (mL); m: sample mass (g)).
The limit of quantification (LOQ) and the limit of detection (LOD) were calculated using the standard. Their formulas were LOD = kσ and LOQ = 10σ [45], respectively. The standards were prepared into a 1ng/mL solution, and detection was repeated 10 times. Then, the standard deviation (σ) of the actual measured concentration was calculated. According to the degree of freedom (n) = 9 and p (1) = 0.01 in the t-test critical value table, the k value was 2.821.
Principal component analysis (PCA) and orthogonal partial least-squares discriminant analysis (OPLS-DA) were implemented using Stats 3.5.1 and Metabo Analyst R 1.0.1 in R 3.5.1. Model validity was confirmed through 200 permutation tests. VIP, p-value, and fold change were combined to select the differential metabolites.

5. Conclusions

A total of 26 anthocyanin metabolites were identified through UHPLC-ESI-MS/MS analysis, with complete detection (26/26) in CPR and partial detection (24/26) in CPY. Both accessions exhibited identical dominant anthocyanin profiles, with cyanidin-3-O-galactoside and cyanidin-3-O-arabinoside constituting the most abundant components in peel tissues. Comparative analysis revealed seven differentially accumulated metabolites: cyanidin-3-O-galactoside, cyanidin-3-O-arabinoside, pelargonidin-3-O-galactoside, pelargonidin-3-O-glucoside, pelargonidin-3-O-arabinoside, and peonidin-3-O-galactoside. Notably, all the differential metabolites displayed downregulation in CPY compared to CPR. This study expands the documented anthocyanin repertoire of C. pinnatifida fruits. However, comprehensive characterization of hawthorn peel anthocyanins requires further investigation with expanded sample sizes and enhanced metabolite coverage.

Supplementary Materials

The following supporting information can be downloaded at: https://www.mdpi.com/article/10.3390/molecules30051149/s1, Figure S1: Ion chromatogram. (a). The total ion chromatogram (TIC) of quality control (QC) sample. (b). The overlap diagram of the TIC plot from QC mass spectrometry at different times. (c). The multipeak detection plot shows the extracted ion chromatogram of anthocyanins. The abscissa represents the retention time (Time, min), and the ordinate represents the ion current intensity (Intensity, cps).

Author Contributions

D.W. and F.L. contributed to the study conceptualization. Data curation and investigation were performed by B.C., G.Y. and Y.M. Validation was performed by L.Y. Study materials were provided by J.Z. The original draft of the manuscript was written by D.W., and all authors commented on previous versions of the manuscript. All authors have read and agreed to the published version of the manuscript.

Funding

This work was funded by National Forestry and Grassland Genetic Resource Center (2005DKA21003); Hebei Province Yanshan Agriculture Characteristic Industry Technology Research Institute (PT2024-10); Hebei Agriculture Research System (HBCT2024190202).

Institutional Review Board Statement

Not applicable.

Informed Consent Statement

Not applicable.

Data Availability Statement

The datasets used and/or analyzed during the current study are available from the corresponding author on reasonable request.

Conflicts of Interest

The authors declare no conflicts of interest.

References

  1. Edwards, J.E.; Brown, P.N.; Talent, N.; Dickinson, T.A.; Shipley, P.R. A review of the chemistry of the genus Crataegus. Phytochemistry 2012, 79, 5–26. [Google Scholar] [CrossRef]
  2. Martinelli, F.; Perrone, A.; Yousefi, S.; Papini, A.; Castiglione, S.; Guarino, F.; Cicatelli, A.; Aelaei, M.; Arad, N.; Gholami, M.; et al. Botanical, Phytochemical, Anti-Microbial and Pharmaceutical Characteristics of Hawthorn (Crataegus monogyna Jacq.), Rosaceae. Molecules 2021, 26, 7266. [Google Scholar] [CrossRef]
  3. Özcan, M.; Hacıseferoğulları, H.; Marakoğlu, T.; Arslan, D. Hawthorn (Crataegus spp.) fruit: Some physical and chemical properties. J. Food Eng. 2005, 69, 409–413. [Google Scholar] [CrossRef]
  4. Zhang, S.-Y.; Sun, X.-L.; Yang, X.-L.; Shi, P.-L.; Xu, L.-C.; Guo, Q.-M. Botany, traditional uses, phytochemistry and pharmacological activity of Crataegus pinnatifida (Chinese hawthorn): A review. J. Pharm. Pharmacol. 2022, 74, 1507–1545. [Google Scholar] [CrossRef]
  5. Tanaka, Y.; Sasaki, N.; Ohmiya, A. Biosynthesis of plant pigments: Anthocyanins, betalains and carotenoids. Plant J. 2008, 54, 733–749. [Google Scholar] [CrossRef]
  6. Alappat, B.; Alappat, J. Anthocyanin Pigments: Beyond Aesthetics. Molecules 2020, 25, 5500. [Google Scholar] [CrossRef]
  7. Glover, B.J.; Martin, C. Anthocyanins. Curr. Biol. 2012, 22, R147–R150. [Google Scholar] [CrossRef]
  8. Li, C.-R.; Hou, X.-H.; Xu, Y.-Y.; Gao, W.; Li, P.; Yang, H. Manual annotation combined with untargeted metabolomics for chemical characterization and discrimination of two major crataegus species based on liquid chromatography quadrupole time-of-flight mass spectrometry. J. Chromatogr. A 2020, 1612, 460628. [Google Scholar] [CrossRef]
  9. Wu, J.; Peng, W.; Qin, R.; Zhou, H. Crataegus pinnatifida: Chemical constituents, pharmacology, and potential applications. Molecules 2014, 19, 1685–1712. [Google Scholar] [CrossRef]
  10. Cui, T.; Li, J.Z.; Kayahara, H.; Ma, L.; Wu, L.X.; Nakamura, K. Quantification of the polyphenols and triterpene acids in chinese hawthorn fruit by high-performance liquid chromatography. J. Agric. Food Chem. 2006, 54, 4574–4581. [Google Scholar] [CrossRef]
  11. Allwood, J.W.; De Vos, R.C.; Moing, A.; Deborde, C.; Erban, A.; Kopka, J.; Goodacre, R.; Hall, R.D. Plant metabolomics and its potential for systems biology research background concepts, technology, and methodology. Methods Enzymol. 2011, 500, 299–336. [Google Scholar] [CrossRef]
  12. Aharoni, A.; Goodacre, R.; Fernie, A.R. Plant and microbial sciences as key drivers in the development of metabolomics research. Proc. Natl. Acad. Sci. USA 2023, 120, e2217383120. [Google Scholar] [CrossRef]
  13. Chacko, S.; Haseeb, Y.B.; Haseeb, S. Metabolomics Work Flow and Analytics in Systems Biology. Curr. Mol. Med. 2022, 22, 870–881. [Google Scholar] [CrossRef]
  14. Liu, P.; Yang, B.; Kallio, H. Characterization of phenolic compounds in Chinese hawthorn (Crataegus pinnatifida Bge. var. major) fruit by high performance liquid chromatography-electrospray ionization mass spectrometry. Food Chem. 2010, 121, 1188–1197. [Google Scholar] [CrossRef]
  15. Wang, J.; Yan, R.; Yang, B. Anthocyanins from the fruit of Crataegus pinnatifida Bge. var. major N. E. Br. Lishizhen Med. Mater. Medica Res. 2015, 26, 42–43. [Google Scholar] [CrossRef]
  16. Wu, P. Study on Preparation and Biological Activities of Anthocyanin Extract from the Peel of Hawthorn Fruit. Master’s Thesis, Anhui University of Chinese Medicine, Hefei, China, 2018. [Google Scholar]
  17. Liu, S.; Chang, X.; Liu, X.; Shen, Z. Effects of pretreatments on anthocyanin composition, phenolics contents and antioxidant capacities during fermentation of hawthorn (Crataegus pinnatifida) drink. Food Chem. 2016, 212, 87–95. [Google Scholar] [CrossRef]
  18. Wang, Y.; Hao, R.; Guo, R.; Nong, H.; Qin, Y.; Dong, N. Integrative Analysis of Metabolome and Transcriptome Reveals Molecular Insight into Metabolomic Variations during Hawthorn Fruit Development. Metabolites 2023, 13, 423. [Google Scholar] [CrossRef]
  19. Di Paola-Naranjo, R.D.; Sánchez-Sánchez, J.; González-Paramás, A.M.; Rivas-Gonzalo, J.C. Liquid chromatographic-mass spectrometric analysis of anthocyanin composition of dark blue bee pollen from Echium plantagineum. J. Chromatogr. A 2004, 1054, 205–210. [Google Scholar] [CrossRef]
  20. Swartz, M.E. UPLC™: An Introduction and Review. J. Liq. Chromatogr. Relat. Technol. 2005, 28, 1253–1263. [Google Scholar] [CrossRef]
  21. Zorzi, M.; Gai, F.; Medana, C.; Aigotti, R.; Peiretti, P.G. Identification of Polyphenolic Compounds in Edible Wild Fruits Grown in the North-West of Italy by Means of HPLC-DAD-ESI HRMS. Plant Foods Hum. Nutr. 2020, 75, 420–426. [Google Scholar] [CrossRef]
  22. Wu, P.; Li, F.; Zhang, J.; Yang, B.; Ji, Z.; Chen, W. Phytochemical compositions of extract from peel of hawthorn fruit, and its antioxidant capacity, cell growth inhibition, and acetylcholinesterase inhibitory activity. BMC Complement. Altern. Med. 2017, 17, 151. [Google Scholar] [CrossRef]
  23. Simirgiotis, M.J. Antioxidant Capacity and HPLC-DAD-MS Profiling of Chilean Peumo (Cryptocarya alba) Fruits and Comparison with German Peumo (Crataegus monogyna) from Southern Chile. Molecules 2013, 18, 2061–2080. [Google Scholar] [CrossRef]
  24. Tamayo-Vives, C.; García-Herrera, P.; Sánchez-Mata, M.C.; Cámara-Hurtado, R.M.; Pérez-Rodríguez, M.L.; Aceituno, L.; Pardo-de-Santayana, M.; Días, M.I.; Barros, L.; Morales, P. Wild Fruits of Crataegus monogyna Jacq. and Sorbus aria (L.) Crantz: From Traditional Foods to Innovative Sources of Pigments and Antioxidant Ingredients for Food Products. Foods 2023, 12, 2427. [Google Scholar] [CrossRef]
  25. Ni, M.; Chen, J.; Fu, M.; Li, H.; Bu, S.; Hao, X.; Gu, W. UPLC-ESI-MS/MS-Based Analysis of Various Edible Rosa Fruits Concerning Secondary Metabolites and Evaluation of Their Antioxidant Activities. Foods 2024, 13, 796. [Google Scholar] [CrossRef]
  26. Wang, F.; Chen, L.; Chen, S.; Chen, H.; Liu, Y. Characterization of two closely related citrus cultivars using UPLC-ESI-MS/MS-based widely targeted metabolomics. PLoS ONE 2021, 16, e0254759. [Google Scholar] [CrossRef]
  27. Huang, D.; Ming, R.; Yao, S.; Li, L.; Huang, R.; Tan, Y. Identification of anthocyanins in the fruits of Kadsura coccinea using UPLC-MS/MS-based metabolomics. Biochem. Syst. Ecol. 2021, 98, 104324. [Google Scholar] [CrossRef]
  28. Huang, H.; Zhao, L.; Zhang, B.; Huang, W.; Zhang, Z.; An, B. Integrated analysis of the metabolome and transcriptome provides insights into anthocyanin biosynthesis of cashew apple. Food Res. Int. 2024, 175, 113711. [Google Scholar] [CrossRef]
  29. Mraihi, F.; Hidalgo, M.; de Pascual-Teresa, S.; Trabelsi-Ayadi, M.; Chérif, J.-K. Wild grown red and yellow hawthorn fruits from Tunisia as source of antioxidants. Arab. J. Chem. 2015, 8, 570–578. [Google Scholar] [CrossRef]
  30. Zhang, X.; Wang, J.; Li, P.; Sun, C.; Dong, W. Integrative metabolome and transcriptome analyses reveals the black fruit coloring mechanism of Crataegus maximowiczii C. K. Schneid. Plant Physiol. Biochem. 2023, 194, 111–121. [Google Scholar] [CrossRef]
  31. Treutter, D. Biosynthesis of phenolic compounds and its regulation in apple. Plant Growth Regul. 2001, 34, 71–89. [Google Scholar] [CrossRef]
  32. Qi, X.; Li, Z.; Xu, S. Relationship between soluble sugars and peel pigments in hawthorn fruit. J. Fruit Sci. 2005, 22, 81–83. [Google Scholar] [CrossRef]
  33. Guo, L.; Wang, Y.; da Silva, J.A.T.; Fan, Y.; Yu, X. Transcriptome and chemical analysis reveal putative genes involved in flower color change in Paeonia ‘Coral Sunset’. Plant Physiol. Biochem. 2019, 138, 130–139. [Google Scholar] [CrossRef]
  34. Luo, X.; Sun, D.; Wang, S.; Luo, S.; Fu, Y.; Niu, L.; Shi, Q.; Zhang, Y. Integrating full-length transcriptomics and metabolomics reveals the regulatory mechanisms underlying yellow pigmentation in tree peony (Paeonia suffruticosa Andr.) flowers. Hortic. Res. 2021, 8, 235. [Google Scholar] [CrossRef]
  35. Nguyen, L.L.P.; Baranyai, L.; Nagy, D.; Mahajan, P.V.; Zsom-Muha, V.; Zsom, T. Color analysis of horticultural produces using hue spectra fingerprinting. MethodsX 2021, 8, 101594. [Google Scholar] [CrossRef]
  36. McGuire, R.G. Reporting of Objective Color Measurements. HortScience 1992, 27, 1254–1255. [Google Scholar] [CrossRef]
  37. Ruiz, D.; Egea, J.; Gil, M.I.; Tomás-Barberán, F.A. Characterization and quantitation of phenolic compounds in new apricot (Prunus armeniaca L.) varieties. J. Agric. Food Chem. 2005, 53, 9544–9552. [Google Scholar] [CrossRef]
  38. Taghavi, T.; Patel, H.; Rafie, R. Extraction Solvents Affect Anthocyanin Yield, Color, and Profile of Strawberries. Plants 2023, 12, 1833. [Google Scholar] [CrossRef]
  39. Lan, L.; Huang, W.; Zhou, H.; Yuan, J.; Miao, S.; Mao, X.; Hu, Q.; Ji, S. Integrated Metabolome and Lipidome Strategy to Reveal the Action Pattern of Paclobutrazol, a Plant Growth Retardant, in Varying the Chemical Constituents of Platycodon Root. Molecules 2022, 27, 6902. [Google Scholar] [CrossRef]
  40. Du, S.; Wan, H.; Luo, J.; Duan, X.; Zou, Z. Metabolic profiling of Citrus maxima L. seedlings in response to cadmium stress using UPLC-QTOF-MS. Plant Physiol. Biochem. 2024, 214, 108920. [Google Scholar] [CrossRef]
  41. Zhang, Z.; Chang, Q.; Zhu, M.; Huang, Y.; Ho, W.K.; Chen, Z. Characterization of antioxidants present in hawthorn fruits. J. Nutr. Biochem. 2001, 12, 144–152. [Google Scholar] [CrossRef]
  42. Hong, Y.; Tang, X.; Huang, H.; Zhang, Y.; Dai, S. Transcriptomic analyses reveal species-specific light-induced anthocyanin biosynthesis in chrysanthemum. BMC Genom. 2015, 16, 202. [Google Scholar] [CrossRef]
  43. Yoshida, K.; Mori, M.; Kondo, T. Blue flower color development by anthocyanins: From chemical structure to cell physiology. Nat. Prod. Rep. 2009, 26, 884–915. [Google Scholar] [CrossRef]
  44. Yuan, B.; Guo, Y.; Liu, Z. The influence of light path length on the color of synthetic ruby. Sci. Rep. 2022, 12, 5943. [Google Scholar] [CrossRef]
  45. Li, W.; Morgan, M.K.; Graham, S.E.; Starr, J.M. Measurement of pyrethroids and their environmental degradation products in fresh fruits and vegetables using a modification of the quick easy cheap effective rugged safe (QuEChERS) method. Talanta 2016, 151, 42–50. [Google Scholar] [CrossRef]
Figure 1. PCA scores plot of CPR and CPY. The shaded area represents the 95% confidence interval.
Molecules 30 01149 g001
Figure 2. OPLS-DA analysis of CPR and CPY ((A) OPLS-DA verification plot of CPR and CPY; (B) OPLS-DA score plot of CPR and CPY, tthe shaded area represents the 95% confidence interval; ordinate and abscissa represent the scores of orthogonal and principal components in the OSC process, respectively).
Molecules 30 01149 g002
Figure 3. OPLS-DA permutation test of CPR and CPY. The X-axis represents the retention of permutation, while the Y-axis displays the values of R2Y and Q2. The two dashed lines correspond to the regression lines of R2Y and Q2, respectively.
Molecules 30 01149 g003
Figure 4. Phenotypic characterization of CPR (red peel) and CPY (yellow peel) accessions. Upper panel (left to right): CPR1, CPR2, CPR3; lower panel (left to right): CPY1, CPY2, CPY3.
Molecules 30 01149 g004
Table 1. Absolute quantification of anthocyanin results.
Anthocyanin MetaboliteRetention TimeRegression EquationPrecursor Ions
m/z
Characteristic Fragment m/zDPCECPR (μg/g)CPY (μg/g)Limits of Detection (ng/g)Limits of Quantification (ng/g)
Cyanidin-3-O-galactoside6.91y = 5424.31085x + 1862.34714(0.99881)449.1287.150322327.962 ± 435.075 Aa51.406 ± 30.260 Bb0.19090.6592
Cyanidin-3-O-arabinoside7.87y = 2.06939 × 10⁵x + 8.27387 × 10⁴ (0.99727)419.1287.1452540.410 ± 10.411 Aa0.792 ± 0.225 Bb0.39961.3798
Cyanidin-3-O-(6-O-malonyl-beta-D-glucoside)10.20y = 1.42967 × 10⁵x + 23953.76856(0.99900)535.1287.1100320.007 ± 0.003 Aa0.004 ± 0.002 Aa0.22920.8291
Cyanidin-3-(6-O-p-caffeoyl)-glucoside11.38y = 3.62073 × 10⁴x + 4600.17059(0.99612)611.1287.175350.013 ± 0.004 Aa0.009 ± 0.008 Aa--
Delphinidin-3-O-arabinoside6.96y = 3.62073 × 10⁴x + 4600.17059(0.99612)435.5303.1100300.038 ± 0.022 Aa0.046 ± 0.009 Aa--
Delphinidin-3-O-(6-O-p-coumaroyl)-glucoside11.75y = 3.62073 × 10⁴x + 4600.17059(0.99612)611.1303.175350.026 ± 0.008 Aa0.033 ± 0.030 Aa--
Delphinidin-3-O-(6-O-acetyl)-glucoside10.97y = 3.62073 × 10⁴x + 4600.17059(0.99612)507.1303.175350.180 ± 0.006 Aa0.094 ± 0.093 Aa--
Delphinidin-3-O-(6-O-malonyl-beta-D-glucoside)9.49y = 3.62073 × 10⁴x + 4600.17059(0.99612)551.1303.1100321.240 ± 0.832 Aa0.216 ± 0.217 Aa--
Delphinidin-3-O-5-O-(6-O-coumaroyl)-diglucoside10.93y = 3.62073×10⁴x + 4600.17059(0.99612)773.2303.175350.030 ± 0.005 Aa0.027 ± 0.016 Aa--
Delphinidin-3-O-galactoside6.01y = 1.32162 × 10⁵x − 5432.25388(0.99888)465.1303.160310.332 ± 0.156 Aa0.098 ± 0.030 Aa0.47001.6230
Malvidin-3-O-arabinoside9.77y = 1.52996 × 10⁵x + 1279.51381(0.99863)463.3331.1120270.161 ± 0.092 Aa0.054 ± 0.028 Aa0.20550.7095
Malvidin-3-O-galactoside8.95y = 2.38083 × 10⁵x + 8974.76971(0.99770)493.2331.150340.505 ± 0.310 Aa0.272 ± 0.246 Aa0.36761.2693
Pelargonidin-3-O-(6-O-p-coumaroyl)-glucoside12.53y = 3.62073×10⁴x + 4600.17059(0.99612)579.2271.175350.122 ± 0.035 Aa0.105 ± 0.020 Aa--
Pelargonidin-3-O-5-O-(6-O-coumaroyl)-diglucoside12.04y = 3.62073 × 10⁴x + 4600.17059(0.99612)741.2271.175350.026 ± 0.003 Aa0.025 ± 0.004 Aa--
Pelargonidin-3-O-galactoside7.78y = 3.62073 × 10⁴x + 4600.17059(0.99612)433.2271.11002720.269 ± 8.060 Aa0.194 ± 0.091 Ab--
Pelargonidin-3-O-rutinoside-5-O-glucoside8.92y = 3.62073 × 10⁴x + 4600.17059(0.99612)741.2271.175350.036 ± 0.013 Aa0.037 ± 0.005 Aa--
Pelargonidin-3-O-glucoside8.37y = 1.74307 × 10⁵x + 12033.58043(0.99738)433.2271.1100270.115 ± 0.025 Aa-Bb0.26730.9474
Pelargonidin-3-O-arabinoside8.74y = 3.62073×10⁴x + 4600.17059(0.99612)403.1271.145250.214 ± 0.0380 Aa-Bb--
Peonidin-3-O-(6-O-p-coumaroyl)-glucoside12.60y = 3.62073 × 10⁴x + 4600.17059(0.99612)609.2301.175350.017 ± 0.0010 Aa0.019 ± 0.003 Aa--
Peonidin-3-O-glucoside8.96y = 3.26812 × 10⁵x + 1.63886 × 10⁵ (0.99506)463.3301.1100300.093 ± 0.040 Aa0.015 ± 0.003 Ab0.53421.8445
Peonidin-3-O-galactoside8.49y = 3.62073 × 10⁴x + 4600.17059(0.99612)463.3287.11002719.245 ± 2.193 Aa0.316 ± 0.015 Bb--
Peonidin-3-O-arabinoside9.37y = 2.31273 × 10⁵x + 8.07477 × 10⁴ (0.99769)433.2287.150250.220 ± 0.036 Aa0.004 ± 0.002 Bb0.35591.2290
Petunidin-3-O-sophoroside7.96y = 3.62073 × 10⁴x + 4600.17059(0.99612)641.1287.170400.043 ± 0.023 Aa0.014 ± 0.013 Aa--
Petunidin-3-O-glucoside8.05y = 1.76301 × 10⁵x + 17143.60875(0.99872)479.1287.1100300.024 ± 0.012 Aa0.009 ± 0.008 Aa0.22250.7888
Petunidin-3-O-galactoside7.98y = 3.62073 × 10⁴x + 4600.17059(0.99612)479.1303.1100300.129 ± 0.0623 Aa0.047 ± 0.044 Aa--
Petunidin-3-O-arabinoside8.52y = 3.62073 × 10⁴x + 4600.17059(0.99612)449.1303.145250.303 ± 0.180 Aa0.135 ± 0.027 Aa--
Total 2411.760 ± 369.029 Aa53.967 ± 24.424 Bb
Note: ‘-’ indicates that these compounds were not detected. Different capital letters represent highly significant differences between groups (p < 0.01); different lowercase letters represent significant differences between groups (p < 0.05).
Table 2. Analysis of differential anthocyanin metabolites between CPY and CPR.
Differential Anthocyanin MetabolitesVIPp-ValueCPY vs. CPR Fold ChangeType
Cyanidin-3-O-galactoside1.51410.01170.0221down
Cyanidin-3-O-arabinoside1.48570.02220.0196down
Pelargonidin-3-O-galactoside1.40370.04970.0095down
Pelargonidin-3-O-glucoside1.50810.01590.0000down
Pelargonidin-3-O-arabinoside1.52360.01030.0000down
Peonidin-3-O-galactoside1.53420.00440.0164down
Peonidin-3-O-arabinoside1.51960.00880.0174down
Table 3. Calculation of a*, b*, and hue angle.
a*b*hab
CPR29.1311 ± 2.6221 A32.4199 ± 2.7185 B47.7093 ± 4.1706 B
CPY6.5816 ± 1.6875 B59.4201 ± 2.9749 A83.6427 ± 1.4604 A
Note: Different capital letters represent highly significant differences between CPR and CPY (p < 0.01).
Table 4. Correlation analysis between anthocyanin differential metabolites and hue angle in CPR and CPY.
Color IndexDifferential Anthocyanin MetabolitesCorrelationp-Value
Hue angleCyanidin-3-O-galactoside−0.9747 0.0010
Hue angleCyanidin-3-O-arabinoside−0.9512 0.0035
Hue anglePelargonidin-3-O-galactoside−0.9577 0.0026
Hue anglePelargonidin-3-O-glucoside−0.9023 0.0139
Hue anglePelargonidin-3-O-arabinoside−0.9259 0.0080
Hue anglePeonidin-3-O-galactoside−0.9918 0.0001
Hue anglePeonidin-3-O-arabinoside−0.99550 0.00003
Disclaimer/Publisher’s Note: The statements, opinions and data contained in all publications are solely those of the individual author(s) and contributor(s) and not of MDPI and/or the editor(s). MDPI and/or the editor(s) disclaim responsibility for any injury to people or property resulting from any ideas, methods, instructions or products referred to in the content.

