Article

The High-Pressure Response of 9,9′-Spirobifluorene Studied by Raman Spectroscopy

by
Maria-Tereza Siavou
1,
Konstantina Siapaka
1,
Olga Karabinaki
2,
Dimitrios Christofilos
2 and
John Arvanitidis
1,*
1
Physics Department, Aristotle University of Thessaloniki, 54124 Thessaloniki, Greece
2
School of Chemical Engineering & Laboratory of Physics, Faculty of Engineering, Aristotle University of Thessaloniki, 54124 Thessaloniki, Greece
*
Author to whom correspondence should be addressed.
Molecules 2025, 30(3), 638; https://doi.org/10.3390/molecules30030638
Submission received: 11 January 2025 / Revised: 21 January 2025 / Accepted: 29 January 2025 / Published: 31 January 2025

Abstract

The pressure response of crystalline 9,9′-spirobifluorene up to 8 GPa was studied by means of Raman spectroscopy using a diamond anvil cell as a pressure chamber. With increasing pressure, the observed Raman peaks shifted to higher frequencies, reflecting the bond hardening upon volume reduction, which was much more pronounced for the initially weaker intermolecular interactions than for the stronger intramolecular covalent bonds. The significant changes in the Raman spectrum and the pressure evolution of the frequencies at ~1.3 GPa for both the intermolecular and the intramolecular Raman peaks signaled a pressure-induced structural and molecular conformation transition with a little hysteretic behavior (~0.5 GPa) upon pressure release. For P > 4 GPa, the reversible decrease of the pressure coefficients of the majority of the intermolecular and some intramolecular peak frequencies indicated another structural modification of the studied molecular crystal. A value of ~9 GPa for the bulk modulus of the system at zero pressure was estimated from the logarithmic pressure coefficients of the frequencies of the intermolecular modes in the low-pressure phase. These coefficients were reduced by ~6 times at 4.2 GPa, indicating that the considerable stiffening of the material in the high-pressure phase emanated from the selective strengthening of the intermolecular interactions.

1. Introduction

Molecular crystals, which consist of molecules held together by weak intermolecular interactions—such as van der Waals and hydrogen bonding—are highly significant in the fields of material science, chemistry and life science. Among the organic molecules, polycyclic aromatic hydrocarbons (PAHs) are a diverse group of molecular structures made up of two or more interconnected aromatic rings. Apart from their intrinsic toxicity [1,2,3,4,5], these compounds have garnered considerable interest because of their unique physical and chemical properties due to the delocalization of π-electrons within their aromatic rings, strongly influenced by the exact molecular structure [1,4,6,7,8,9,10,11,12]. Therefore, PAHs and their derivatives have diverse applications in pharmaceuticals, plastics, dyes, liquid crystals and optoelectronics [7,8,9,10,11]. The formation of spiro compounds is a very promising way to improve the morphological stability—while retaining the functionality—of PAH molecules with a relatively low molecular weight, which is vital for optoelectronic applications [13,14]. Spiro compounds consist of two mutually perpendicular π-systems connected through a common tetracoordinated atom [15]. The perpendicular arrangement of the two parent molecular units leads to the high steric demand of the resulting rigid structure. This structural feature efficiently diminishes molecular interactions between the π-systems, which leads to the higher solubility of the spiro-linked compounds. The spiro-linking also considerably suppresses the excimer formation, frequently observed in the solid state, stabilizing the emission properties [16].
The 9,9′-spirobifluorene (SBF, C25H16) molecule consists of two fluorene-like subunits—each composed of two aromatic hexagonal rings connected by a non-aromatic pentagonal ring—in a nearly perpendicular configuration [17]. It exhibits the D2d point group symmetry and thus presents an intriguing structural motif that has been applied in molecular recognition and catalysis [18,19] and integrated into materials with unusual optoelectronic properties [20]. SBF crystallizes in the monoclinic structure (space group: P21/c, lattice parameters: a = 10.173 Å, b = 10.241 Å, c = 16.722 Å, β = 96.52°, Z = 4), where the individual rings remain planar but the biphenyl groups of the molecule deviate significantly from planarity due to crystal packing [21]. Note that the formation of another, possibly metastable SBF polymorph has also been reported, having the same space group but larger lattice parameters: a = 18.2491 Å, b = 11.1522 Å, c = 18.6918 Å, β = 117.907° and Z = 8 [22]. This difference arises from the fact that the metastable polymorph contains two SBF molecules in the asymmetric unit instead of one in the case of its stable counterpart, owing to the formation of centrosymmetric SBF dimers through C-H···π(arene) hydrogen bonding [22].
Because of the coexistence of weak intermolecular interactions and strong intramolecular covalent bonds in molecular crystals, the application of pressure acts selectively, reducing much more pronouncedly the intermolecular distances. This is usually followed by changes in the relative orientations of the constituent molecules and/or structural transitions—even at moderate pressures—without altering their chemical structure. Raman spectroscopy, which probes in a facile way both intermolecular (external) and intramolecular (internal) vibrations, is usually the method of choice to investigate the response of molecular crystals and the different evolution of the inter- and the intramolecular modes with pressure [23,24,25]. The parent benzene and several PAHs that are comprised of 2–4 hexagonal aromatic rings (naphthalene, biphenyl, fluorene, anthracene, phenanthrene, tetracene, chrysene, pyrene and triphenylene) have been studied by means of Raman spectroscopy under high pressure, and subtle structural transitions at moderate pressures (below 8 GPa) were reported [26,27,28,29,30,31,32,33,34,35,36,37,38,39]. These transitions are usually sluggish and reversible and are associated with symmetry changes, molecular reorientations and stacking rearrangements, charge transfer processes, or changes in the π-electron density [34,37].
Here, we report, for the first time, the structural stability and pressure-induced phase transitions of SBF crystals, adding to the existing knowledge of the physical properties of PAH systems. Further, an estimation of the bulk modulus of SBF is provided, which is not available in the literature. Such information is valuable for the potential use of PAHs in the various applications aforementioned, as well as for understanding the pressure response of molecular crystals in general. More specifically, high-pressure Raman measurements of SBF crystals were conducted up to 8 GPa using a diamond anvil cell (DAC) for pressure application and Daphne 7474 as a pressure transmitting medium (PTM). Significant alterations in the Raman spectrum profile and the pressure evolution of the Raman peak frequencies at ~1.3 GPa were observed, which were attributed to a pressure-induced structural and molecular conformation transition of SBF with small hysteresis upon pressure release. Above 4 GPa, the reversible changes in the pressure coefficients of the majority of the intermolecular and some intramolecular peak frequencies in the low (<300 cm−1) and 480–900 cm−1 frequency regions indicated either a second structural transition of the system or the completion of the first one at ~1.3 GPa.

2. Results and Discussion

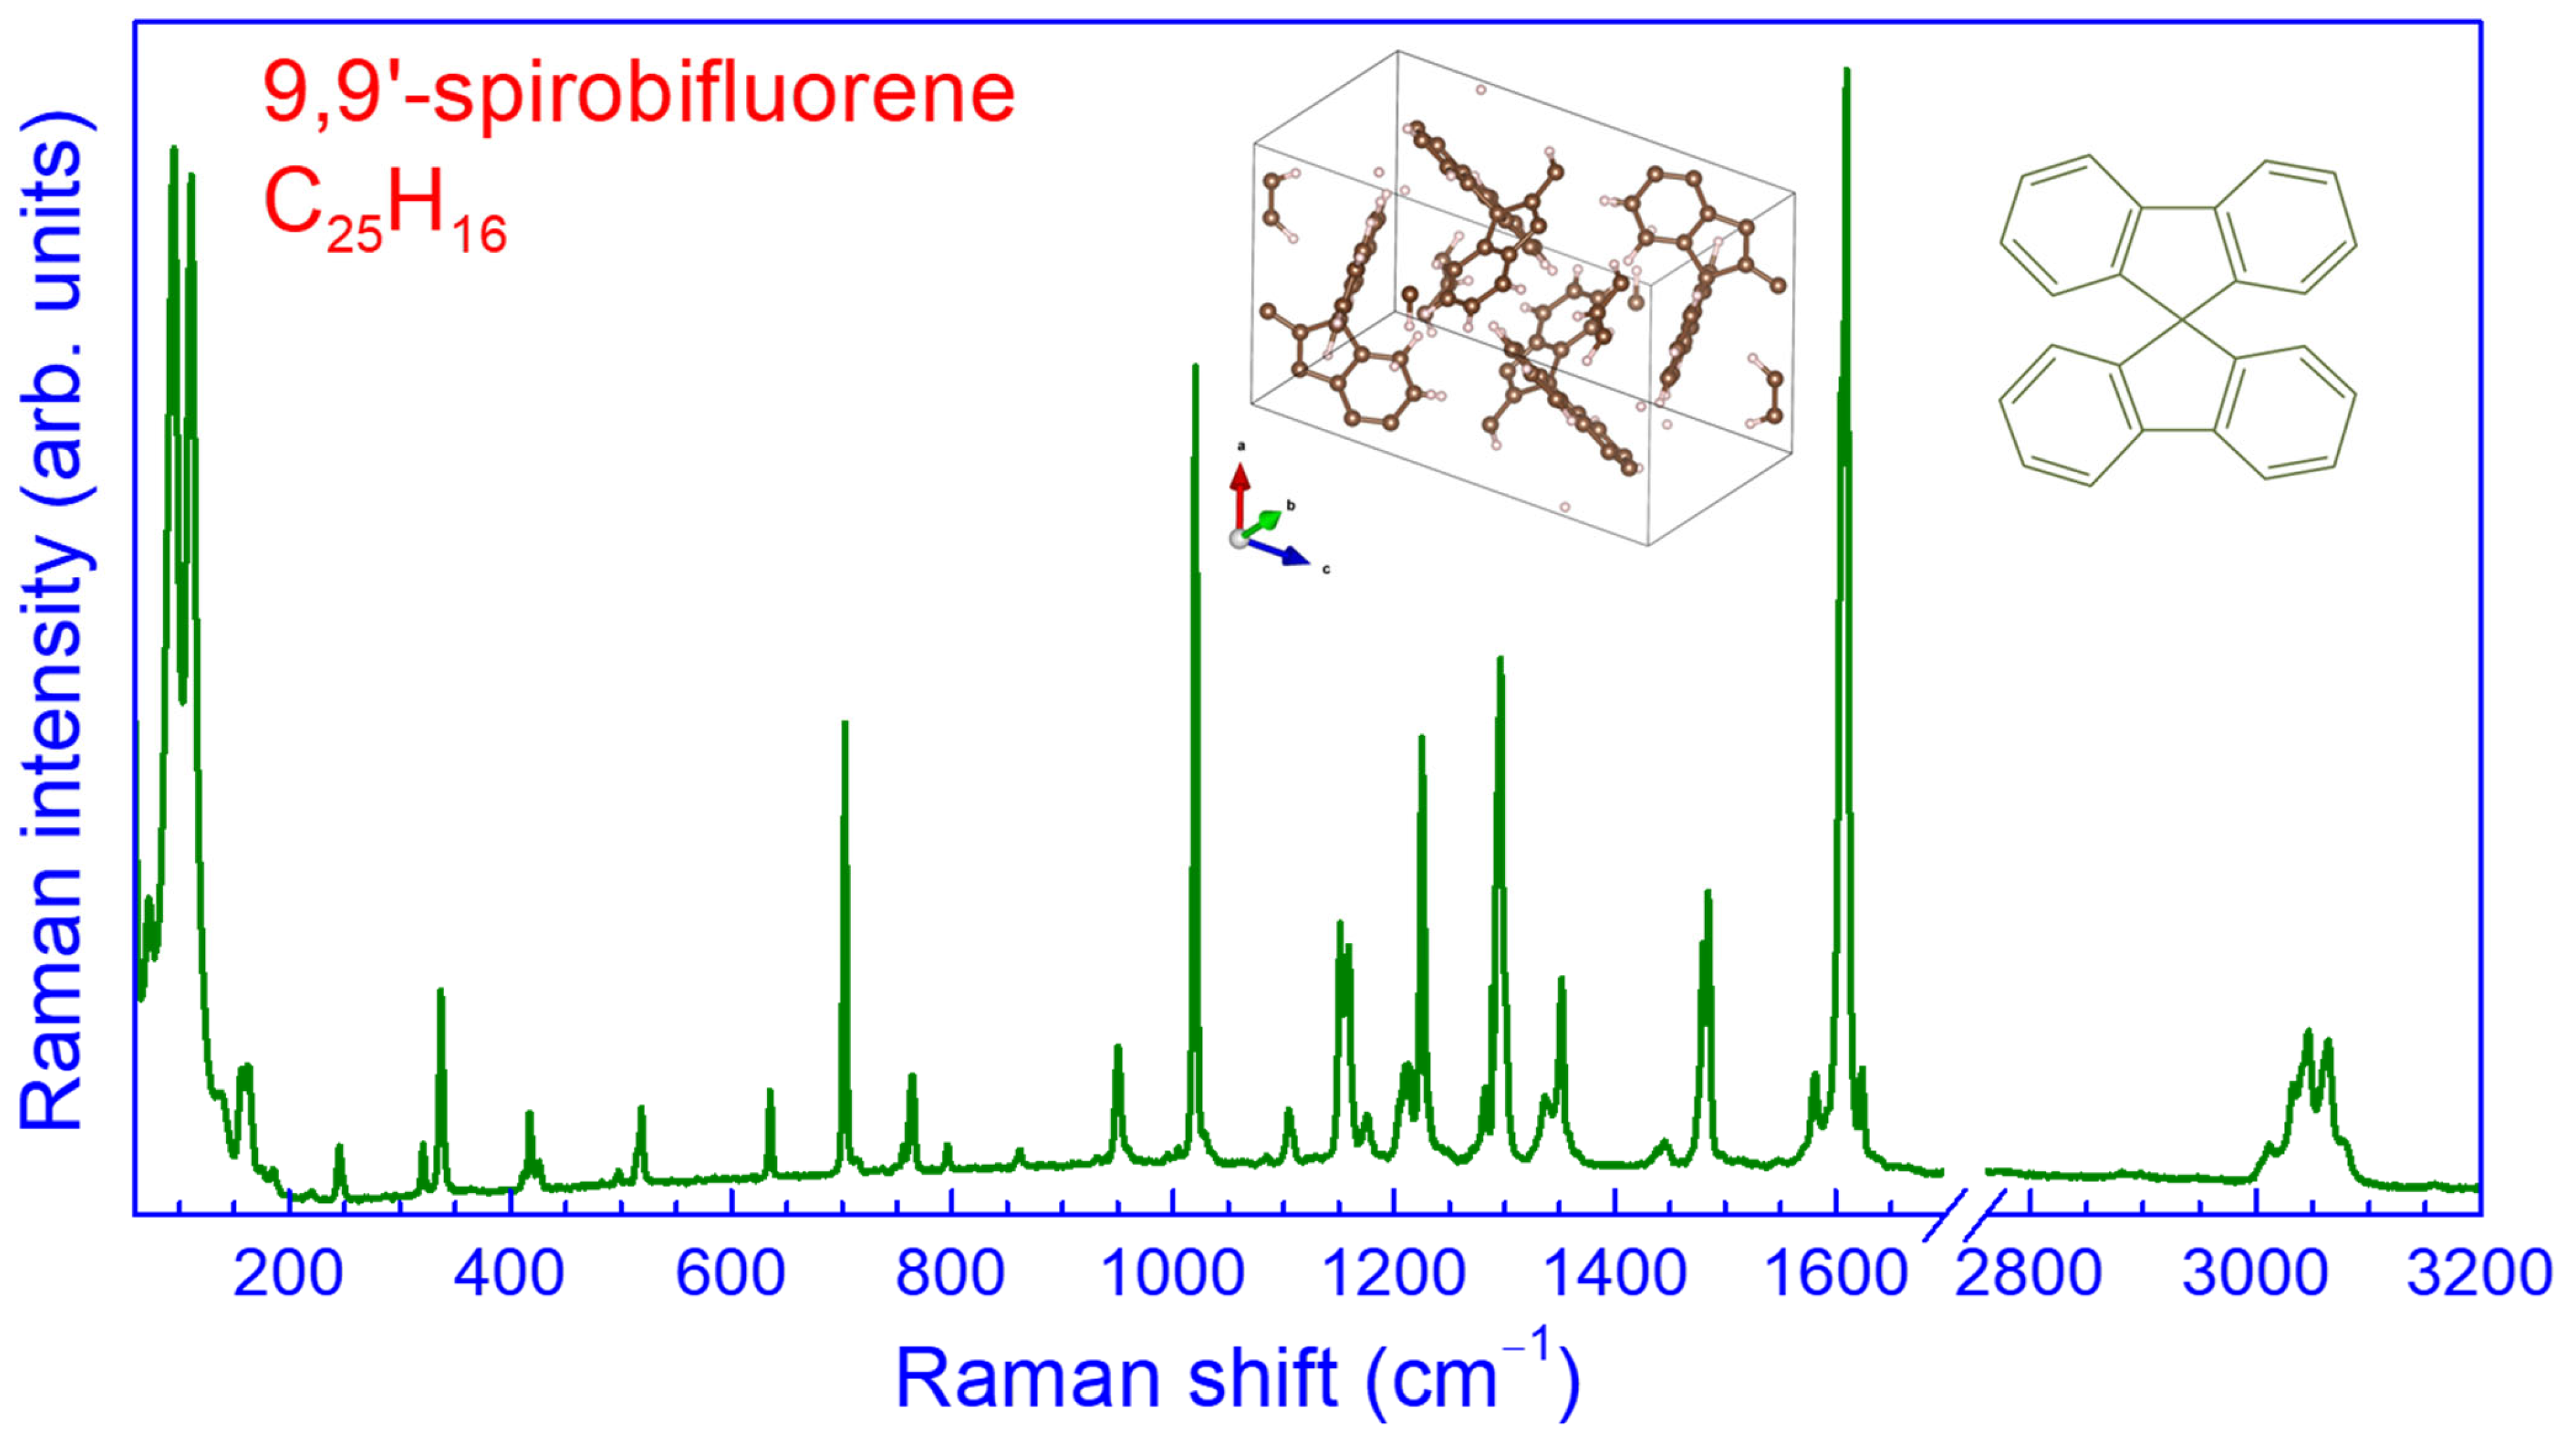
2.1. Raman Spectrum of SBF at Ambient Pressure

The Raman spectrum of the crystalline SBF at ambient conditions excited with λexc = 632.8 nm is illustrated in Figure 1. Because of the complexity of the studied system and the large number of atoms included in its molecule and monoclinic unit cell, the spectrum was very rich in terms of the number of observed peaks and could be divided into three main frequency regions. In the frequency region below 250 cm−1, intermolecular (external) vibrational modes and intramolecular (internal) torsional and skeleton deformation modes are expected due to the smaller values of the corresponding force constants and the heavier masses involved. The majority of the intramolecular modes exhibited frequencies above 250 cm−1 owing to the strong covalent bonding and the relative motion of lighter masses. In the frequency region 300–1600 cm−1, the intramolecular vibrations included C–H and CCC bending and ring deformations in the two fluorene-like subunits, while C–H stretching vibrations are expected in the frequency region 2900–3250 cm−1. In this high-frequency region, higher-order (overtones and combinational) vibrational modes with relatively low intensities are also expected, particularly in the range of 3100–3250 cm−1. Contrary to the case of the fluorene molecule, the absence of the CH2 methylene group in SBF—due to the formation of the spiro-linking—caused the disappearance of the corresponding stretching vibrations in the frequency region 2900–3000 cm−1 of the Raman spectrum [37,40,41]. Thus, the C-H stretching vibrations in SBF were limited in the range of 3000–3100 cm−1.
The frequency positions of the various Raman peaks appearing in Figure 1 and their relative intensities were in fair agreement with those reported earlier for SBF crystals by Boo et al. using λexc = 514.5 nm [43]. Boo et al. also assigned their experimentally observed Raman peaks to specific intramolecular vibrational modes by means of ab initio Hartree–Fock (HF) and Becke 3 Lee–Yang–Parr (B3LYP) density functional theory (DFT) calculations using the 4–31 G basis set. They further confirmed their assignment for some of the peaks by solution Raman measurements with the depolarization method of SBF in CCl4 [43]. For the isolated SBF molecule with 41 atoms and the D2d point group symmetry, 88 fundamentals are expected, with symmetries 20A1 + 9A2 + 10B1 + 20B2 + 29E. From these, the A2 modes are inactive in both Raman and infrared (IR) spectroscopy, while the A1 and B1 modes are active only in Raman scattering. On the other hand, the B2 and E modes—the latter were doubly degenerate modes because of the presence of two identical fluorene-like subunits in the SBF molecule—are active in both Raman and IR spectroscopy [43].
In this work, we adopted the same assignment for the various Raman peaks by comparing the extrapolated frequencies to zero pressure from the low-pressure ω vs. P data with those experimentally obtained at ambient conditions by Boo et al. (Appendix A, Table A1). Several additional peaks appearing in the Raman spectrum of crystalline SBF were also tentatively assigned to intramolecular or intermolecular (external) vibrations (low-frequency region). This was accomplished by taking into account their similar ambient pressure frequencies to those obtained from the DFT calculations by Boo et al. for the SBF molecule in the D2d point group symmetry [43] and assuming a possible crystal field and molecular deformation [21] splitting of the degenerate E modes (shown in italics in Table A1). Some weak Raman peaks with relatively high frequencies could not be assigned to specific fundamentals of the SBF molecule and may have originated, as also mentioned above, from second-order Raman scattering. Noticeably, the similarity of some Raman peak frequencies of SBF with those of fluorene monomer and other fluorene-containing spiro compounds (dicarbomethoxy and dimethyl-substituted spiro-cyclopropane-1,9′-fluorene as well as bis(2,2′-biphenylene)silane and bis(2,2′-biphenylene)germane), was remarkable, being indicative of their common origin [40,41,43,44,45].

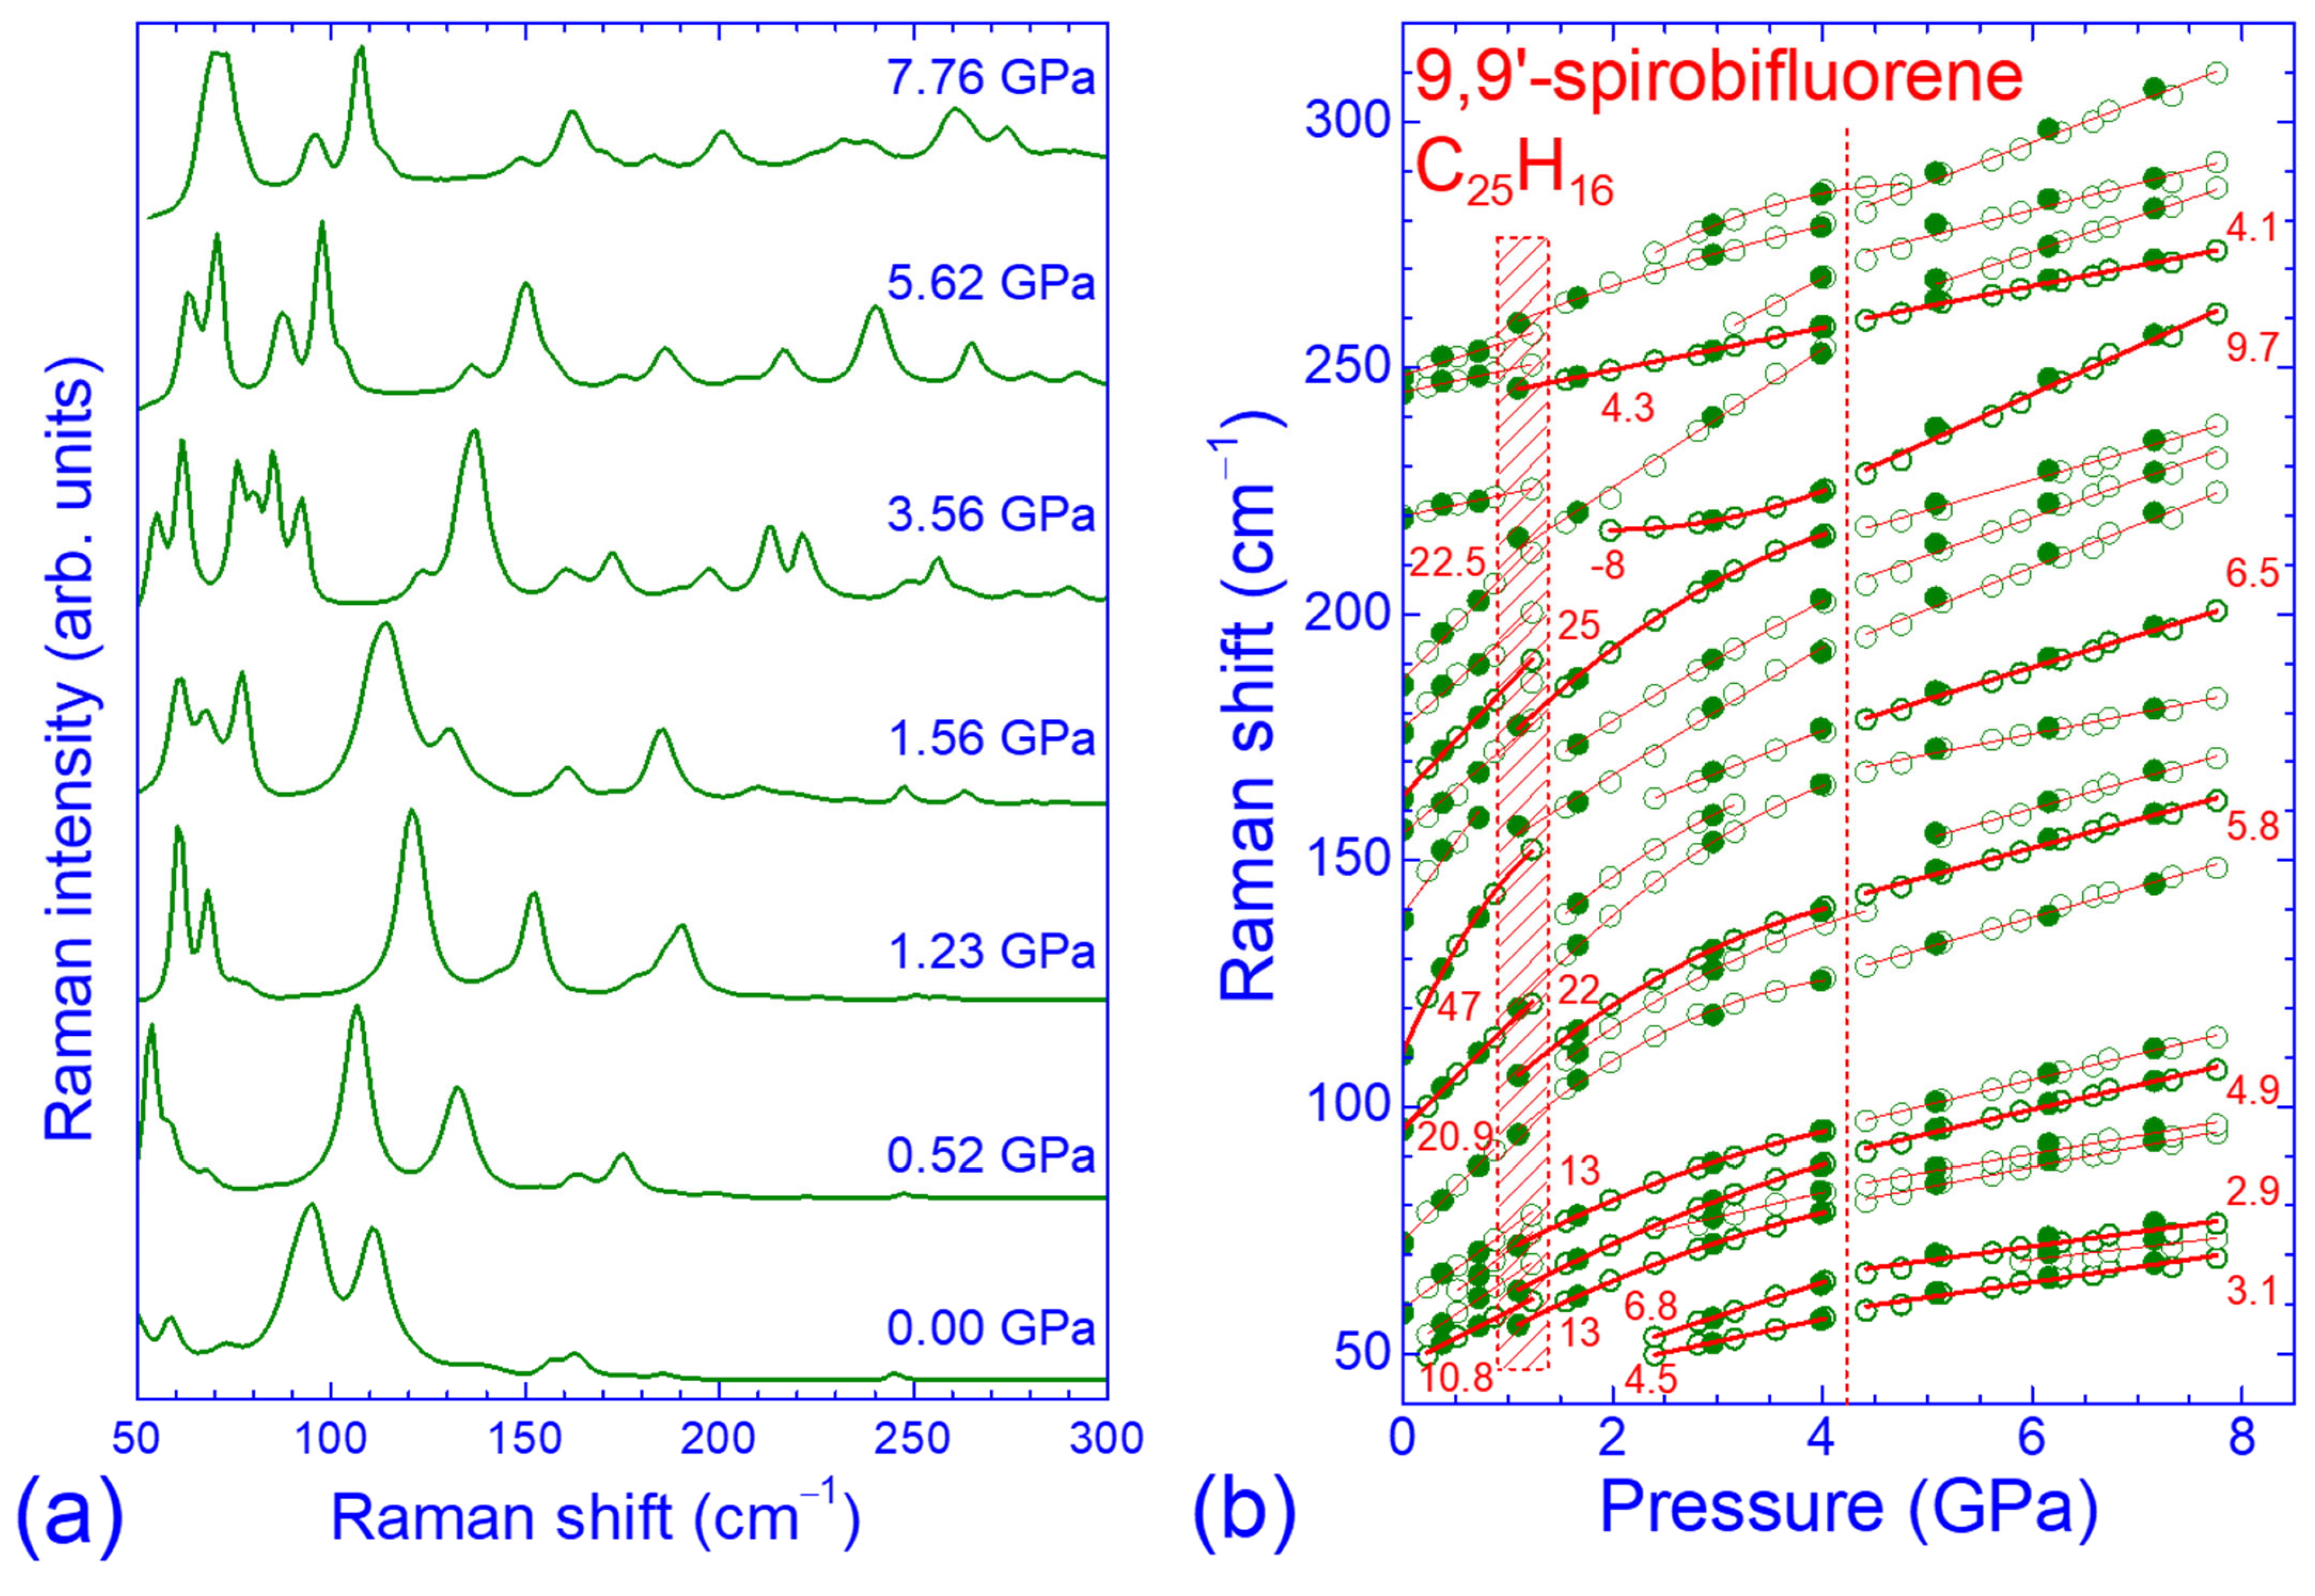
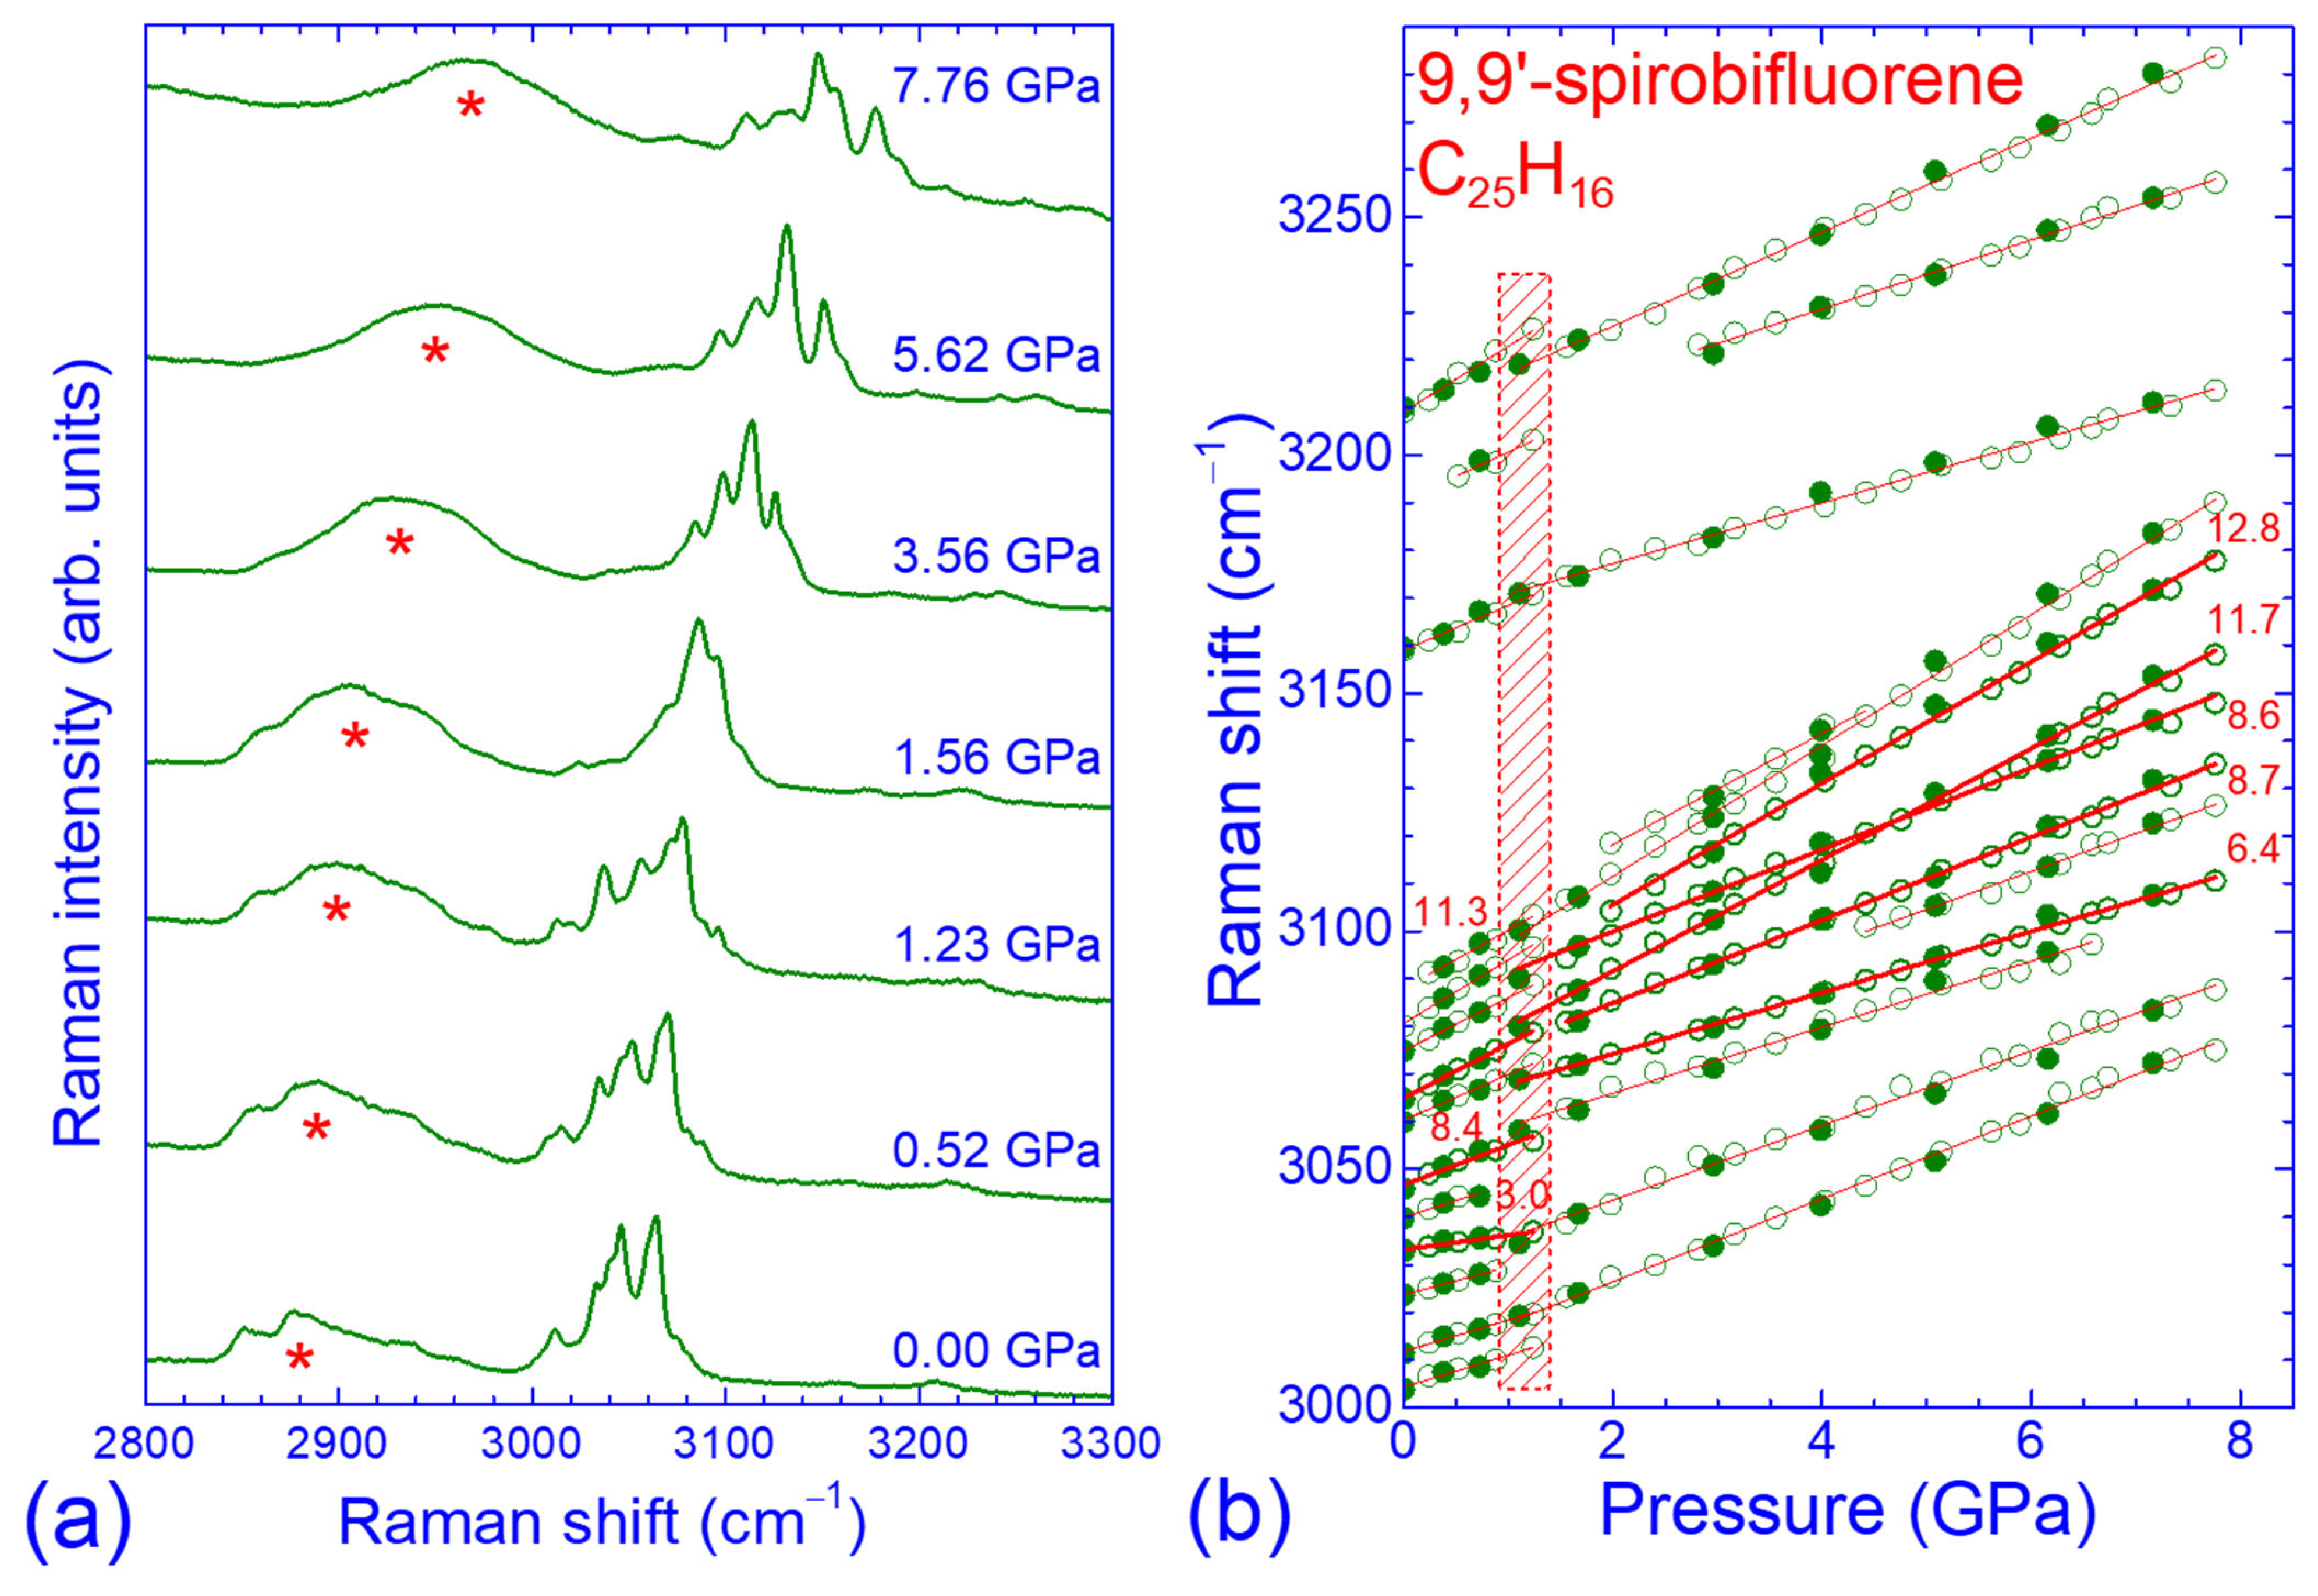
2.2. Pressure Dependence of the Raman Spectrum in the Low- and High-Frequency Regions

In this subsection, the results of the high-pressure Raman study of SBF in the low- (ω < 300 cm−1) and high-frequency (3000–3250 cm−1) regions of the spectrum are summarized and discussed. As mentioned in the previous subsection, the first region contained the intermolecular and intramolecular torsional and skeleton deformation modes, while the second included C–H stretching vibrations. The character of the former modes and the peripheral positions of the hydrogen atoms, associated with the latter vibrations, rendered these modes more sensitive—compared to the intermediate frequency intramolecular modes—to volume contraction and the possible occurrence of any pressure-induced structural and/or molecular conformation modifications [37].
Representative Raman spectra of SBF at various pressures in the low-frequency region are illustrated in Figure 2a. With increasing pressure, all Raman peaks shifted to higher frequencies, reflecting the bond hardening upon volume contraction. Moreover, considerable relative intensity changes of the various peaks were also observed in the whole pressure range investigated (0–8 GPa). Bond hardening with increasing pressure forced additional Raman peaks, initially located below 50 cm−1, to gradually enter the spectral window depicted in the figure (peaks ω1, ω3, ω4, ω6 and ω7 in Table A1). Note that the low-frequency edge of this spectral region was limited by the edge filter cut-off, which was used in the spectrometer to eliminate the strong, elastically scattered light (Section 3). Apart from these observations, abrupt changes regarding the appearance of the Raman peaks and their frequency shifts with pressure were apparent when going from 1.23 to 1.56 GPa, signaling the occurrence of a structural phase transition.
The pressure dependence of the frequencies of the various Raman peaks in the low-frequency region is illustrated in Figure 2b. For each peak, the ω vs. P data upon pressure increase (open circles) and decrease (solid circles) were fitted by linear (ω = ω0 + b1P) or parabolic (ω = ω0 + b1P + b2P2) functions in three different pressure ranges (P < 1.3 GPa, 1.1 < P < 4.1 GPa and P > 4.2 GPa). The linear pressure coefficients (b1) of the stronger peaks (thicker circles and lines) are also shown in the figure. The frequencies ω0 obtained from these fits and the corresponding pressure coefficients b1 and b2 for all the observed Raman peaks are summarized in Table A1 (Appendix A). As can be inferred from Figure 2b, the pressure dependencies of the frequencies for both intramolecular and intermolecular modes were smooth and linear up to ~1.3 GPa, with the exception of the external ω15 mode, which showed a strong parabolic dependence. The Raman peaks with frequencies below 200 cm−1 exhibited relatively large pressure coefficients, compatible with the small force constants involved [24]. However, abrupt changes and discontinuities occurred above this pressure value. More specifically, the Raman peaks attributed to intermolecular vibrations ω7, ω17 and ω20 disappeared, whereas new Raman peaks (ω5, ω10, ω13, ω14, ω24 and ω26) progressively appeared in the spectrum as pressure increased from 1.5 to 3 GPa. In addition, as the pressure increased from 1.23 to 1.56 GPa, the frequencies of several Raman peaks attributed to intermolecular (ω8 and ω19) and intramolecular (ω4, ω6, ω11, ω18, ω19, ω22 and ω23) modes either remained constant or softened by 1–8 cm−1. This behavior indicated a weakening of the corresponding intermolecular and intramolecular interactions within this pressure range, probably caused by the abrupt anisotropic shift of the molecular units from their initial positions in the unit cell. The pressure dependencies (pressure coefficients b1 and b2) of the various peak frequencies were also different below and above 1.3 GPa. All these pressure-induced peculiarities were compatible with the aforementioned evolution of the overall Raman spectrum profile when going from 1.23 to 1.56 GPa (Figure 2a) and supported the hypothesis of a pressure-induced structural and molecular conformation transition for P > 1.3 GPa. This transition showed some hysteresis (~0.5 GPa) upon pressure release (solid symbols in Figure 2b); the high-pressure phase survived down to ~1.1 GPa and the low-pressure phase was recovered at ~0.7 GPa, suggesting the first-order nature of the observed phase transition. Since there was no significant change in the number of the intermolecular modes appearing in the Raman spectrum in the low- and high-pressure phases, the crystal structure most probably remained monoclinic.
In the pressure region 1.3–4 GPa, the pressure dependencies of the frequencies of the low-frequency Raman peaks were mainly sublinear (negative quadratic pressure coefficients, b2), reflecting the gradual strengthening of the initially weak intermolecular interactions upon volume contraction and the stiffening of SBF [25,37]. Noticeably, the Raman peak ω22, possibly originating from an intramolecular mode associated with ring deformation, showed peculiar behavior upon compression. Its frequency remained nearly constant within the pressure range of 2–3 GPa, whereas it increased quasi-linearly for P > 3 GPa, resulting in an overall superlinear pressure response (positive pressure coefficient b2) in the pressure range under consideration (1.3–4 GPa). For pressures higher than 4 GPa, all the observed Raman peaks exhibited linear ω vs. P dependencies with reduced pressure coefficients b1 (Figure 2b). The decrease of the pressure coefficients indicated the considerable stiffening of the studied molecular crystals at elevated pressures. We recall that similar behavior has also been observed in the case of the parent orthorhombic fluorene for P > 6 GPa [37]. High-pressure X-ray diffraction (XRD) measurements have shown that fluorene undergoes a pressure-induced isostructural phase transition for P > 3 GPa, caused by the molecular rearrangement from the ambient and low-pressure herringbone pattern to π-stacking, resulting in abrupt changes in the lattice parameters (increase in a and b and decrease in the c lattice constant). The low- and high-pressure phases co-existed up to ~5 GPa, where crystalline fluorene was completely transformed to the stiffer high-pressure phase [46]. This structural transition was also apparent in the pressure evolution of the Raman peak frequencies since two distinct reversible changes in the linear pressure coefficients—mainly to lower values—were observed at 2.5 and 6 GPa, but without any spectroscopic evidence for phase coexistence in the intermediate pressure region [37]. In the case of SBF, the absence of high-pressure XRD data in the literature prevented us from conclusively judging whether two different structural phase transitions occurred at ~1.3 and ~4.2 GPa or whether a single one—sluggish, with phase coexistence—took place in the pressure range of 1.3–4.2 GPa, possibly characterized by the reorientation and different stacking of the SBF molecules.
Representative high-pressure Raman spectra of SBF in the high-frequency intramolecular mode region, including C–H stretching vibrations and higher-order modes as well as the pressure evolution of the corresponding Raman peak frequencies, are illustrated in Figure 3. Similarly to the low-frequency region, all Raman peaks shifted to higher frequencies with increasing pressure and the concomitant volume contraction. The pressure dependencies of the peak frequencies were quasi-linear up to ~1.3 GPa, where the pressure-induced phase transition took place and the overall spectrum profile changed significantly when going from 1.23 to 1.56 GPa. The ω vs. P dependencies for all the observed peaks were also quasi-linear up to the maximum pressure attained in our experiments. Nevertheless, the pressure coefficients of the peak frequencies above 1.3 GPa were different from those for lower pressures; the coefficients at high pressures increased for the first-order Raman peaks ω97, ω103 and ω106, attributed to C–H stretching vibrations, and the second-order Raman peak ω95, but decreased for the first-order Raman peaks ω99, ω100, ω102 and ω104, attributed to C–H stretching vibrations, and the high-frequency second-order Raman peaks ω108–ω110. The ω vs. P data for the high-frequency intramolecular modes exhibited the same hysteretic behavior upon pressure release to that of the intermolecular and low-frequency intramolecular modes, as the low-pressure phase of SBF was recovered at ~0.7 GPa.

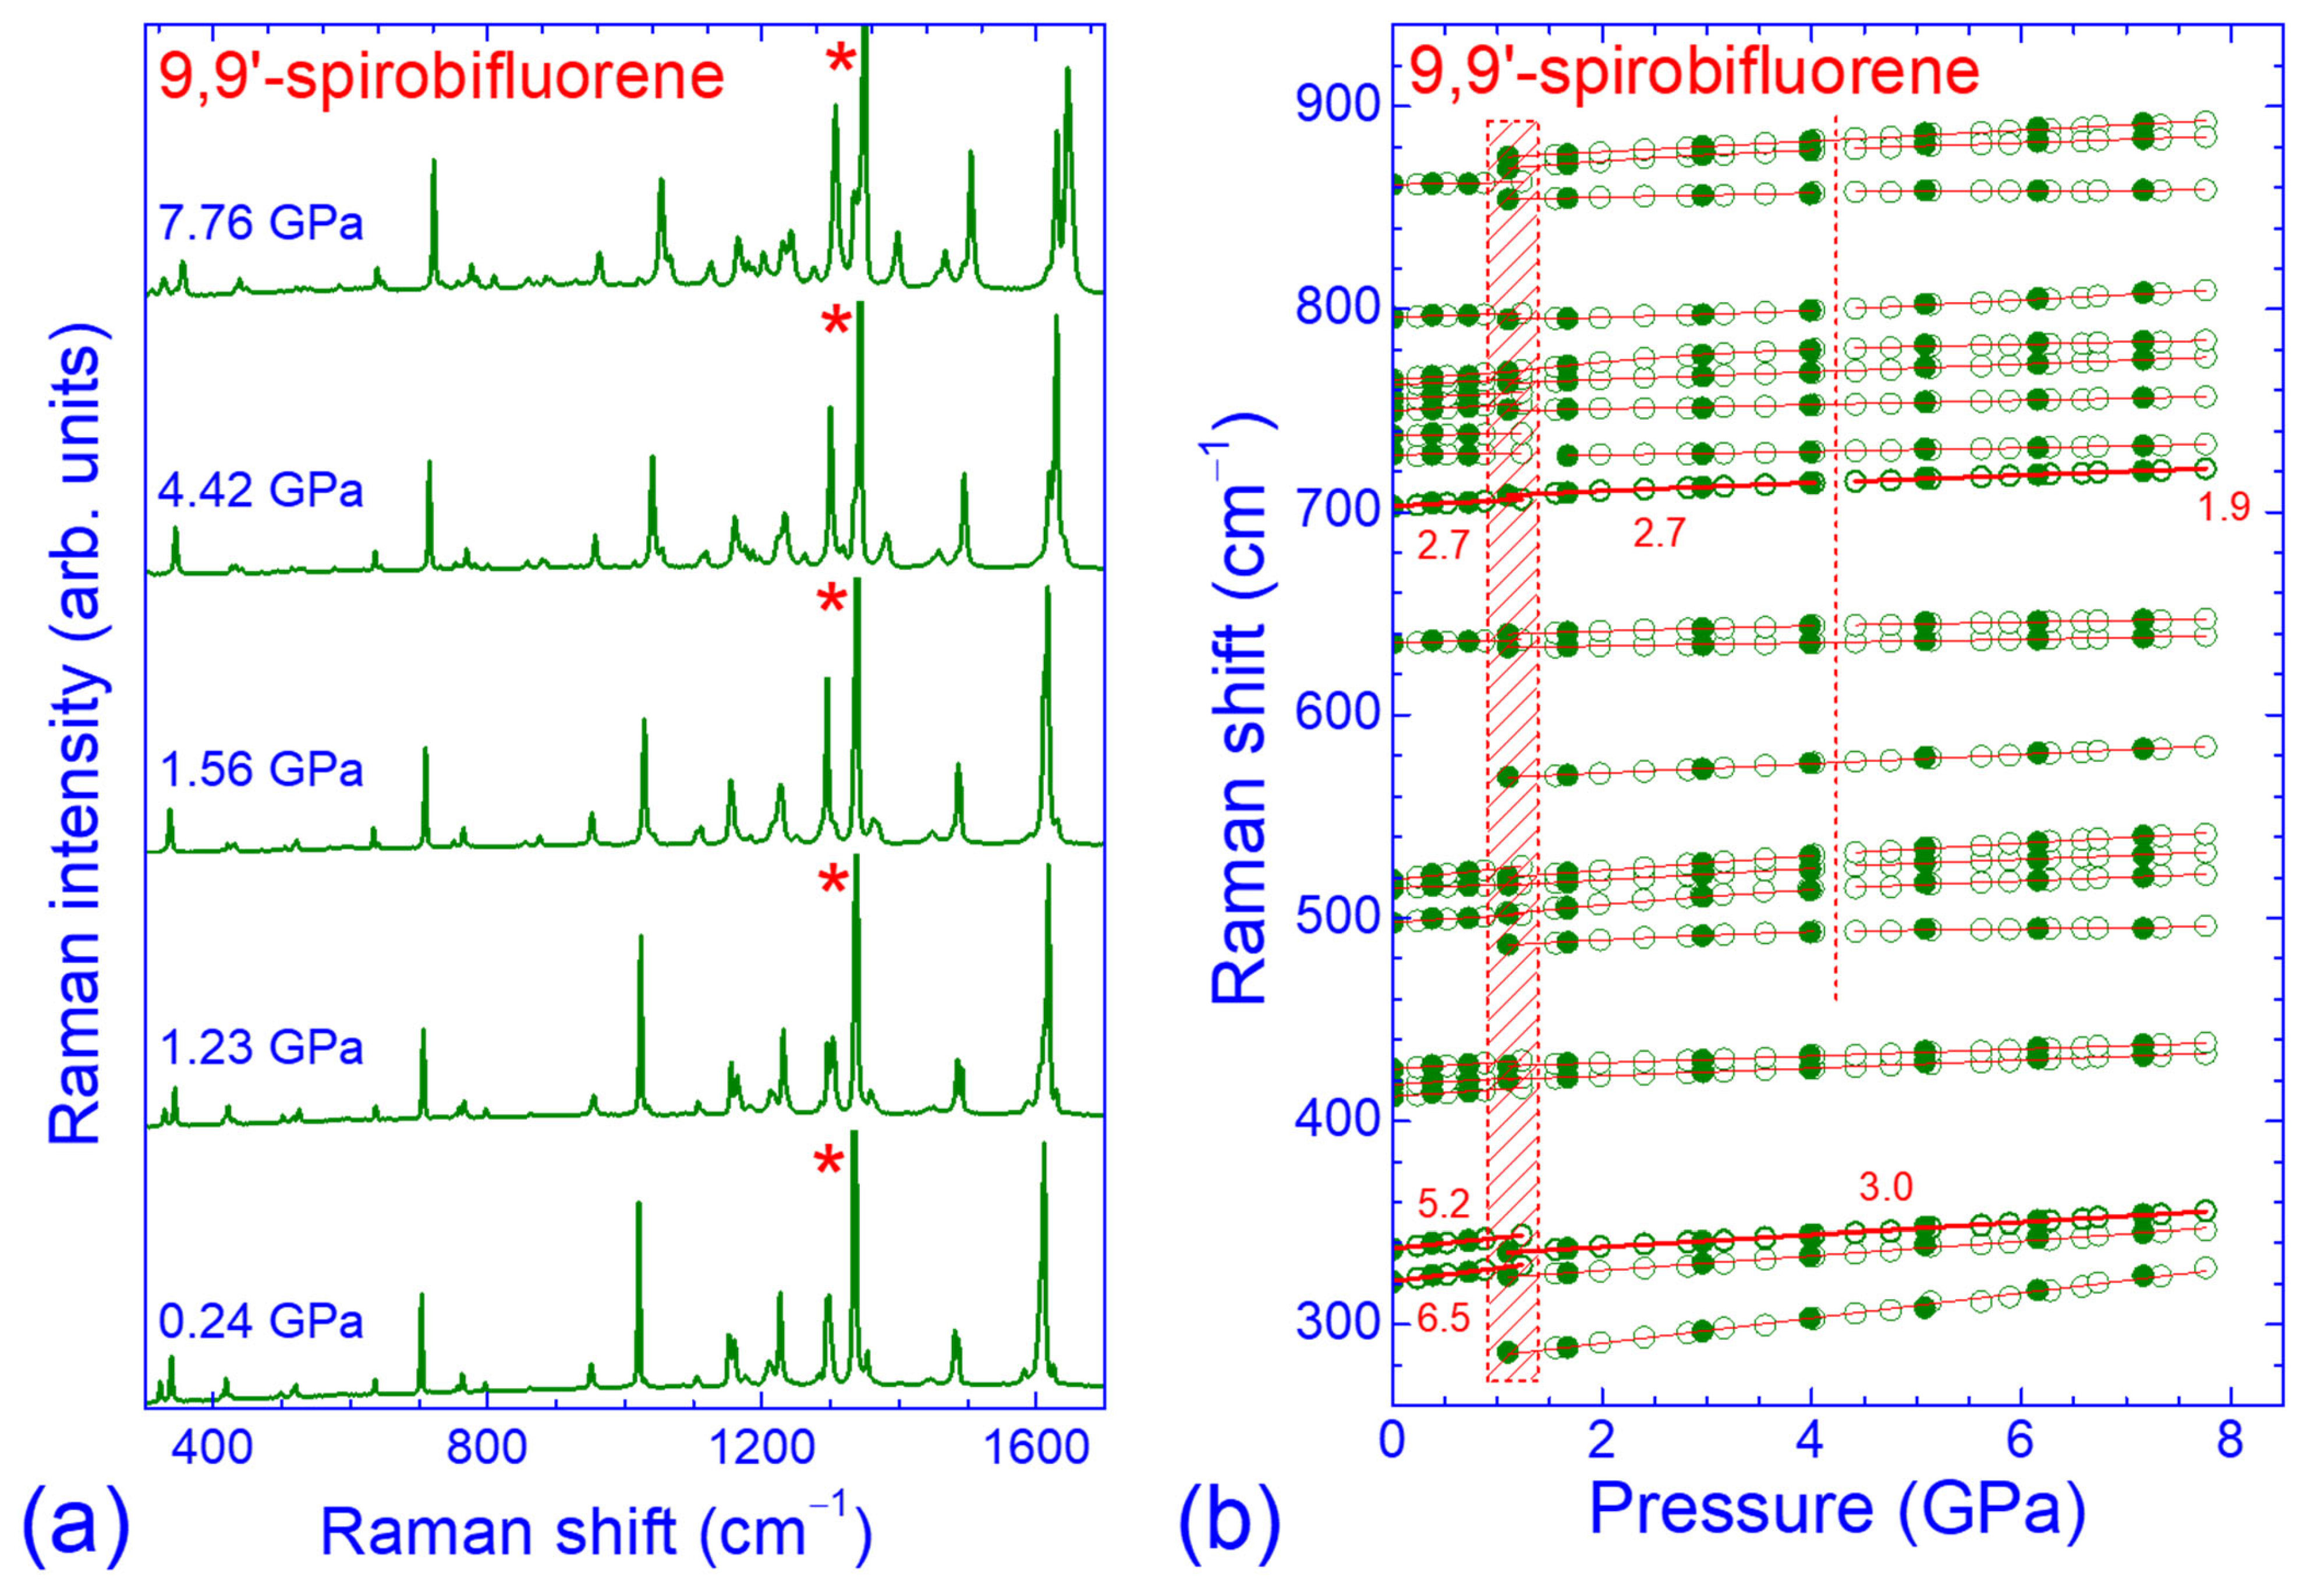
2.3. Pressure Dependence of the Raman Spectrum in the Intermediate-Frequency Region

Raman spectra of SBF at selected pressures in the intermediate-frequency region of the intramolecular modes (300–1700 cm−1) are illustrated in Figure 4a.
The Raman peaks in this frequency region also shifted to higher frequencies upon compression but with smaller rates compared to the Raman peaks in the low- and high-frequency regions. Moreover, the changes in the overall spectral profile were also much less pronounced and compatible with their internal character. The pressure dependencies of the frequencies of the observed Raman peaks in the intermediate-frequency region are shown in Figure 4b and Figure 5. Changes in the pressure evolution of the peak frequencies as well as the appearance or disappearance of some Raman peaks were also observed at ~1.3 GPa, with some hysteresis upon pressure release. The majority of the Raman peaks exhibited quasi-linear ω vs. P dependencies in the pressure ranges of 0–1.3 GPa and 1.1–7.8 GPa, with generally smaller pressure coefficients in the high-pressure phase. However, there were several Raman peaks in the frequency region of 480–900 cm−1, attributed to in- and out-of-plane C–H and CCC bending (Table A1) that had parabolic ω-P dependencies for 1.1 < P < 4.1 GPa and/or underwent changes in the linear pressure coefficients of their frequencies above 4.2 GPa.

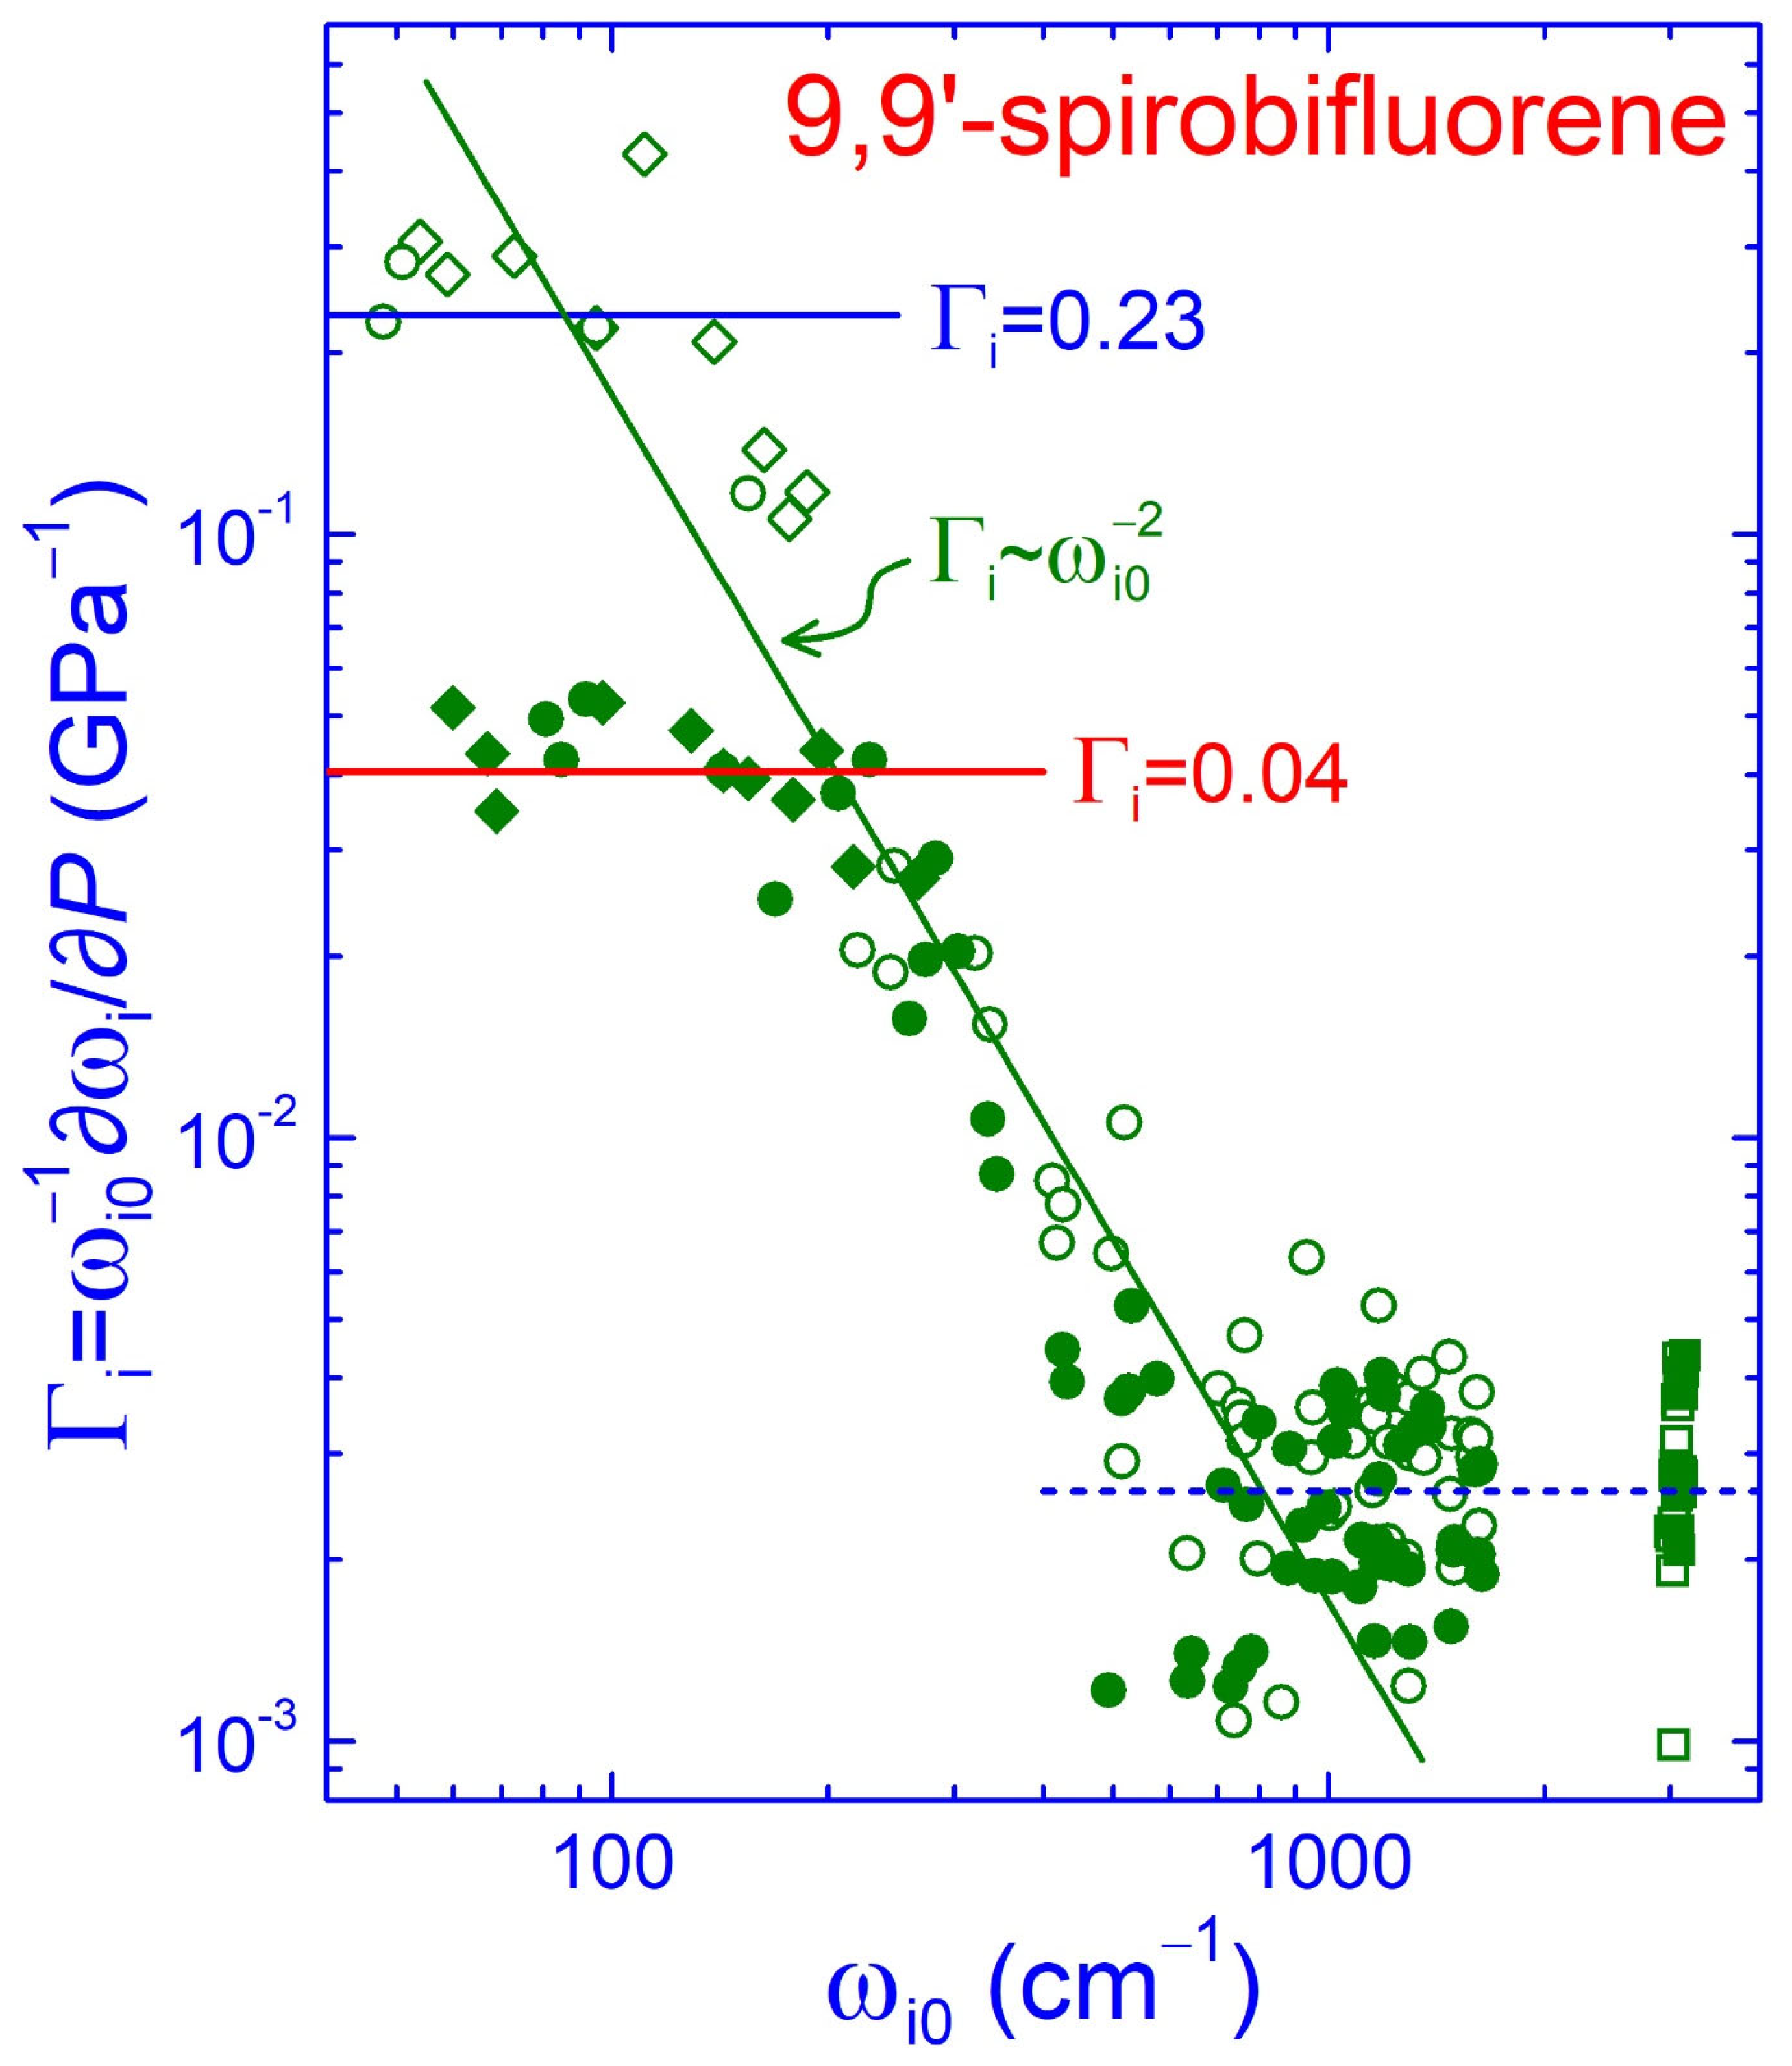
2.4. Force Hierarchy and Elastic Properties of SBF

The mode Grüneisen parameter γi = B0·∂(lnωi)/∂P (where B0 is the bulk modulus and ωi is the frequency of the ith mode) is related to the pressure-induced volume contraction and the concomitant modifications of the force constants of the bonds involved in the vibrational mode. In the Grüneisen approximation, all the γi parameters of the various modes of a given solid are equal to the same value γ, yielding the scaling law ω ~ Vγ, in which the frequency spectrum uniformly expands as the crystal contracts upon compression [24,47]. In molecular crystals like SBF, the mode Grüneisen parameters, apart from the mode frequency anharmonicity, express the force (bond stiffness) hierarchy. Although the Grüneisen approximation still works well for the intermolecular modes, it fails completely for the intramolecular modes, and a rough γi ~ ω i 0 2 dependence is observed, where ωi0 is the frequency of the ith mode at zero pressure [23,24]. As the bulk modulus for the SBF crystals is not available in the literature, and in order to compare its various binding forces, we can use the experimentally obtained logarithmic pressure coefficients of the frequencies (frequency normalized pressure slopes) Γi = ∂(lnωi)/∂P= (1/ωi0)·∂ωi/∂P of all the observed Raman peaks, which are proportional to the γi parameters (γi = B0Γi).
The normalized pressure slopes Γi of all the intermolecular and intramolecular Raman peaks of SBF below 1.3 GPa (low-pressure phase—open symbols) or above 4.2 GPa (high-pressure phase—solid symbols) as a function of their frequency ωi0 at 0.0 or 4.2 GPa, respectively, are summarized in Figure 6. As can be inferred from this figure, the Γi parameters spanned more than two orders of magnitude in the low-pressure phase of SBF, reflecting the coexistence of the weak van der Waals intermolecular interactions and the strong covalent intramolecular bonding. The parameters were almost constant for the intermolecular modes (rhombi), with an averaged value of ~0.23 (blue horizontal line), whereas they roughly followed Γi ~ ω i 0 2 dependence (olive line) for the low- and intermediate-frequency intramolecular modes (circles). On the other hand, the Γi parameters were again nearly constant for the higher-frequency intramolecular modes (ω > 1000 cm−1), including the C–H stretching vibrations (squares). This behavior reflected the similar force constants involved in these vibrations.
From the averaged value of the Γi parameters for the intermolecular modes, we could obtain a rough estimation for the bulk modulus of SBF in the low-pressure phase, assuming that the corresponding Grüneisen parameter equaled 2 [23,24,25]. This estimation yielded B0 ~ 9 GPa (~2/0.23 GPa), which was of the same order of magnitude—though 50% larger—as that experimentally obtained for the parent fluorene crystals in the low-pressure phase, B0 ~ 6 GPa, with a pressure derivative of B 0 = 7.5–8 [46,48]. In the high-pressure phase, the corresponding XRD data showed that fluorene crystals became stiffer with B0 = 11.3 GPa and B 0 = 5.4 [46]. In the present case of SBF, its intense stiffening at 4.2 GPa, where the second phase transition or the completion of the structural phase transition at ~1.3 GPa occurred, was associated with the considerable strengthening of the intermolecular interactions. This was clearly revealed by the strong—almost by 6 times—decrease in the Γi parameters for the intermolecular and low-frequency intramolecular modes (solid symbols in Figure 6). These parameters at 4.2 GPa become more comparable to those of the intermediate- and high-frequency intramolecular modes, reflecting a more homogenized state of the studied system in terms of the strength of the binding forces.

3. Materials and Methods

The studied SBF (C25H16) crystals (purity > 98%) were purchased from Tokyo Chemical Industry Co., Ltd. (TCI, Tokyo, Japan). The as-received sample was structurally characterized by means of powder X-ray diffraction (XRD) using a Brücker D8 Advance diffractometer (Billerica, MA, USA) equipped with a Cu X-ray tube (Cu Kα radiation, λ = 1.5418 Å). The XRD profiles at ambient conditions were collected at 2θ from 3° to 40° with an increment of 0.01° and a 0.2 s scan time. The corresponding data are illustrated in Figure A1 (Appendix A) along with the reflection positions expected for the main monoclinic SBF polymorph reported by Schenk (CSD Entry: BIPHME, Deposition Number: 1111373) and those for the rather metastable one by Douthwaite et al. (CSD entry: BIPHME01, deposition number: 273066) [21,22,42]. From these, it was apparent that the studied material crystallized in the monoclinic structure reported by Schenk [21].
Raman spectra were acquired in the backscattering geometry using a micro-Raman LabRAM HR spectrometer (HORIBA, Kyoto, Japan) equipped with a Peltier-cooled charge-coupled detector (CCD). The 632.8 nm line of a He-Ne laser was used for excitation, focused on the sample by means of a 100× objective (focusing spot diameter: ~1 μm) for ambient pressure or a 50× objective (focusing spot diameter: ~2 μm) for the high-pressure measurements at a power lower than 0.4 or 2 mW, respectively, to avoid any laser heating-induced effects. The elastically scattered light from the sample was eliminated by means of an appropriate edge filter, while the inelastically scattered light was dispersed by a 600 g/mm grating. The combination of this grating with an entrance pinhole of 80 μm yielded a spectral width of ~3.5 cm−1. Prior to each measurement, the frequency axis in the Raman spectrum was calibrated by the corresponding spectral lines of a Ne lamp.
The high-pressure Raman experiments were conducted in a Mao-Bell-type diamond anvil cell (DAC) using a ~80 μm thick drilled (~120 μm hole diameter) stainless steel gasket [49]. Daphne 7474 oil, which is a non-polar medium and, hence, was expected to affect to a lesser extent the molecular crystals of SBF and their pressure response compared to polar fluids, was used as a pressure transmitting medium (PTM) [50]. This PTM solidified at 3.7 GPa at room temperature and exhibited very good hydrostatic behavior up to ~4.1 GPa since the standard deviation of pressure remained lower than 0.013 GPa. At higher pressures, the standard deviation increased quasi-linearly, reaching the value of 0.25 GPa for P = 8 GPa [51]. The pressure in the sample chamber inside the DAC was calibrated by means of the ruby fluorescence (R1 line) method [52,53].

4. Conclusions

In conclusion, we reported our detailed high-pressure Raman study of crystalline 9,9′-spirobifluorene (SBF) up to 8 GPa, using a diamond anvil cell for pressure generation and Daphne 7474 oil as a pressure transmitting medium. The abrupt changes observed for pressures higher than 1.3 GPa for the Raman peaks attributed to both external and internal vibrational modes and the pressure evolution of their frequencies signaled the occurrence of a pressure-induced phase transition of the studied material, characterized by structural and molecular conformation alterations. This phase transition, presumably of first-order in nature, showed a little hysteretic behavior and the initial phase was recovered at ~0.7 GPa upon pressure release. For pressures higher than 4.2 GPa, the linear pressure coefficients of the intermolecular and some low- and intermediate-frequency intramolecular modes reversibly decreased, indicating the occurrence of a second structural transition or the completion of the one initiated at ~1.3 GPa. From the low-pressure ω vs. P data for the intermolecular modes, we estimated a value of ~9 GPa for the bulk modulus of the low-pressure phase of crystalline SBF. In the high-pressure phase and at 4.2 GPa, the considerable strengthening of the intermolecular interactions significantly narrowed the initially broad range of the force constants in the SBF crystal.

Author Contributions

Methodology, M.-T.S. and J.A.; data collection and analysis, M.-T.S., K.S., O.K. and J.A.; conceptualization and overall conclusions, D.C. and J.A.; writing original draft, J.A.; review and editing, O.K., D.C. and J.A.; project supervision, J.A. All authors have read and agreed to the published version of the manuscript.

Funding

This research received no external funding.

Institutional Review Board Statement

Not applicable.

Informed Consent Statement

Not applicable.

Data Availability Statement

All data supporting the reported results in this paper can be obtained from the authors.

Acknowledgments

The authors acknowledge the Center of Interdisciplinary Research and Innovation of the Aristotle University of Thessaloniki (CIRI-AUTH) for access to the Raman and PL instrumentation. The authors are also indebted to Xanthi Ntampou (School of Chemical Engineering, Faculty of Engineering, Aristotle University of Thessaloniki, Greece) for the collection of the XRD data.

Conflicts of Interest

The authors declare no conflicts of interest.

Appendix A

Table A1. Mode symmetry in the D2d point group, approximate mode description and calculated (ωcalc, cm−1) and experimental (ωexp, cm−1) frequencies of the vibrational modes of 9,9′-spirobifluorene, as obtained from the literature [43]. The frequencies (ωi0 at 0.0 GPa, ωj0 at 1.1 GPa or at the lowest pressure they appear and ωk0 at 4.4 GPa or at the lowest pressure they appear in cm−1) extracted from the least-squares fits and the corresponding ω vs. P data of the present work, along with their linear (b1, cm−1GPa−1) and quadratic pressure coefficients (b2, cm−1GPa−2), are also presented. The corresponding data for the well-resolved Raman peaks are shown in bold. The symmetry, approximate mode description and ωcalc from [43] for the Raman peaks tentatively assigned in this work are shown in italics.
PeakSym.*Approx. Mode Description *ωcalc *ωexp **P < 1.3 GPa1.1 < P < 4.1 GPaP > 4.2 GPa
ωi0b1b2ωj0b1b2ωk0b1
ω1 504.5 603.1
ω2 692.4
ω3 546.8 672.9
ω4B1ring tor47484810.8 5612.6−0.95814.0
ω5 754.9 853.6
ω6Ering tor and defm46 5114.4 6312.6−0.77924.9
ω7 external 5416.5
ω8 external 5915.9 7213.1−1.03975.1
ω9 external 7321.1 9523.3−2.531296.1
ω10 11020.4−1.64
ω11Ering tor and defm or external92 9520.9 10622.1−2.061435.8
ω12 1556.1
ω13 12127.5−2.381694.2
ω14 13925.5−2.50
ω15 external 11147.4−11.601638.6 1796.5
ω16 15513.9−0.151968.6
ω17 external 13929.0
ω18B1ring tor15615615518.1 17215.7−0.592077.7
ω19 external 16322.5 17724.8−2.202176.1
ω20 external 17718.8
ω21 external 18722.0 21314.0 2677.2
ω22B2ring defm216 2204.5 217−7.81.952299.7
ω23Ering tor, ip (CH + CCC) bend240 2454.6 2464.3 2604.1
ω24 25911.3 2745.4
ω25Ering tor, ip (CH + CCC) bend240 2487.0 2609.8−0.622838.2
ω26 27321.5−2.17
ω27 2856.2 6.2
ω28B1ring tor3193203216.5 3233.6 3.6
ω29A1ip CH and CCC bend3313363375.2 3353.0 3.0
ω30B2ring defm4074124123.5
ω31Ering tor4244194182.8 4201.9 1.9
ω32A1ring defm4204244263.3 4271.7 1.7
ω33 4873.5−0.254940.6
ω34B1oop CH and CCC bend501 4983.2 5026.3 5151.9
ω35Ering tor, ip (CH + CCC) bend5135145151.5 5162.9 5262.0
ω36Ering tor, ip (CH + CCC) bend513 5195.5 5203.7 5322.8
ω37 5692.3 2.3
ω38Ering tor, ip (CH + CCC) bend6446366351.3 6330.8 0.8
ω39 6401.9−0.106440.9
ω40A1ip CH and CCC bend7057047032.7 7082.7−0.127151.9
ω41Eoop CH and CCC bend7357277280.2 7280.9 0.9
ω42Eoop CH and CCC bend735 7380.8
ω43Eoop CH bend7527507502.7 7501.0 1.0
ω44Eoop CH bend752 7562.6
ω45A1ip CH and CCC bend7667607632.4 7641.9 1.9
ω46B1oop CH bend762 7653.6 7697.8−0.797811.1
ω47B1oop CH and CCC bend8007967961.6 7950.30.258002.7
ω48Eoop CH bend864 8611.0 8541.1 8580.2
ω49 8695.3−0.448791.7
ω50 8752.7 2.7
ω51 9152.1 2.1
ω52B1oop CH and CCC bend943 9325.9
ω53Eoop CH and CCC bend9479469482.8 9511.8 1.8
ω54B2ip CH and CCC bend9489489513.4
ω55Eoop CH and CCC bend947 9590.4
ω56 9802.4 2.4
ω57B1, Eoop CH and CCC bend,
ip CH and CCC bend
984, 1005100410052.4 10081.9 1.9
ω58 10203.2
ω59A1, B2ip CH and CCC bend10201020, 102110202.5 10264.0 4.0
ω60Eip CH and CCC bend1035103110294.0 10413.7 3.7
ω61A1ip CH and CCC bend1083108810843.4
ω62B2ip CH and CCC bend1105110411050.7 11022.0 2.0
ω63Eip CH and CCC bend1103 11104.0 11052.4 2.4
ω64 11112.4 2.4
ω65A1ip CH and CCC bend1148115211523.0 11551.7 1.7
ω66Eip CH and CCC bend1155 11574.2 11582.3 2.3
ω67Eip CH and CCC bend1155116411604.0 11632.5 2.5
ω68 11703.2 3.2
ω69 11714.8 4.8
ω70A1, Eip CH and CCC bend1178, 1179117611756.2 11824.5 4.5
ω71B2C(sp3)—C str, ip CH and CCC bend1206120812102.6
ω72B2ip CH and CCC bend1222 12143.8 12152.4 2.4
ω73A1ring str, ip CH bend1221122412264.6 12262.5 2.5
ω74 12324.7
ω75 12493.9 3.9
ω76Eip CH and CCC bend1288128212822.6 12862.5 2.5
ω77B2ip CH and CCC bend1299129512941.6 12941.9 1.9
ω78A1ip CH and CCC bend1298129712974.8
ω79Eip CH and CCC bend1305 13013.9 13044.3 4.3
ω80B2ip CH and CCC bend1352135113525.5 13604.9 4.9
ω81A1ip CH and CCC bend1354135213594.0 13684.6 4.6
ω82 14772.3 2.3
ω83Eip CH and CCC bend1473147414766.4
ω84A1ip CH and CCC bend1471148014803.8 14853.1 3.1
ω85B2ip CH and CCC bend1474148014854.8 14883.2 3.2
ω86 14982.9
ω87A1, B2ip CH and CCC bend1573, 15721580, 158115815.1 15874.5 4.5
ω88 15914.7
ω89 16093.3 3.3
ω90Eip CH and CCC bend1594 16013.3
ω91Eip CH and CCC bend1594160416055.1 16094.6 4.6
ω92A1ip CH and CCC bend1596160816106.1 16144.7 4.7
ω93B2ip CH and CCC bend1591162816243.7 16303.1 3.1
ω94 2nd order 30046.7
ω95 2nd order 30126.6 30198.7 8.7
ω96ECH str3047 30245.8
ω97ECH str3047 30333.0 30367.8 7.8
ω98B2CH str3048 30407.0
ω99A1CH str3048 30478.4 30606.9 6.9
ω100A1CH str3058 30609.6 30686.4 6.4
ω101 31008.0
ω102A1CH str3068 306511.3 30818.7 8.7
ω103ECH str3067 307511.1 308111.7 11.7
ω104A1totally sym CH str3080 308113.3 30928.6 8.6
ω105 310512.8 12.8
ω106B2CH str3080 308812.3 309913.7 13.7
ω107 311811.7 11.7
ω108 2nd order 31599.4 31716.4 6.4
ω109 2nd order 319610.1 32227.2 7.2
ω110 2nd order 320913.8 32189.9 9.9
* Symmetries, approximate mode descriptions and ωcalc values are those extracted from the DFT calculations (4–31 G basis set) by Boo et al. [43]. Approximate mode description: tor, torsion; defm, deformation; bend, bending; str, stretching; sci, scissoring; twi, twisting; roc, rocking; ip, in-plane; oop, out-of-plane. ** ωexp values are taken from the Raman spectroscopic measurements of SBF crystals and saturated solution in CCl4 by Boo et al. [43].
Figure A1. Powder X-ray diffraction profiles (λ = 1.5418 Å) of the studied crystalline SBF sample at ambient conditions. The red (upper) ticks mark the expected reflection positions for the main monoclinic SBF polymorph reported by Schenk [21], whereas the black (lower) ticks mark those for the metastable SBF polymorph reported by Douthwaite et al. [22].
Molecules 30 00638 g0a1

References

  1. Harvey, R.G. Polycyclic Aromatic Hydrocarbons; Wiley-VCH: New York, NY, USA, 1997. [Google Scholar]
  2. Neilson, A.H. (Ed.) PAHs and Related Compounds, Chemistry; Springer: Berlin/Heidelberg, Germany; New York, NY, USA, 1998. [Google Scholar]
  3. Skupińska, K.; Misiewicz, I.; Kasprzycka-Guttman, T. Polycyclic aromatic hydrocarbons: Physicochemical properties, environmental appearance and impact on living organisms. Acta Pol. Pharm. 2004, 61, 233–240. [Google Scholar] [PubMed]
  4. Bandeira, G.C.; Meneses, H.E. (Eds.) Handbook of Polycyclic Aromatic Hydrocarbons: Chemistry, Occurrence and Health Issues; Nova Science Publishers: Hauppauge, NY, USA, 2012. [Google Scholar]
  5. Lawal, A.T. Polycyclic aromatic hydrocarbons. A review. Cogent Environ. Sci. 2017, 3, 1339841. [Google Scholar] [CrossRef]
  6. Ahn, T.K.; Kim, K.S.; Kim, D.Y.; Noh, S.B.; Aratani, N.; Ikeda, C.; Osuka, A.; Kim, D. Relationship between two-photon absorption and the π-conjugation pathway in porphyrin arrays through dihedral angle control. J. Am. Chem. Soc. 2006, 128, 1700–1704. [Google Scholar] [CrossRef] [PubMed]
  7. Anthony, J.E. Functionalized acenes and heteroacenes for organic electronics. Chem. Rev. 2006, 106, 5028–5048. [Google Scholar] [CrossRef] [PubMed]
  8. Ye, Q.; Chi, C. Recent highlights and perspectives on acene based molecules and Materials. Chem. Mater. 2014, 26, 4046–4056. [Google Scholar] [CrossRef]
  9. Delouche, T.; Hissler, M.; Pierre-Antoine Bouit, P.-A. Polycyclic aromatic hydrocarbons containing heavy group 14 elements: From synthetic challenges to optoelectronic devices. Coord. Chem. Rev. 2022, 464, 214553. [Google Scholar] [CrossRef]
  10. Ma, L.; Han, Y.; Shi, O.; Huang, H. The design, synthesis and application of rubicene based polycyclic aromatic hydrocarbons (PAHs). J. Mater. Chem. C 2023, 11, 16429–16438. [Google Scholar] [CrossRef]
  11. Mathur, C.; Gupta, R.; Bansal, R.K. Organic donor-acceptor complexes as potential semiconducting materials. Chem. Eur. J. 2024, 30, e202304139. [Google Scholar] [CrossRef]
  12. Yadav, B.; Ravikanth, M. Porphyrinoid framework embedded with polycyclic aromatic hydrocarbons: New synthetic marvels. Org. Biomol. Chem. 2024, 22, 1932–1960. [Google Scholar] [CrossRef]
  13. Salbeck, J. New low molecular organic compounds with high glass transition temperature as materials for blue electroluminescence. In Inorganic and Organic Electroluminescence; Mauch, R.H., Gumlich, H.-E., Eds.; Wissenschaft & Technik: Berlin, Germany, 1996; pp. 243–246. [Google Scholar]
  14. Salbeck, J.; Yu, N.; Bauer, J.; Weissörtel, F.; Bestgen, H. Low molecular organic glasses for blue electroluminescence. Synth. Met. 1997, 91, 209–215. [Google Scholar] [CrossRef]
  15. Pudzich, R.; Fuhrmann-Lieker, T.; Salbeck, J. Spiro compounds for organic electroluminescence and related applications. Adv. Polym. Sci. 2006, 199, 83–142. [Google Scholar]
  16. Saragi, T.P.I.; Spehr, T.; Siebert, A.; Fuhrmann-Lieker, T.; Salbeck, J. Spiro compounds for organic optoelectronics. Chem. Rev. 2007, 107, 1011–1065. [Google Scholar] [CrossRef] [PubMed]
  17. Clarkson, R.G.; Gomberg, M. Spirans with four aromatic radicals on the spiro carbon atom. J. Am. Chem. Soc. 1930, 52, 2881–2896. [Google Scholar] [CrossRef]
  18. Alcazar, V.; Diederich, F. Enantioselective complexation of chiral dicarboxylic acids in clefts of functionalized 9,9′-spirobifluorenes. Angew. Chem. Int. Ed. 1992, 31, 1521–1523. [Google Scholar] [CrossRef]
  19. Poriel, C.; Ferrand, Y.; le Maux, P.; Paul, C.; Rault-Berthelot, J.; Simonneaux, G. Poly(ruthenium carbonyl spirobifluorenylporphyrin): A new polymer used as a catalytic device for carbene transfer. Chem. Commun. 2003, 2308–2309. [Google Scholar] [CrossRef]
  20. Wong, K.T.; Chien, Y.Y.; Chen, R.T.; Wang, C.F.; Lin, Y.T.; Chiang, H.H.; Hsieh, P.Y.; Wu, C.C.; Chou, C.H.; Su, Y.O.; et al. Ter(9,9-diarylfluorene)s:  Highly efficient blue emitter with promising electrochemical and thermal stability. J. Am. Chem. Soc. 2002, 124, 11576–11577. [Google Scholar] [CrossRef]
  21. Schenk, H. Crystal and molecular structure of Bis-(2,2′-biphenylene)methane. Acta Cryst. B 1972, 28, 625–628. [Google Scholar] [CrossRef]
  22. Douthwaite, R.E.; Taylor, A.; Whitwood, A.C. A new polymorph and two inclusion compounds of 9,9′-spirobifluorene. Acta Cryst. C 2005, 61, o328–o331. [Google Scholar] [CrossRef]
  23. Zallen, R. Pressure-Raman effects and vibrational scaling laws in molecular crystals: S8 and As2S3. Phys. Rev. B 1974, 9, 4485–4496. [Google Scholar] [CrossRef]
  24. Zallen, R.; Slade, M.L. Influence of pressure and temperature on phonons in molecular chalcogenides: Crystalline As4S4 and S4N4. Phys. Rev. B 1978, 18, 5775–5798. [Google Scholar] [CrossRef]
  25. Marinopoulou, A.; Christopoulou, V.; Karabinaki, O.; Christofilos, D.; Arvanitidis, J. The high-pressure response of trans-cinnamic acid crystals studied by Raman spectroscopy. Appl. Res. 2024, 3, e202300129. [Google Scholar] [CrossRef]
  26. Zallen, R.; Griffiths, C.H.; Slade, M.L.; Hayek, M.; Brafman, O. The solid state transition in Pyrene. Chem. Phys. Lett. 1976, 39, 85–89. [Google Scholar] [CrossRef]
  27. Adams, D.M.; Appleby, R. Vibrational spectroscopy at very high pressures: Part 18.-Three solid phases of benzene. J. Chem. Soc. Faraday Trans. 1977, 73, 1896–1905. [Google Scholar] [CrossRef]
  28. Thiéry, M.M.; Léger, J.M. High pressure solid phases of benzene. I. Raman and x-ray studies of C6H6 at 294 K up to 25 GPa. J. Chem. Phys. 1988, 89, 4255–4271. [Google Scholar] [CrossRef]
  29. Zhao, L.; Baer, B.J.; Chronister, E.L. High-pressure Raman study of anthracene. J. Phys. Chem. A 1999, 103, 1728–1733. [Google Scholar] [CrossRef]
  30. Venuti, E.; Guido Della Valle, R.; Farina, L.; Brillante, A. Phonons and structures of tetracene polymorphs at low temperature and high pressure. Phys. Rev. B 2004, 70, 104106. [Google Scholar] [CrossRef]
  31. Sun, B.; Dreger, Z.A.; Gupta, Y.M. High-pressure effects in pyrene crystals: Vibrational spectroscopy. J. Phys. Chem. A 2008, 112, 10546–10551. [Google Scholar] [CrossRef]
  32. Zhou, M.; Wang, K.; Mena, Z.; Gao, S.; Li, Z.; Sun, C. Study of high-pressure Raman intensity behavior of aromatic hydrocarbons: Benzene, biphenyl and naphthalene. Spectrochim. Acta A 2012, 97, 526–531. [Google Scholar] [CrossRef]
  33. Meletov, K.P. Phonon spectrum of a naphthalene crystal at a high pressure: Influence of shortened distances on the lattice and intramolecular vibrations. Phys. Solid State 2013, 55, 581–588. [Google Scholar] [CrossRef]
  34. O’Bannon III, E.; Williams, Q. Vibrational spectra of four polycyclic aromatic hydrocarbons under high pressure: Implications for stabilities of PAHs during accretion. Phys. Chem. Miner. 2016, 43, 181–208. [Google Scholar] [CrossRef]
  35. Zhao, X.-M.; Zhong, G.-H.; Zhang, J.; Huang, Q.-W.; Goncharov, A.F.; Lin, H.Q.; Chen, X.J. Combined experimental and computational study of high pressure behavior of triphenylene. Sci. Rep. 2016, 6, 25600. [Google Scholar] [CrossRef] [PubMed]
  36. Capitani, F.; Höppner, M.; Malavasi, L.; Marini, C.; Dore, P.; Boeri, L.; Postorino, P. The effect of high pressure on the lattice structure and dynamics of phenacenes. J. Phys. Conf. Ser. 2017, 950, 042017. [Google Scholar] [CrossRef]
  37. Terzidou, A.G.V.; Sorogas, N.; Pinakidou, F.; Paloura, E.C.; Arvanitidis, J. The pressure-induced structural phase transition of fluorene studied by Raman spectroscopy. Vib. Spectrosc. 2021, 115, 103272. [Google Scholar] [CrossRef]
  38. Yuan, C.; Wang, J.; Yang, Q.; Feng, S.; Zhu, X.; Yang, K.; Su, L. Phase transition behavior of benzene under dynamic compression: A stable precocious phase. J. Mol. Liq. 2024, 411, 125706. [Google Scholar] [CrossRef]
  39. Zhao, X.; Suo, T.; Mao, Q.; Zhao, Z.; Wang, S.; Wan, B.; Liu, J.; Zhang, L.; Liang, X.; Xu, A.; et al. Structure and piezochromism of chrysene at high pressures. Dyes Pigments 2024, 227, 112161. [Google Scholar] [CrossRef]
  40. Decker, C. Laser-Raman spectroscopy of disubstituted spiro-cyclopropane-1,9′-fluorene stereoisomers. Spectrochim. Acta A 1979, 35, 1303–1306. [Google Scholar] [CrossRef]
  41. Lee, S.Y.; Boo, B.H. Density functional theory study of vibrational spectra of fluorene. J. Phys. Chem. 1996, 100, 8782–8785. [Google Scholar] [CrossRef]
  42. Momma, K.; Izumi, F. VESTA 3 for three-dimensional visualization of crystal, volumetric and morphology data. J. Appl. Crystallogr. 2011, 44, 1272–1276. [Google Scholar] [CrossRef]
  43. Boo, B.H.; Park, J.; Yeo, H.G.; Lee, S.Y.; Park, C.J.; Kim, J.H. Infrared and Raman spectroscopy of 9,9′-spirobifluorene, bis(2,2′-biphenylene)silane, and bis(2,2′-biphenylene)germane. Vibrational assignment by depolarization measurement and HF and density functional theory studies. J. Phys. Chem. A 1998, 102, 1139–1145. [Google Scholar] [CrossRef]
  44. Bree, A.; Zwarich, R. Vibrational assignment of fluorene from the infrared and Raman spectra. J. Chem. Phys. 1969, 51, 912–920. [Google Scholar] [CrossRef]
  45. Cuff, L.; Kertesz, M. Theoretical prediction of the vibrational spectrum of fluorene and planarized poly(p-phenylene). J. Phys. Chem. 1994, 98, 12223–12231. [Google Scholar] [CrossRef]
  46. Heimel, G.; Hummer, K.; Ambrosh-Draxl, C.; Chunwachirasiri, W.; Winokur, M.J.; Hanfland, M.; Oehzelt, M.; Aichholzer, A.; Resel, R. Phase transition and electronic properties of fluorene: A joint experimental and theoretical high-pressure study. Phys. Rev. B 2006, 73, 024109. [Google Scholar] [CrossRef]
  47. Grüneisen, E. Handbuch der Physik; Springer: Berlin, Germany, 1926; Volume 10. [Google Scholar]
  48. Bridgman, P.W. Further rough compressions to 40,000 kg/cm2, especially certain liquids. Proc. Am. Acad. Arts Sci. 1949, 77, 129–146. [Google Scholar] [CrossRef]
  49. Jayaraman, A. Ultrahigh pressures. Rev. Sci. Instrum. 1986, 57, 1013–1031. [Google Scholar] [CrossRef]
  50. Sasaki, S.; Kato, S.; Kume, T.; Shimizu, H.; Okada, T.; Aoyama, S.; Kusuyama, F.; Murata, K. Elastic properties of new-pressure transmitting medium Daphne 7474 under high pressure. J. Appl. Phys. 2010, 49, 106702. [Google Scholar] [CrossRef]
  51. Murata, K.; Yokogawa, K.; Yoshino, H.; Klotz, S.; Munsch, P.; Irizawa, A.; Nishiyama, M.; Iizuka, K.; Nanba, T.; Okada, T.; et al. Pressure transmitting medium Daphne 7474 solidifying at 3.7 GPa at room temperature. Rev. Sci. Instrum. 2008, 79, 085101. [Google Scholar] [CrossRef]
  52. Barnett, J.D.; Block, S.; Piermarini, G.J. An optical fluorescence system for quantitative pressure measurement in the diamond-anvil cell. Rev. Sci. Instrum. 1973, 44, 1–9. [Google Scholar] [CrossRef]
  53. Mao, H.K.; Xu, J.; Bell, P.M. Calibration of the ruby pressure gauge to 800 kbar under quasi-hydrostatic conditions. J. Geophys. Res. 1986, 91, 4673–4676. [Google Scholar] [CrossRef]
Figure 1. Typical Raman spectrum of 9,9′-spirobifluorene (SBF) at ambient pressure, excited at 632.8 nm. Insets show a schematic representation of the SBF molecule and the unit cell of the crystal structure [21,42].
Molecules 30 00638 g001
Figure 2. (a) Raman spectra of SBF in the frequency region of the intermolecular vibrations recorded at various pressures. (b) Pressure dependence of the corresponding Raman peaks. Open (solid) symbols denote data obtained upon pressure increase (decrease). Solid lines through the experimental data are their linear or parabolic least-square fits, while numbers refer to the linear pressure coefficients of the well-resolved Raman peak frequencies (thicker symbols and lines). The shaded area and the vertical dashed line denote pressure ranges where changes in the Raman peak frequencies and their pressure coefficients occurred.
Molecules 30 00638 g002
Figure 3. (a) Raman spectra of SBF in the frequency region of the C-H stretching vibrations recorded at various pressures. Asterisks mark the C-H stretching band of the pressure-transmitting medium. (b) Pressure dependence of the corresponding Raman peaks. Open (solid) symbols denote data obtained upon pressure increase (decrease). Solid lines through the experimental data are their linear least-square fits, while numbers refer to the pressure coefficients of the well-resolved Raman peak frequencies (thicker symbols and lines). The shaded area denotes the pressure range where changes in the Raman peak frequencies and their pressure coefficients occurred.
Molecules 30 00638 g003
Figure 4. (a) Raman spectra of SBF in the frequency region of 300–1700 cm−1 recorded at various pressures. Asterisks mark the strong phonon peak of the diamond anvil. (b) Pressure dependence of the frequencies of the intramolecular modes in the frequency region of 280–920 cm−1. Open (solid) symbols denote data obtained upon pressure increase (decrease). Solid lines through the experimental data are their linear or parabolic least-square fits, while numbers refer to the linear pressure coefficients of the well-resolved Raman peak frequencies (thicker symbols and lines). The shaded area and the vertical dashed line denote pressure ranges where changes in the Raman peak frequencies and their pressure coefficients occurred.
Molecules 30 00638 g004
Figure 5. Pressure dependence of the frequencies of the intramolecular modes of SBF in the frequency regions (a) 900–1290 cm−1 and (b) 1270–1670 cm−1. Open (solid) symbols correspond to data obtained upon pressure increase (decrease), lines through the experimental data are their least-square fits and numbers refer to the linear pressure coefficients of the well-resolved Raman peak frequencies (thicker symbols and lines). The shaded area denotes the pressure range where changes in the Raman peak frequencies and their pressure coefficients occurred.
Molecules 30 00638 g005
Figure 6. Frequency-normalized pressure slopes Γi = (1/ωi0)·∂ωi/∂P of the Raman peaks of SBF as a function of their frequency ωi0 at 0.0 GPa (open symbols—Γi values of the Raman peaks for P < 1.3 GPa) or 4.2 GPa (solid symbols—Γi values of the Raman peaks for P > 4.2 GPa). Rhombi, circles and squares refer to the external, internal and C–H stretching vibrations, respectively. The solid lines through the data correspond to Γi = constant (external modes) and Γi ~ ω i 0 2 (internal modes), while the dashed line corresponds to Γi = constant for the internal modes with ωi0 > 1000 cm−1.
Molecules 30 00638 g006
Disclaimer/Publisher’s Note: The statements, opinions and data contained in all publications are solely those of the individual author(s) and contributor(s) and not of MDPI and/or the editor(s). MDPI and/or the editor(s) disclaim responsibility for any injury to people or property resulting from any ideas, methods, instructions or products referred to in the content.

