Abstract
This study focused on the preparation and investigation of g-C3N4/TiO2 photocatalysts using different TiO2 morphologies (anatase nanoparticles (TPs), poorly crystalline nanotubes (aTTs), and well-crystalline anatase nanorods (TRs)) and self-synthesized g-C3N4 (CN). The synthesis of the g-C3N4/TiO2 composites was carried out using a mortar mixing technique and a g-C3N4 to TiO2 weight ratio of 1:1. In addition, the g-C3N4/TiO2 composites were annealed in a muffle furnace at 350 °C for 2 h in air. The successful formation of a g-C3N4/TiO2 composite with a mesoporous structure was confirmed using the results of XRD, N2 physisorption, and FTIR analyses, while the results of microscopic analysis techniques confirmed the preservation of TiO2 morphology in all g-C3N4/TiO2 composites investigated. UV-Vis DR measurements showed that the investigated g-C3N4/TiO2 composites exhibited visible-light absorption due to the presence of CN. The results of solid-state photoluminescence and electrochemical impedance spectroscopy showed that the composites exhibited a lower charge recombination compared to pure TiO2 and CN. For example, the charge transfer resistance (RCT) of the CNTR/2 composite of TR and CN calcined in air for 2 h was significantly reduced to 0.4 MΩ, compared to 0.9 MΩ for pure TR and 1.0 MΩ for pure CN. The CNTR/2 composite showed the highest photocatalytic performance of the materials tested, achieving 30.3% degradation and 25.4% mineralization of bisphenol A (BPA) dissolved in water under visible-light illumination. In comparison, the pure TiO2 and CN components achieved significantly lower BPA degradation rates (between 2.4 and 11.4%) and mineralization levels (between 0.6 and 7.8%). This was due to (i) the presence of Ti3+ and O-vacancies in the TR, (ii) enhanced heterojunction formation, and (iii) charge transfer dynamics enabled by a dual mixed type-II/Z scheme mechanism.
1. Introduction
In heterogeneous photocatalysis, titanium dioxide (TiO2) is still of great interest due to its high stability, low cost, unique optical properties, and high photocatalytic activity [1,2,3]. However, its application is limited due to the required excitation using UV light (band gap value 3.0–3.4 eV) and the high tendency for recombination of the generated charge carriers [1,4,5,6]. There are several approaches to improve these drawbacks, including (i) the deposition of plasmonic metals (Au, Pt, etc.) on the surface, (ii) doping or self-doping (Ti3+) of TiO2, (iii) using different TiO2 polymorphs, (iv) forming a heterojunction with a suitable low band-gap semiconductor, etc. [6,7,8,9,10,11,12,13,14,15,16,17,18]. The latter is particularly interesting as it improves the disadvantages of TiO2 by using low-cost semiconductors instead of noble metals such as Au. A suitable candidate for forming a heterojunction with TiO2 is graphitic carbon nitride (g-C3N4) [4,18]. g-C3N4 is a polymeric 2D material with a moderate bandgap (~2.7 eV), high stability, and non-toxicity [4,18,19,20,21,22]. On the other hand, g-C3N4 typically has a low specific surface area and a high tendency to recombine charge carriers [4,11,19,23,24], suggesting the combination of TiO2 with g-C3N4 to overcome the disadvantages of both semiconductors [18,25,26].
Various complex synthesis methods are used to prepare g-C3N4/TiO2 composites, in which several factors such as the temperature of hydrothermal synthesis, the ratio of components, the microwave power, the duration of synthesis, etc., significantly affect the properties of the obtained materials [27,28,29]. In our previous study, the optimum weight ratio between g-C3N4 and TiO2 was found to be 1:1 [17]. Žerjav et al. [9] showed that the morphology of TiO2 can play a crucial role in the photocatalytic activity of TiO2-based composites. Jo et al. [30] investigated the influence of TiO2 morphology on the activity of g-C3N4/TiO2 composites for isoniazid degradation and found that the enhanced activity of the composites was due to the improved charge separation according to the Z-scheme. They also found that the optimal amount of g-C3N4 was different when using TiO2 nanoparticles (5% g-C3N4) or nanotubes (3% g-C3N4). The overall most active composite was the combination of 3% g-C3N4 and TiO2 nanotubes due to the increased carrier mobility and larger specific surface area of the TiO2 nanotubes. A search in the literature shows that the exact impact of TiO2 morphology (different TiO2 morphologies have different surfaces (crystal planes), textures, and optoelectronic properties) on the photocatalytic activity of g-C3N4/TiO2 composites has not yet been fully explored. The novelty of this research lies in the systematic investigation of how the morphology of TiO2—in particular nanoparticles, nanotubes, and single crystalline anatase nanorods—influences the formation and properties of the heterojunction between TiO2 and g-C3N4, and how these structural differences affect photocatalytic efficiency. This approach directly addresses gaps in the existing literature by focusing on the role of TiO2 morphology in optimizing the performance of g-C3N4/TiO2 composites for improved charge separation and utilization. We prepared g-C3N4/TiO2 composites using commercial anatase TiO2 nanoparticles and two internally synthesized (alkaline hydrothermal synthesis) TiO2 powders: poorly crystalline nanotubes and single crystalline anatase nanorods. The g-C3N4/TiO2 composites were synthesized using a mortar mixing technique and a 1:1 ratio of g-C3N4 to TiO2. In addition, the g-C3N4/TiO2 composites were annealed in a muffle furnace at 350 °C. An important benchmark for evaluating the efficiency of photocatalytic systems is the photooxidation rate, i.e., the rate at which oxidation reactions occur on the surface of a photocatalyst when it is exposed to light. Several factors influence this rate, including the band gap, crystallinity, morphology, surface area, and charge separation efficiency of the photocatalyst. External conditions, such as light intensity, wavelength, pH, and temperature, also play an important role. Therefore, the synthesized composites were characterized using surface and chemical-sensitive analysis techniques (EPR, XPS, FTIR, UV-Vis DR, and TEM). In addition, the investigated g-C3N4/TiO2 composite photocatalysts were analyzed for possible wastewater remediation under visible-light illumination, using the endocrine disrupting compound bisphenol A (BPA) dissolved in water as a model organic pollutant. By using coumarin and DMPO/DMSO as probe molecules in conjunction with in situ BPA quenching experiments, we were able to gain an insight into the generation and utilization of the reactive oxygen species and determine the possible reason for the different photocatalytic behavior of the investigated g-C3N4/TiO2 composites.
2. Results and Discussion
2.1. Structural and Chemical Analyses
2.1.1. FTIR Analysis
To confirm the successful synthesis of CN and its incorporation into the composite photocatalysts, we performed FTIR measurements; the results are shown in Figure 1a–c. It can be observed that pure CN exhibits characteristic vibrations for g-C3N4 (1100–1700 cm−1) and the characteristic breathing mode of the triazine or tri-s-triazine structural unit (heptazine) at 808 cm−1 [31,32,33,34]. In particular, the FTIR bands at 1206, 1234, and 1314 cm−1 originate from the C–NH–C unit, while the signals in the range between 1600 and 1350 cm−1 correspond to vibrations of the condensed C–N–C structural units, with the bands at 1315 cm−1 belonging to C–N stretching and at 1629 cm−1 to C=N stretching [31,32,33,34]. The broad peak centered at 3100 cm−1 originates either from water adsorbed on the surface and/or from NHx functional groups left over from CN synthesis. For all pure TiO2 components, we can observe the characteristic Ti-O-Ti stretching (600–1100 cm−1) in addition to the presence of surface adsorbed water and/or -OH functional groups (peak at ~3100 cm−1). The characteristic peaks of g-C3N4 and TiO2 are present in all investigated photocatalysts, which suggests the successful synthesis of a heterojunction between g-C3N4 and TiO2 independent of the TiO2 morphology used. No other additional peaks were observed, confirming that the applied synthesis approach did not alter the chemical composition of the two components and did not introduce any impurities. From the results of the elemental analysis (Table S1) of the fresh samples, it can be concluded that the pure TiO2 samples contained small amounts of carbon originating from the air impurities adsorbed on the surface. The CN solid had the expected carbon and nitrogen content and a small amount of hydrogen from the non-condensed NHx functional groups. All composite photocatalysts showed an increased carbon and nitrogen content, demonstrating the successful addition of CN with TiO2. Furthermore, the carbon and nitrogen content were similar in all composites regardless of the TiO2 used, which means that they all contained a similar amount of g-C3N4. Therefore, possible changes in photocatalytic behavior were due to the intrinsic changes of the hybrids and were not influenced by the content of the CN component. Additional annealing of the mortar composites slightly reduced the amount of carbon and nitrogen, as a small amount of CN was removed from the samples during this procedure. However, the CN content did not change significantly.
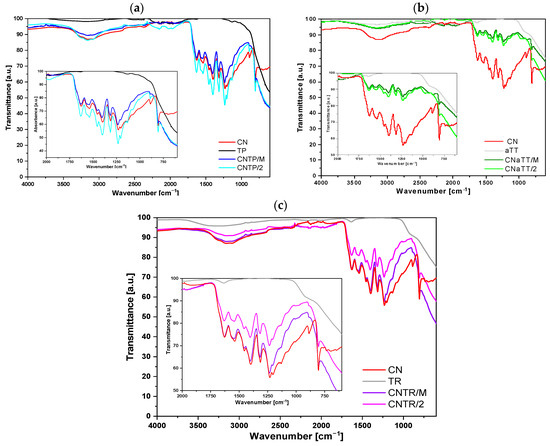
Figure 1.
ATR-FTIR spectra of the investigated nanosolids recorded at room temperature. Figure (a) shows the TP series, (b) shows the aTT series and (c) shows the TR series. The insets show the characteristic vibrations of g-C3N4.
2.1.2. XRD Analysis
The phase composition and purity of the investigated materials were determined using XRD analysis. From the XRD diffractograms in Figure 2a–c, it can be seen that both TiO2 and g-C3N4 components are present in all composite photocatalysts. For the CN component, the characteristic peak of g-C3N4 corresponding to ICDD 00-066-0813 can be observed at about 27.5° 2θ for the (002) plane in all cases [30], while the weakly expressed (100) peak at 13.2° 2θ is not visible. In all samples containing TiO2, we can observe characteristic peaks corresponding to the TiO2 anatase polymorph (PDF ICDD 01-086-1157). However, for the pure aTT and CNaTT/M samples, only two characteristic peaks can be observed (anatase (101) at ~25° 2θ and anatase (200) at ~48° 2θ). Before calcination, the particles were either poorly crystalline or the crystallites were very small (~10 nm), resulting in the typical diffuse peaks with low intensity. When the CNaTT/M composite was annealed at 350 °C for 2 h, the crystallinity improved and more characteristic TiO2 anatase peaks are visible in the diffractogram of the CNaTT/2 sample; even the low temperature of 350 °C was sufficient to transform the poorly crystalline TiO2 into well-crystalline TiO2. The shape of the TiO2 peaks and the crystallite size of TiO2 remained the same or slightly increased in the case of the CNTP/M composite (Table 1). Using the simulation of Na-titanate in Figure 2d, we confirmed the absence of any sodium contamination in our aTT or TR containing samples. This proves, also considering the results of the FTIR measurements, that both components were present in the composites without significantly changing their chemical or phase composition. However, a slight shift in the g-C3N4 (002) peak can be observed in all composites compared to pure CN (Table 1), suggesting the successful formation of a heterojunction, as the separation of the layers probably changes due to the interactions with TiO2 [35].
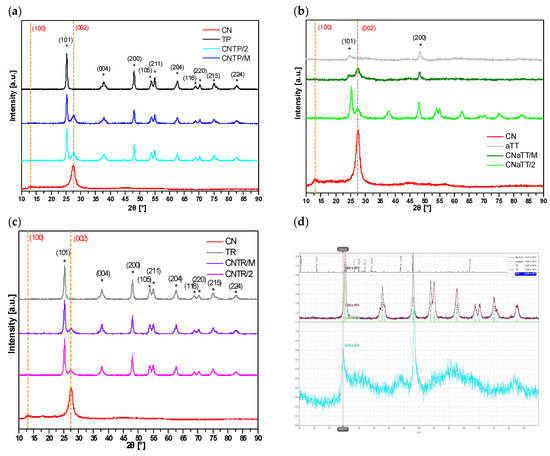
Figure 2.
XRD patterns of the investigated photocatalysts (a–c) and Na-titanate simulation (d). The orange dashed lines represent the characteristic peaks of g-C3N4 (PDF ICDD 00-066-0813) and the * the characteristic peaks of anatase TiO2 (PDF ICDD 01-086-1157).

Table 1.
Results of nitrogen physisorption experiments (specific surface area (SBET), pore volume (Vpore), and pore diameter (dpore)), estimated crystallite size for TiO2 particles at 48° 2θ calculated using the Scherrer equation for spherical particles using the results of the XRD analysis, and peak positions of the (002) peak for g-C3N4 materials (CN). In all cases, the standard deviation was rounded up to the corresponding trustworthy decimal place.
2.1.3. Determination of Porosity of Samples
Nitrogen adsorption/desorption experiments were carried out to obtain information on the porosity of the tested samples. All photocatalysts show isotherms (Figure S1a) that correlate with the IUPAC nomenclature of type IV(a) with an H3 hysteresis loop, indicating a mesoporous structure with slit-like pores [35]. The specific surface areas (SBET) of the investigated materials were calculated using the Brunauer–Emmett–Teller (BET) theory. Table 1 shows that the pure CN sample had a characteristically low SBET of only 17 m2/g. In contrast, all pure TiO2 components had higher SBET values, with the highest value of 337 m2/g for the aTT sample, probably due to the nanotubular morphology observed in the TEM analysis (see below). All investigated composites exhibited higher SBET values compared to the pure CN sample, regardless of the TiO2 morphology used. When the mortar composites were annealed, a slight decrease in the SBET value can be observed, which is due to the partial melting of the CN component [36]. Since the pure aTT sample had a relatively high SBET value, the composites retained this high value. Interestingly, the CNTP and CNTR series had similar SBET values, although the pure TR sample had a higher SBET value than the pure TP solid. The greater decrease in the SBET of the CNTR series compared to the TR sample may indicate that a greater proportion of the CN component was present in the pores of TR than in the CNTP series, resulting in closer contact between the components. Using the Barrett–Joyner–Halenda (BJH) theory, we calculated the pore distribution (Figure S1b), which shows that most of the pores originated from the TiO2 component. It can be seen that the aTT-containing samples have three peaks compared to TR- (two peaks) and TP-containing samples (two peaks). The smaller mesopores allow the aTT and TR samples to have a larger surface area. The addition of the low porosity CN component decreased the intensity of all composite samples compared to the pure TiO2 samples. However, the BJH curves of the composites are still similar to the curves of pure TiO2. The most drastic decrease was observed for the CNTR/2 composite, as the pore volume decreased by almost 50% compared to the pure TR sample (Table 1), followed by the CNTP composite. This could indicate that a larger portion of the CN component penetrated into the pores and formed a tight bond with the TR component. Although the specific surface area was similar for the CNTP and CNTR series, the pore volume and pore diameter were slightly larger for the CNTR series, as the value was higher for the pure TR sample. This can be advantageous for the photocatalytic activity, as the molecules can reach the active sites more easily if the material is more porous.
2.1.4. Other Surface Properties
The surface properties of the photocatalysts influences their photocatalytic reaction [37,38]. To obtain information about the acidic surface sites (AcSS) and the point of zero charge (pHPZC), we performed measurements of Pyr-TPD (Figure S2a,b) and the pH-related zeta potential (Figure S3a–d). It can be observed that the AcSS originates from the TiO2 component, with the highest AcSS concentration being 428 µmol/gcat (TR, Table S2). The addition of the CN component decreased the AcSS concentration regardless of the synthesis method used, with the exception of the CNaTT/2 composite, where changes in aTT occur during calcination (Figure 2, XRD). Moreover, the AcSS density is similar for the annealed samples, so that the acidic surface properties probably do not play a decisive role in the photocatalytic process. Similar observations can be made in the determination of pHPZC. A detailed description of AcSS and pHPZC can be found in the Supplementary Information.
2.1.5. Investigation of Phase Composition, Morphology, and Crystal Structure
The phase composition, morphology, and crystal structure of the samples were analyzed using transmission electron microscopy (TEM) and scanning electron microscopy (SEM in Figure S4, see Supplementary Information). Figure S5a contains supporting information about the determination of the suggested indexation of the crystal facets. The commercial TiO2 sample (TP) consisted of elongated monocrystalline anatase particles with a ratio of approximately 3:1. Most particles are rounded, and some show typical {100} and {101} facets (Figure 3a–d). The aTT sample consists of poorly crystallized anatase nanotubes with a 2 nm thick wall and a diameter of ~10–20 nm, while the total length is >100 nm (Figure 3e–h). The TR sample consists of single crystalline anatase particles with a diameter of 10–20 nm and a length of up to 50 nm, which were probably formed by the collapse of the tubular aTT structure as a result of heat treatment at 500 °C. The particles are elongated in the c-axis direction (Figure 3i–l and Figure S5b). When examining the TiO2/g-C3N4 composites with the TEM microscope, we found that the CN phase is very sensitive to electron beams and tends to deteriorate under the examination conditions. The agglomerates are several µm in size, while the individual CN sheets have a diameter of up to 200 nm and are only a few nm thick. At the edges, the CN sheets tend to bend and form thicker and uneven edges. The SAED is similar to graphene/graphite, indicating a layered structure with a spacing of approximately 3.4 Å. The composites of TiO2 and CN show different degrees of interlocking depending on the synthesis method used. Both phases, TiO2 and CN, retained their typical morphology. In the calcined sample, we observed partial crystallite growth; a small amount of anatase particles (TP) showed a clear increase in size, while their morphology remained round, without characteristic crystal facets and without phase transformation (Figure 4a–c). In the samples mixed with mortar, the aTT nanotubes and CN films remain together with their morphology (Figure 4d–f). In addition to mixtures, it is possible to recognize an accumulation of individual aTT and CN phases, indicating incomplete mixing. In the TR sample, we found anatase particles up to 50 nm in size, which mainly accumulated at the thickened CN edges (Figure 4g–i). This could limit the photocatalytic activity as the total area of the interface is not optimal (TR evenly distributed over CN), which may limit the efficiency of the separation of charge carriers.
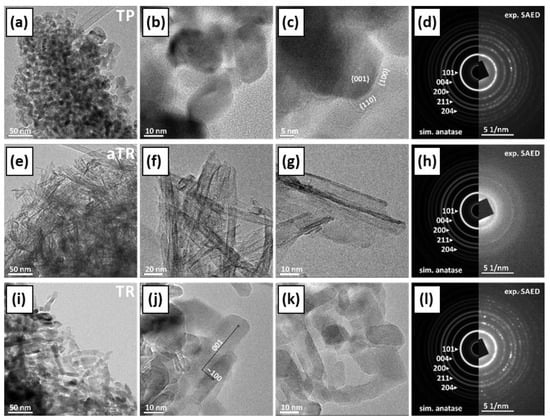
Figure 3.
TEM micrographs of the investigated TiO2 morphologies ((a–c) TP, (e–g) aTT, and (i–k) TR) obtained at different magnifications, and corresponding experimental selected area electron diffraction (SAED) patterns compared with the simulated patterns for anatase ((d) TP, (h) aTT, and (l) TR)).
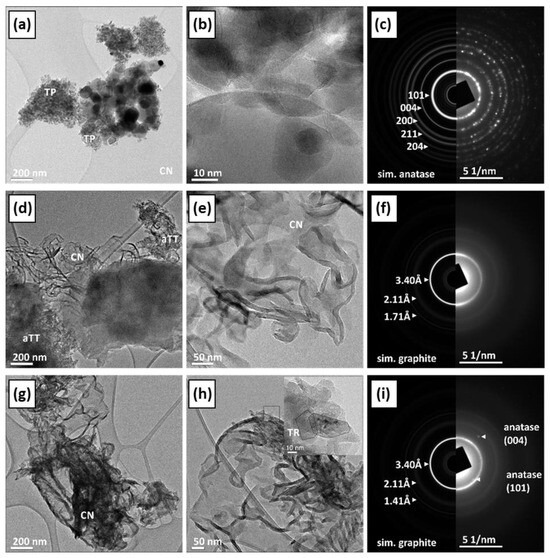
Figure 4.
TEM micrographs obtained at different magnifications and results of experimental selected area electron diffraction (SAED) patterns compared with the simulation patterns for anatase and graphite for CNTP (a–c), CNaTT (d–f), and CNTR (g–i).
2.2. Optical and Electronic Properties of the Investigated Materials
2.2.1. UV-Vis DR Measurements
We carried out UV-Vis DR measurements to evaluate the light absorption properties of the investigated materials. Figure 5a shows that all pure TiO2 components absorb light only in the UV light range. Due to the amorphous nature of the TiO2 in the aTT sample, the band edge was blue shifted compared to the TR and TP samples. In contrast, pure g-C3N4 absorbs UV light and light in the visible range almost up to 550 nm due to the π-conjugated system [4]. All investigated composites exhibited absorption in the visible range (up to nearly 550 nm) due to the presence of g-C3N4 and retained absorption features resembling both components. The range of visible-light absorption was largest for the CNTR series, followed by the CNTP series, which may indicate an improved photocatalytic activity of the CNTR series, as a larger portion of the visible-light spectrum can be utilized. The CNTR series also had a slightly changed absorption edge that might indicate the presence of a different kind of interaction (transition) between the CN and TR component. Using the Kubelka–Munk theory (Equation (1)), we calculated the optical band gaps of the investigated materials (Table S3). As expected, all pure TiO2 components exhibited characteristic band gaps for pure anatase titania, with the lowest value of 3.19 eV being for the TR sample. The lower value could be due to the presence of defects and/or the increased amount of Ti3+ affecting the light absorption properties [5,6,12,39,40,41]. The presence of defects and even some distortions [42] in the material can slightly shift the VB and CB to reduce the optical bandgap. However, the shift compared to the original TP (band gap of 3.23 eV) was small. This agrees with the XRD analysis, where we did not observe any major changes in the lattice for TP or TR samples as no obvious peak shifts were present. The presence of Ti3+ and O-vacancies (confirmed below) will have another effect for the light absorption properties, as they usually generate mid-level band gap defect states below the CB that lower the required energy barrier that photogenerated electrons need to overcome [5,6,12,39,40,41]. One could argue that the “effective” band gap is reduced in comparison to the “true” optical band gap. Therefore, we expect that pure TR and all CNTR composites will exhibit enhanced visible-light absorption and improved photocatalytic responses. These mid-level defect states are also probably the reason for the slight change in the shape of the absorption edge for all CNTR composites. The addition of CN (2.58 eV) decreased the band gap values for all composites. Since the band gap value was highest for the aTT sample, the composites also exhibited a higher value compared to other composites (Table S3). When all mortar composites were annealed for 2 h, a slight increase in the band gap value was observed as the g-C3N4 decomposed slightly (Table S1), except for the CNaTT/2 composite, where the crystallinity of the aTT component was improved during annealing. However, a slightly higher band gap can also have positive effects on the catalytic activity, as it can hinder the recombination of charge carriers.
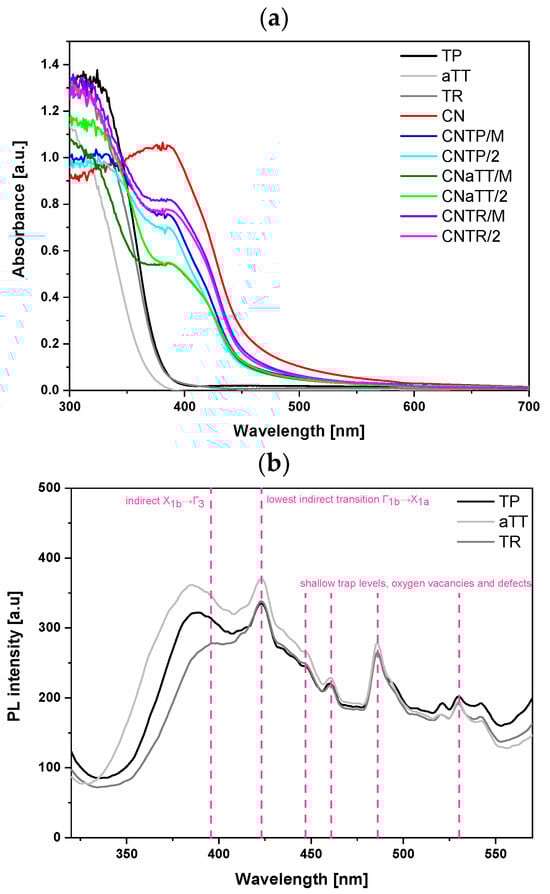
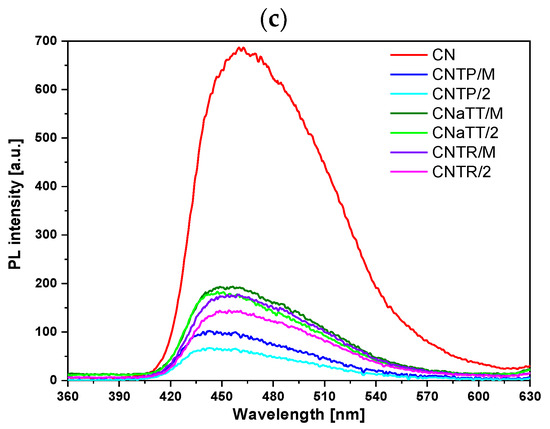
Figure 5.
Results of (a) UV-Vis DR measurements, (b) solid-state photoluminescence (PL) spectra of bare TiO2 morphologies (excitation at 300 nm, scan rate 150 nm/min, emission slit 5.5 nm), and (c) bare CN and TiO2/CN composites (excitation at 320 nm, scan rate 200 nm/min, emission slit 2.6 nm). Pink dashed lines indicate characteristic TiO2 transitions.
2.2.2. Solid-State PL Measurements
To assess the radiative charge recombination tendency, we measured the solid-state photoluminescence (PL) spectra of the samples. Figure 5b shows the PL spectra of the pure TiO2 components, with an experimental setup different from the g-C3N4 samples. The PL signals were similar across TiO2 morphologies. The first transition (~3.17 eV) corresponds to the band edge of anatase TiO2 (indirect transition X1b→Γ3 [43,44]). The TR sample, having the lowest band gap, shows the most red-shifted edge transition at 395 nm (3.14 eV). As the band gap increases, this transition shifts blue to 387 nm (TP) and 384 nm (aTT). TR also exhibits the lowest PL intensity, indicating favorable carrier dynamics and reduced charge recombination, potentially due to its larger particle size compared to TP [45]. The peak at 423 nm corresponds to the lowest indirect transition Γ1b→X1a (2.93 eV). The aTT sample shows the highest PL signal due to its low crystallinity, which promotes charge recombination, though no peak shift is observed. Similarly, the peaks at 446, 460, 485, and 529 nm, caused by shallow trap levels, oxygen vacancies, and defects, did not shift [8,43,44,45,46]. These oxygen vacancies likely formed during TiO2 synthesis. The hydrothermal synthesis and subsequent calcination of aTT to TR increase defects (oxygen vacancies), potentially enhancing photocatalytic activity [47]. This is reflected in the reduced PL signal at 529 nm (2.34 eV) compared to TP. Moderate defects act as traps, preventing charge recombination, while excessive defects accelerate it.
We also measured the solid-state PL spectra of the composites with corresponding settings for g-C3N4, the component active in visible-light absorption. Figure 5c shows that all photocatalysts exhibit a broad peak at ~460 nm (2.64 eV), which can be divided into three peaks using a Gaussian model fit: σ*-LP (440 nm), π*-LP (460 nm), and π*-π (490 nm) [4,25,30,48], as seen in Figure S6a–d. Comparing pure CN and composites reveals two changes (Table S4): (i) a slight blue shift due to heterojunction formation and (ii) a drastic decrease in PL intensity (area). The PL intensity reduction is mainly attributed to fewer π* → π and π* → LP transitions in g-C3N4 [25], as photogenerated electrons move from the conduction band (CB) of g-C3N4 to the CB of TiO2, regardless of morphology. Composites with aTT have lower crystallinity, reducing charge carrier mobility, which accounts for the highest PL intensity among the composites. Increased TiO2 crystallinity improves the charge carrier mobility, leading to a lower PL signal. Annealing mortar composites further enhance the charge carrier transport by improving the interface between components. The CNTP/2 composite had the lowest PL signal, likely indicating the longest charge carrier lifetime, as all transition areas decreased significantly alongside a peak blue shift compared to CN. Meanwhile, CNTR/2 showed a larger area for all three peaks and the greatest red shift among composites. However, a blue shift in CNTR/2 compared to CN indicates heterojunction formation. Differences in peak positions between CNTP/2 and CNTR/2 may suggest distinct interactions between CN and TP or TR components. This was also evident in UV-Vis DR spectra (Figure 5a), where CNTR series absorbed the most visible-light. The SEM images (Figure S4b) show that TiO2 is more exposed on g-C3N4 in the CNTP composite, possibly reducing the PL signal since PL spectra measurement settings were optimized for g-C3N4. The exposed TiO2 could act as a shield, distorting results. The UV-Vis DR, EPR, and XPS analyses revealed surface Ti3+ in TR and CNTR/2 samples, which can generate charge carriers under visible-light. In CNTR/M and CNTR/2 composites, this enables a Z-scheme mechanism, where h+ from CN and e- from TR recombine, producing a PL signal. This explains the higher PL signal of CNTR/2 compared to CNTP/2, which has little or no Ti3+ content.
2.2.3. Electrochemical Investigation
Normally, the lowest PL signal indicates the best photocatalytic performance, as the chances of utilizing charge carriers increase. However, this assumption might be wrong, as charge carriers can also recombine non-radiatively. Therefore, we performed electrochemical impedance spectroscopy (EIS) to evaluate the charge transfer resistance (RCT) and to obtain information about the dynamics of charge transfer in the investigated materials. The obtained Nyquist diagrams in Figure S7a–d were fitted with the electrochemical equivalent circuit shown in Figure S7e. From the results in Table S3, all pure components exhibit high RCT values, which limits their photocatalytic activity. Of all the pure TiO2 components, the TR sample exhibited the lowest RCT value (0.90 MΩ), which can be attributed to the improved structural and optoelectronic properties described in the previous sections (and below in the EPR section). In comparison, all composites exhibited lower values than their pure counterparts, as the formation of a heterojunction improves the charge transfer dynamics. Due to the poor crystalline nature of the aTT sample, all composites with aTT retain a high RCT value. Since the properties of the CNaTT/2 composite are similar to those of the CNTR/M material, it is no wonder that they have similar RCT values. The lowest RCT value of all photocatalysts, i.e., the best charge carrier transfer, is exhibited by the CNTR/2 photocatalyst (0.40 MΩ), followed by the CNTP/2 composite (0.48 MΩ). In general, the entire CNTR series shows better charge carrier dynamics than the CNTP series. This is due to the unique properties of the TR sample, such as the improved crystallinity and the higher Ti3+ content at the surface (see EPR and XPS section below). The latter could enable the formation of an intimate heterojunction between g-C3N4 and TiO2 and influence the nature of the charge carrier mechanism in the photocatalytic reactions. Overall, the EIS results agree quite well with the PL measurements. However, since they account for all recombination processes, they confirm that charge separation is most enhanced in the CNTR/2 photocatalyst. Consequently, we can assume that the CNTR/2 photocatalyst could be the most active among all composite materials.
2.2.4. Solid-State EPR Investigation
To investigate the properties of the synthesized materials, we performed direct CW-EPR measurements at room temperature (RT) and liquid nitrogen temperature (LN2). All samples were measured in an air atmosphere. The solid-state EPR spectra recorded at RT (Figure S8) show that different TiO2 morphologies yield distinct EPR spectra, with signals for O-vacancies, Ti3+, N-species, S-species, etc. [49,50,51,52,53]. Due to the amorphous nature or low crystallinity of the aTT sample, it likely lacks paramagnetic centers, resulting in an EPR-silent signal in both the dark and under visible-light illumination (Figure S8). The exception is the signal at a g value of 2.004, which could be attributed to CB electrons or O-species formed by hole trapping in the subsurface [52,53,54,55,56]. The g-values above 2.0 typically indicate hole trapping (O-vacancies interacting with O-species), while values below 2.0 correspond to electron trapping (at Ti3+ sites in the bulk or surface). The absence of Ti3+ and O-vacancy signals in the aTT sample can be due to the limitations of RT EPR measurements, which affect the resolution [55,57]. Furthermore, due to the EPR spectrometer’s limitations and sample heterogeneity, some signals may merge or be lost, increasing uncertainty. In contrast, the TP and TR samples show an EPR response in the dark (Figure S8), attributed to O-vacancies (hole trapping) and Ti3+ (electron trapping) [49,50]. Both samples exhibit the g = 2.004 signal observed in the aTT sample. In the TP sample, we observe sharp signals for Ti3+ and O-vacancies, with a peak at g = 2.007 and a small shoulder, suggesting similar O-vacancies without complex environments. The signal at g = 2.023 may also belong to this group, alongside the g = 2.007 and g = 2.004 signals for O-species [12,49,52,54,58,59,60]. The signal at g = 2.023 could originate from paramagnetic sulfur species, as the CHNS analysis showed a low sulfur content (<0.1 wt.%), likely due to the synthesis procedure [51]. We also observe a signal at g = 1.997 for the TP sample, attributed to Ti3+ in the bulk/lattice, along with other Ti3+ signals at g = 1.981, g = 1.969, g = 1.956, and g = 1.943 [49,59], although their resolution is low. The signals at g = 1.997 and around 1.960 likely represent bulk Ti3+ [12,52,56,57,58,61,62], as suggested by the shape of the g = 1.997 signal [48]. Other signals overlapping between 340 and 355 mT may correspond to surface Ti3+ in different environments, though their concentration is minimal, as no surface Ti3+ was detected using XPS (see below). Since XPS is a surface-sensitive technique with a limit of detection (LOD) of about 0.1 at.%, we conclude that most Ti3+ in the TP sample is in the bulk/lattice. Furthermore, the UV-Vis DR spectra and the color of the TiO2 samples (remaining white) suggest that the Ti3+ content is minimal. Thus, distinguishing specific features in the 340–355 mT range using X-band CW-EPR at RT is challenging. Under visible-light illumination, the TP sample shows no electron capture at g < 2.0, likely due to the low Ti3+ content in the bulk/lattice, which cannot generate charge carriers. However, in the g > 2.0 region, signals corresponding to hole trapping are observed. The signal at g = 2.004 decreases, while those at g = 2.023 and g = 2.007 increase, with g = 2.007 showing the most significant increase, likely due to hole trapping at O-vacancies (defects) [10,47]. In contrast, the TR sample exhibits a different EPR spectrum, with signals for O-species at g = 2.004 and g = 2.007, along with a more pronounced O2− signal at g = 2.095. The g = 2.023 signal is absent in the TR sample, and, since neither the TR nor aTT samples show the g = 2.023 signal, and no sulfur impurities were detected in their XPS spectra, we can tentatively attribute the g = 2.023 signal to sulfur impurities removed during hydrothermal synthesis. It is unusual for the TP sample to show a signal for O2− species, as most O-vacancies and defects are present in the bulk at low levels, making it difficult for oxygen to interact with holes. However, the TR sample likely has a higher number of O-vacancies on the surface and subsurface, which could generate this signal. Additionally, the peak at g = 2.007 becomes broader and more intense, suggesting more surface and subsurface O-vacancies that create different environments [54,57,58,60]. This is supported by solid-state PL measurements of bare TiO2, indicating a higher O-vacancy content. When comparing the TP and TR samples, we observe changes at g < 2.0, specifically the disappearance of the signal at g = 1.997, corresponding to bulk Ti3+. This suggests that Ti3+ is more present at the surface than in the bulk/lattice, likely due to hydrothermal treatment and crystallization at 500 °C. Some broadening of the signal could merge with O-vacancy signals, indicating more Ti3+ at the surface [50,52]. The XPS measurements also confirmed the presence of surface Ti3+. Moreover, we see an increase in the broad signal between 340 and 350 mT, confirming a higher proportion of surface Ti3+ in the TR sample, which is favorable for visible-light absorption. The Ti3+ forms defect states in the band gap below the CB, allowing for visible-light utilization. The more defect states present on the surface, the more visible light can be used. These observations are also reflected in the red-shifted UV-Vis DR absorption edges of TR-containing samples. This means more charge carriers can interact with oxygen species in water to form ROS. Under illumination, the TR sample showed no major changes at g < 2.0, likely due to thermal effects at room temperature and fast charge carrier recombination, but we observed an increase in EPR signals at g > 2.0. In contrast to the TP sample, the TR sample showed an increase in all signals corresponding to oxygen species, indicating successful hole trapping at O-vacancies. This is why the TR and CNTR samples exhibit a lower PL and the lowest RCT values compared to other materials.
To fully evaluate the properties of all TiO2 components, we performed CW-EPR measurements at liquid nitrogen (LN2) temperature. As seen in Figure S9, the aTT sample still shows no characteristic signals for Ti3+ or O-vacancies, only the O- signal at g = 2.004. Similar to the RT measurements, the TR sample exhibits signals for O-vacancy sites (g > 2.000), O- (g = 2.004), and Ti3+ in the featureless region around g = 1.934. The small features in the RT spectra of TR (Figure S8) are likely artefacts or thermal interactions related to electron capture (Ti3+ at g < 2.000). The spectra suggest that Ti3+ and most O-vacancies in TR are located on the surface, with O-vacancies also present in subsurface levels. No signals for nitrogen, carbon, or sulfur species were observed in the TR or aTT samples, confirming that the hydrothermal treatment removed impurities. This is also supported by XPS data, which show no S or N signals, and only a small amount of adventitious carbon species on the aTT and TR surfaces. The aTT sample has more adventitious carbon due to its large specific surface area. Surprisingly, the LN2 EPR spectra of the TP sample show the greatest difference compared to its RT spectra, and to the spectra of aTT and TR samples. The signals are intense, sharp, and well-defined. These signals likely correspond to nitrogen species on the surface of the TP sample, as observed in the XPS survey spectra (Figure 6a). This allows for a clearer assignment of the different EPR signals for the TP sample compared to the RT measurements, where the error margin was larger. From Figure S9, we observe two different nitrogen species, although the resolution is limited due to the EPR spectrometer and sample heterogeneity. Several signals were identified, including nitrogen species (NO) adsorbed on the surface, marked with blue, green, and magenta in Figure S9. Notably, signals at g = 2.002 and g = 1.979 were absent in the RT EPR spectra, consistent with findings in the literature [63,64]. Additionally, signals corresponding to a single nitrogen atom trapped in the bulk of TiO2 (Nb) were detected, labeled olive, red, and dark orange. The signals at g = 2.006 and g = 2.022 could also be attributed to O- and S-species [51,53], though distinguishing between them is challenging due to signal overlap and sample heterogeneity. However, some paramagnetic nitrogen species may still be present in the bulk, in agreement with previous studies [62,63,64,65]. Our alkaline hydrothermal treatment removed these nitrogen and sulfur impurities while “rebuilding” the TiO2 nanoparticles. Thus, TR and aTT materials show no N-species signals. We also detected two signals likely corresponding to Ti3+ in the bulk/lattice (g < 2.000) [50]. The LN2 EPR results differed slightly from RT data but confirm that (a) the TP sample was purified from nitrogen and sulfur impurities, (b) the surface and subsurface O-vacancies in TR were increased, and (c) a small amount of surface Ti3+ was introduced into the TR sample, enhancing the photocatalytic activity of the CNTR series.
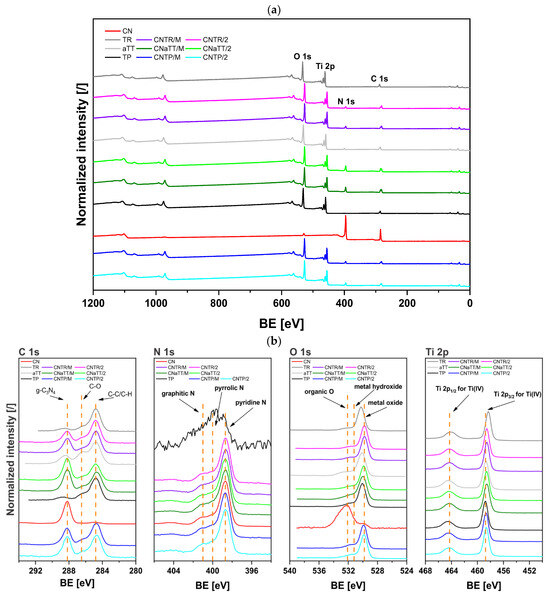
Figure 6.
(a) Survey and (b) high-resolution XPS spectra for the investigated catalysts samples.
We also performed CW-EPR measurements at RT for pure g-C3N4 (CN) and CN-containing samples. For pure CN (Figure S10a), we observe a characteristic single Lorentzian line with a g value of ~2.007, typical of g-C3N4 due to unpaired electrons trapped at sp2 C atoms in the heptazine moiety [66]. Upon visible-light illumination, the signal intensity increases as photogenerated electrons act as paramagnetic centers. The signal broadens at higher magnetic fields, likely due to defect sites and different environments in pure CN. When comparing the EPR spectra of the composites (Figure S10b,c), the CNTR series (both mortared and annealed for 2 h) shows the highest EPR signal/area compared to the other composites, with CNTP/2 being similar to CNTR/2. These results align with the PL and EIS analyses (Figure 5c and Figure S7), where the CNTR and CNTP series exhibited good carrier dynamics. In the EPR spectra of all composites, we observe an intense signal at g ≈ 2.007, corresponding to the CN component. The different shapes of CNTR/M and CNTR/2 suggest the presence of O-vacancies and possibly Ti3+ from the TR component, which has a higher quantity of surface O-vacancies and Ti3+ than the TP component. Since the defects visible in the EPR spectra act as traps, charge carrier recombination is hindered, resulting in a decrease in the PL signal (Figure 5c) and a reduced RCT value (Table S3). However, for effective photocatalysis, these traps must be superficial. If deep, electrons are captured but cannot generate reactive oxygen species (ROS). To validate these EPR observations, we performed XPS analysis and photocatalytic experiments under visible light (discussed below).
2.3. XPS Analysis of Solid Nanomaterials
Figure 6 shows the survey and high-resolution XPS spectra. The survey spectra in Figure 6a show signals for C 1s, N 1s, O 1s, and Ti 2p. The Ti 2p signal is absent in the CN sample because it contains only pure g-C3N4. The N 1s signal is missing in the aTT and TR samples, likely due to hydrothermal synthesis and calcination in air at 500 °C, which removed surface-adsorbed N-containing species. The TP sample also shows peaks for S 2p and S 2s, indicating sulfur residues from the manufacturer’s synthesis process, which were removed using hydrothermal treatment in the aTT and TR samples. The Na 1s peak at about 1072 eV is absent, confirming that no sodium was present in our materials. The Na KLL Auger peaks at about 500 eV are also missing. XRD and SAED analysis further supports this, showing no detectable Na species, confirming that no Na titanate was retained in the dried aTT or TR samples despite hydrothermal treatment with NaOH.
High-resolution C 1s spectra are shown in Figure 6b. The spectra consist of three contributions: a C-C/C-H peak at 284.8 eV, a high-intensity shoulder on the high binding energy side representing C-O, and the peak for C in g-C3N4 at 288.2 eV (example in Figure S11a) [32]. The C-C/C-H and C-O peaks are from adventitious carbon. The C in g-C3N4 peak is absent in the TP and TR samples because they lack g-C3N4. The CN sample shows only the C in the g-C3N4 peak. In the aTT sample, the intensity of C-O species is higher compared to C-C/C-H, likely due to its higher specific surface area, providing more adsorption sites. Overall, the C 1s spectra of all composites show similar shapes and positions, indicating a comparable C environment regardless of the TiO2 support or synthesis method.
The N 1s spectra are shown in Figure 6b and can be fitted with three components, as shown in Figure S10b. The signal at 398.7 eV is assigned to pyridine-N, followed by pyrrole-N at 400.0 eV, and the peak with the highest binding energy is assigned to graphitic N [32] (example in Figure S11b). A lower intensity peak is observed in the TP sample, likely due to the manufacturer’s synthesis procedure or surface-adsorbed nitrogen species. Similar to the C 1s spectra, all composites show comparable N 1s spectral shapes and positions, indicating a similar N environment.
The high-resolution O 1s XPS spectra (Figure 6b) show three features: Ti oxides at ca. 529.8 eV, a weak shoulder for metal hydroxides at ca. 531.2 eV, and a peak with the highest binding energy (intense in the CN sample), likely from organic compounds and/or water molecules on the surface [32]. An example of a deconvoluted O 1s spectrum is shown in Figure S11c. In the TP sample, the signal appears at the lowest binding energy, shifting slightly to a more positive value for the TR sample. This shift suggests oxygen vacancy formation, but it may also indicate different types of -OH groups on the surface, as noted by Posada-Borbón et al. [67]. The positive shift should be interpreted with caution. Solid-state EPR and PL measurements, however, indicate a higher content of oxygen vacancies in the TR sample. There are no major differences in the chemical environment between the photocatalysts, as seen in the C 1s and N 1s spectra.
High-resolution Ti 2p XPS spectra are shown in Figure 6b. The Ti 2p3/2 peak for Ti4+ [32] appears at a similar binding energy for all samples, except for the TR sample, where it shifts to a more negative binding energy, indicating more Ti3+ on the surface due to oxygen vacancy formation [68,69,70]. This shift is supported by solid-state EPR measurements. For the TR sample, the increased oxygen vacancy content (EPR and PL) also correlates with higher Ti3+ levels observed in XPS. No Ti3+ is seen in the TP sample, as Ti3+ is deeper in the material, as confirmed using EPR and XPS [6]. Furthermore, the lack of a shift of the Ti 2p3/2 peak to more positive binding values, compared to TiO2, confirms the absence of NaTiO3. Comparing the CNTP/2 composite with the pure TP sample, there was a slight shift to a more negative binding energy. However, for the CNTR/2 composite, a shift towards a more positive binding energy was observed, suggesting a different charge carrier mechanism, possibly a Z-scheme similar to Jo et al. [30]. Still, the binding energy of CNTR/2 was slightly lower than CNTP/2, likely indicating a higher surface Ti3+ content in the CNTR/2 sample.
2.4. Photocatalytic Activity Under Visible-Light Illumination
2.4.1. Photocatalytic Bisphenol A Degradation
In order to evaluate the investigated photocatalysts for use in possible environmental remediation processes, the photooxidation of dissolved BPA in water was carried out under visible light (Figure 7a and Figure S12a). Due to the high band gap value of pure TiO2, the aTT, TP, and TR materials exhibited only low BPA degradation (Figure S12a), which was mainly due to the presence of some defects. This is especially true for the TR sample, where the higher content of Ti3+ allows some response to visible light, as the surface Ti3+ and O-vacancies induce mid-level defect states [10]. Due to the low specific surface area and the high tendency to recombine charge carriers, the pure CN also shows a low BPA degradation rate under visible light (Figure S12a). On the other hand, all CN-containing photocatalysts show an improved photocatalytic response when illuminated with visible-light (Figure 7a). Since the gray area in Figure 7 represents the dark period in which only adsorption/desorption processes take place, we can conclude that no adsorption takes place, as the maximum value does not even reach 3%. Therefore, the main mechanism responsible for the removal of BPA is photocatalysis. Interestingly, the activity of the CNTP/M composite is still low and improves when additional calcination is performed to form a better heterojunction (as seen in PL and EIS analysis). Nevertheless, it is lower than that of the CNaTT and CNTR series. Due to the increased SBET, the CNaTT/M and CNaTT/2 composites show a better response than the CNTP series. Since annealing the aTT component changes the crystallinity (CNaTT/2), the photocatalytic response is similar to that of the CNTR/M material. The CNTR/2 sample shows the highest photocatalytic response, as the additional calcination improves the charge transfer process compared to the CNTR/M composite (PL and EIS), even though it had a lower SBET than the CNaTT series. The CNTR/2 sample also had a significantly higher photocatalytic activity compared to commercial TiO2 (TP sample, Figure S12a) and g-C3N4 (TCI sample, Figure 7a). In addition, the CNTR/M and CNTR/2 composites showed high TOC removal with only low carbon accumulation (Table 2 and Table S1). We also found that the catalyst concentration used (125 mg/L) was likely optimal given the cost of the catalyst, as doubling the concentration (ccat = 250 mg/L) only increased the activity by ~20% of BPA degradation (Figure S12b). The CNTR/2 composite maintained its high activity after three cycles (BPA degradation from 30.3 to 28.8%), as its structure did not change significantly before and after the reaction (Figure S12c,d), indicating increased stability.
Figure 7.
(a) Photooxidation of water-dissolved bisphenol A (BPA) in the presence of the investigated photocatalysts under illumination with visible light and (b) in situ quenching experiments for CNTR/2 sample. The gray area represents the dark period in which the adsorption–desorption equilibrium is formed. The average ± standard deviation of triplicate tests is shown.
Table 2.
The reported values of total organic carbon (TOC) removal (which represent a sum of TOC mineralization (TOCM) and TOC accumulation (TOCA)) and corresponding values of BPA degradation measured at the end of the BPA oxidation runs. In all cases, the standard deviation is rounded up to the corresponding trustworthy decimal place.
In addition, the photodegradation efficiency of BPA by CNTR/2 was evaluated in comparison with other similar photocatalysts reported in the literature [36,71,72], as summarized in Table 3. The results show that the synthesized CNTR/2 composite exhibits comparable or even better performance in the degradation of BPA under visible light. This underlines the exceptional potential of CNTR/2 as an effective and promising photocatalyst for the degradation of BPA in an aqueous environment.
Table 3.
Comparison of the photocatalytic degradation performance of the synthesized photocatalysts with previously reported photocatalysts from the literature for BPA removal (BPA degr.) after 120 min of light exposure.
2.4.2. In Situ Quenching Experiments
To find an explanation for the increased photocatalytic activity, we performed an in situ quenching reaction for the CNTR/2 composite (Figure 7b). We used the following quenchers: p-benzoquinone (BQ, ), sodium azide (NaN3, 1O2), tert-butanol (t-BuOH, OH·), and formic acid (HCOOH, h+). Figure 6b shows that quenching with NaN3 or t-BuOH has no effect on the photooxidation of BPA, which means that 1O2 and OH· are not the most important ROS. However, when using another OH· quenching agent, namely methanol (MeOH), we can observe a stronger decrease in activity. The reason for this could be that when t-BuOH is used, a certain amount of ROO· can be formed, which is used to degrade organic pollutants [73]. This could explain why we still observe high BPA degradation even when we intercepted OH·. However, for both OH· quenchers, the loss of activity is low, implying that OH· is not the dominant active species. The addition of BQ completely inhibits the degradation of BPA, which proves that the major ROS is . In addition, the addition of HCOOH reduces the degradation of BPA to some extent, implying that the holes generated by the light also play an important role. Thus, the reason for the improved activity of the CNTR/2 composite must be related to the differences between the two TiO2 samples (TP and TR) that influences the formation of different ROS.
2.5. Discussion of Improved Photocatalytic Activity
The superior activity of the CNTR/2 composite can be attributed to several factors. First, the SBET of the TP and TR series was similar, so it is not a decisive factor. The main difference lies in the better crystallinity of the TR series, which improves electron migration, and the elongated nanoparticle shape. In contrast, the aTT component, with poor crystallinity, reduces charge carrier mobility, despite its high SBET and tubular morphology, which typically enhances photocatalytic activity. As a result, the CNaTT series shows lower activity than the CNTR series. Specifically, the CNTR/2 photocatalyst demonstrates the best charge carrier separation (lowest RCT value of 0.40 MΩ). Second, the CNTR series has the largest pore diameter, allowing better access to active sites for BPA molecules. A larger pore size also reduces photon scattering and reflection, enabling greater light absorption [74]. Third, the decrease in SBET between the CNTR/2 and TR samples is more pronounced than between CNTP/2 and TP, suggesting that the CN component interacts more strongly with the TR component, forming a closer interface. Fourth, the opto-electronic properties of the TR series differ from the TP series. Pure TR and its composites show a red shift in UV-Vis DR and PL measurements, indicating better visible-light absorption. This is due to the increased presence of surface Ti3+ and O-vacancies, observed in EPR and supported by the XPS analysis. Ti3+ enables visible-light utilization, while O-vacancies improve the charge separation in TR compared to other TiO2 materials (PL, Figure 5b) and CNTR composites (EIS, Table S3). Ti3+ and O-vacancies form defect states below TiO2 conduction band, reducing the energy required to form charge carriers and enhancing carrier separation by trapping them. The presence of Ti3+ in the TR sample and its ability to absorb visible light likely influences the type of heterojunction and migration mechanism. Typically, pristine TiO2 and g-C3N4 systems behave as type-II heterojunctions under visible light [75], since anatase TiO2 cannot absorb visible light. This was observed in the CNTP/2 composite, which behaves as a type-II heterojunction. However, when Ti3+ is present on the surface of TiO2 (as seen in EPR and XPS analyses), it can absorb visible light and generate charge carriers in the TiO2 component. In this case, the g-C3N4/TiO2 composite may behave as a direct Z-scheme photocatalyst, where the less reductive electrons from one component (TR) interact with the less oxidative holes in the other (CN), leaving the stronger counterparts intact. This is suggested by the XRD, PL, EIS, and XPS results [30]. Additionally, the CNTR series showed a higher PL signal intensity compared to the CNTP series. This could be due to shielding by TiO2 in CNTP, or the recombination of weaker charge carriers in the direct Z-scheme, which generates the PL signal. The spatial separation of stronger charge carriers is also reflected in the lowest RCT value of the CNTR/2 composite. However, despite the ability of TiO2 to absorb some visible light, the absorption properties remain limited by the small amount of Ti3+ in the sample, as evidenced by the TR sample’s white color (instead of turning gray, black, or blue, as seen with higher Ti3+ amounts) [10]. It is likely that a dual charge carrier mechanism is at play [76,77,78,79,80,81,82,83,84,85]. Therefore, we can assume that both type-II and Z-scheme mechanisms are present in the CNTR/2 sample (Figure 8). The partial Z-scheme mechanism enhances photocatalytic activity via reduction electrons in CN and oxidative holes in the TR component (Ti3+ moiety), while the type-II process dominates in the majority of samples.
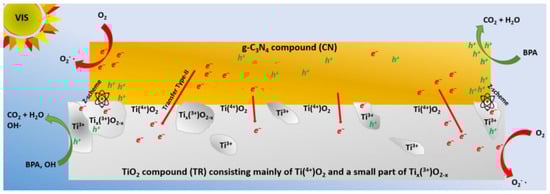
Figure 8.
The proposed dual mixed type-II/Z-scheme charge carrier mechanism for the CNTR/2 photocatalyst under visible light. The gray area shows TiO2 with Ti(4+)O2, the main part of the TR particle, which does not produce charge carriers under visible light and follows a type-II transfer mechanism. The white areas represent small Tix(3+)O2−x regions that are excitable to visible light due to mid-level defects (Ti3+ and O-vacancies). The charge carrier formation in the TR component enables a direct Z-scheme mechanism.
Proposed Charge Transfer Mechanism
In the proposed dual mixed charge transfer, the entire CN component produces charge carriers together with small areas of the TiO2 surface containing Ti3+ (Tix(3+)O2−x). Most of the TiO2 particles (with Ti4+) do not produce charge carriers. According to the Z-scheme mechanism, the less reductive electrons in Tix(3+)O2−x parts recombine with the less oxidative holes in the CN component. This probably leads to the radiative relaxations observed in the PL measurements (Figure 5c). In the Tix(3+)O2−x part, the stronger holes remain, which can either generate OH· or oxidize BPA directly. The possible generation of OH· was observed in the coumarin scavenging experiments (see below) and the in situ BPA quenching measurements. On the other hand, the more reductive electrons remain in the CN component and can generate from O2 dissolved in water. However, since the fraction of Tix(3+)O2−x is low (only a few spots in the TiO2 particles), most of the electrons in the CN component jump to the CB of Ti(4+)O2, as this is energetically favorable according to the type-II mechanism. As a result, they have a lower reduction potential, which limits the overall activity of the CNTR/2 sample, as most of the material behaves like a type-II. Furthermore, as can be seen from the TEM analysis, the TR particles are mostly agglomerated at the edges of the CN sheets, which further limits the charge carrier transfer dynamics. Nevertheless, the dual mixed scheme CNTR/2 composite shows a significant improvement in photocatalytic activity compared to the pure type-II mechanism of the CNTP/2 composite. These differences, coupled with the moderate SBET, enabled the CNTR/2 composite to show enhanced photocatalytic activity in the visible light-assisted photooxidation of BPA.
2.6. Reactive Oxygen Species Scavenging Under Visible-Light Illumination
2.6.1. Determination of Hydroxyl Radical Generation Tendency
To evaluate the proposed mechanism of electron migration from Figure 8 and the in situ quenching experiments (Figure 7b), we first performed coumarin scavenging experiments under visible light to determine the generation of OH· (Figure S13a). Since the valence band (VB) of g-C3N4 is too positive to form OH· directly, they are generated via the superoxide radical anion , which forms H2O2 that decomposes to OH·. However, as assumed in Figure 8, a low concentration of OH· can be formed directly from the h+ in the Tix(3+)O2−x part of TiO2 particle. From Figure S13a, it can be seen that pure CN produces the least OH·, as it has a low SBET and high carrier recombination (highest PL signal intensity and RCT value). The addition of TiO2 enhanced the photocatalytic reaction due to the injection of e− from the CB of CN into the CB of TiO2, regardless of the morphology of TiO2. Alternatively, as in the case of the CNTR series, a partial Z-scheme mechanism can proceed. The enhancement of the injection depends on the close interface between the components [25]. As mentioned above, the mortar series exhibits a non-optimal heterojunction, resulting in a lower photocatalytic activity compared to the annealed version. In addition, the CNaTT/M composite produces the lowest amount of OH·, which can be attributed to the poor crystalline nature of the aTT component that limits the mobility of the charge carriers. Interestingly, both the CNTP/2 and CNTR/2 samples showed similar OH· formation rates, with a slight increase in the latter. This could be due to the presence of h+ in the Tix(3+)O2−x portion of the TiO2 particle in the CNTR/2 sample. However, since the Tix(3+)O2−x part is the smaller part of the overall TiO2 particle, most of the charge transfer is subject to the type-II mechanism, limiting the formation of ROS, in this case OH·.
2.6.2. EPR Spin Trapping Experiments
Since e− plays an important role in the use of g-C3N4 materials and to confirm the increased reduction potential of e− in the CB of CN, we performed in situ EPR spin trapping with DMPO/DMSO/catalyst-aerated suspensions to follow the generation of . Figure S13b shows that pure DMSO or DMPO/DMSO does not generate a signal in the dark or when illuminated with visible light. This also applies to CNTP/2 and CNTR/2 suspensions in the dark. However, upon illumination with visible light, we observed the presence of a 12-line signal. The spectra are dominated with the characteristic signals of the DMPO- adduct for both photocatalysts with signal splitting due to interactions of unpaired electrons with nitrogen, hydrogen in β-position, and hydrogen in γ-position. If no interactions were present, we would observe the 1:1:1:1 quartet. The splitting of the adduct can be attributed to the DMPO-OCH3 adduct formed by the reaction with the solvent (DMSO) under visible-light illumination [86], or due to the interactions of O2 with DMPO- [87]. Again, the CNTR/2 photocatalyst produced more of DMPO- adduct compared to the CNTP/2 sample, which can be attributed to the enhanced presence of more reductive e− in the CB of CN due to the partial Z-scheme mechanism with the Tix(3+)O2-x part of the TiO2 particle in the composite material. Therefore, we can confirm with both scavenging experiments and in situ quenching measurements that, in our system (CNTR/2), both type-II and Z-scheme mechanisms take place, which is the reason for the increased BPA degradation in the case of CNTR/2 nanosolids.
3. Experimental Procedure
3.1. Synthesis of Materials
All chemicals were of analytical grade and were used without further processing. Ultrapure water (18.2 MΩcm, Millipore, Burlington, MA, USA) was used in all cases. A commercially available g-C3N4 (TCI, TCI Chemicals, Tokyo, Japan, purity > 95%) was used as a reference for the photocatalytic degradation experiments. Dicyandiamide (DCDA, Sigma Aldrich, Germany, purity > 99%) and a simple thermal polymerization (Tend = 550 °C, Tramp = 300 °C/h, t = 4 h) in air were used to prepare g-C3N4 (CN), as shown in Scheme S1 in the Supplementary Information. A hydrothermal approach in 10 M sodium hydroxide (NaOH, Sigma Aldrich, Darmstadt, Germany, purity > 98%) was used to synthesize TiO2 as either aTT (poorly crystalline nanotubes) or TR (single crystalline nanorods) from the commercially available TiO2 (DT-51, denoted TP, CristalACTiV™. Cristal France SAS, Thann, France). Specifically, 2 g of TP was dispersed in 10 M NaOH (Sigma Aldrich, Germany, purity > 98%) in a 200 mL Teflon-lined autoclave. The hydrothermal synthesis was carried out under stirring at 130 °C for 24 h. After cooling, the resulting product was washed several times to achieve a neutral pH and dispraised in 0.1 M hydrochloric acid (HCl, Sigma Aldrich, Germany, >37%) for the first three washing days and then in ultrapure water for the last two washing days. The product obtained was cryogenically dried for 24 h and labelled as aTT. For the preparation of TR, aTT was used as a precursor, which was heated in aluminum oxide crucibles for 2 h in a muffle furnace at 500 °C (Tramp = 150 °C/h) in air. The g-C3N4/TiO2 composites were synthesized using a mortar mixing technique and a 1:1 ratio of g-C3N4 to TiO2 (50 wt.% g-C3N4). The obtained photocatalysts were designated as CNTP/M, CNaTT/M and CNTR/M for TP-, and aTT- and TR-containing samples, respectively. In addition, the photocatalysts synthesized in the mortar were annealed in a muffle furnace at 350 °C (Tramp = 300 °C/h) for 2 h in air. The treated photocatalysts were designated as CNTP/2, CNaTT/2 and CNTR/2.
3.2. Structural and Textural Properties of the Materials
The Fourier transform infrared spectroscopy (FTIR) spectra of the analyzed materials were recorded using a Perkin-Elmer FTIR Frontier spectrometer equipped with a GladiATR VisionTM accessory from PIKE Technologies or a Perkin Elmer pellet sample holder. All spectra were recorded from 4000 to 450 cm−1 with a resolution of 4 cm−1 (average of 32 spectra). To prepare a pellet, 1 mg of a sample was ground with 199 mg KBr (Sigma Aldrich, Germany, for IR spectroscopy Uvasol®). The sample/KBr mixture was placed in a 13 mm pellet holder and pressed at 5 tons for 5 min.
Phase composition and purity of the produced materials were analyzed using a PANanalytical PRO MPD X-ray diffractometer (XRD) with Cu Kα1 radiation (1.54056 Å) in the scan range between 10 and 90° in 0.034° steps. The HighScore Plus (Malvern Panalytical, Almelo, The Netherlands) was used for sample analysis. The PDFs of the standards were obtained from the International Centre for Diffraction Data (PDF-4+ 2023).
The porosity of the samples was analyzed using nitrogen physisorption analysis using the Micromeritics TriStar II 3020 instrument. Degassing of the materials at 90 °C (60 min) and 180 °C (240 min) was performed with a nitrogen stream (Linde, Dublin, Germany, purity 6.0). Liquid nitrogen was used to cool the samples to −196 °C. The theory of Brunauer, Emmett, and Teller (BET) was used to determine the specific surface area of the photocatalysts, while the theory of Barrett, Joyner, and Halenda (BJH) was used to determine the pore size distribution.
The chemistry and phase composition of the samples were analyzed using a transmission electron microscope (TEM, JEM-2100, JEOL Inc., Peabody, MA, USA) at 200 kV. The pulverized samples were dispersed in EtOH (Sigma Aldrich, Germany, abs.), sonicated for 30 s to prevent agglomeration, and transferred to commercially available TEM grids of amorphous carbon with Ni support. Microscopic images were recorded with a slow-scan CCD camera (Orius SC1000, Gatan Inc., Pleasanton, CA, USA). Morphological analysis of the prepared materials was performed using a field emission scanning electron microscope (FE-SEM) from Carl Zeiss (Oberkochen, Germany), model SUPRA 35 VP, operated at 1 kV.
The temperature-programmed pyridine desorption profiles (pyridine TPD) of the analyzed samples were obtained by heating the sample in an Ar/He stream (20 mL/min) from room temperature to 125 °C (10 °C/min) in a Micromeritics AutoChem II 2920 apparatus. After 10 min, the samples were cooled to 120 °C, whereupon the gas flow was switched to Ar (20 mL/min). Pyridine was added to the sample by dosing pyridine (80 vol%)/Ar into the Ar stream (20 mL/min) flowing through the sample at 120 °C. The desorption of pyridine from the sample into the Ar stream (20 mL/min) was monitored from 120 to 360 °C (heating ramp 10 °C/min).
Zeta potential measurements were performed using a Malvern Panalytical Zetasizer Ultra Red equipped with a Malvern MPT-3 multipurpose titrator. Aqueous hydrochloric acid (HCl, Sigma Aldrich, Germany, 0.25 and 0.025 M) and sodium hydroxide (NaOH, Sigma Aldrich, Germany, 0.25 M) were used to adjust the pH in the measurement area, and a nitrogen stream (Linde, Germany, purity 5.0) was used to purge the samples at a rate of 50 mL/min. For the measurement of zeta potential, 25 mg of a photocatalyst was dispersed in 100 mL ultrapure water for 30 min (400 rpm). The measurements were carried out in duplicate.
3.3. Analysis of the Optical and Electronic Properties of Materials
To obtain the UV-Vis spectra of the analyzed materials, we used the Lambda 650 UV-Vis spectrophotometer (Perkin Elmer, Waltham, MA, USA). Background correction was performed with Spectralon©. All measurements were performed in absorption mode from 700 to 300 nm, with a scan rate of 240 nm/min and a slit width of 2.0 nm. The optical band gaps of the analyzed solids were estimated using the Kubelka–Munk theory as follows:
where α, hv, , and A are absorption coefficient, photon energy, direct (optical) band gap, and proportionality constant.
The measurements of solid-state photoluminescence (PL) were carried out using the LS-55 fluorescence spectrometer (Perkin Elmer), which is equipped with a fixed piston plate and a powder sample holder. The excitation wavelength for the samples containing g-C3N4 was 320 nm with a scan rate of 200 nm/min (from 350 to 620 nm) and an emission slit of 2.6 nm. For the TiO2 samples, the excitation wavelength was 300 nm with a scan rate of 150 nm/min (from 340 to 560 nm) and an emission slit of 5.5 nm.
Electrochemical impedance spectroscopy (EIS) was performed using a Methrom Autolab potentiostat/galvanostat (model PGSTAT302N) equipped with a FRA32M EIS module and using 0.1 M KOH (Sigma Aldrich, Germany, purity 99%) as electrolyte. The catalyst samples were applied to the surface of the working electrode by dropping 10 μL of the catalyst/absolute ethanol (10 mg of catalyst dispersed in 1 mL of absolute ethanol) suspension onto the carbon working electrode of the Metrohm DropSens disposable screen-printed carbon electrode (model DRP-150). The corresponding experiments were carried out in an electrochemical PTFE cell (Metrohm DropSens, model Ramancell). The EIS spectra of the analyzed catalysts were recorded in a frequency range of 0.1–106 Hz.
An Adani X-band CMS8400 EPR spectrometer was used to obtain solid-state electron paramagnetic resonance (EPR) spectra of the analyzed materials at room and liquid nitrogen temperature. Mg(II)/MgO powder was used as a standard to determine the uncertainty of the measurements of ±0.0005. The powder samples were placed in a quartz sample tube and inserted into the EPR spectrometer (9.4 MHz microwave frequency). For the pure TiO2 samples measured at room temperature, the modulation amplitude was 450 µT with a power attenuation of 15 dB and a gain value of 3 × 10³ for all measurements. For the TiO2 samples at liquid nitrogen temperature, the modulation amplitude was 450 µT with a power attenuation of 15 dB and a gain value of 3 × 10³ for all measurements, except for the TP sample, where the gain value was 1 × 10³. For samples containing g-C3N4 at room temperature, the measurements were performed at 338.00 mT (sweep width 20 mT) with a mod. amplitude of 350 µT and a power attenuation of 18 dB (gain value of 8 × 10²). For one spectrum, 120 s with three consecutive measurements were used to obtain an average value. An LED light source for visible-light (Schott, Mainz, Germany, model KL 2500; energy spectra can be found in [36]) was used for all illuminations.
3.4. XPS Analysis
The XPS measurements were performed using a Supra+ device (Kratos, Manchester, UK). The primary X-ray beam was Al Kα, and the analysis was performed using a 300 × 700 µm spot. The XPS spectra were recorded at pass energies of 160 and 20 eV to obtain overview and high-resolution spectra, respectively. The acceptance angle during the measurements was 90°. The powder samples were fixed on the carbon tape, which was attached to the Si wafer. The base pressure in the spectrometer was 2–10−9 Torr. The charge neutralizer was switched on during the measurements. The binding energy (BE) was corrected using a C-C/C-H peak at 284.8 eV in the C 1s spectra, except for sample CN, where the binding energy scale was corrected using a peak representing C in g-C3N4 at 288.2 eV. Spectra acquisition and processing was performed with ESCApe 1.5 (Kratos).
3.5. Tests of the Photocatalytic Activity and Mechanistic Studies of the Prepared Materials
The photocatalytic experiments were carried out in a batch slurry reactor (Lenz Laborglas, Wertheim, Germany) with a 150 W halogen lamp (Philips, Amsterdam, The Netherlands; energy spectra can be found in [36]) equipped with a cut-off filter at 410 nm. Bisphenol A (BPA, Aldrich, purity ≥ 99.0%) was used as model organic pollutants (c0 = 10 mg/L, 0.0438 mM). A total of 31.25 mg (ccat = 125 mg/L) of a photocatalyst was suspended in 250 mL of an aqueous BPA solution. The suspension was stirred at 600 rpm and purged with 45 L/h of air. The reaction mixture was thermostatted to 20 °C using a Julabo thermostat (model F25/ME). To establish adsorption/desorption equilibrium, the 10 suspension was kept in the dark for 30 min (gray area in the photocatalytic diagrams). During illumination with visible light, samples were taken at certain times of the reaction and filtered using a 0.2 µm membrane made of regenerated cellulose. For the reactive species quenching experiments, we used p-benzoquinone (BQ, Sigma Aldrich, Germany, purity > 99%), sodium azide (NaN3, Merck, Rahway, NJ, USA), methanol (MeOH, Sigma Aldrich, Germany, purity >99%) or tert-butyl alcohol (t-BuOH, Sigma Aldrich, Germany, purity >99%), and formic acid (HCOOH, Kemika, purity >99%) as traps for , 1O2, OH· and h+, respectively. The concentration of the traps was 10 mM in all cases, using the same experimental setup as for the photooxidation of BPA.
An HPLC LC-40 (Shimadzu, Kyoto, Japan) with a 100 × 4.6 mm BDS Hypersil C18 (2.4 µm) column was used to analyze the time-dependent BPA concentration. The mobile phase was a mixture of methanol (Merck) and ultrapure water (volume ratio 70:30) with a flow rate of 0.5 mL/min. The column was thermostatted to 30 °C and the autosampler to 25 °C. Detection was carried out with a PDA detector at 190–350 nm and a cell temperature of 40 °C. The determination of total organic carbon (TOC) in fresh and treated BPA solutions was carried out using a Shimadzu TOC-L analyzer equipped with an ASI-L autosampler. The Perkin Elmer CHNS 2400 Series II analyses was used to determine the extent of carbon deposition on the catalyst samples after photocatalytic oxidation of BPA and to calculate the extent of actual mineralization of the organic precursors.
Using a photoluminescence method and the probe molecule coumarin (Alfa Aesar, purity 98%), we investigated the tendency to form hydroxyl radicals (OH·). A total of 10 mg of an investigated photocatalyst was suspended in a 50 mL aqueous solution of coumarin (1.4 mM), stirred at 400 rpm and kept in the dark for 30 min to establish the sorption equilibrium. A Schott KL 2500 LED lamp with a UV cut-off filter at 410 nm was used as a source of visible light (energy spectra can be found in [36]). Samples of the liquid phase were taken at different times during the reaction and filtered using a 0.2 µm filter made of regenerated cellulose membrane. A total of 300 µL of the filtered solution was diluted with ultrapure water in a 10 mL flask and measured using a Perkin Elmer LS-55 fluorescence spectrometer. The excitation wavelength was 338 nm at a scan rate of 200 nm/min (from 200 to 600 nm) and the emission slit was set to 10 nm. The concentration of 7-hydroxycoumarin was calculated using the calibration curve from [31].
Spin trapping experiments were performed using 5-5-dimethyl-1-pyrroline-N-oxide (DMPO, Sigma Aldrich, purity ≥ 98.0%) dissolved in dimethyl sulfoxide (DMSO, Sigma Aldrich, purity ≥ 99.9%) as solvent. The measurements of the corresponding spin adduct (DMPO-) were performed using a 100 μL liquid flat cell (Fluorochem, model WG-808_Q) and an Adani CMS8400 EPR spectrometer. The illumination source for the visible light was the Schott KL 2500 LED lamp (energy spectra can be found in [36]). The DMPO experiments were performed at 337.00 mT (sweep width 10 mT) with a mod. amplitude of 200 µT and a power attenuation of 15 dB (gain value of 4 × 10³). The initial concentration of DMPO was 4 g/L and the concentration of the catalyst was 2 g/L.
4. Conclusions
The aim of the study was to evaluate the photocatalytic performance of g-C3N4/TiO2 composites with different TiO2 morphologies. Poorly crystalline nanotubes (aTT, SBET = 336 m2/g) and crystalline anatase nanorods (TR, SBET = 100 m2/g) were synthesized from commercial TiO2 (TP, SBET.= 82 m2/g) and incorporated into composites with g-C3N4 (CN, SBET = 17 m2/g) via mortar (M) or 2 h calcination (2). All composites confirmed the presence of g-C3N4 and TiO2 with a preserved mesoporous structure. SEM and TEM analyses showed the ellipsoidal shape of TP, aTT as quasi-nanotubes, and TR as elongated rods. UV-Vis DR spectra showed UV absorption for TiO2 and visible-light absorption for CN, with CNTR composites showing the highest visible-light absorption. PL and EIS showed improved the carrier dynamics (the RCT of bare TiO2 and CN was between 0.84 MΩ and 1.0 MΩ), especially for CNTP/2 (RCT = 0.48 MΩ) and CNTR/2 (RCT = 0.40 MΩ), with the latter performing best. Ti3+ and O vacancies improved visible-light absorption and charge separation. Furthermore, the EPR and XPS measurements indicated that Ti3+ was mainly present at the surface in the case of the TR sample, implying (i) a higher visible-light absorption of TiO2 and (ii) probably a higher tendency to form a close interface with the CN component. The degradation of BPA under visible-light illumination showed increased rates for all composites compared to pure TiO2 (between 2.4 and 4% BPA degradation and TOCM between 0.6 and 2.4% after 2 h illumination) or CN (12% BPA degradation and TOCM of 7.8% after 2 h illumination), with CNTR/2 (30% BPA degradation and TOCM of 25.4% after 2 h illumination) achieving the highest activity due to improved visible light utilization and charge separation. In addition, the presence of Ti3+ enabled the partial occurrence of the Z-scheme mechanism, whereby the CNTR/2 photocatalyst exhibited improved redox properties. However, this mechanism was limited due to the still low amount of Ti3+ in the TR component (limited area of TiO2 particle), so a dual mixed type-II/Z-scheme mechanism probably occurred. Since the type-II mechanism was still the most pronounced, this limits the actual photocatalytic activity of the nanosolid. This study highlights the importance of the synthesis method in influencing the photocatalytic behavior, beyond the morphology, and emphasizes the potential of these composites for environmental remediation. A future pathway to increase the catalytic activity of the CNTP/2 catalyst includes several strategies, such as increasing the Ti3+ concentration in the TiO2 component, optimizing the g-C3N4/TiO2 ratio, applying longer calcination times, doping with elements such as nitrogen, sulfur, or plasmonic metals, and optimizing the reaction conditions, etc. These approaches aim to improve the charge transfer and maximize photocatalytic activity for environmental remediation.
Supplementary Materials
The following supporting information can be downloaded at: https://www.mdpi.com/article/10.3390/molecules30030460/s1, Scheme S1. Graphical representation of the synthesis process with estimated yields.; Figure S1. (a) Nitrogen physisorption isotherms and (b) corresponding BJH pore size distributions of the investigated photocatalysts.; Figure S2. Pyr-TPD profiles of the analysed (a) TiO2 morphologies and CN components, and (b) TiO2/g-C3N4 composites.; Figure S3. Results of zeta potential measurements as a function of pH for (a) CNTP, (b) CNaTT and (c) CNTR series; (d) comparison of composites annealed for 2 h.; Figure S4. SEM micrographs of (a) pure CN, (b) CNTP/2, (c) CNaTT/2 and (d) CNTR/2 samples.; Figure S5. (a) HR-TEM micrograph of a TiO2 crystal with an FFT pattern indexed for anatase TiO2; the pattern derives from the area marked in red. The area was filtered with average-background-subtraction (ABSF), with the lattice planes marked and the crystal structure displayed in the same orientation. From the outline of the particle, a 3D model was proposed based on the crystallographic file of anatase. (b) Similar to the nanorods, the distances between the planes were measured to be 3.25 Å, which corresponds to the (003) plane in the reference PDF X-ray data.; Figure S6. Gaussian deconvolution of the solid-state photoluminescence (PL) spectra of (a) CN, (b) CNTP/2, (c) CNaTT/2 and (d) CNTR/2 samples.; Figure S7. Nyquist plots for (a) CNTP, (b) CNaTT and (c) CNTR series and (d) comparison of TiO2/g-C3N4 composites annealed for 2 h. Figure (e) shows the electrochemical equivalent circuit used to fit the Nyquist plots, which includes a solution resistance (RS), a charge transfer resistance (RCT), the Warburg impendence (W) and the constant phase element (CPE).; Figure S8. EPR spectra of pure solid TiO2 morphologies obtained at room temperature (a) without and (b) with visible-light illumination. The modulation amplitude was 450 µT with a power attenuation of 15 dB and a gain value of 3 × 10³ for all measurements.; Figure S9. EPR solid-state spectra of pure TiO2 morphologies obtained at liquid nitrogen temperature (LN2). The modulation amplitude was 450 µT with a power attenuation of 15 dB and a gain value of 3×10³ for all measurements, except for the TP sample where the gain value was 1 × 10³ (Figure S9 contains the corrected TP spectra multiplied to obtain the same gain value for an easier comparison).; Figure S10. Room temperature solid-state EPR spectra for (a) pure CN, (b) TiO2/g-C3N4 mortar and (c) TiO2/g-C3N4 series annealed for 2 h.; Figure S11. Fitted high-resolution XPS spectra for (a) C 1s, (b) N 1s, and (c) O 1s in CNTR/2 sample.; Figure S12. (a) Results of BPA degradation with pure components under 2 h of visible-light irradiation and (b) BPA photooxidation with different CNTR/2 concentrations under 6 h of visible-light. The average ± standard deviation of triplicate tests is shown. Figure (c) shows the ATR-FTIR spectra of fresh and reused CNTR/2 photocatalysts (after 3 BPA degradation cycles), with the inset showing the KBr/CNTR/2 transmission FTIR spectra. Figure (d) shows the XRD patterns of the fresh and reused CNTR/2 samples.; Figure S13. (a) Concentration of 7-HOCU after 120 min illumination of the catalyst/coumarin suspension with visible-light and (b) DMPO/DMSO/catalyst results of the liquid-phase EPR measurements for CNTP/2 and CNTR/2 series after 15 min illumination with visible-light.; Table S1: Results of the CHNS elemental analysis of fresh and used photocatalysts. Nitrogen and hydrogen were not detected in the pure TiO2 samples. Only carbon and hydrogen were measured in the used photocatalysts. The observed error of three repetitions was within ± 1%.; Table S2: Results of the temperature-programmed pyridine desorption measurements of the analyzed materials to determine the acidic surface sites (AcSS) (moles of adsorbed pyridine from peak area, calculated concentration and density of AcSS).; Table S3: Determined point of zero charge (pHPZC, from pH conditioned zeta-potential measurements in Figure S3), optical band gap value (optEg, obtained from the UV-Vis DR measurements in Figure 5) and charge transfer resistance (RCT, obtained from the Nyquist plots in Figure S7). The observed error of two repetitions for pHPZC was within ± 1% and for RCT within ± 2%. The observed error of three repetitions for optEg was within ± 2%.; Table S4: Peak position and peak area of the transitions obtained by the three peak Gaussian deconvolution of the solid-state PL spectra in Figure S6.
Author Contributions
Conceptualization, G.Ž. and M.R.; methodology, G.Ž. and M.R.; validation, G.Ž. and M.R.; investigation, G.Ž., M.R., M.F. and J.Z.; data curation, G.Ž., M.R., M.F. and J.Z.; writing—original draft preparation, G.Ž. and M.R.; writing—review and editing, A.P., G.Ž., M.R., M.F. and J.Z.; visualization, G.Ž. and M.R.; supervision, G.Ž.; project administration, A.P., M.F. and J.Z.; funding acquisition, A.P., M.F. and J.Z. All authors have read and agreed to the published version of the manuscript.
Funding
This research was funded by the Slovenian Research and Innovation Agency grant numbers P2-0150, P1-0417 and P2-0118.
Institutional Review Board Statement
The study did not require ethical approval.
Informed Consent Statement
Not applicable.
Data Availability Statement
Data will be made available on request.
Acknowledgments
The authors gratefully acknowledge the financial support of the Slovenian Research and Innovation Agency (research core funding no. P2-0150, P1-0417, and P2-0118). Thanks also go to the company CristalACTiVTM for the generous donation of a commercially available TiO2 powder DT-51.
Conflicts of Interest
The authors declare that they have no known competing financial interests or personal relationships that could have appeared to influence the work reported in this paper.
References
- Vaiano, V.; Sacco, O.; Sannino, D. Electric energy saving in photocatalytic removal of crystal violet dye through the simultaneous use of long-persistent blue phosphors, nitrogen-doped TiO2 and UV-light emitting diodes. J. Clean. Prod. 2019, 210, 1015–1021. [Google Scholar] [CrossRef]
- Armaković, S.J.; Savanović, M.M.; Armaković, S. Titanium dioxide as the most used photocatalyst for water purification: An overview. Catalysts 2023, 13, 26. [Google Scholar] [CrossRef]
- Anucha, C.B.; Altin, I.; Bacaksiz, E.; Stathopoulos, V.N. Titanium dioxide (TiO2)-based photocatalyst materials activity enhancement for contaminants of emerging concern (CECs) degradation: In the light of modification strategies. Chem. Eng. J. Adv. 2022, 10, 100262. [Google Scholar] [CrossRef]
- Ismael, M. A review on graphitic carbon nitride (g-C3N4) based nanocomposites: Synthesis, categories, and their application in photocatalysis. J. Alloys Compd. 2020, 846, 156446. [Google Scholar] [CrossRef]
- Cui, X.; Jiang, G.; Zhao, Z.; Xu, C.; Bai, W.; Wang, Y.; Duan, A.; Liu, J.; Wei, Y. Facile regulation of crystalline phases and exposed facets on Ti3+ self-doped TiO2 for efficient photocatalytic hydrogen evolution. J. Mater. Sci. 2016, 51, 10819–10832. [Google Scholar] [CrossRef]
- Qiu, M.; Tian, Y.; Chen, Z.; Yang, Z.; Li, W.; Wang, K.; Wang, L.; Wang, K.; Zhang, W. Synthesis of Ti3+ self-doped TiO2 nanocrystals based on Le Chatelier’s principle and their application in solar light photocatalysis. RSC Adv. 2016, 6, 74376–74383. [Google Scholar] [CrossRef]
- Lincho, J.; Mazierski, P.; Klimczuk, T.; Martins, R.C.; Gomes, J.; Zaleska-Medynska, A. TiO2 nanotubes modification by photodeposition with noble metals: Characterization, optimization, photocatalytic activity, and by-products analysis. J. Environ. Chem. Eng. 2024, 12, 112990. [Google Scholar] [CrossRef]
- Kernazhitsky, L.; Shymanovska, V.; Gavrilko, T.; Naumov, V.; Fedorenko, L.; Kshnyakin, V.; Baran, J. Room temperature photoluminescence of anatase and rutile TiO2 powders. J. Lumin. 2014, 146, 199–204. [Google Scholar] [CrossRef]
- Žerjav, G.; Arshad, M.S.; Djinović, P.; Zavašnik, J.; Pintar, A. Electron trapping energy states of TiO2–WO3 composites and their influence on photocatalytic degradation of bisphenol A. Appl. Catal. B 2017, 209, 273–284. [Google Scholar] [CrossRef]
- Chen, X.; Liu, L.; Huang, F. Black titanium dioxide (TiO2) nanomaterials. Chem. Soc. Rev. 2015, 44, 1861–1885. [Google Scholar] [CrossRef]
- Moreira, N.F.F.; Sampaio, M.J.; Ribeiro, A.R.; Silva, C.G.; Faria, J.L.; Silva, A.M.T. Metal-free g-C3N4 photocatalysis of organic micropollutants in urban wastewater under visible light. Appl. Catal. B 2019, 248, 184–192. [Google Scholar] [CrossRef]
- Ganharul, G.K.Q.; Tofanello, A.; Bonadio, A.; Freitas, A.L.M.; Escote, M.T.; Polo, A.S.; Nantes-Cardoso, I.L.; Souza, J.A. Disclosing the hidden presence of Ti3+ ions in different TiO2 crystal structures synthesized at low temperature and photocatalytic evaluation by methylene blue photobleaching. J. Mater. Res. 2021, 36, 3353–3365. [Google Scholar] [CrossRef]
- Son, A.; Lee, J.; Seid, M.G.; Rahman, E.; Choe, J.; Cho, K.; Lee, J.; Hong, S.W. Ti3+ self-doped TiO2 nanotube arrays revisited as Janus photoelectrodes for persulfate activation and water treatment. Appl. Catal. B 2022, 315, 121543. [Google Scholar] [CrossRef]
- Bai, C.; Yang, D.; Liu, C.; Zhu, F.; Tu, C.; Li, G.; Luo, Y. In situ synthesis NiO@TiO2/MXene as a promoter for ammonium perchlorate based solid propellants. Appl. Surf. Sci. 2024, 652, 159228. [Google Scholar] [CrossRef]
- Zhang, R.; Liu, Y.; Wang, C.; Li, Y.; Zhu, Q.; Zhang, S.; Tian, C.; Sun, X.; Huang, W. Constructing bifunctional TiO2 from NH2-MIL-125(Ti) for excellent photocatalytic tetracycline degradation. J. Alloys Compd. 2023, 965, 171396. [Google Scholar] [CrossRef]
- Wang, Z.; Ren, D.; He, Y.; Hong, M.; Bai, Y.; Jia, A.; Liu, X.; Tang, C.; Gong, P.; Liu, X.; et al. Tailoring electronic properties and atom utilizations of the Pd species supported on anatase TiO2 {101} for efficient CO2 hydrogenation to formic acid. ACS Catal. 2023, 13, 10056–10064. [Google Scholar] [CrossRef]
- Roškarič, M.; Žerjav, G.; Zavašnik, J.; Pintar, A. The influence of synthesis conditions on the visible-light triggered photocatalytic activity of g-C3N4/TiO2 composites used in AOPs. J. Environ. Chem. Eng. 2022, 10, 107656. [Google Scholar] [CrossRef]
- Hao, R.; Wang, G.; Tang, H.; Sun, L.; Xu, C.; Han, D. Template-free preparation of macro/mesoporous g-C3N4/TiO2 heterojunction photocatalysts with enhanced visible light photocatalytic activity. Appl. Catal. B 2016, 187, 47–58. [Google Scholar] [CrossRef]
- Batista, J.A.F.; Mendes, J.; Moretto, W.E.; Quadro, M.S.; Santos, J.H.Z.D.; de Escobar, C.C. Sunlight removal of diclofenac using g-C3N4, g-C3N4/Cl, g-C3N4/Nb2O5 and g-C3N4/TiO2 photocatalysts. J. Environ. Chem. Eng. 2024, 12, 113016. [Google Scholar] [CrossRef]
- Rajeshwari, M.R.; Kokilavani, S.; Khan, S.S. Recent developments in architecturing the g-C3N4 based nanostructured photocatalysts: Synthesis, modifications and applications in water treatment. Chemosphere 2022, 291, 132735. [Google Scholar] [CrossRef]
- Cao, S.; Yu, J. g-C3N4-based photocatalysts for hydrogen generation. J. Phys. Chem. Lett. 2014, 5, 2101–2107. [Google Scholar] [CrossRef] [PubMed]
- Xing, C.; Yu, G.; Zhou, J.; Liu, Q.; Chen, T.; Liu, H.; Li, X. Solar energy-driven upcycling of plastic waste on direct Z-scheme heterostructure of V-substituted phosphomolybdic acid/g-C3N4 nanosheets. Appl. Catal. B 2022, 315, 121496. [Google Scholar] [CrossRef]
- Sharma, M.; Vaidya, S.; Ganguli, A.K. Enhanced photocatalytic activity of g-C3N4-TiO2 nanocomposites for degradation of Rhodamine B dye. J. Photochem. Photobiol. A 2017, 335, 287–293. [Google Scholar] [CrossRef]
- Samsudin, M.F.R.; Bacho, N.; Sufian, S. Recent development of graphitic carbon nitride-based photocatalyst for environmental pollution remediation. In Nanocatalysts; Sinha, I., Shukla, M., Eds.; IntechOpen: London, UK, 2018. [Google Scholar] [CrossRef]
- Kočí, K.; Reli, M.; Troppová, I.; Šihor, M.; Kupková, J.; Kustrowski, P.; Praus, P. Photocatalytic decomposition of N2O over TiO2/g-C3N4 photocatalysts heterojunction. Appl. Surf. Sci. 2017, 396, 1685–1695. [Google Scholar] [CrossRef]
- Wang, Y.; Yu, J.; Peng, W.; Tian, J.; Yang, C. Novel multilayer TiO2 heterojunction decorated by low g-C3N4 content and its enhanced photocatalytic activity under UV, visible and solar light irradiation. Sci. Rep. 2019, 9, 5932. [Google Scholar] [CrossRef]
- Hassan, F.; Bonnet, P.; Dikdim, J.M.D.; Bandjoun, N.G.; Caperaa, C.; Dalhatou, S.; Kane, A.; Zeghioud, H. Synthesis and investigation of TiO2/g-C3N4 performance for photocatalytic degradation of bromophenol blue and eriochrome black T: Experimental design optimization and reactive oxygen species contribution. Water 2022, 14, 3331. [Google Scholar] [CrossRef]
- Liu, H.; Zhang, Z.-G.; He, H.-W.; Wang, X.-X.; Zhang, J.; Zhang, Q.-Q.; Tong, Y.-F.; Liu, H.-L.; Ramakrishna, S.; Yan, S.-Y.; et al. One-step synthesis heterostructured g-C3N4/TiO2 composite for rapid degradation of pollutants in utilizing visible light. Nanomaterials 2018, 8, 842. [Google Scholar] [CrossRef]
- Wang, X.-J.; Yang, W.-Y.; Li, F.-T.; Xue, Y.-B.; Liu, R.-H.; Hao, Y.-J. In situ microwave-Assisted Synthesis of Porous N-TiO2/g-C3N4 Heterojunctions with Enhanced Visible-Light Photocatalytic Properties. Ind. Eng. Chem. Res. 2013, 52, 17140–17150. [Google Scholar] [CrossRef]
- Jo, W.-K.; Natarajan, T.S. Influence of TiO2 morphology on the photocatalytic efficiency of direct Z-scheme g-C3N4/TiO2 photocatalysts for isoniazid degradation. Chem. Eng. J. 2015, 281, 549–565. [Google Scholar] [CrossRef]
- Roškarič, M.; Zavašnik, J.; Zámbó, D.; Kotnik, T.; Kovačič, S.; Žerjav, G.; Pintar, A. Optimization method based on simplex for surface area improved photocatalytic performance of g-C3N4. ACS Catal. 2023, 13, 13282–13300. [Google Scholar] [CrossRef]
- Wang, L.; Fei, X.; Zhang, L.; Yu, J.; Cheng, B.; Ma, Y. Solar fuel generation over nature-inspired recyclable TiO2/g-C3N4 S-scheme hierarchical thin-film photocatalyst. J. Mater. Sci. Technol. 2022, 112, 1–10. [Google Scholar] [CrossRef]
- Yang, L.; Jia, F.; Juan, Z.; Yu, D.; Sun, L.; Song, Y.; Wang, Y.; Huang, L.; Tang, J. High-permeable graphene oxide/graphitic carbon nitride composite nanofiltration membrane for selective separation of dye and desalination. J. Environ. Chem. Eng. 2023, 11, 109306. [Google Scholar] [CrossRef]
- Kumar, P.S.; Prakash, P. Metal free nanocomposite of graphitic carbon nitride, boron nitride and chitosan for efficient evolution of hydrogen: A strategic approach to achieving sustainable and effective electrocatalysis. J. Environ. Chem. Eng. 2023, 11, 109045. [Google Scholar] [CrossRef]
- Li, J.; Zhang, M.; Li, Q.; Yang, J. Enhanced visible light activity on direct contact Z-scheme g-C3N4-TiO2 photocatalyst. Appl. Surf. Sci. 2017, 391, 184–193. [Google Scholar] [CrossRef]
- Roškarič, M.; Žerjav, G.; Finšgar, M.; Zavašnik, J.; Pintar, A. Influence of the calcination duration of g-C3N4/TiO2 “veggie-toast-like” photocatalyst on the visible-light triggered photocatalytic oxidation of bisphenol A. J. Alloys Compd. 2023, 947, 169585. [Google Scholar] [CrossRef]
- Palmisano, L.; Augugliaro, V.; Schiavello, M.; Sclafani, A. Influence of acid-base properties on photocatalytic and photochemical processes. J. Mol. Catal. 1989, 56, 284–295. [Google Scholar] [CrossRef]
- Zhu, B.; Xia, P.; Ho, W.; Yu, J. Isoelectric point and adsorption activity of porous g-C3N4. Appl. Surf. Sci. 2015, 344, 188–195. [Google Scholar] [CrossRef]
- Shang, Q.; Gao, S.; Dai, G.; Ren, J.; Wang, D. Structure and photocatalytic activity of Ti3+ self-doped TiO2 flower shaped nanospheres. Surf. Interfaces 2020, 18, 100426. [Google Scholar] [CrossRef]
- Valentin, C.D.; Pacchioni, G.; Selloni, A. Reduced and n-type doped TiO2: Nature of Ti3+ species. J. Phys. Chem. C 2009, 113, 20543–22052. [Google Scholar] [CrossRef]
- Aïnouche, L.; Hamadou, L.; Kadri, A.; Benbrahim, N.; Bradai, D. Ti3+ states induced band gap reduction and enhanced visible light absorption of TiO2 nanotube arrays: Effect of the surface solid fraction factor. Sol. Energ. Mat. Sol. C 2016, 151, 179–190. [Google Scholar] [CrossRef]
- Xu, Y.; Wu, S.; Wan, P.; Sun, J.; Hood, Z.D. Introducing Ti3+ defects based on lattice distortion for enhanced visible light photoreactivity in TiO2 microspheres. RSC Adv. 2017, 7, 32461–32467. [Google Scholar] [CrossRef]
- Abazović, N.D.; Čomor, M.I.; Dramićanin, M.D.; Jovanović, D.J.; Ahrenkiel, S.P.; Nedeljković, J.M. Photoluminescence of anatase and rutile TiO2 particles. J. Phys. Chem. B 2006, 110, 25366–25370. [Google Scholar] [CrossRef] [PubMed]
- Daude, N.; Gout, C.; Jouanin, C. Electronic band structure of titanium dioxide. Phys. Rev. B 1977, 15, 3229. [Google Scholar] [CrossRef]
- Liqiang, J.; Yichun, Q.; Baiqi, W.; Shudan, L.; Baojiang, J.; Libin, Y.; Wei, F.; Honggang, F.; Jiazhong, S. Review of photoluminescence performance of nano-sized semiconductor materials and its relationships with photocatalytic activity. Sol. Energy Mater. Sol. Cells 2006, 90, 1773–1787. [Google Scholar] [CrossRef]
- Liu, S.; Yuan, S.; Zhang, Q.; Xu, B.; Wang, C.; Zhang, M.; Ohno, T. Fabrication and characterization of black TiO2 with different Ti3+ concentrations under atmospheric conditions. J. Catal. 2018, 366, 282–288. [Google Scholar] [CrossRef]
- Sun, X.; Wu, J.; Tian, F.; Zhang, W.; Li, Q. Synergistic effect of surface defect and interface heterostructure on TiO2/BiOIO3 photocatalytic oxide gas-phase mercury. Mater. Res. Bull. 2018, 103, 247–258. [Google Scholar] [CrossRef]
- Das, D.; Shinde, S.L.; Nanda, K.K. Temperature-dependent photoluminescence of g-C3N4: Implication for temperature sensing. ACS Appl. Mater. Interfaces 2016, 8, 2181–2186. [Google Scholar] [CrossRef]
- Abdel-Mageed, A.M.; Wiese, K.; Hauble, A.; Bansmann, J.; Rabeah, J.; Parlinska-Wojtan, M.; Brückner, A.; Behm, R.J. Steering the selectivity in CO2 reduction on highly active Ru/TiO2 catalysts: Support particle size effects. J. Catal. 2021, 401, 160–173. [Google Scholar] [CrossRef]
- Kokorin, A.I.; Bahnemann, D. Chemical Physics of Nanostructured Semiconductors; Taylor & Francis Group: Utrecht, The Netherlands; Boston, MA, USA, 2003; pp. 1–34. [Google Scholar] [CrossRef]
- Makmi, H.E.; Deroide, B.; Bensimon, Y.; Zanchetta, J.V. Paramagnetic defects in solid sulphur and glasses of the system Ge–S. J. Non-Cryst. Solids 2001, 291, 78–85. [Google Scholar] [CrossRef]
- Xiong, L.-B.; Li, J.-L.; Yang, B.; Yu, Y. Ti3+ in the surface of titanium dioxide: Generation, properties and photocatalytic application. J. Nanomater. 2011, 2012, 831524. [Google Scholar] [CrossRef]
- Kobkeatthawin, T.; Trakulmututa, J.; Amornsakchai, T.; Kajitvichyanukul, P.; Smith, S.M. Identification of active species in photodegradation of aqueous imidacloprid over g-C3N4/TiO2 nanocomposites. Catalysts 2022, 12, 120. [Google Scholar] [CrossRef]
- Al-Madanat, O.; Nunes, B.N.; Salka, Y.A.; Hakki, A.; Curti, M.; Patrocinio, A.O.T.; Bahnemann, D.W. Application of EPR spectroscopy in TiO2 and Nb2O5 photocatalysis. Catalysts 2021, 11, 1514. [Google Scholar] [CrossRef]
- Dvoranová, D.; Mazúr, M.; Papailias, I.; Giannakopoulou, T.; Trapalis, C.; Brezová, V. EPR investigations of g-C3N4/TiO2 nanocomposites. Catalysts 2018, 8, 47. [Google Scholar] [CrossRef]
- Zahwa, I.; Mouyane, M.; Kassas, A.; Kamlo, A.N.; Moslah, C.; Navas, J.; Livraghi, S.; Bernard, J.; Falah, J.E.; Toufaily, J.; et al. Flash combustion synthesis using two different fuels and characterization of LiF-doped TiO2 for the photocatalytic applications. Open Ceram. 2024, 17, 100562. [Google Scholar] [CrossRef]
- Livraghi, S.; Chiesa, M.; Paganini, M.C.; Giamello, E. On the nature of reduced states in titanium dioxide as monitored by electron paramagnetic resonance. I: The anatase case. J. Phys. Chem. C 2011, 115, 25413–25421. [Google Scholar] [CrossRef]
- Coronado, J.M.; Maira, A.J.; Conesa, J.C.; Yeung, K.L.; Augugliaro, V.; Soria, J. EPR study of the surface characteristics of nanostructured TiO2 under UV irradiation. Langmuir 2001, 17, 5368–5374. [Google Scholar] [CrossRef]
- Abdel-Mageed, A.M.; Wiese, K.; Parlinska-Wojtan, M.; Rabeah, J.; Brückner, A.; Behm, R.J. Encapsulation of Ru nanoparticles: Modifying the reactivity toward CO and CO2 methanation on highly active Ru/TiO2 catalysts. Appl. Catal. B 2020, 270, 118846. [Google Scholar] [CrossRef]
- Yang, D.; Liu, H.; Zheng, Z.; Yuan, Y.; Zhao, J.-C.; Waclawik, E.R.; Ke, X.; Zhu, H. An efficient photocatalyst structure: TiO2(B) nanofibers with a shell of anatase nanocrystals. J. Am. Chem. Soc. 2009, 131, 17885–17893. [Google Scholar] [CrossRef]
- Yurdakal, S.; Çetinkaya, S.; Augugliaro, V.; Palmisano, G.; Soria, J.; Sanz, J.; Torralvo, M.J.; Livraghi, S.; Giamello, E.; Garlisi, C. Alkaline treatment as a means to boost the activity of TiO2 in selective photocatalytic processes. Catal. Sci. Technol. 2020, 10, 5000–5012. [Google Scholar] [CrossRef]
- Kobkeatthawin, T.; Chaveanghong, S.; Trakulmututa, J.; Amornsakchai, T.; Kajitvichyanukul, P.; Smith, S.M. Photocatalytic activity of TiO2/g-C3N4 nanocomposites for removal of monochlorophenols from water. Nanomaterials 2022, 12, 2852. [Google Scholar] [CrossRef] [PubMed]
- Livraghi, S.; Chierotti, M.R.; Giamello, E.; Magnacca, G.; Paganini, M.C.; Cappelletti, G.; Bianchi, C.L. Nitrogen-doped titanium dioxide active in photocatalytic reactions with visible light: A multi-technique characterization of differently prepared materials. J. Phys. Chem. C 2008, 112, 17244–17252. [Google Scholar] [CrossRef]
- Livraghi, S.; Votta, A.; Paganini, M.C.; Giamello, E. The nature of paramagnetic species in nitrogen doped TiO2 active in visible light photocatalysis. Chem. Commun. 2005, 4, 498–500. [Google Scholar] [CrossRef] [PubMed]
- Livraghi, S.; Paganini, M.C.; Giamello, E.; Selloni, A.; Valentin, C.D.; Pacchioni, G. Origin of photoactivity of nitrogen-doped titanium dioxide under visible light. J. Am. Chem. Soc. 2006, 128, 15666–15671. [Google Scholar] [CrossRef]
- Indra, A.; Beltrán-Suito, R.; Müller, M.; Sivasankaran, R.P.; Schwarze, M.; Acharjya, A.; Pradhan, B.; Hofkens, J.; Brückner, A.; Thomas, A.; et al. Promoting photocatalytic hydrogen evolution activity of graphitic carbon nitride with hole-transfer agents. ChemSusChem 2021, 14, 306–312. [Google Scholar] [CrossRef]
- Posada-Borbón, A.; Bosio, N.; Grönbeck, H. On the signatures of oxygen vacancies in O1s core level shifts. Surf. Sci. 2021, 705, 121761. [Google Scholar] [CrossRef]
- Ren, L.; Zhu, W.; Li, Y.; Lin, X.; Xu, H.; Sun, F.; Lu, C.; Zou, J. Oxygen vacancy-rich 2D TiO2 nanosheets: A bridge toward high stability and rapid hydrogen storage kinetics of nano-confined MgH2. Nanomicro Lett. 2022, 14, 144. [Google Scholar] [CrossRef]
- Soto-Vázquez, L.; Rolón-Delgado, F.; Rivera, K.; Cotto, M.C.; Ducongé, J.; Morant, C.; Pinilla, S.; Márquez-Linares, F.M. Catalytic use of TiO2 nanowires in the photodegradation of Benzophenone-4 as an active ingredient in sunscreens. J. Environ. Manage. 2019, 247, 822–828. [Google Scholar] [CrossRef] [PubMed]
- He, M.; Cao, Y.; Ji, J.; Li, K.; Huang, H. Superior catalytic performance of Pd-loaded oxygen-vacancy-rich TiO2 for formaldehyde oxidation at room temperature. J. Catal. 2021, 396, 122–135. [Google Scholar] [CrossRef]
- Sutar, R.S.; Barkul, R.P.; Delekar, S.D.; Patil, M.K. Sunlight assisted photocatalytic degradation of organic pollutants using g-C3N4-TiO2 nanocomposites. Arab. J. Chem. 2020, 13, 4966–4977. [Google Scholar] [CrossRef]
- Hazaraimi, M.H.; Goh, P.S.; Wang, L.Y.; Lau, W.J.; Subramaniam, M.N.; Ismail, A.F.; Hashim, N.; Kerisnan, N.D.; Yahaya, N.K.E.M.; Mamat, R.B.R. Multifunctional roles of g-C3N4 in synthesizing N-TiO2/g-C3N4 heterojunction photocatalyst for photodegradation of bisphenol A. Arab. J. Sci. Eng. 2024. [CrossRef]
- Gao, Z.; Zhang, D.; Jun, Y.-S. Does Tert-butyl alcohol really terminate the oxidative activity of •OH in inorganic redox chemistry? Environ. Sci. Technol. 2021, 55, 10422–10450. [Google Scholar] [CrossRef] [PubMed]
- Xu, Q.; Zhang, L.; Yu, J.; Wageh, S.; Al-Ghamdi, A.A.; Jaroniec, M. Direct Z-scheme photocatalysts: Principles, synthesis, and applications. Mater. Today 2018, 21, 1042–1063. [Google Scholar] [CrossRef]
- Ren, B.; Wang, T.; Qu, G.; Deng, F.; Liang, D.; Yang, W.; Liu, M. In situ synthesis of g-C3N4/TiO2 heterojunction nanocomposites as a highly active photocatalyst for the degradation of Orange II under visible light irradiation. Environ. Sci. Pollut. Res. 2018, 25, 19122–19133. [Google Scholar] [CrossRef] [PubMed]
- Ma, X.; Liu, X.; Zhang, X.; Piao, C.; Liu, Z.; Fang, D.; Wang, J. Construction of dual Z-scheme NiO/NiFe2O4/Fe2O3 photocatalyst via incomplete solid state chemical combustion reactions for organic pollutant degradation with simultaneous hydrogen production. Int. J. Hydrogen Energy 2021, 46, 31659–31673. [Google Scholar] [CrossRef]
- Kumar, R.; Sudhaik, A.; Khan, A.A.P.; Raizada, P.; Asiri, A.M.; Mohapatra, S.; Thakur, S.; Thakur, V.K.; Singh, P. Current status on designing of dual Z-scheme photocatalysts for energy and environmental applications. J. Ind. Eng. Chem. 2022, 106, 340–355. [Google Scholar] [CrossRef]
- Cui, Y.; Nengzi, L.-C.; Gou, J.; Huang, Y.; Li, B.; Cheng, X. Fabrication of dual Z-scheme MIL-53(Fe)/α-Bi2O3/g-C3N4 ternary composite with enhanced visible light photocatalytic performance. Sep. Purif. Technol. 2020, 232, 115959. [Google Scholar] [CrossRef]
- Kang, J.; Jin, C.; Li, Z.; Wang, M.; Chen, Z.; Wang, Y. Dual Z-scheme MoS2/g-C3N4/Bi24O31Cl10 ternary heterojunction photocatalysts for enhanced visible-light photodegradation of antibiotic. J. Alloys Compd. 2020, 825, 153975. [Google Scholar] [CrossRef]
- Wang, K.; Xing, Z.; Du, M.; Zhang, S.; Li, Z.; Pan, K.; Zhou, W. Hollow MoSe2@Bi2S3/CdS core-shell nanostructure as dual Z-scheme heterojunctions with enhanced full spectrum photocatalytic-photothermal performance. Appl. Catal. B 2021, 281, 119482. [Google Scholar] [CrossRef]
- Zhang, D.; Yang, Z.; Hao, J.; Zhang, T.; Sun, Q.; Wang, Y. Boosted charge transfer in dual Z-scheme BiVO4@ZnIn2S4/Bi2Sn2O7 heterojunctions: Towards superior photocatalytic properties for organic pollutant degradation. Chemosphere 2021, 276, 130226. [Google Scholar] [CrossRef]
- Kusutaki, T.; Katsumata, H.; Tateshi, I.; Furukawa, M.; Kaneco, S. Ternary dual Z-scheme graphitic carbon nitride/ultrathin metal–organic framework nanosheet/Ag3PO4 photocatalysts for boosted photocatalytic performance under visible light. RSC Adv. 2019, 9, 39843–39853. [Google Scholar] [CrossRef] [PubMed]
- Liu, W.; Shen, J.; Yang, X.; Liu, Q.; Tang, H. Dual Z-scheme g-C3N4/Ag3PO4/Ag2MoO4 ternary composite photocatalyst for solar oxygen evolution from water splitting. Appl. Surf. Sci. 2018, 456, 369–378. [Google Scholar] [CrossRef]
- Tian, L.; Yang, X.; Cui, X.; Liu, Q.; Tang, H. Fabrication of dual direct Z-scheme g-C3N4/MoS2/Ag3PO4 photocatalyst and its oxygen evolution performance. Appl. Surf. Sci. 2019, 463, 9–17. [Google Scholar] [CrossRef]
- Li, X.; Garlisi, C.; Guan, Q.; Anwer, S.; Al-Ali, K.; Palmisano, G.; Zheng, L. A review of material aspects in developing direct Z-scheme photocatalysts. Mater. Today 2021, 47, 75–107. [Google Scholar] [CrossRef]
- Dvoranová, D.; Barbieriková, Z.; Brezová, V. Radical intermediates in photoinduced reactions on TiO2 (an EPR spin trapping study). Molecules 2014, 19, 17279–17304. [Google Scholar] [CrossRef]
- Khachatryan, L.; Vejerano, E.; Lomnicki, S.; Dellinger, B. Environmentally persistent free radicals (EPFRs). 1. Generation of reactive oxygen species in aqueous solutions. Environ. Sci. Technol. 2011, 45, 8559–8566. [Google Scholar] [CrossRef] [PubMed]
Disclaimer/Publisher’s Note: The statements, opinions and data contained in all publications are solely those of the individual author(s) and contributor(s) and not of MDPI and/or the editor(s). MDPI and/or the editor(s) disclaim responsibility for any injury to people or property resulting from any ideas, methods, instructions or products referred to in the content. |
© 2025 by the authors. Licensee MDPI, Basel, Switzerland. This article is an open access article distributed under the terms and conditions of the Creative Commons Attribution (CC BY) license (https://creativecommons.org/licenses/by/4.0/).