1. Introduction
Edible oils play a crucial role in human nutrition [
1], serving not only as a source of essential fatty acids [
2] but also as carriers of natural and synthetic bioactive compounds with antioxidant properties, which contribute to their stabilization [
3,
4,
5,
6]. Antioxidants present in edible oils mitigate oxidative stress [
7,
8], a condition linked to various pathologies, including cardiovascular diseases [
9] and cancer [
10]. The antioxidative capacity of oils is primarily attributed to bioactive constituents such as tocopherols [
11], polyphenols [
12], and other secondary metabolites [
3]. The antioxidative potential varies among different edible oils, contingent upon their compositional profiles. For example, extra virgin olive oil is particularly abundant in phenolic compounds, notably hydroxytyrosol [
13,
14] and oleuropein [
15], which substantially enhance its oxidative stability and confer health benefits. Likewise, flaxseed [
16], rapeseed [
12], and sesame oil [
17] are characterized by high concentrations of lignans and other antioxidants that influence both their oxidative stability and nutritional value.
Moreover, antioxidants may interact synergistically or antagonistically, thereby influencing the overall antioxidant capacity of the oil sample. Consequently, it is preferable to assess the Total Antioxidant Potential (TAP), which reflects the combined effect of all antioxidants present, factoring in both their total concentration and their reaction rates with the radicals employed in the assay [
18]. Although various terms have been used in the literature to describe this parameter [
19,
20], the term TAP is adopted herein for consistency.
Several analytical techniques have been employed to assess the antioxidative properties of edible oils. These methods are commonly classified based on their underlying reaction mechanisms into hydrogen atom transfer (HAT), single electron transfer (SET), and mixed-mode assays, where both mechanisms occur simultaneously [
21,
22]. HAT-based methods include the Oxygen Radical Absorbance Capacity (ORAC) assay, which utilizes reagents such as Azobisisobutyronitrile (AIBN), 2,2′-Azobis(2-amidinopropane) dihydrochloride (ABAP), 2,2′-Azobis(2,4-dimethylvaleronitrile)(AMVN), and 2,2′-Azobis(2-methylpropionamidine) dihydrochloride) (AAPH) [
23,
24], SET-based methods comprise assays such as Cupric Ion Reducing Antioxidant Capacity (CUPRAC) [
25], Ferric Reducing Antioxidant Power (FRAP) [
26] and the Folin–Ciocalteu (FC) assay [
27]. Mixed-mode (SET/HAT) assays include 2,2-diphenyl-1-picrylhydrazyl (DPPH) [
28], 2,2′-Azino-bis(3-ethylbenzothiazoline-6-sulfonic acid) (ABTS) [
24], Trolox Equivalent Antioxidant Capacity (TEAC) [
29] and N,N-dimethyl-p-phenylenediamine (DMPD) [
30]. A secondary classification can be based on the instrumentation employed, grouping methods into photometric, electrochemical, and chromatographic techniques. The present study focuses on the following methods: DPPH and Folin–Ciocalteu assays (for total phenolic content), cyclic voltammetry (CV), and high-performance liquid chromatography with electrochemical detection (HPLC–ED). DPPH is a widely utilized SET-based assay that measures the capacity of antioxidants to reduce the DPPH radical, leading to a decrease in absorbance at 517 nm [
31]. This assay provides an estimation of the free radical scavenging activity of antioxidants present in the oil [
32]. The Folin–Ciocalteu assay, also SET-based, quantifies the total phenolic content by forming a blue complex upon reaction of phenolic compounds with the reagent, which is then measured spectrophotometrically at 765 nm. Although the assay lacks specificity for phenolics, it remains extensively used for evaluating antioxidative potential [
33]. Cyclic voltammetry is an electrochemical technique that offers insights into the redox properties of antioxidants. By applying a sweeping potential, it enables characterization of the electrochemical behavior of antioxidant compounds [
34,
35] making it particularly suitable for analyzing complex oil matrices [
36]. HPLC–ED combines chromatographic separation with electrochemical detection, facilitating the precise quantification of individual antioxidants in edible oils. This method exhibits high sensitivity and selectivity, rendering it a valuable tool for detailed antioxidative profiling [
37].
Numerous studies have examined the antioxidative properties of edible oils employing diverse analytical methodologies. It has been demonstrated that oils enriched with polyphenols and tocopherols possess enhanced antioxidative capacity [
38]. For instance, comparative analyses of various edible oils using DPPH and Folin–Ciocalteu assays have revealed a strong correlation between phenolic content and radical scavenging activity [
39]. Electrochemical investigations have further substantiated the significant role of these compounds in conferring oxidative stability. Additionally, HPLC–ED analyses have indicated that the antioxidative efficacy of oils is modulated by processing techniques, storage conditions, and synergistic interactions among antioxidants [
40,
41].
Despite considerable progress in evaluating the antioxidative properties of edible oils, selecting an appropriate analytical method remains challenging. Different techniques yield distinct insights into antioxidant activity due to variations in reaction mechanisms, detection principles, and compound-specific sensitivities. Electrochemical approaches, such as CV and differential pulse voltammetry (DPV), enable direct redox characterization of antioxidants; however, their interpretation within complex matrices is often complicated. Spectrophotometric assays, including DPPH and Folin–Ciocalteu methods, provide estimates of the overall antioxidant potential but can be affected by interfering substances and the nature of the radicals employed. HPLC–ED facilitates the separation and quantification of individual antioxidants, though its correlation with total antioxidant capacity remains ambiguous [
34,
42,
43]. Given these methodological disparities, a systematic comparison of these techniques is necessary to assess their reliability, sensitivity, and suitability for edible oil analysis. Recent literature emphasizes the necessity of detecting antioxidant activity in edible oils to better ensure their oxidative stability and quality during storage [
44]. Furthermore, standardization of protocols and optimization of electrochemical methods could enhance the accuracy and reproducibility of antioxidant evaluations. This study seeks to address this gap by evaluating photometric, electrochemical, and chromatographic techniques for the determination of TAP, comparing their respective advantages and limitations in the context of food analysis.
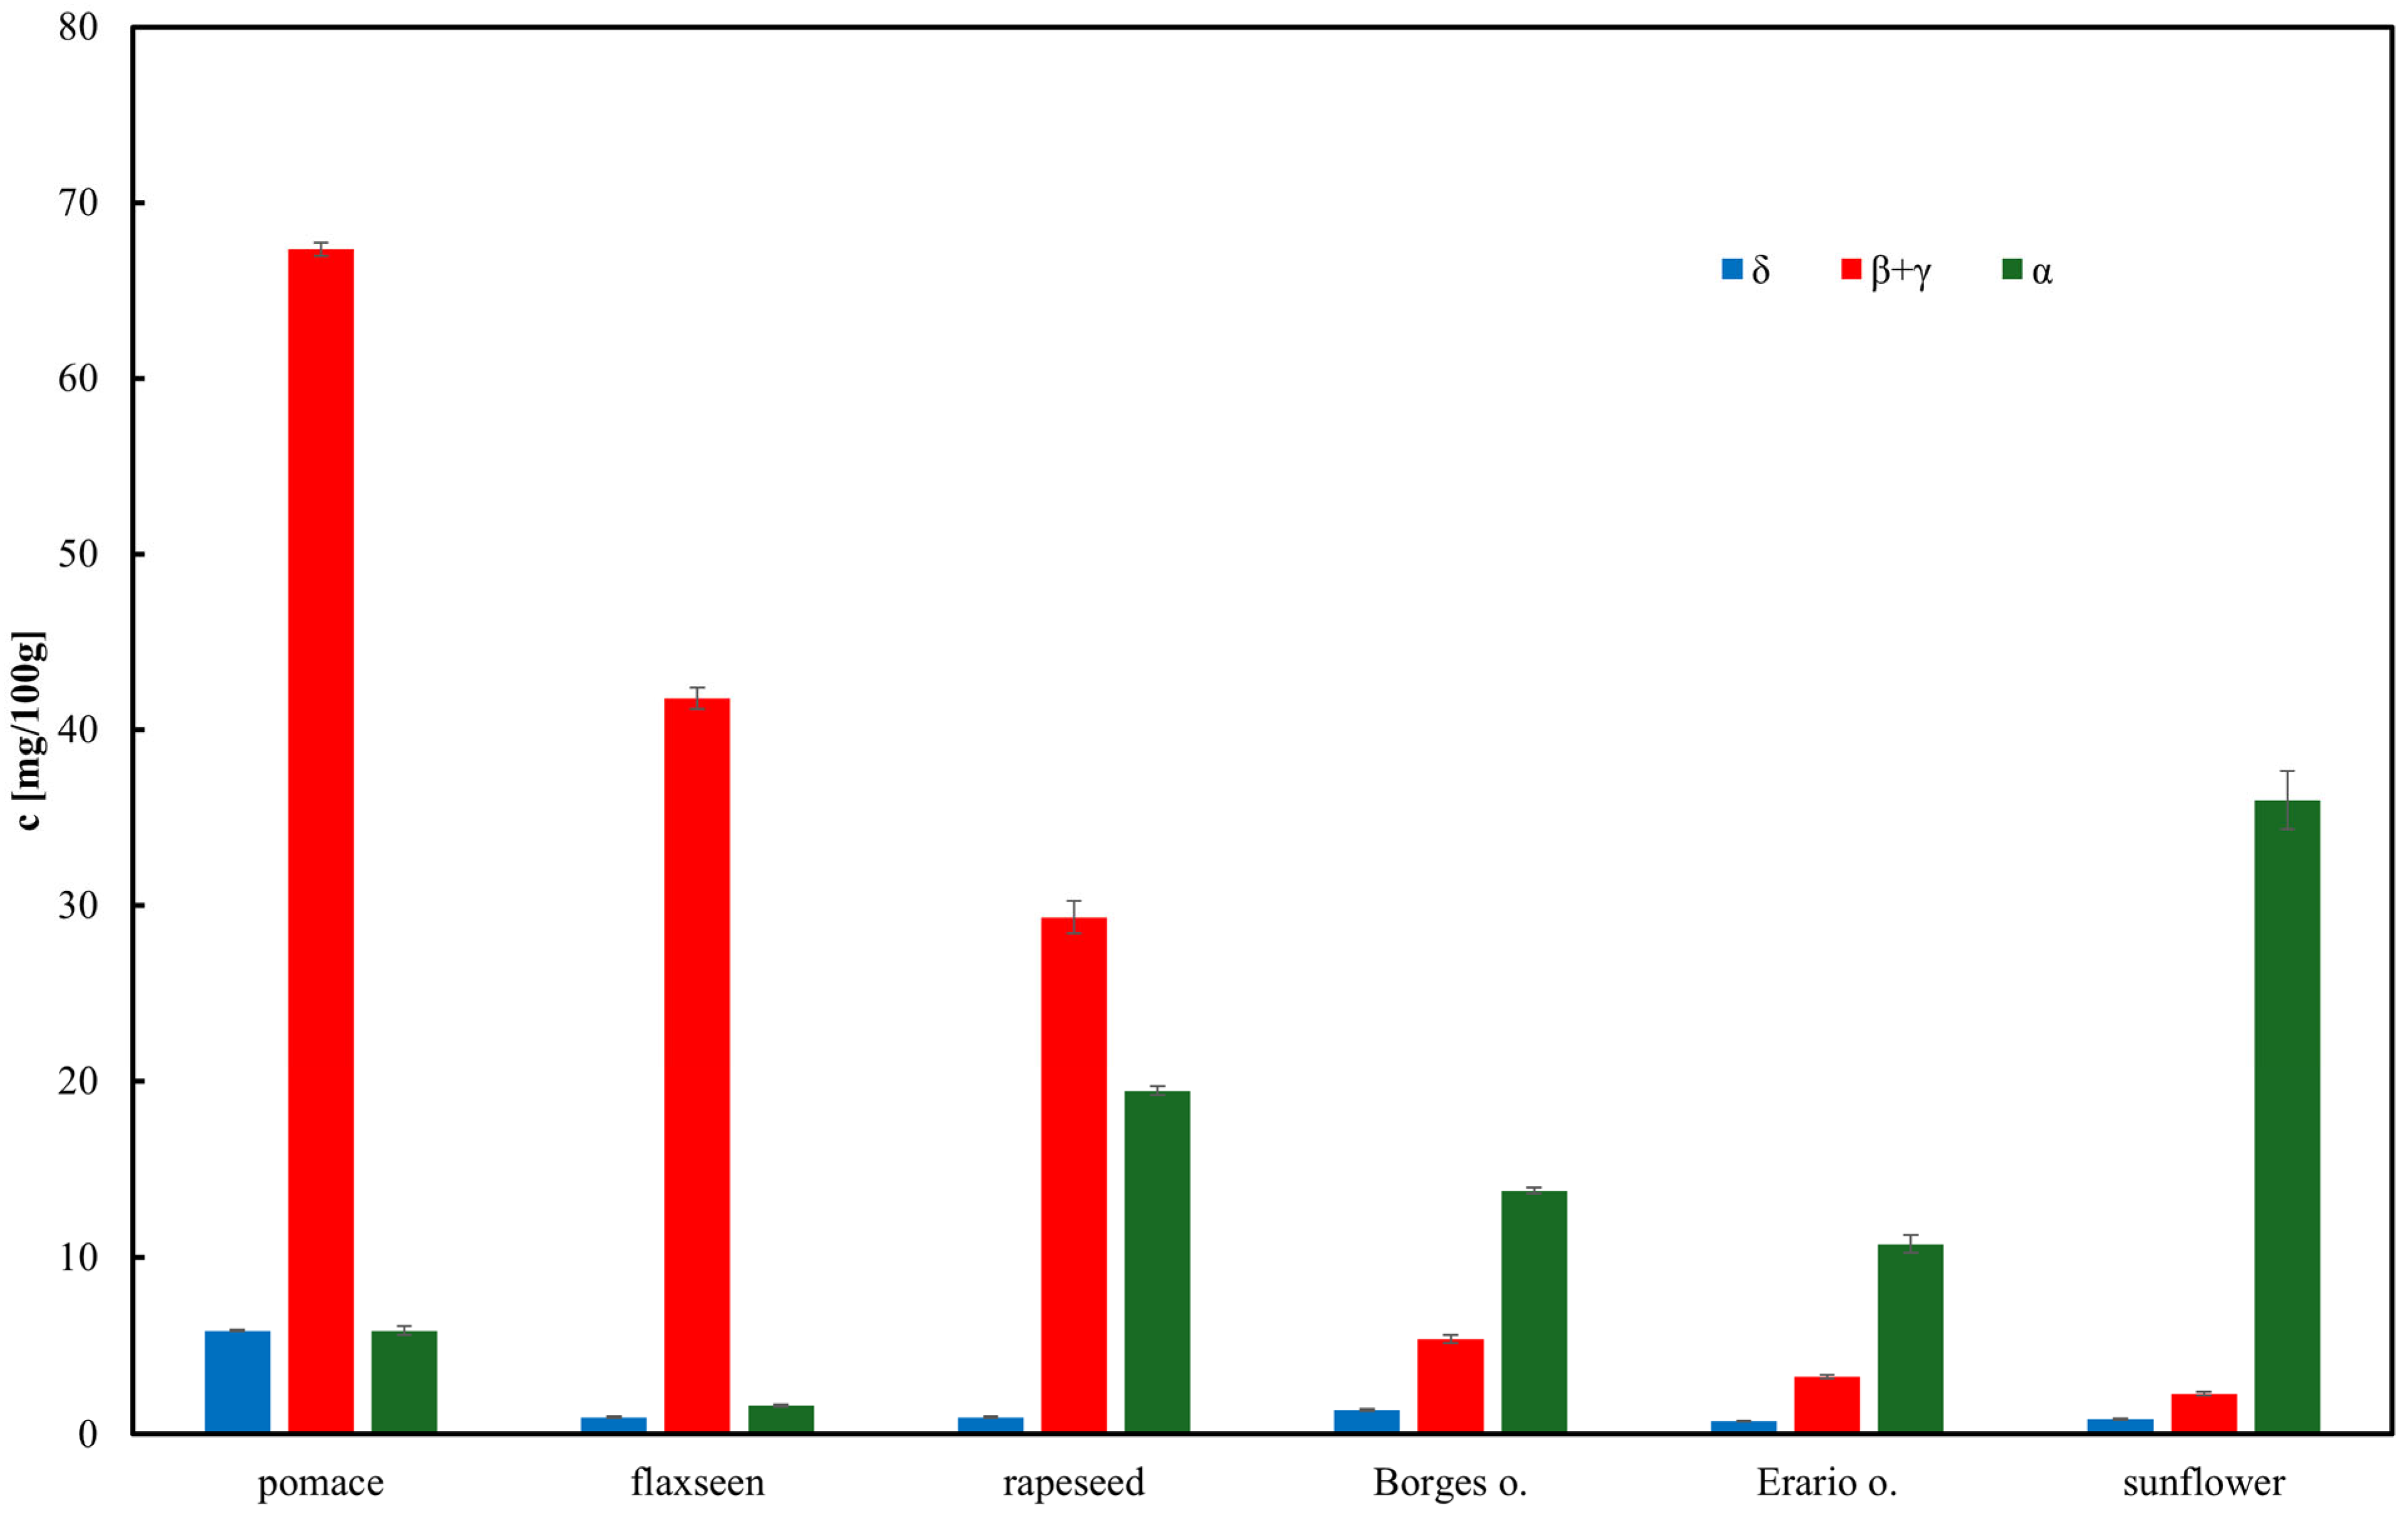
Rapeseed pomace, a by-product of rapeseed oil production, is seldom utilized in household applications. This study investigated its antioxidant properties by assessing (i) tocopherol concentrations and (ii) TAP. TAP was determined using cyclic voltammetry and amperometric detection coupled with HPLC. These results were compared to indirect methods measuring TAP via DPPH radical scavenging activity and total phenolic content. The findings suggest that rapeseed pomace contains the highest antioxidant concentrations, including tocopherols. Among the edible oils analyzed, rapeseed oil exhibited the greatest antioxidant content, whereas olive oil showed relatively lower levels. Notably, TAP values obtained through cyclic voltammetry differed from those of other methods, as this technique also accounted for weaker antioxidants. Due to the elimination of extensive sample preparation steps, such as saponification and the relative simplicity of measurement and signal processing, the HPLC method with amperometric detection was identified as the most advantageous.
The growing interest in functional foods and nutraceuticals has driven research into natural sources of antioxidants. Edible oils and oilseed byproducts, such as rapeseed pomace, are rich in bioactive compounds with potential health benefits. Rapeseed pomace, a byproduct of oil extraction, contains phenolic compounds, tocopherols, and other antioxidants. While the antioxidant properties of edible oils are well studied, there is limited comparative analysis between rapeseed pomace and commercial oils. Comparing these matrices may help evaluate the potential valorization of rapeseed pomace in food, feed, or supplement applications, and determine whether its antioxidant properties can compete with or complement those of commercial oils.
Recent literature also highlights increasing interest in revalorizing agro-industrial byproducts. For instance, a 2025 article provided an integrated evaluation of grape pomace from multiple varieties (2022–2024), profiling its fatty acid, total phenolic, flavonoid, and antioxidant parameters (DPPH, ABTS, ORAC), and demonstrating its suitability for functional, nutraceutical use [
44,
45]. In another study, incorporation of tomato pomace into sunflower and rapeseed oils significantly improved oxidative and thermal stability and enriched the oils with bioactive compounds such as carotenoids [
46]. Moreover, polyphenolic extracts from rapeseed pomace, particularly sinapic acid, possess strong antioxidant activity, supporting further valorization of rapeseed processing residues [
47].
The novelty of this study lies in two aspects: first, the use of methanol extraction as a rapid and cost-effective alternative to classical saponification for HPLC analysis of tocopherols; and second, the integration of chromatographic, spectrophotometric, and electrochemical assays to evaluate the TAP of both edible oils and rapeseed pomace. These innovations enable a more comprehensive and comparative assessment of antioxidant profiles in oil matrices and by-products.
Therefore, the aim of this study was to comprehensively evaluate the tocopherol content and antioxidant potential of rapeseed pomace in comparison with selected edible oils, using a multi-method approach that combines chromatographic (HPLC–ED), spectrophotometric (DPPH and Folin–Ciocalteu), and electrochemical (CV and DPV) techniques.
3. Materials and Methods
3.1. Reagents
HPLC-grade methanol (≥99.9%), camphorsulfonic acid, DPPH, Folin–Ciocalteu reagent were obtained from Sigma-Aldrich (Saint Louis, MO, USA), mixed tocopherol standards (total concentration: 726 mg/mL; α-tocopherol: 143 mg/mL; β-tocopherol: 11 mg/mL; γ-tocopherol: 444 mg/mL; δ-tocopherol: 128 mg/mL) and sodium perchlorate (NaClO4) were procured from Sigma-Aldrich (Saint Louis, MO, USA). Sodium carbonate (Na2CO3) was obtained from Chempur (Piekary Śląskie, Poland). All chemicals were analytical grade and used without further purification.
Water was triple-distilled using a quartz distillation apparatus (Heraeus Quarzglas, Destamat, Germany). Samples for HPLC–ED analysis were filtered through a 0.22 μm membrane filter (Millipore, Bedford, MA, USA) prior to use.
3.2. Materials
Commercial edible oils were sourced from supermarkets in Poland, including: Erario (Italy, extra virgin olive oil), Borges (Spain, extra virgin olive oil), Mazowiecki (Poland, rapeseed oil, refined), Niharti (UK, flaxseed oil, refined), and Bartek (Poland, sunflower oil, refined). Rapeseed pomace was obtained from MGW-Krzysztof Kurciński Sp. z o.o. (Bytom, Poland).
3.3. Sample Preparation
In this study, we evaluated the feasibility of extracting oils with methanol using an ultrasonic bath. Briefly, 0.2 g of oil was placed in a 10 mL volumetric flask filled with methanol, and the flask was subjected to ultrasonic treatment for approximately 30 min. The resulting solution was filtered through a 0.45 µm nylon membrane filter (Millipore, Bedford, MA, USA) and analyzed by HPLC [
69].
Calibration curve for gallic acid was constructed in the range 0.001–0.005 mg/mL, showing excellent linearity (R2 = 0.994; y = 0.9941x). Results were expressed as mg GAE/100 g of oil.
3.4. Apparatus
HPLC analysis was conducted using a chromatographic system comprising an Interface Box, 4-channel Smartline Manager 5000 with Degasser K-5004, Solvent Organizer K-1500, Dynamic Mixing Chamber, HPLC Pump Smartline 1000, UV/Vis Diode Array Detector Smartline 2600, 20 μL D-14163 injection valve, and Smartline 4000 Column Thermostat; all components were from Knauer GmbH (Knauer, Berlin, Germany). An amperometric detector (Recipe, Berlin, Germany; ClinLab EC3000) equipped with a glassy carbon (GC) working electrode, Ag/AgCl reference electrode, and auxiliary electrode (cell body) was used, alongside an autosampler (Smartline-3900). Separation was performed on a COSMOSIL 5C18-MS-II column (250 × 4.6 mm I.D., 5 µm particle size; Knauer, Berlin, Germany).
pH measurements were carried out using a pH meter OP-208/1 (Radelkis, Budapest, Hungary) equipped with an OSH 10-10 electrode (Metron, Aargau, Switzerland).
Photometric assays (DPPH and FC) were performed using a Helios Epsilon spectrophotometer (Thermo Fisher Scientific, Waltham, MA, USA) and a DU68 spectrophotometer (Beckman, Brea, CA, USA).
Electrochemical measurements were performed with an Autolab PGSTAT20 potentiostat/galvanostat (Eco Chemie, Utrecht, Netherlands) using a three-electrode system. The working electrode was a 2 mm diameter glassy carbon disk, polished prior to each measurement with a 0.05 µm alumina aqueous suspension on a polishing pad, followed by rinsing with water. A platinum wire served as the auxiliary electrode, and a saturated Ag/AgCl electrode (3 mol/L KCl) functioned as the reference electrode. Data acquisition and control were managed via GPES v4.9 software on an IBM PC.
3.5. Procedures
3.5.1. HPLC Measurements
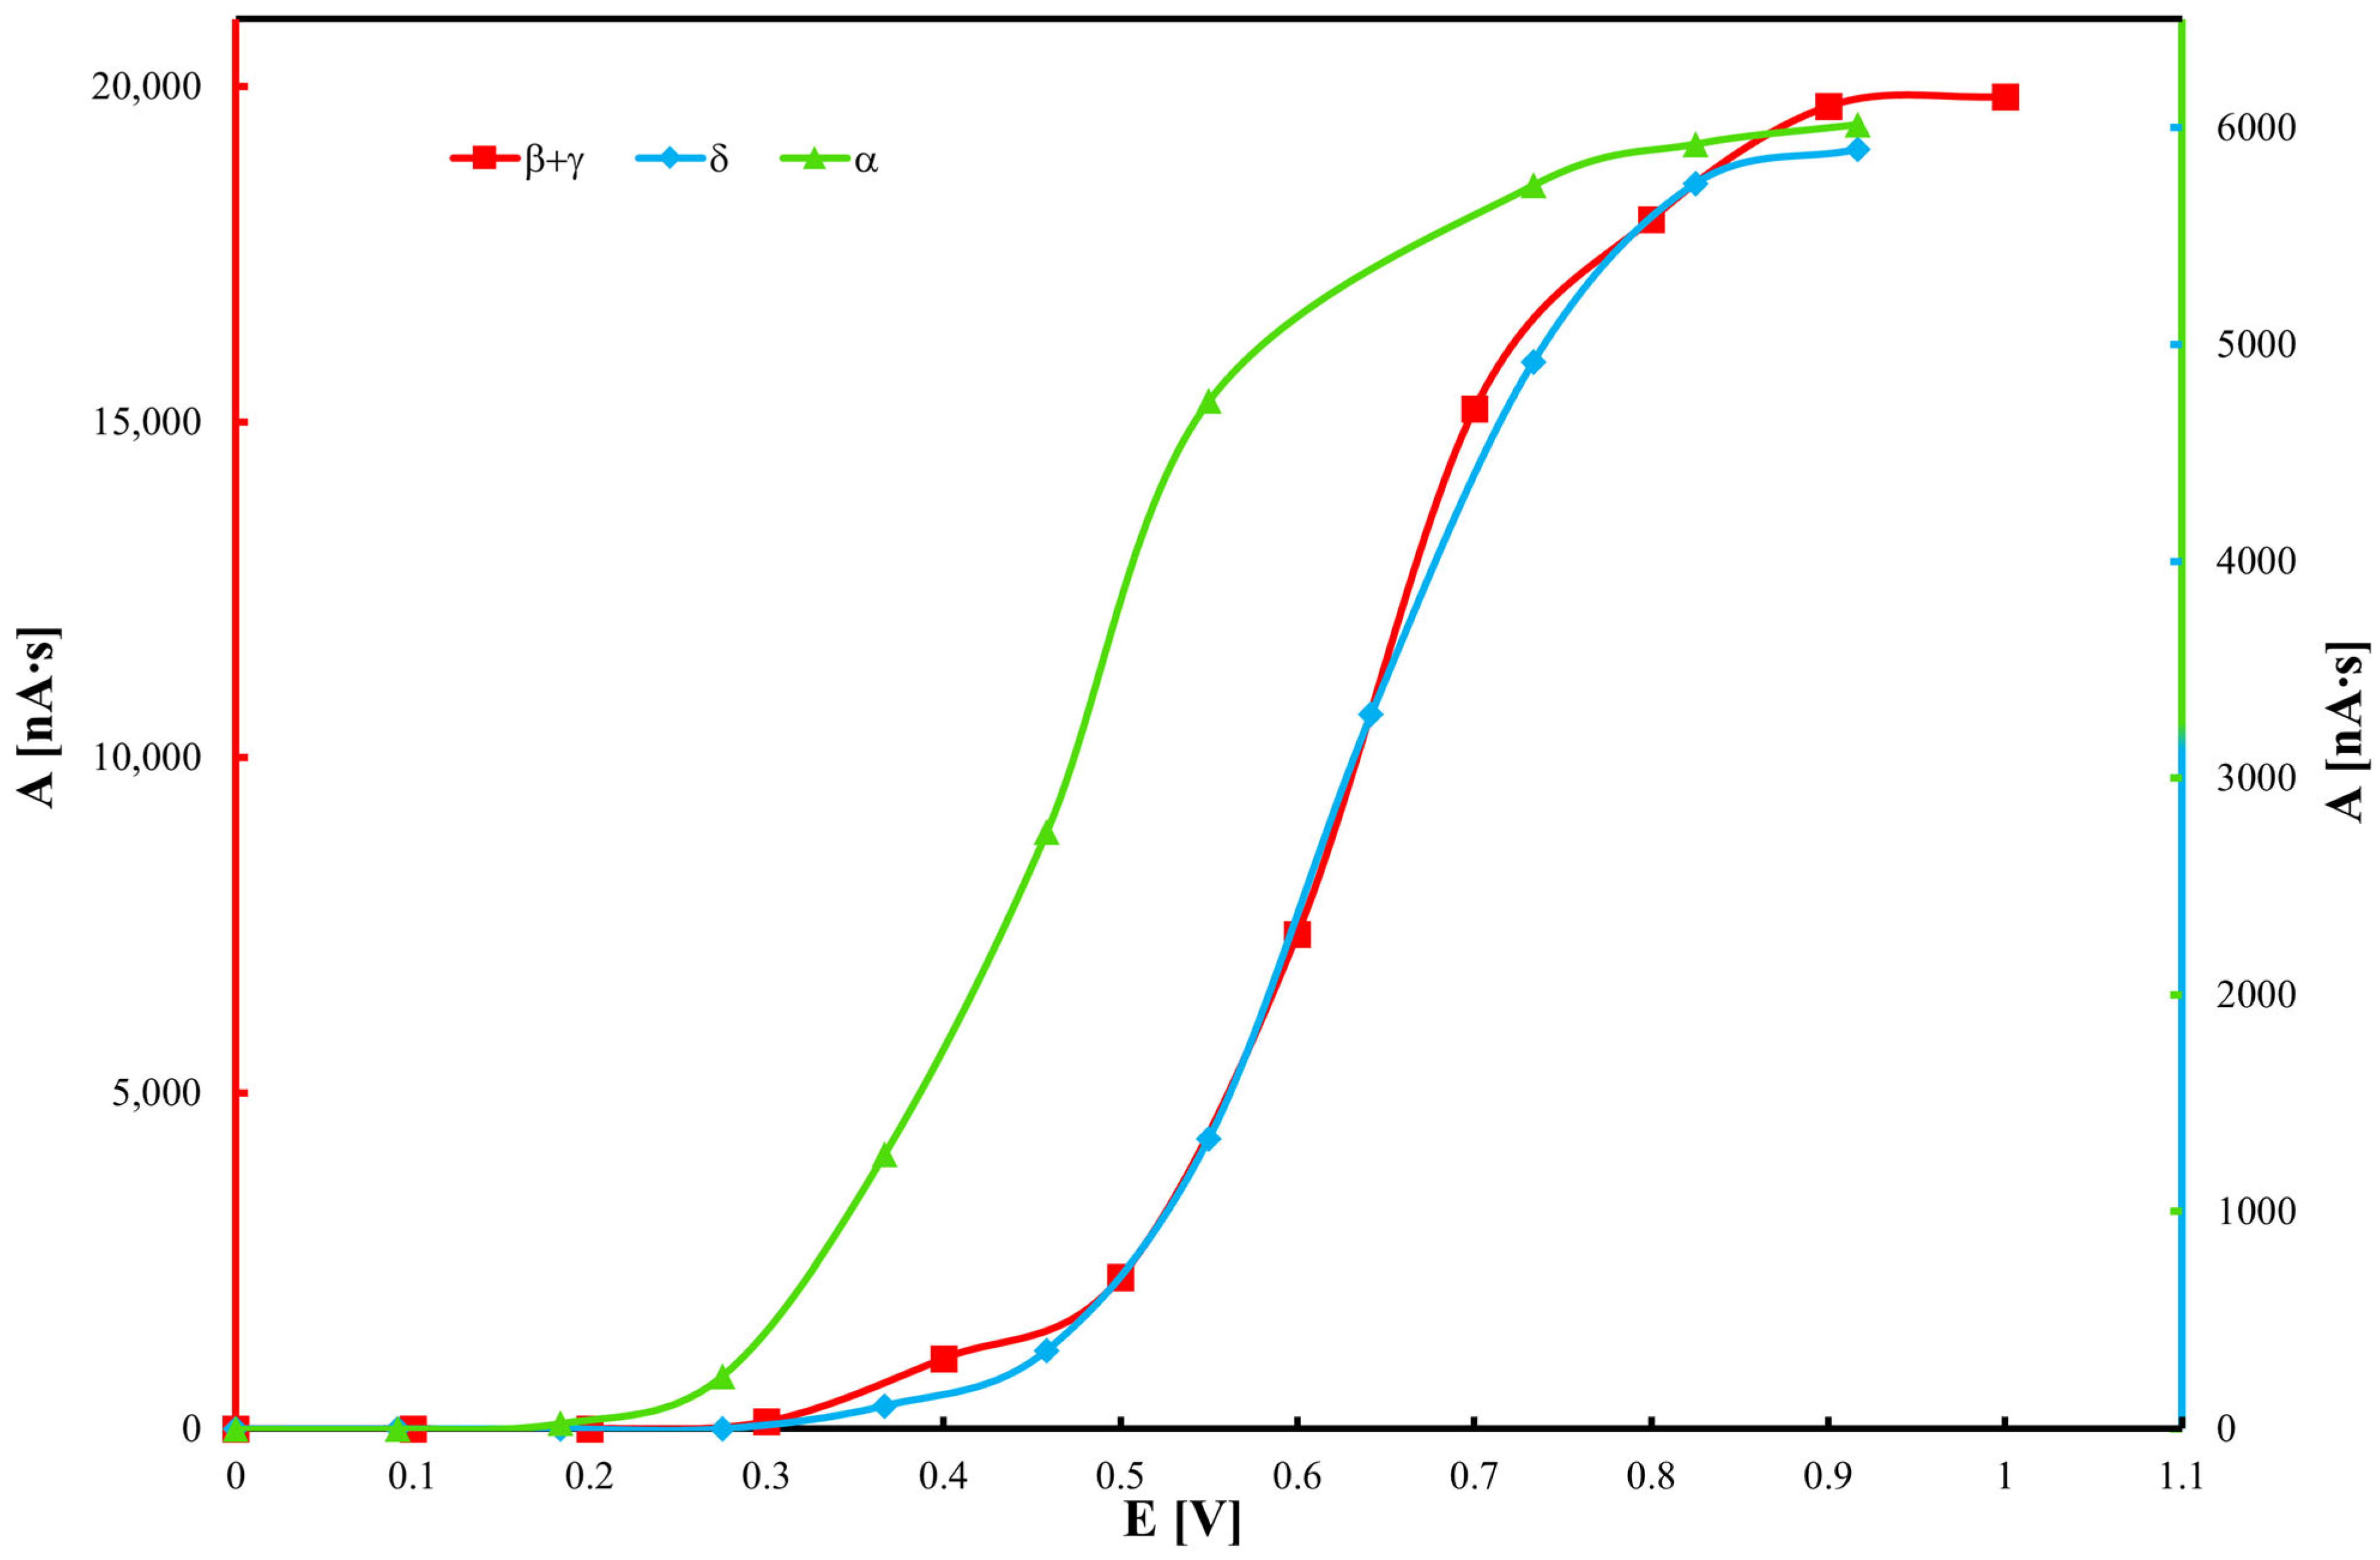
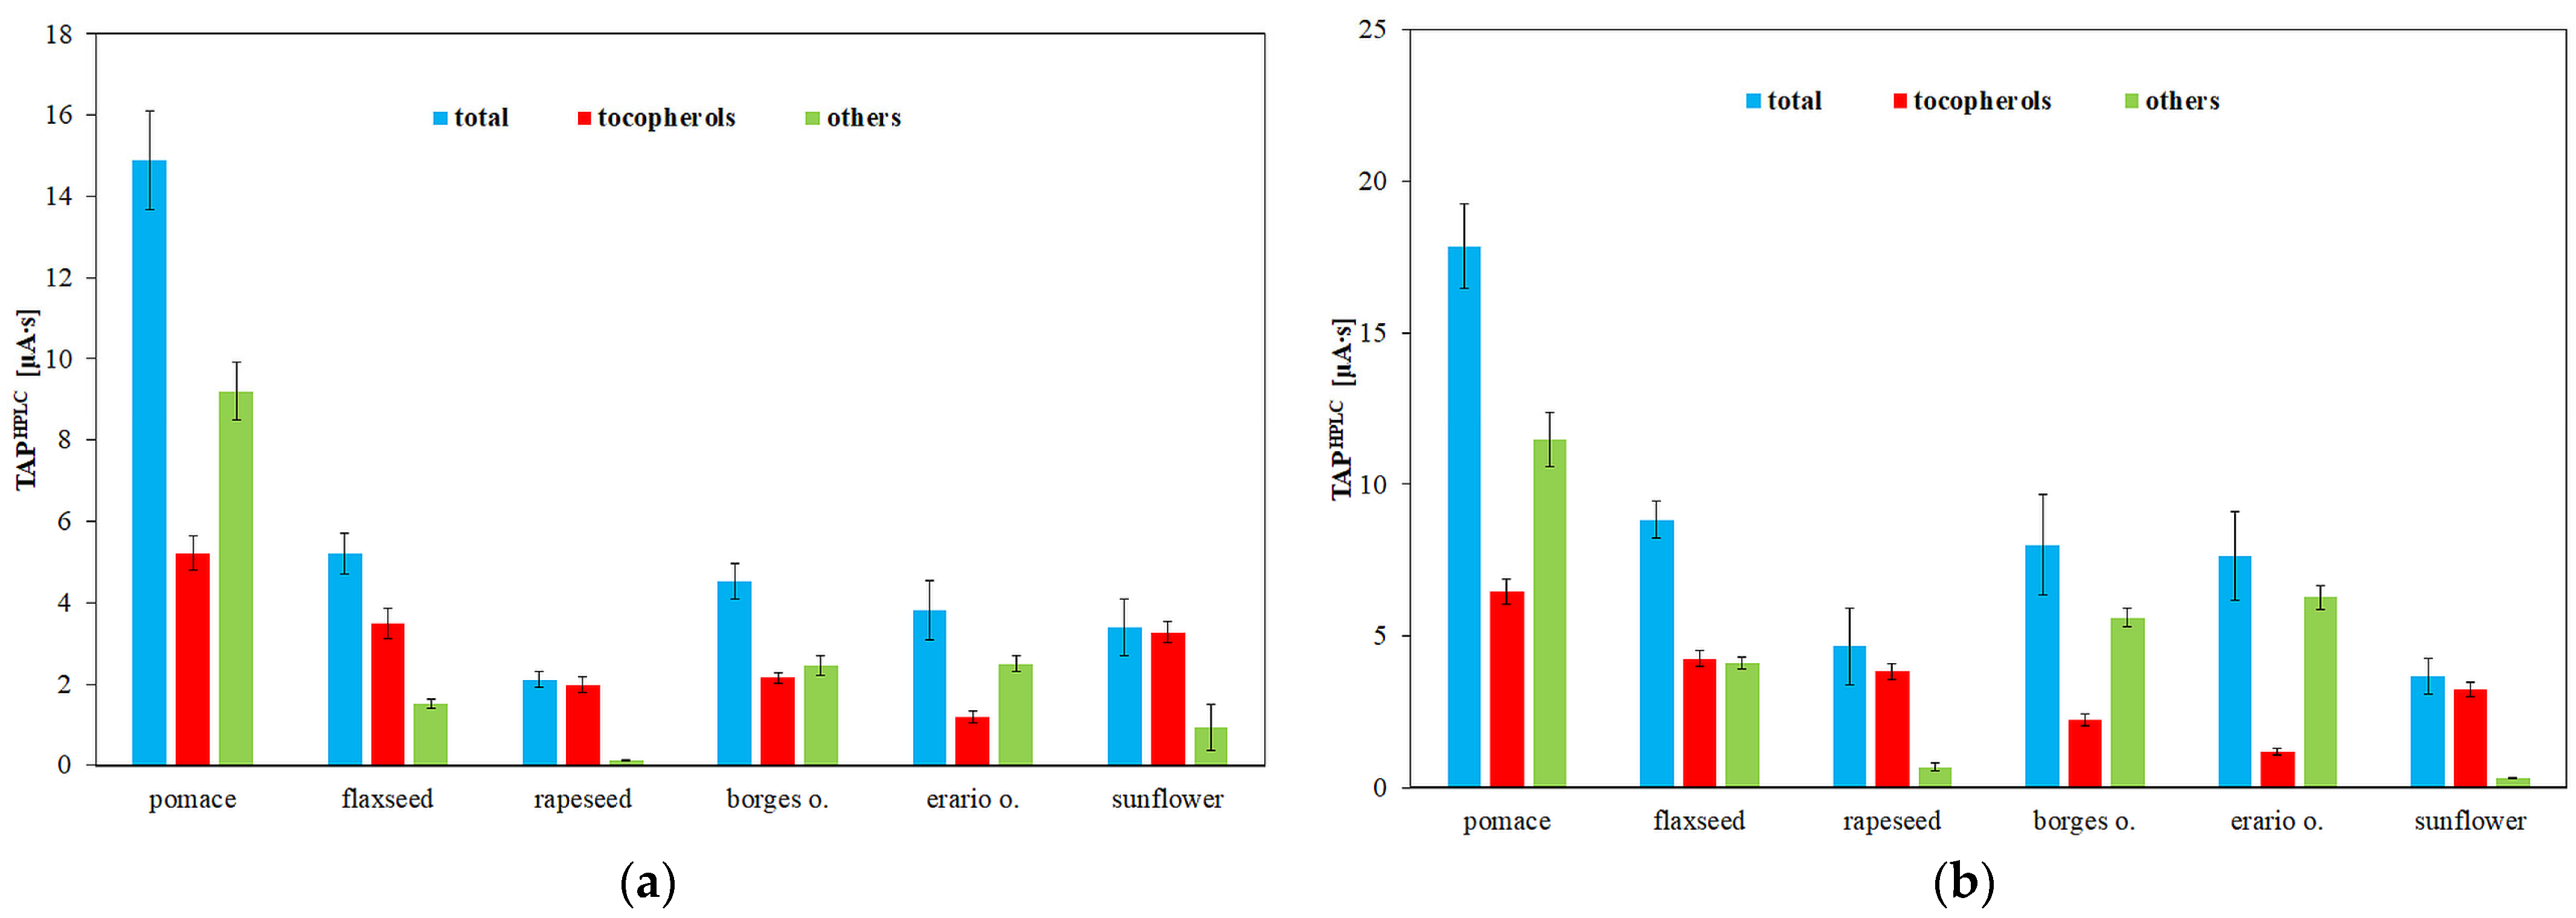
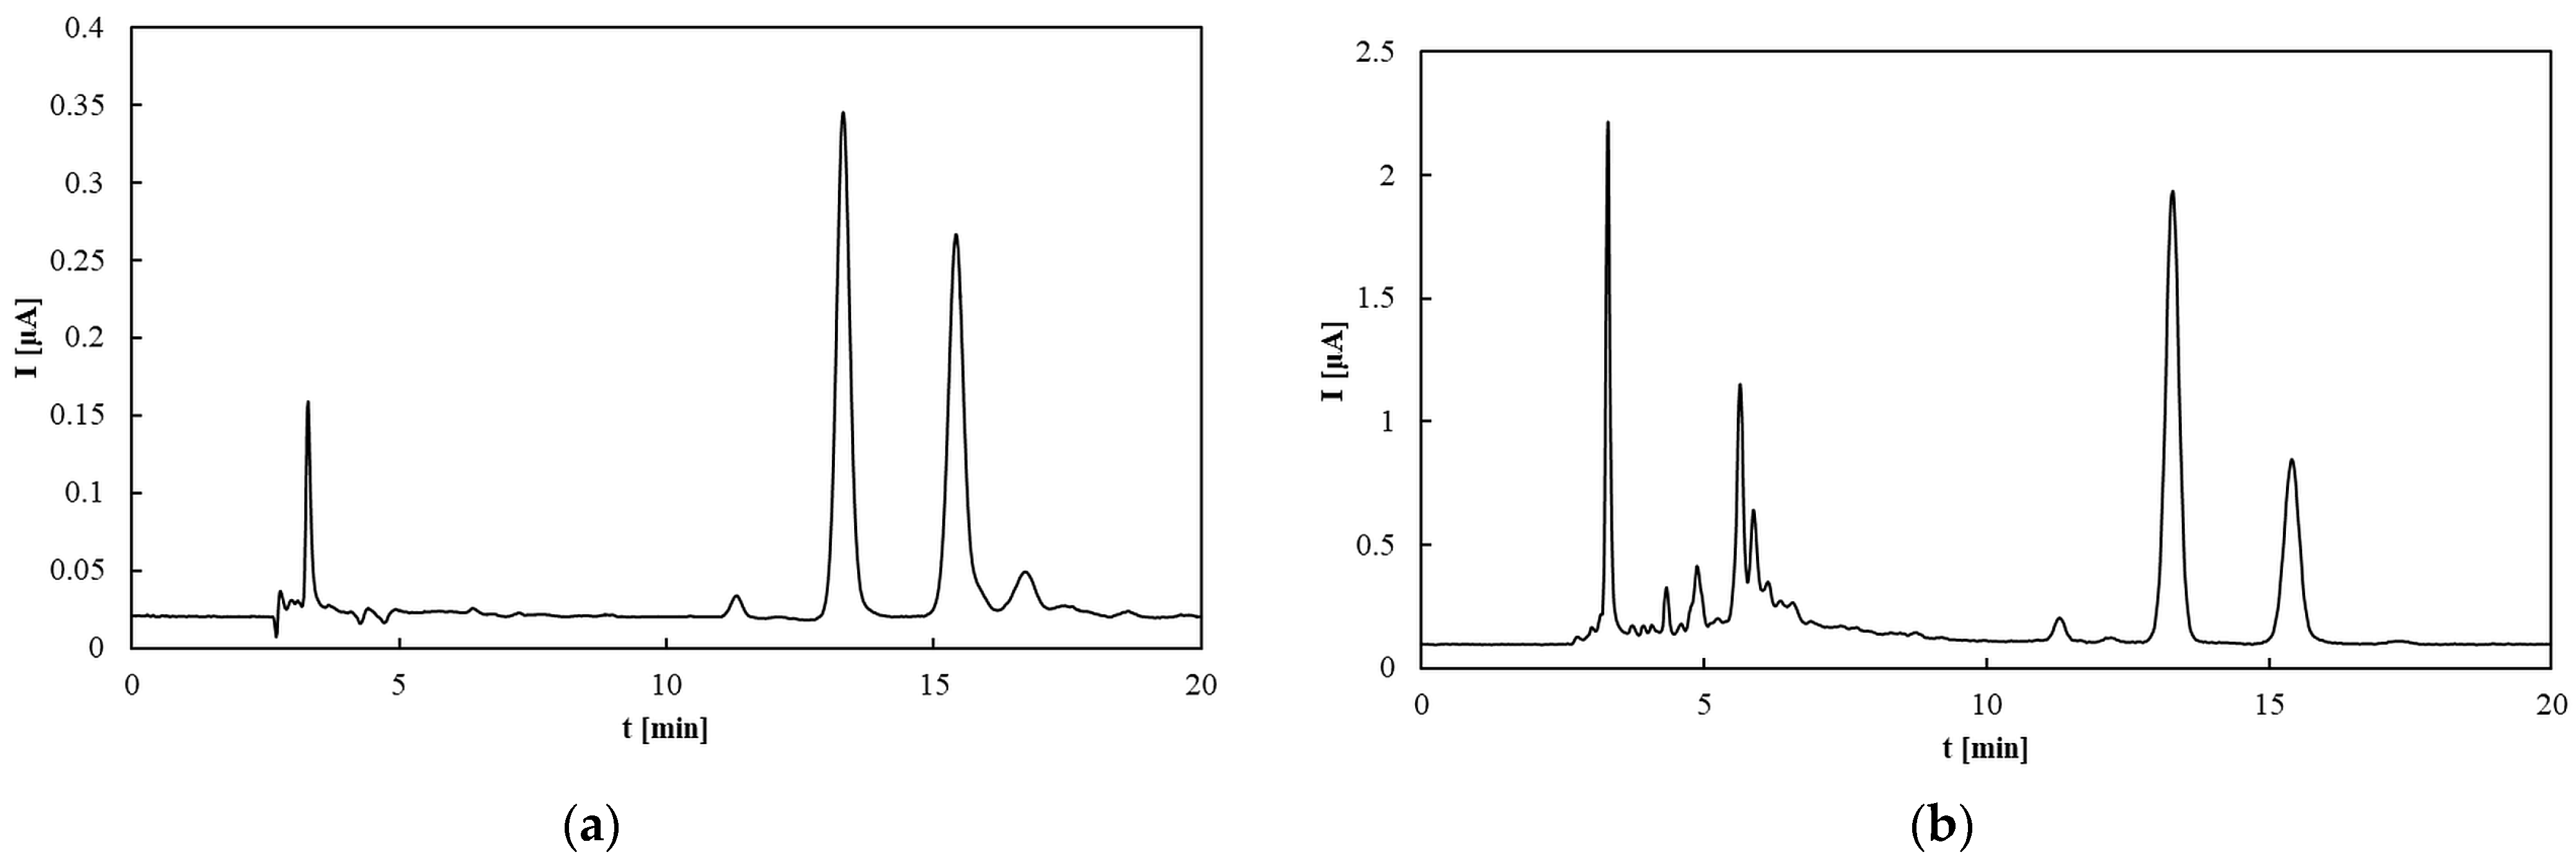
Chromatographic analyses were performed at a flow rate of 1.0 mL/min. The column was equilibrated at 20 °C by passing the mobile phase through it for 1 h prior to sample injection. The mobile phase consisted of 0.1 M NaClO4 in methanol/water (99:1, v/v). Samples (20 µL) were injected using an autosampler. All measurements were conducted at 20 °C. Electrochemical detector signals were continuously monitored and recorded by the computer. The working electrode potential was set at 0.6 V and 0.8 V to differentiate between strong and weak antioxidants. Each analysis lasted 20 min. TAP was assessed by calculating the total peak area on the chromatogram corresponding to retention times (tR) of up to 20 min at the specified electrode potentials.
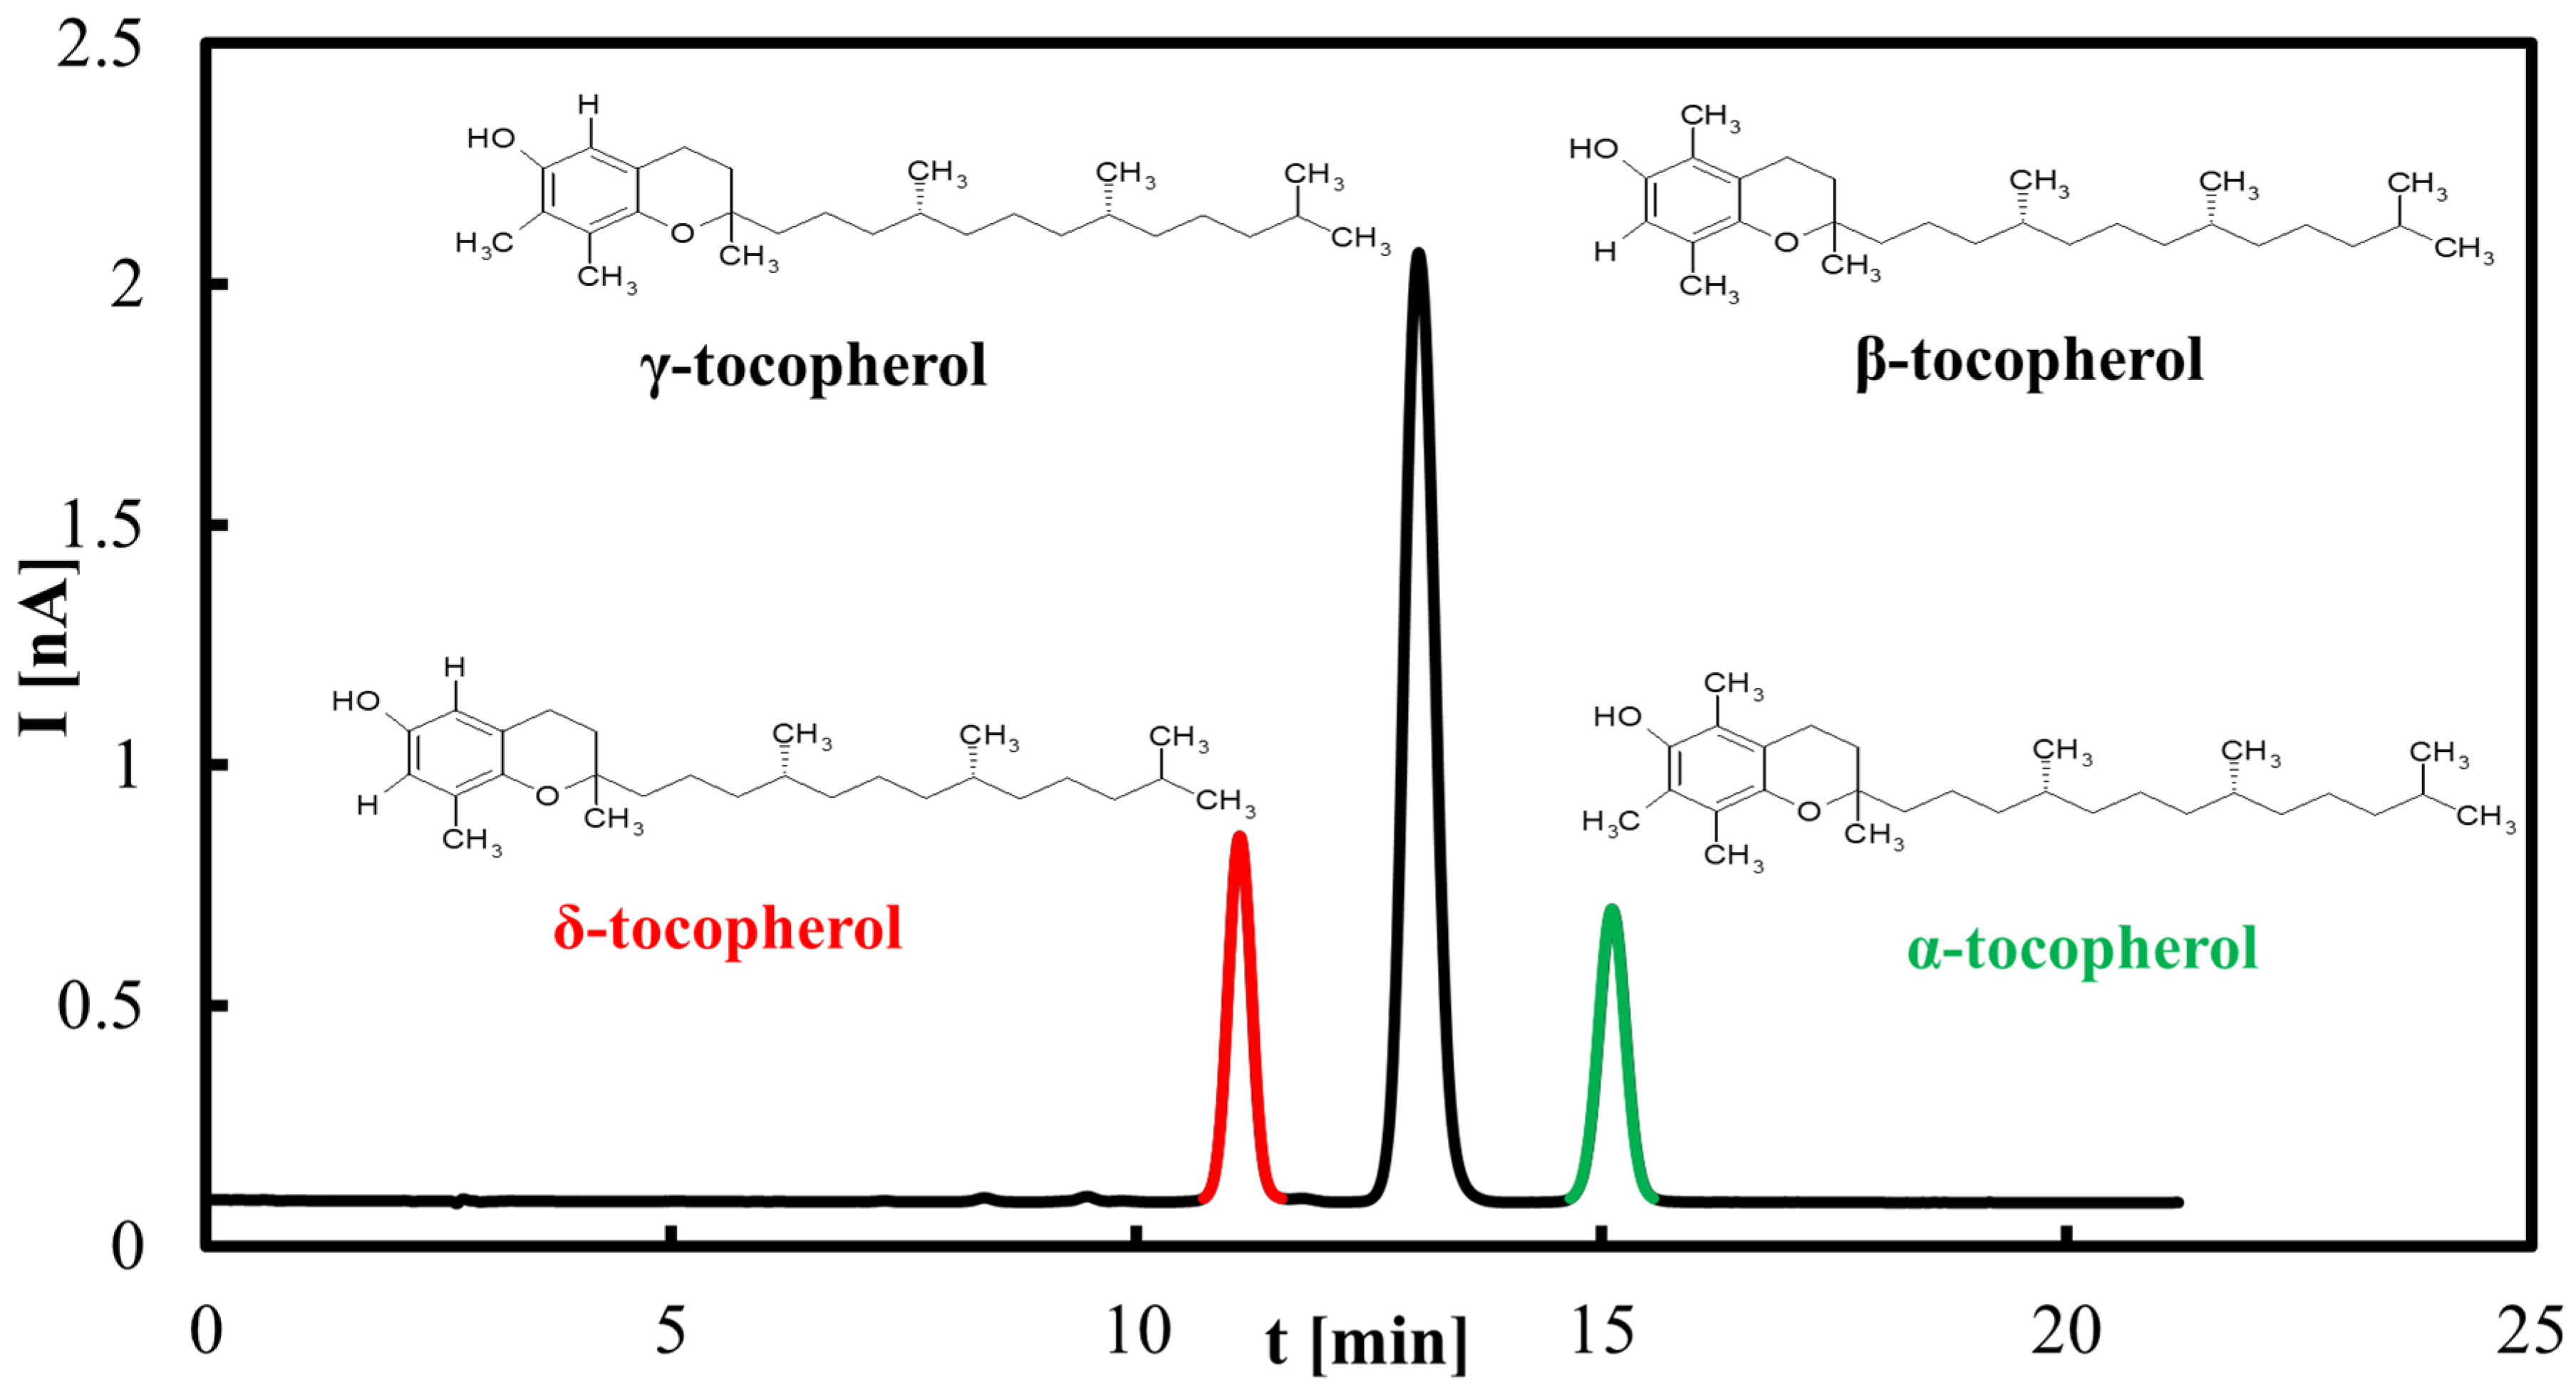
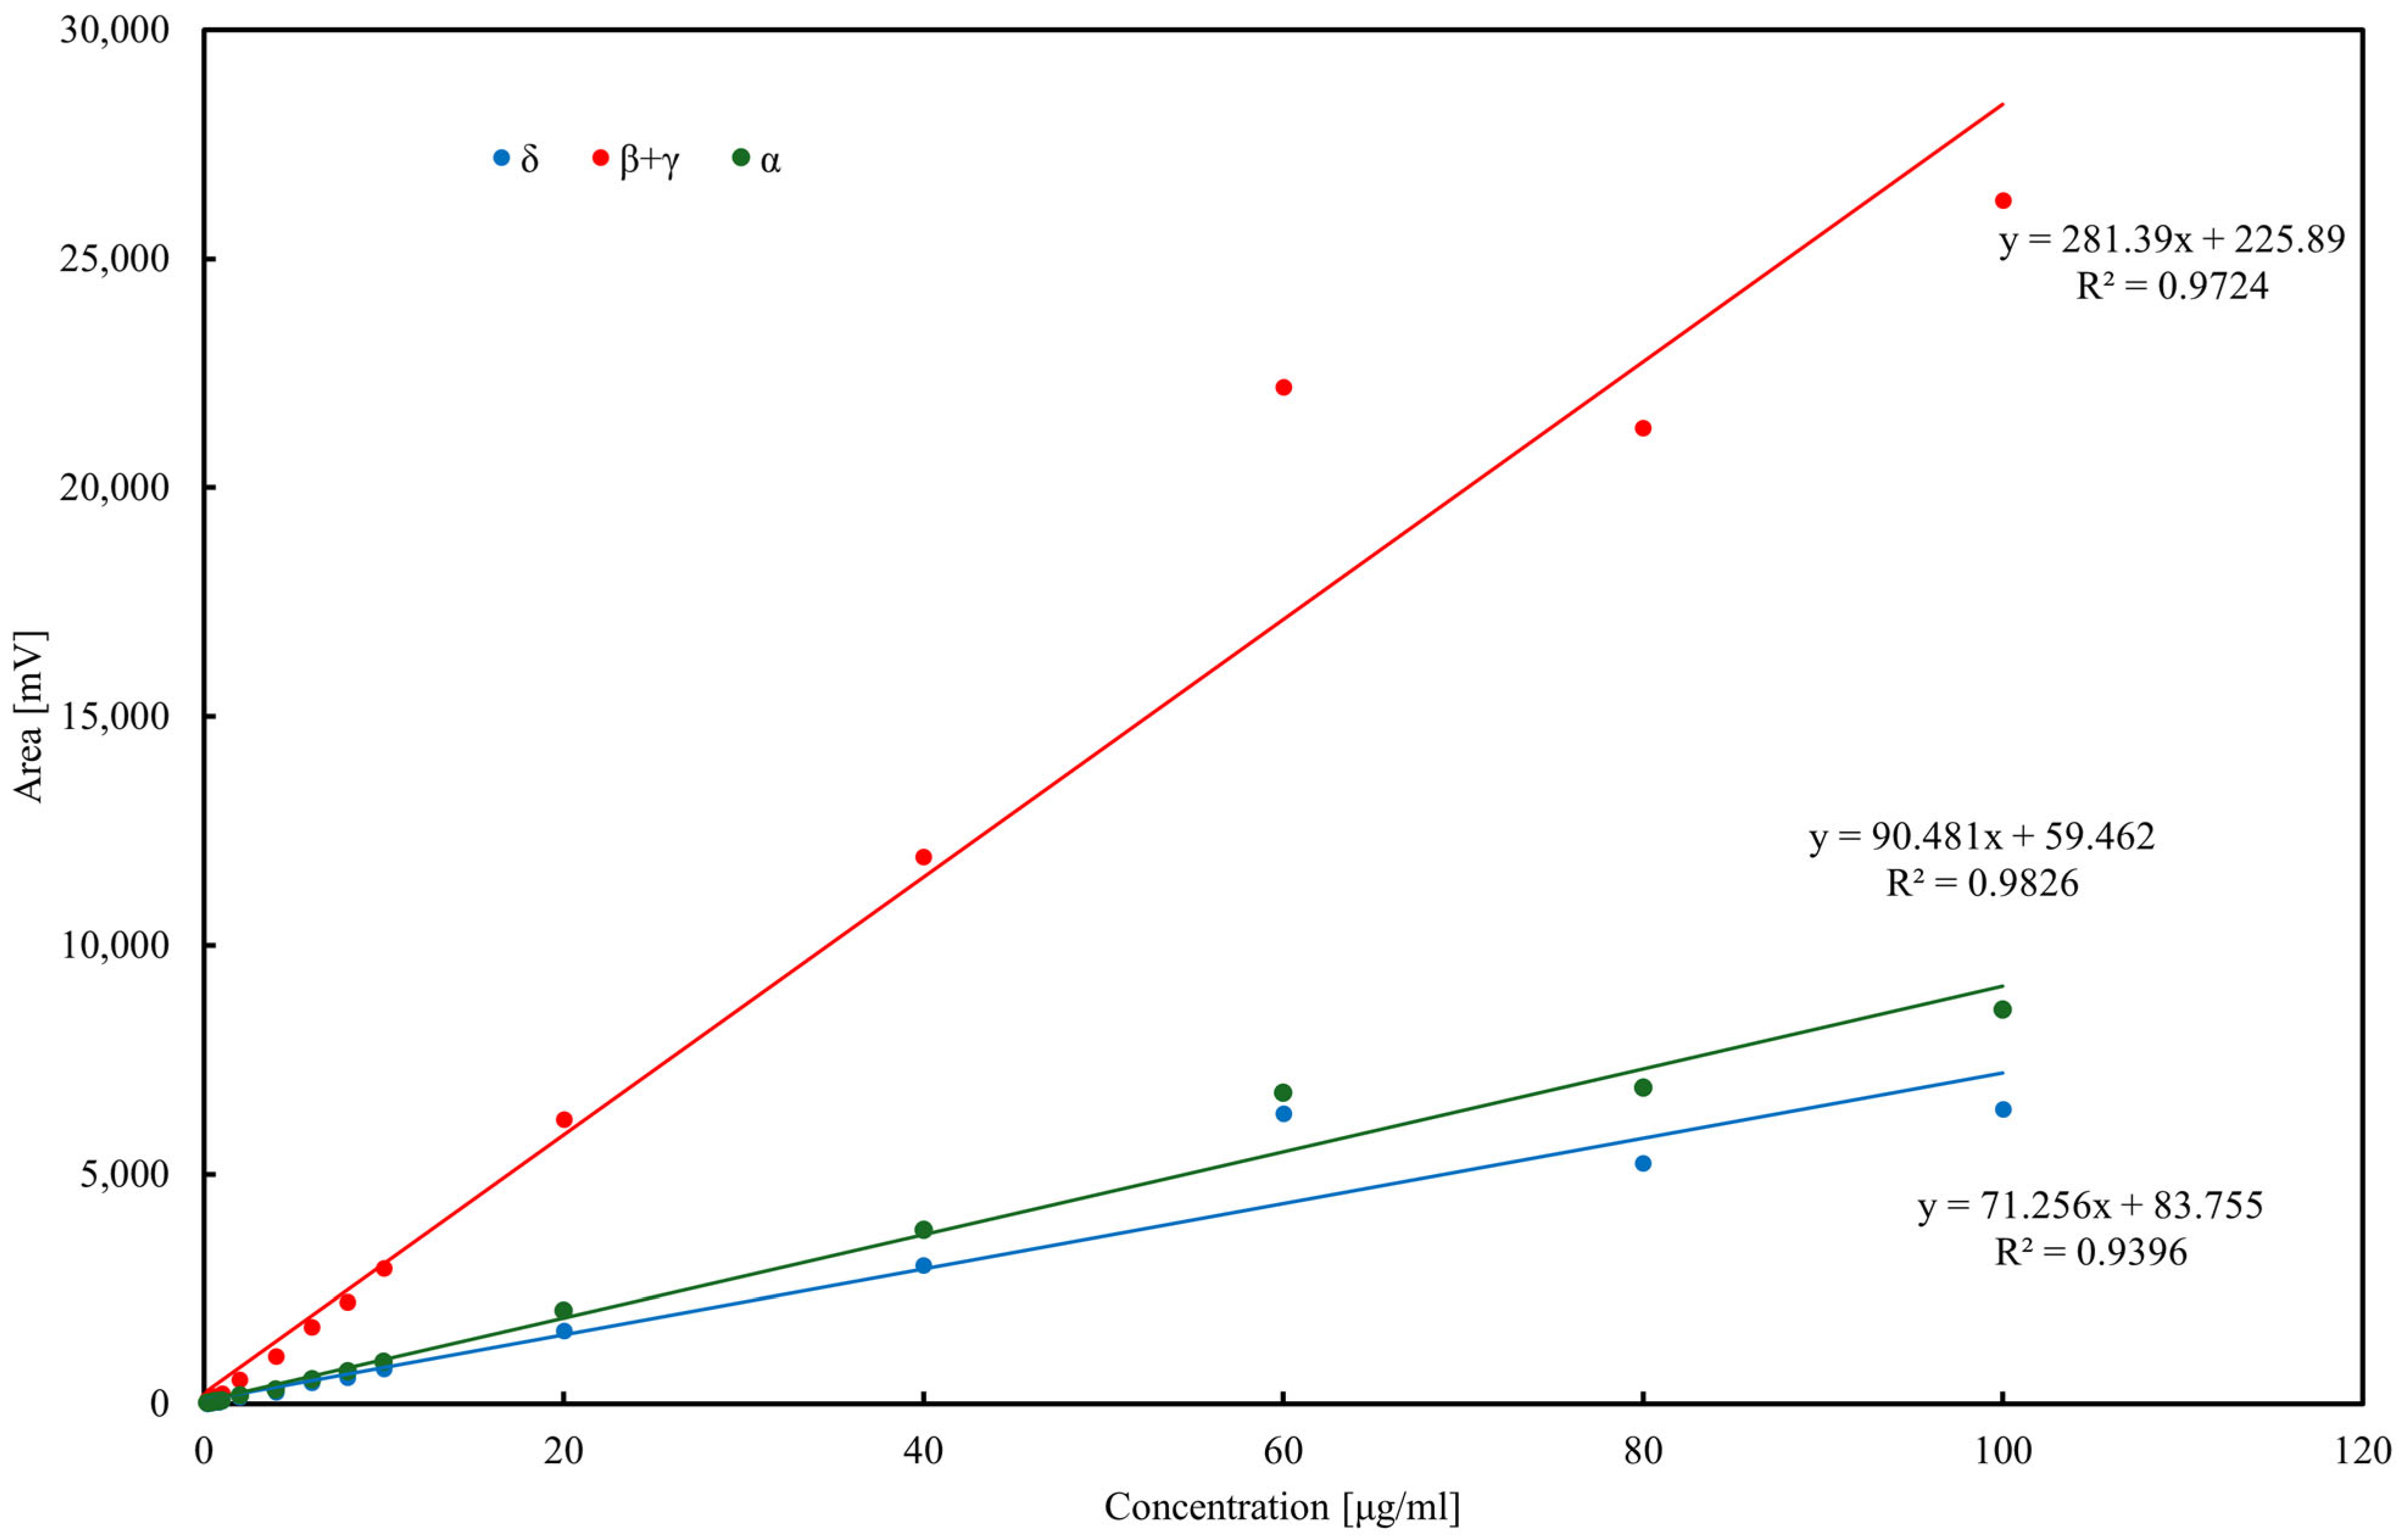
Calibration curves for α-, δ-, and β+γ-tocopherols (the latter quantified jointly due to co-elution) were established in the range 0.2–100 µg/mL. Linear regression demonstrated good correlation, with R2 = 0.9396 for δ-tocopherol (y = 71.25x + 83.755), R2 = 0.9724 for β+γ-tocopherols (y = 281.39x + 225.89), and R2 = 0.9826 for α-tocopherol (y = 90.481x + 59.462). Slight deviations from linearity at higher concentrations (>60 µg/mL) were attributed to detector saturation. LOD and LOQ, calculated as 3.3σ/s and 10σ/s, respectively, were in the range of 2–4 µg/mL (LOD) and 6–12 µg/mL (LOQ) depending on the homolog. Precision, assessed by replicate injections at 10 µg/mL, did not exceed 3% RSD for peak areas and 0.5% for retention times. These results confirm the suitability of the HPLC–ED method for quantitative tocopherol determination in oils and rapeseed pomace.
3.5.2. DPPH Assay
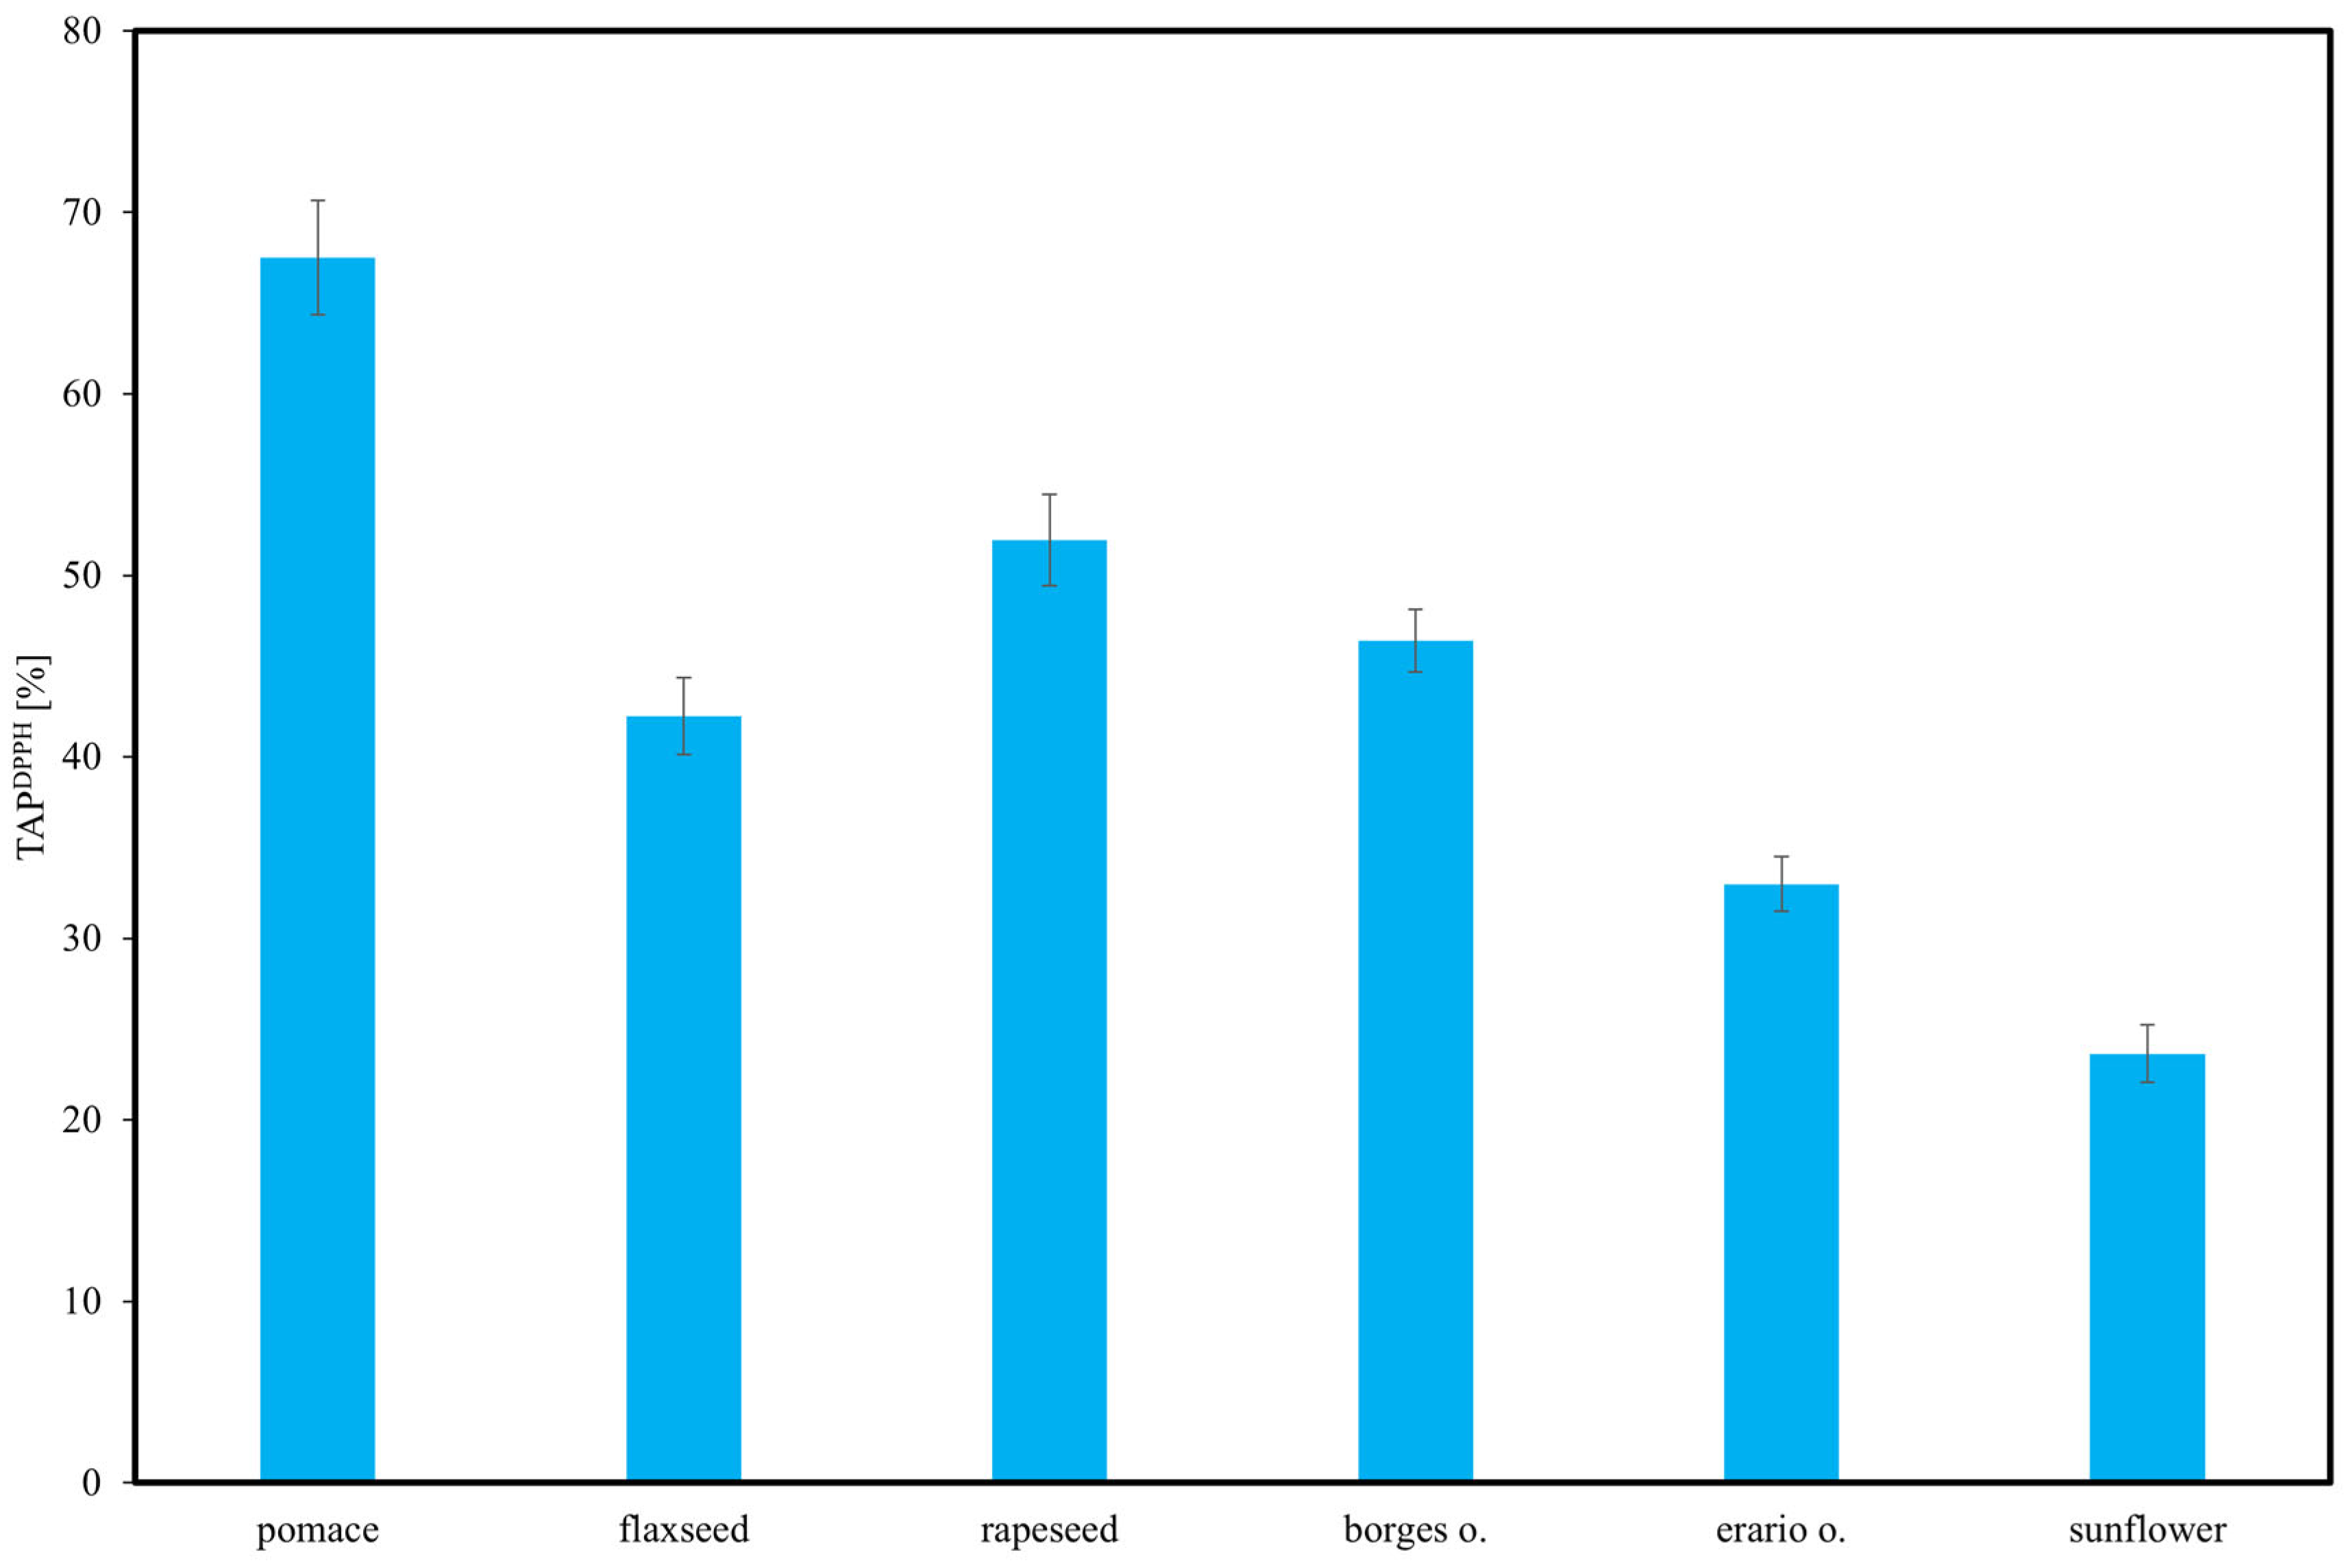
The measurement of TAP related to the DPPH radical (TAPDPPH) involved mixing the sample solution and methanol to a total volume of 1 mL with 1 mL of 1 mM DPPH solution in methanol. The mixture was vigorously shaken and incubated in the dark at room temperature for 30 min. Subsequently, the absorbance was measured at 517 nm.
The DPPH assay was selected because it is one of the most widely applied and standardized methods for evaluating antioxidant activity in edible oils, ensuring reliable comparison with published data. Alternative assays such as FRAP or superoxide radical scavenging were not included, as they require different experimental conditions and reagents, which would limit direct comparability.
3.5.3. Total Polyphenol Content
Polyphenols content was examined using a modified Folin–Ciocalteu method [
70]. 50 µL of the sample (initial concentration 0.02 g/mL) was added to a 10 mL volumetric flask, followed by 1 mL of Folin–Ciocalteu reagent. After 3 min, 4 mL of 20% Na
2CO
3 solution was added, and the volume was adjusted to the mark with distilled water. The mixture was incubated in the dark for 30 min to allow the reaction to stabilize. Absorbance was then measured at 765 nm against a blank containing all reagents except the sample. Results were expressed as gallic acid equivalents (GAE, mg GAE/100 g of oil).
3.5.4. Cyclic Voltammetry
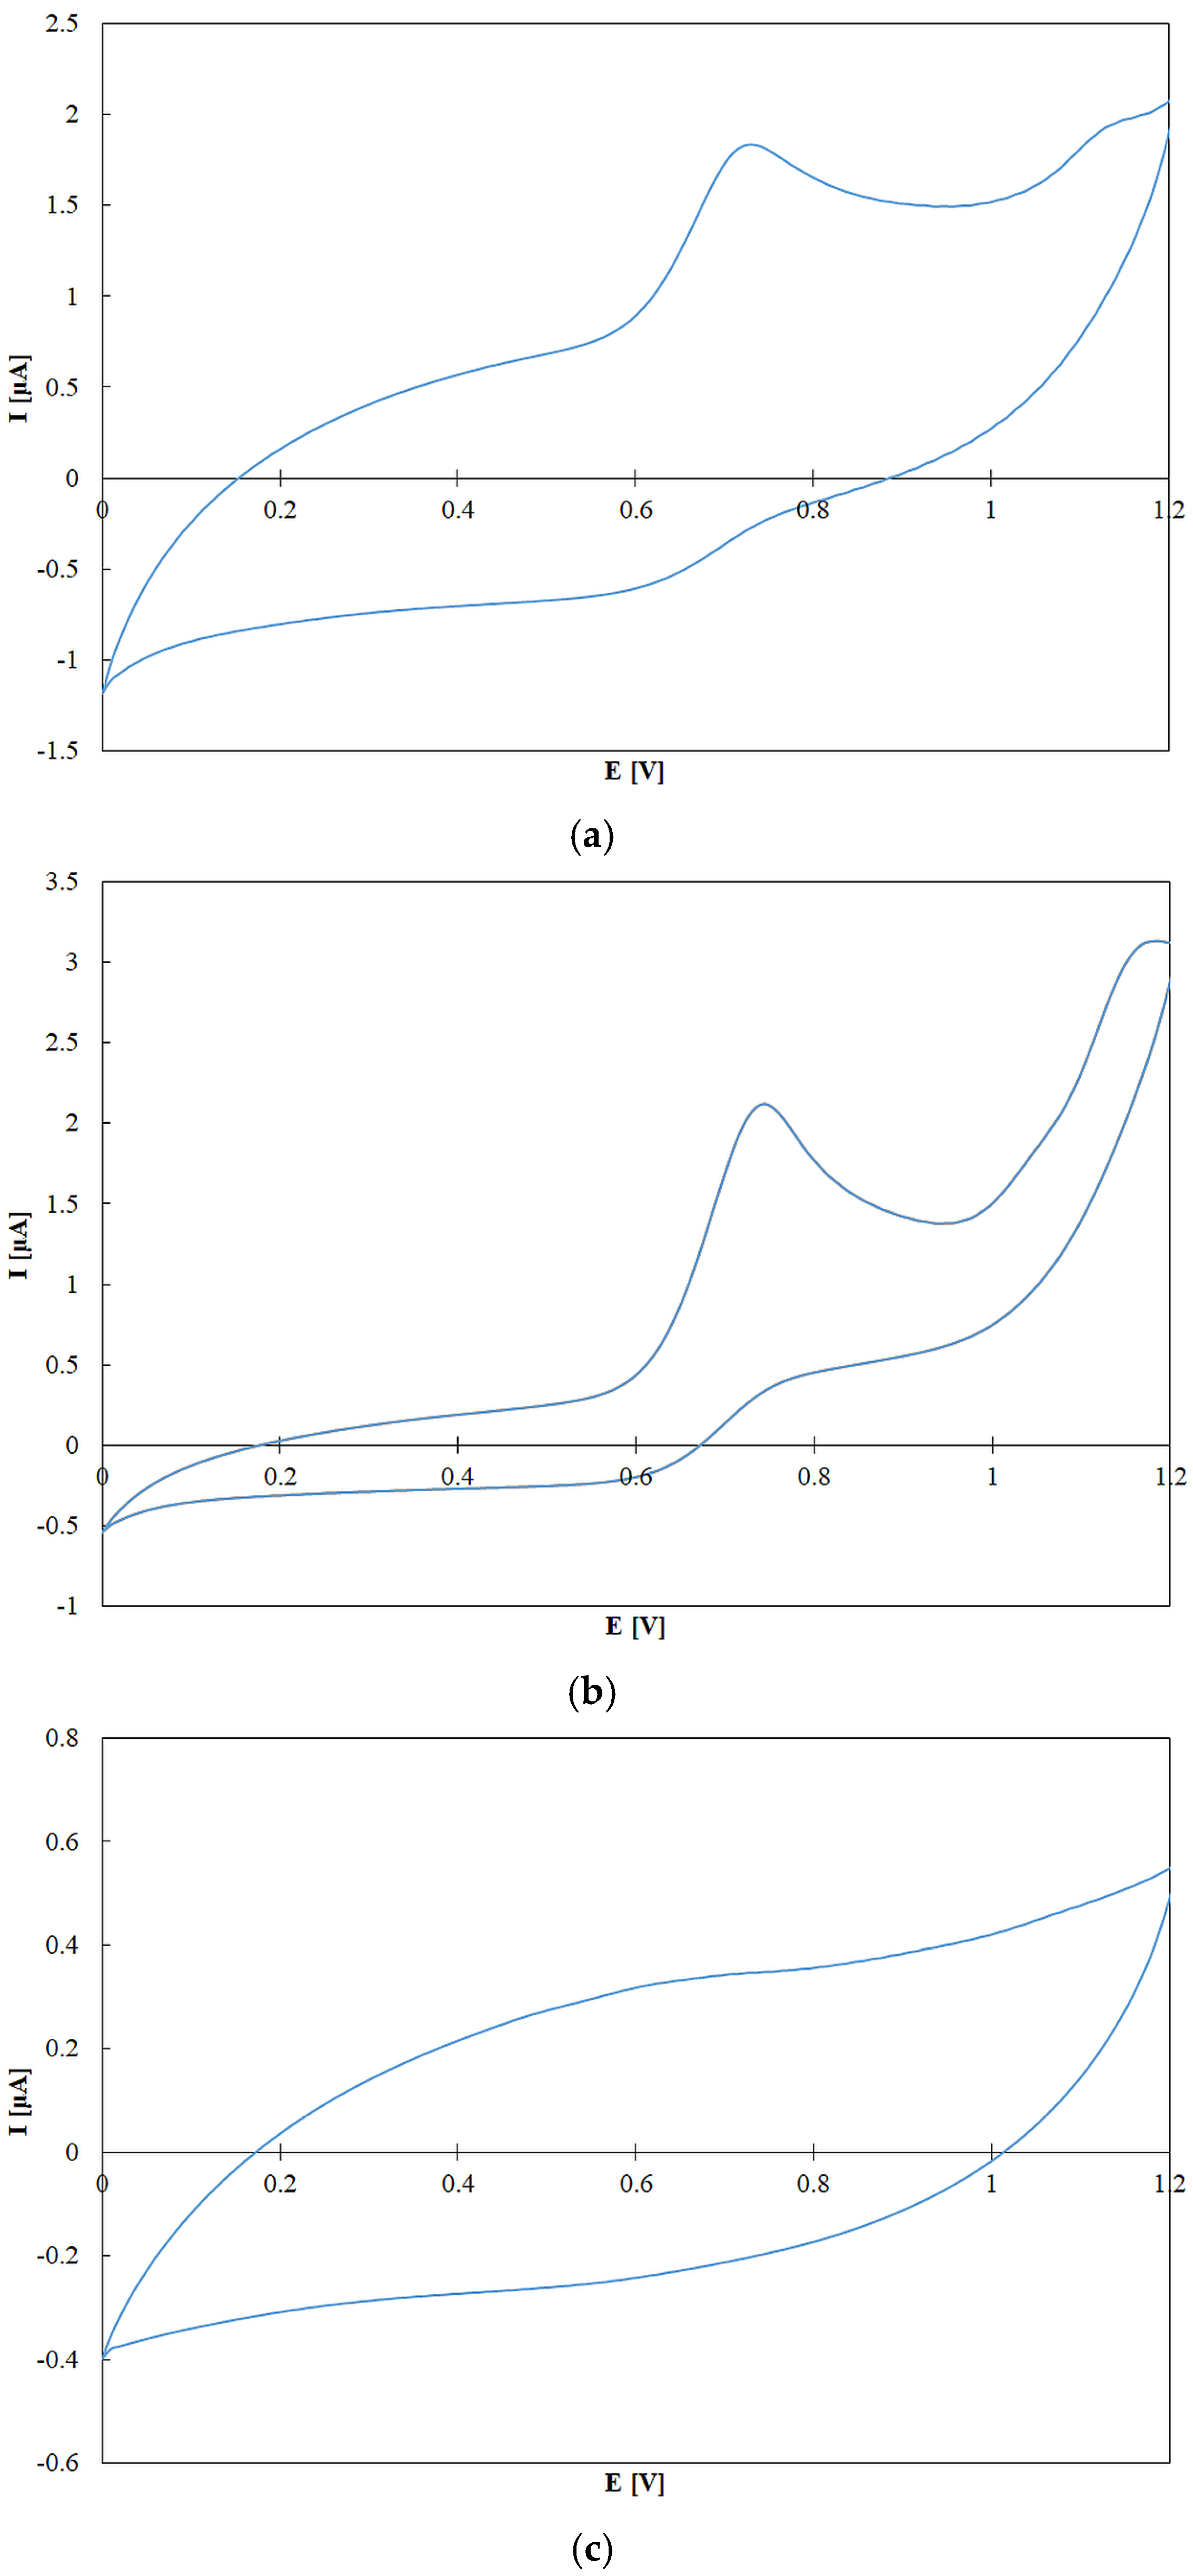
Electrochemical measurements by cyclic voltammetry were conducted in a 10 mL electrochemical cell using 0.1 M NaClO4 in methanol as the supporting electrolyte. To prevent irreversible adsorption of sample components on the working electrode, 1 mM camphorsulfonic acid was added. Measurements were performed at a scan rate of 200 mV/s over a potential range of 0 to 1.2 V (positive direction). Prior to each measurement, the working electrode was mechanically cleaned using diamond paste followed by polishing with a slurry of water and 1 µm alumina particles. All solutions were degassed by purging with argon for 5 min and allowed to equilibrate for 10 min before measurements.
3.6. Statistical Analysis
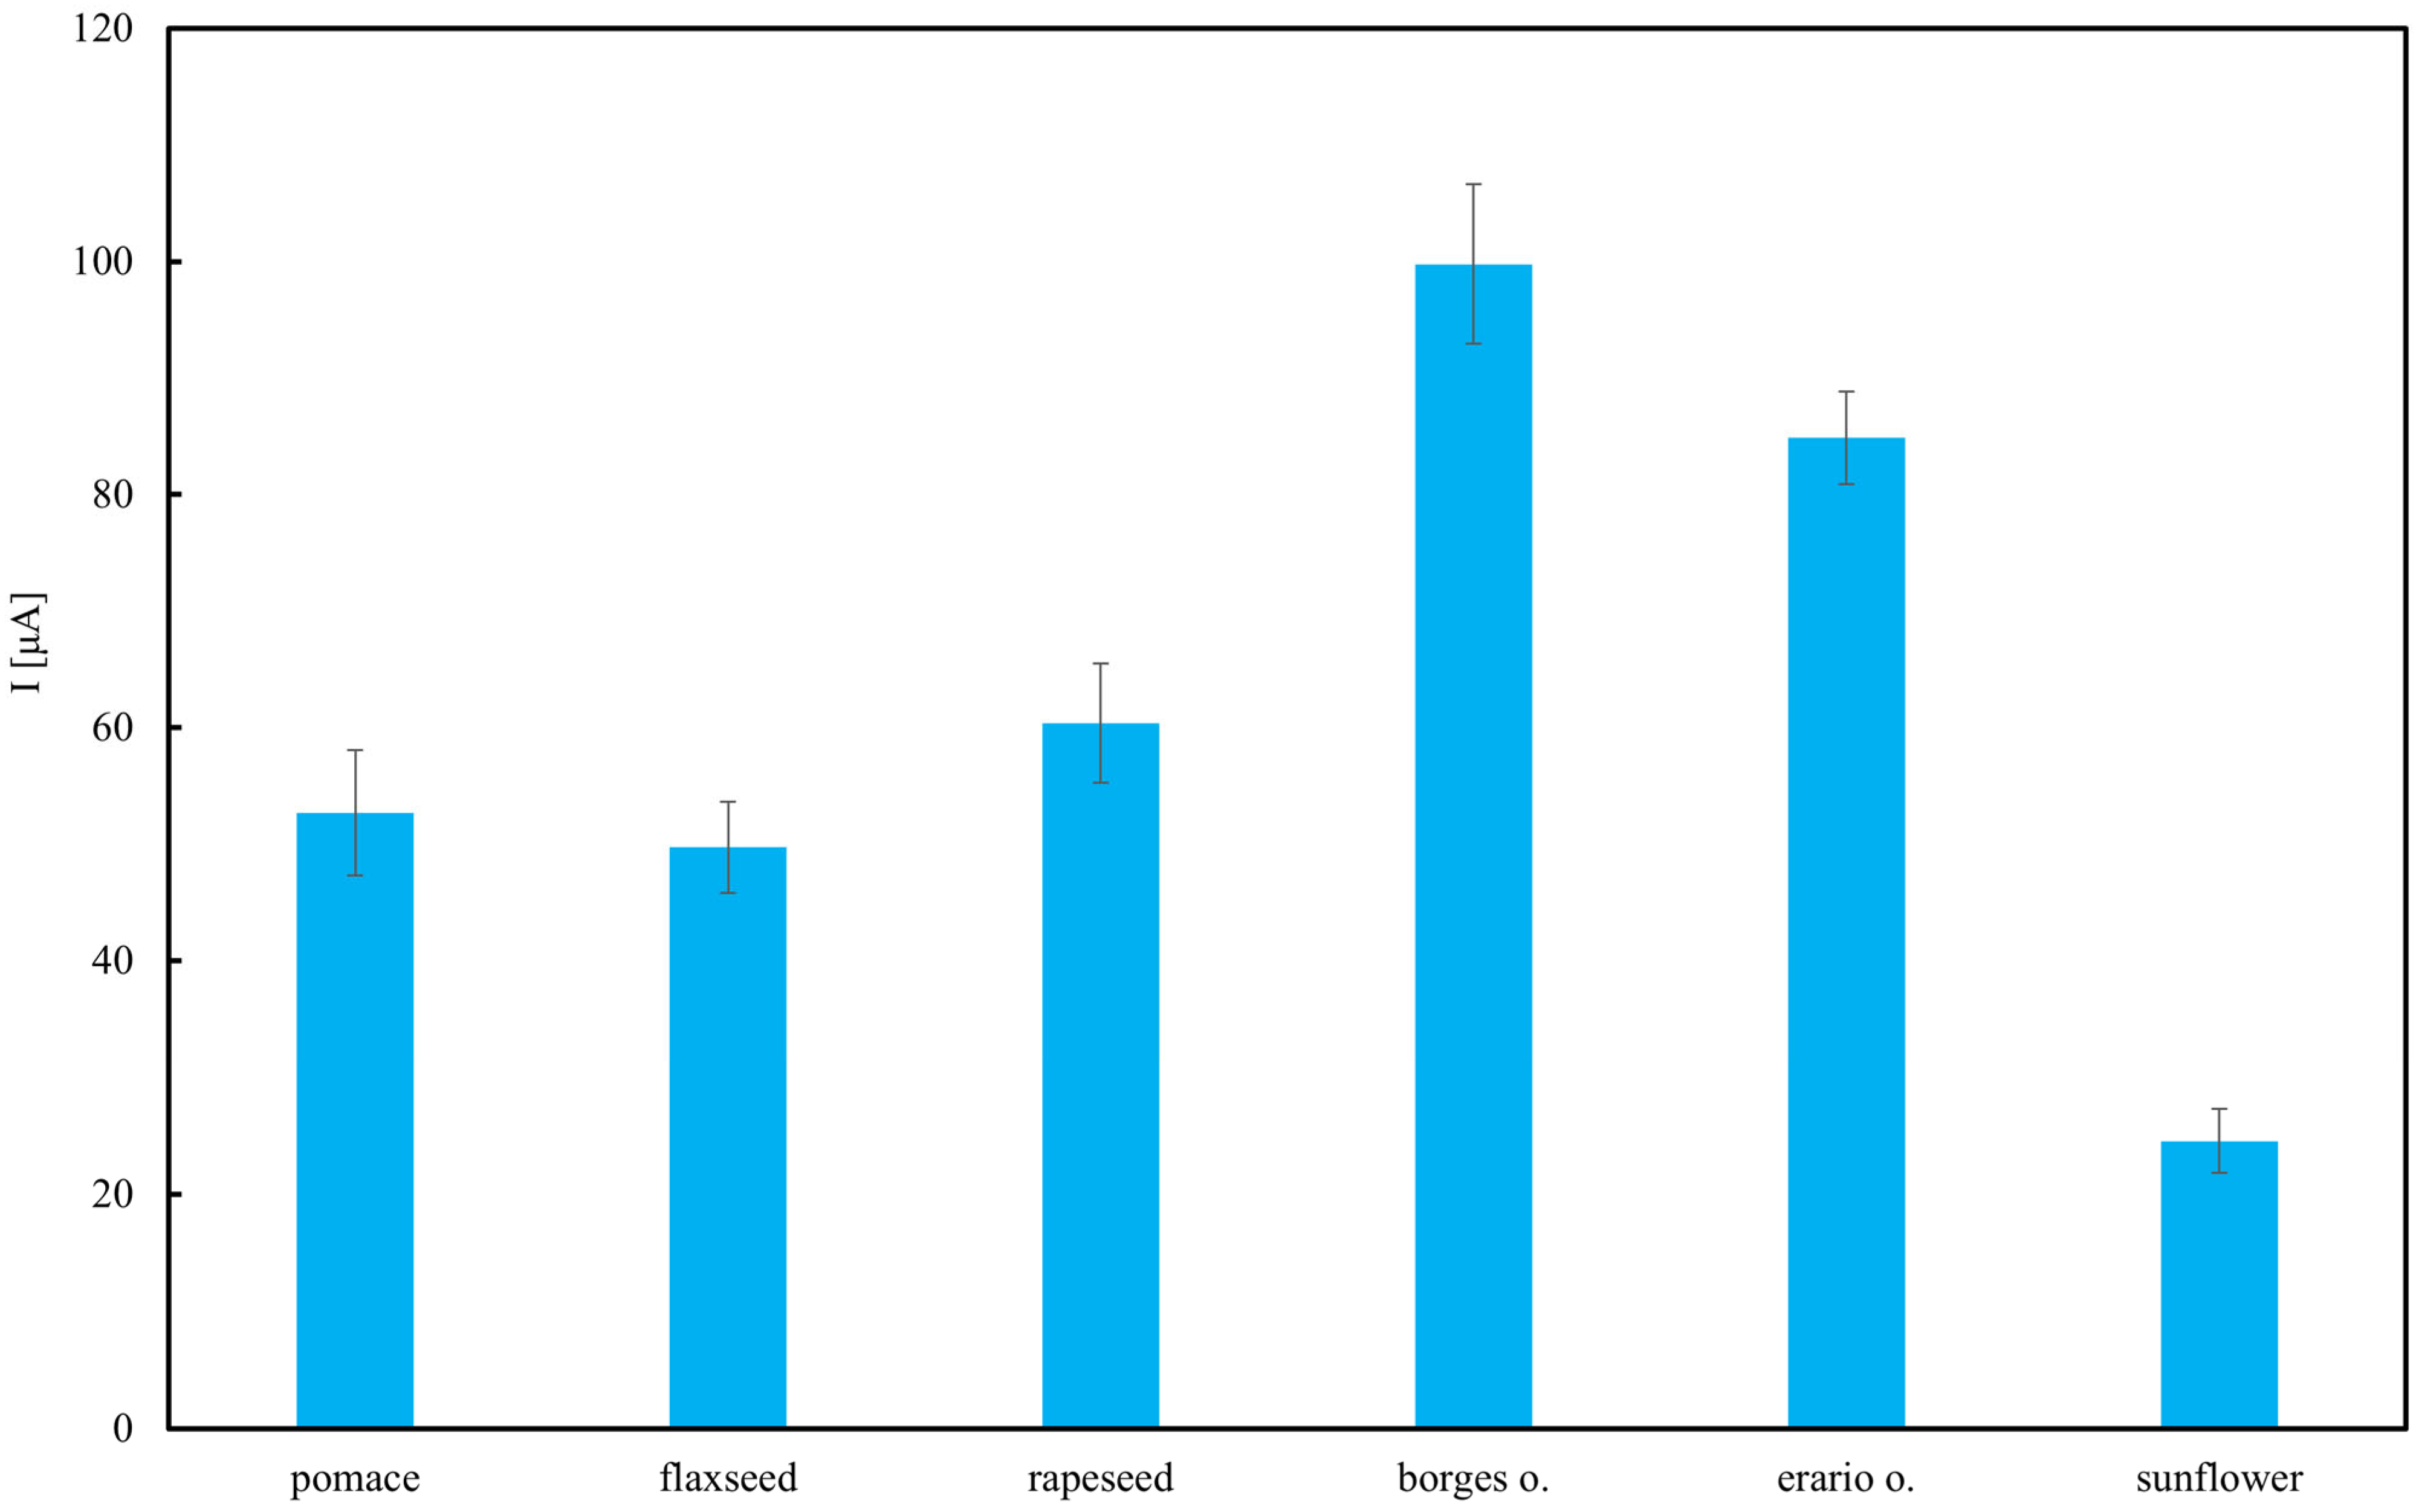
All determinations of TAP were performed in triplicate (n = 3). Results are presented as mean values ± standard deviation (SD).
For the HPLC–ED method, two-way ANOVA was applied with oil type (six levels) and fraction (total, tocopherols, others; three levels) as fixed factors, separately for 0.6 V and 0.8 V potentials. For spectrophotometric (DPPH, Folin–Ciocalteu) and electrochemical (CV) assays, one-way ANOVA was used to compare antioxidant activity across oil types. Significant effects were further explored using Tukey’s post hoc tests.
Assumptions of ANOVA were verified. Homogeneity of variance was assessed with Levene’s and Shapiro–Wilk tests; although deviations were detected in some cases, ANOVA was retained as the primary model due to its robustness to moderate violations in balanced designs.
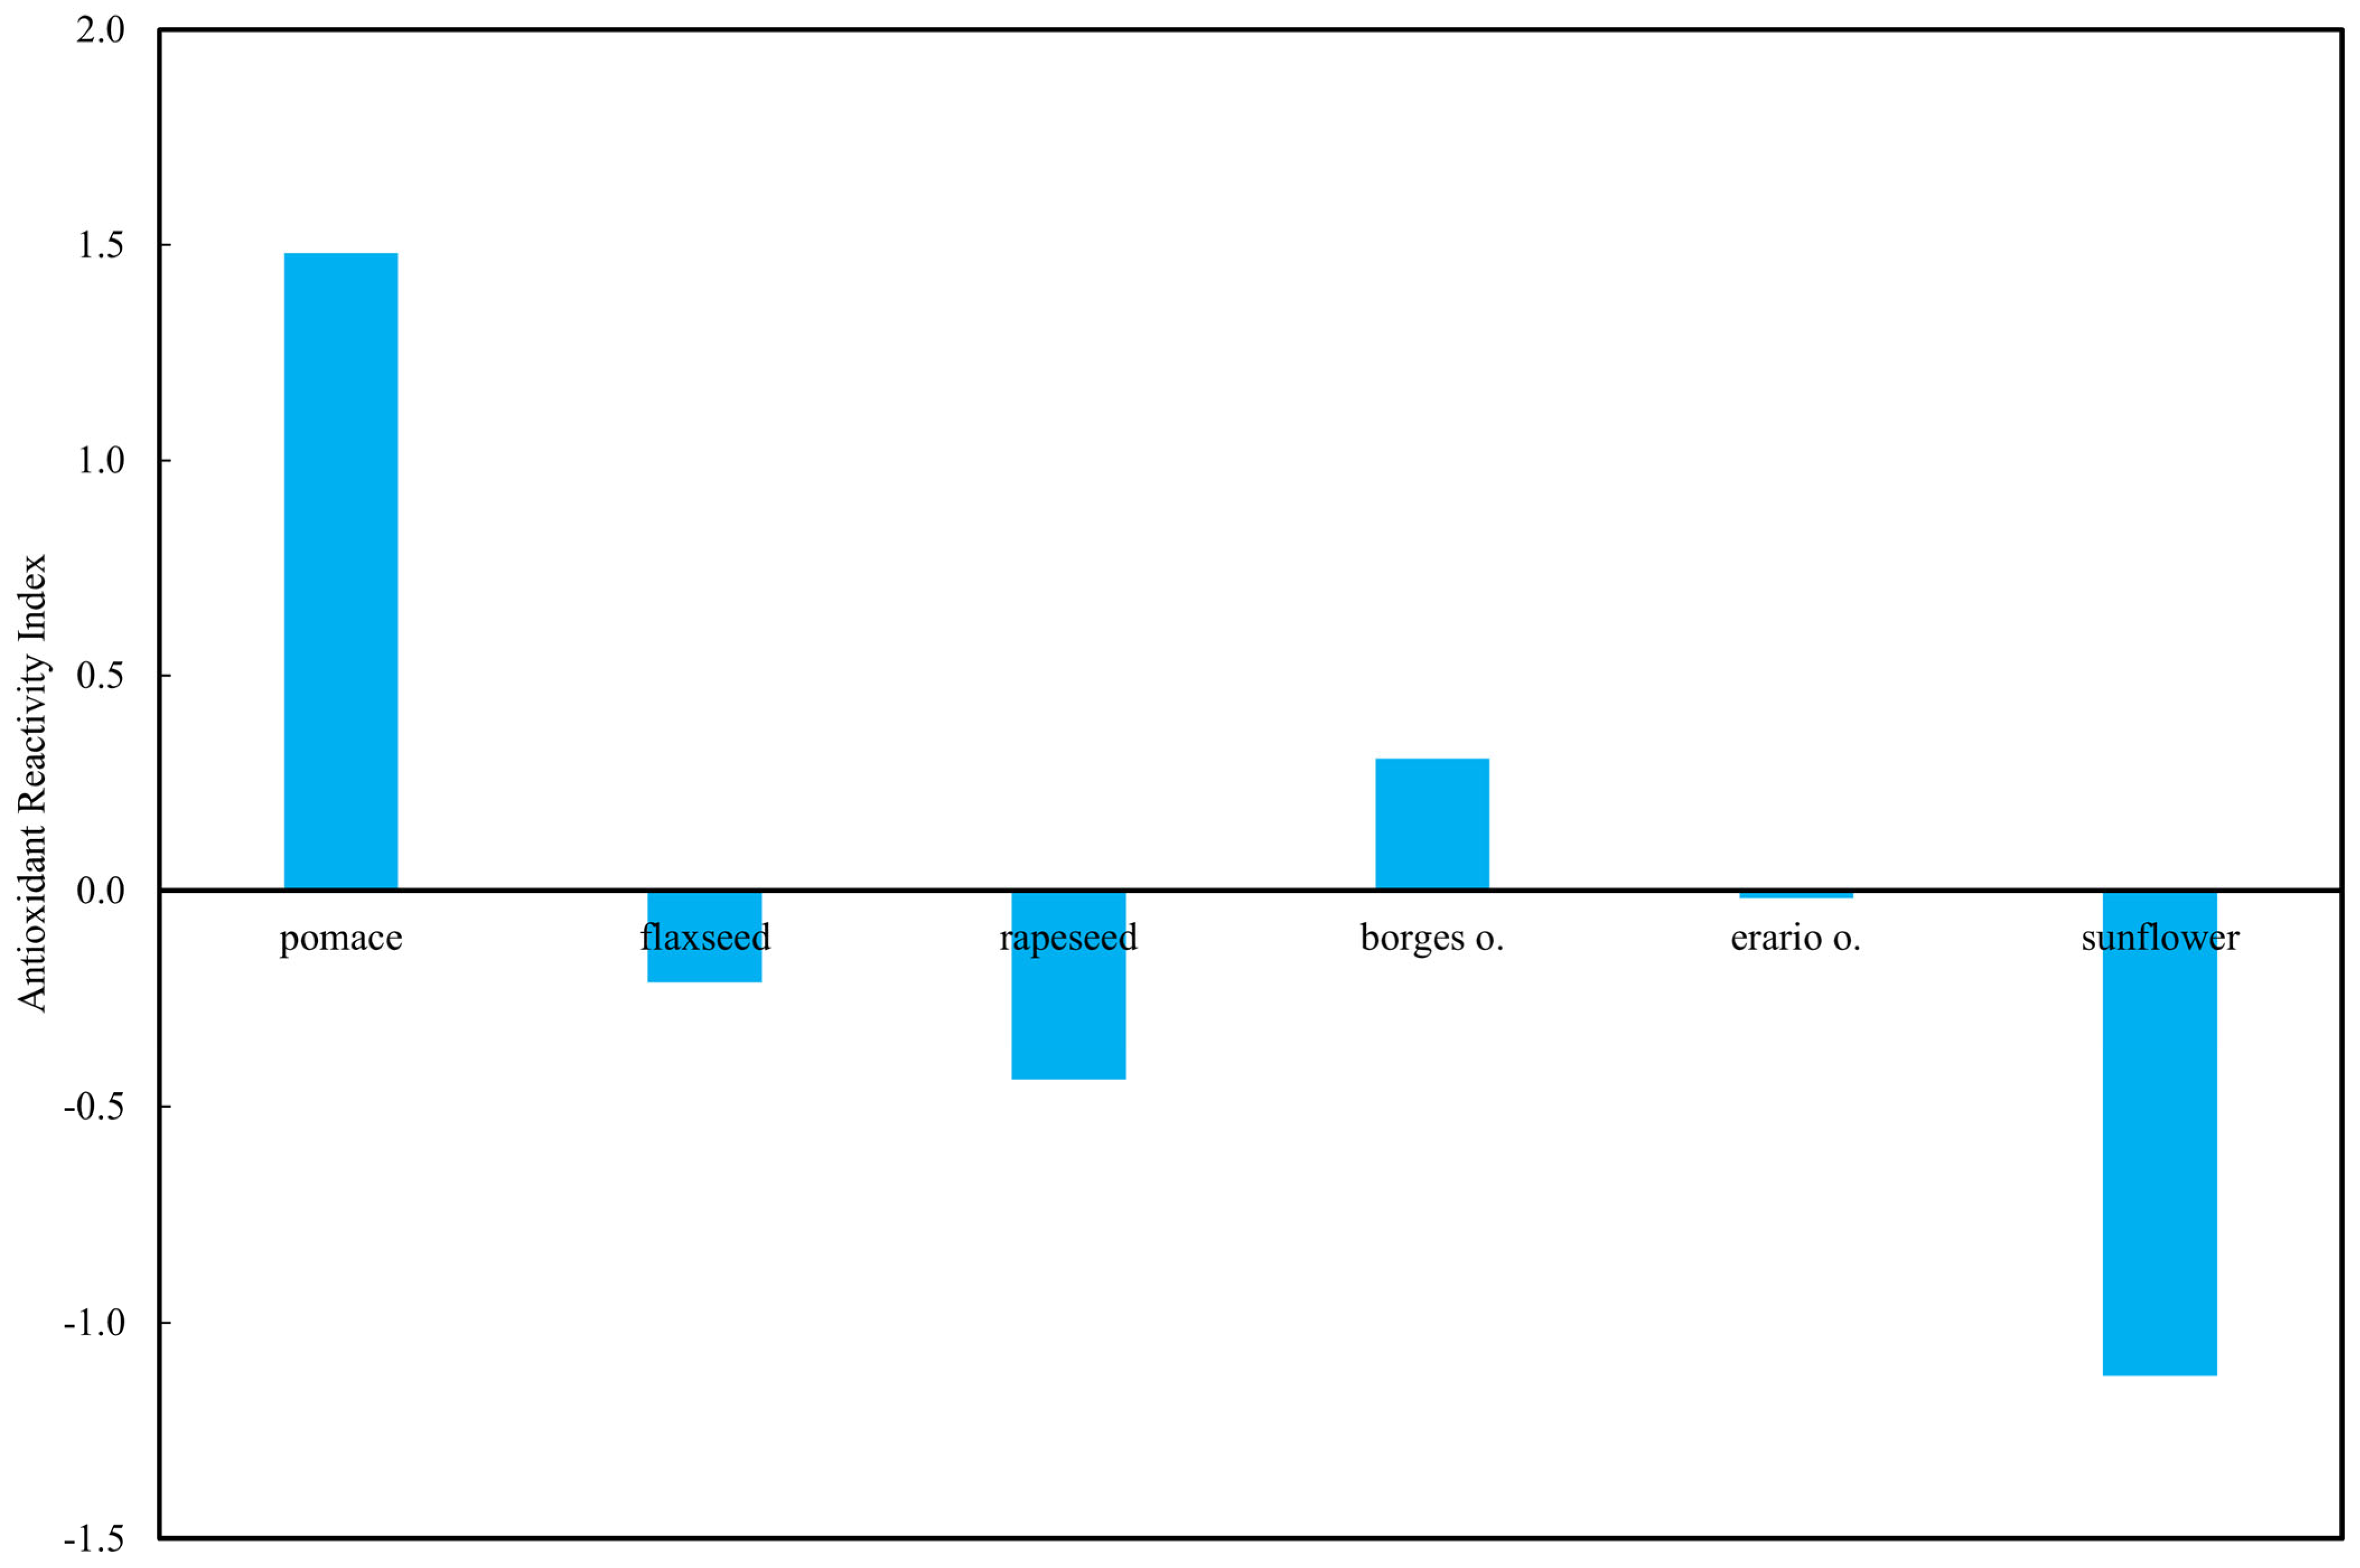
To enable cross-method comparison, raw TAP values obtained from all assays were standardized (z-scores), and an Antioxidant Reactivity Index (ARI) was calculated as the mean of standardized values for each oil. This integrated index reflects the relative antioxidant capacity independently of measurement scale.
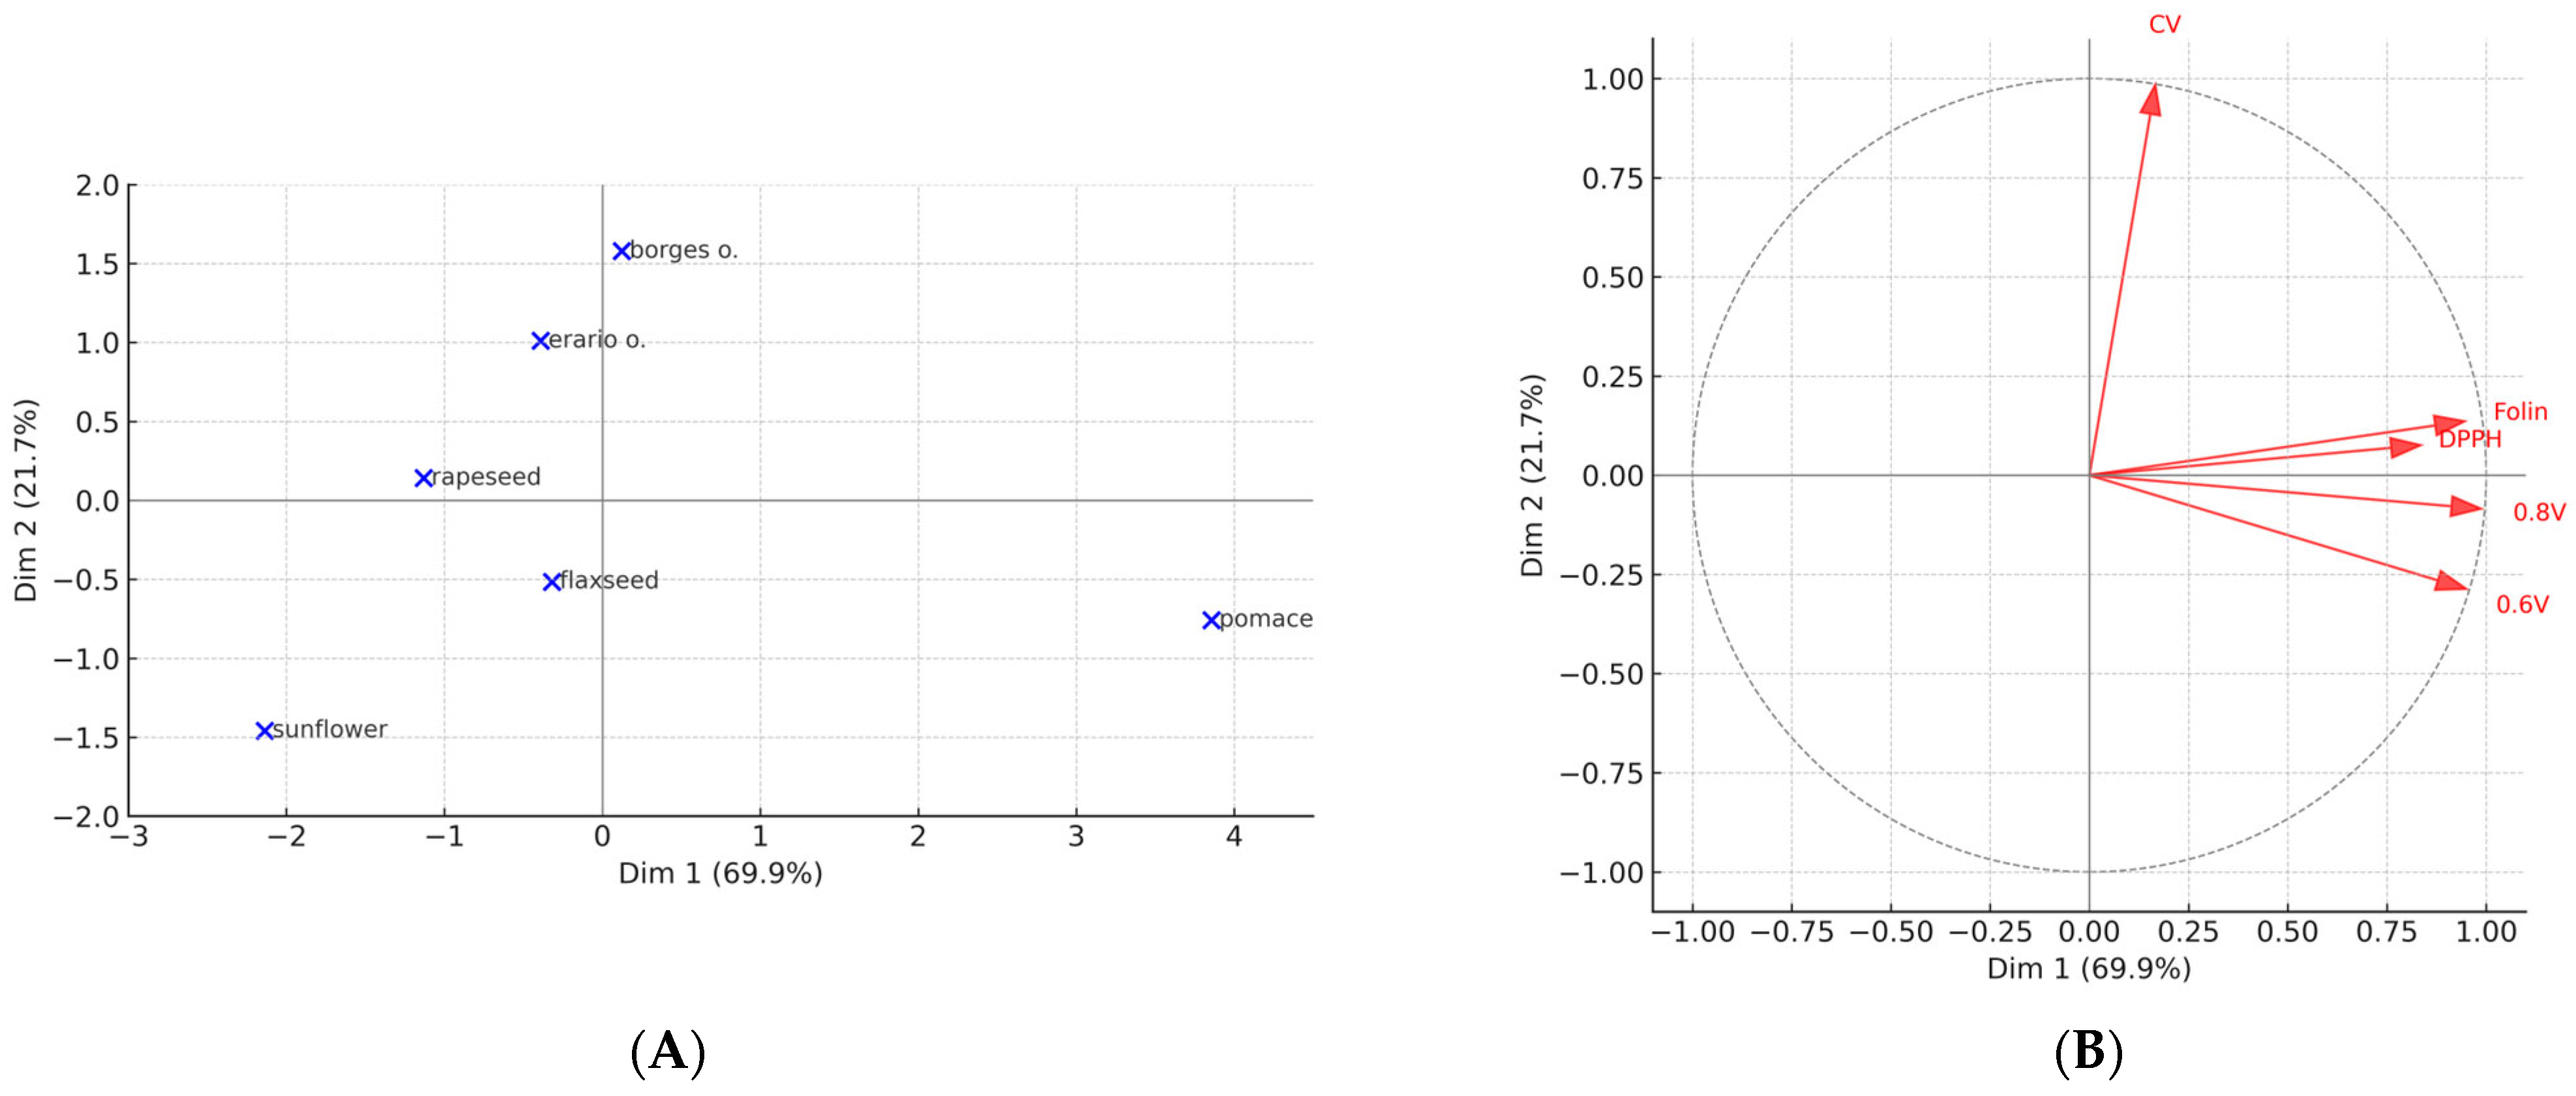
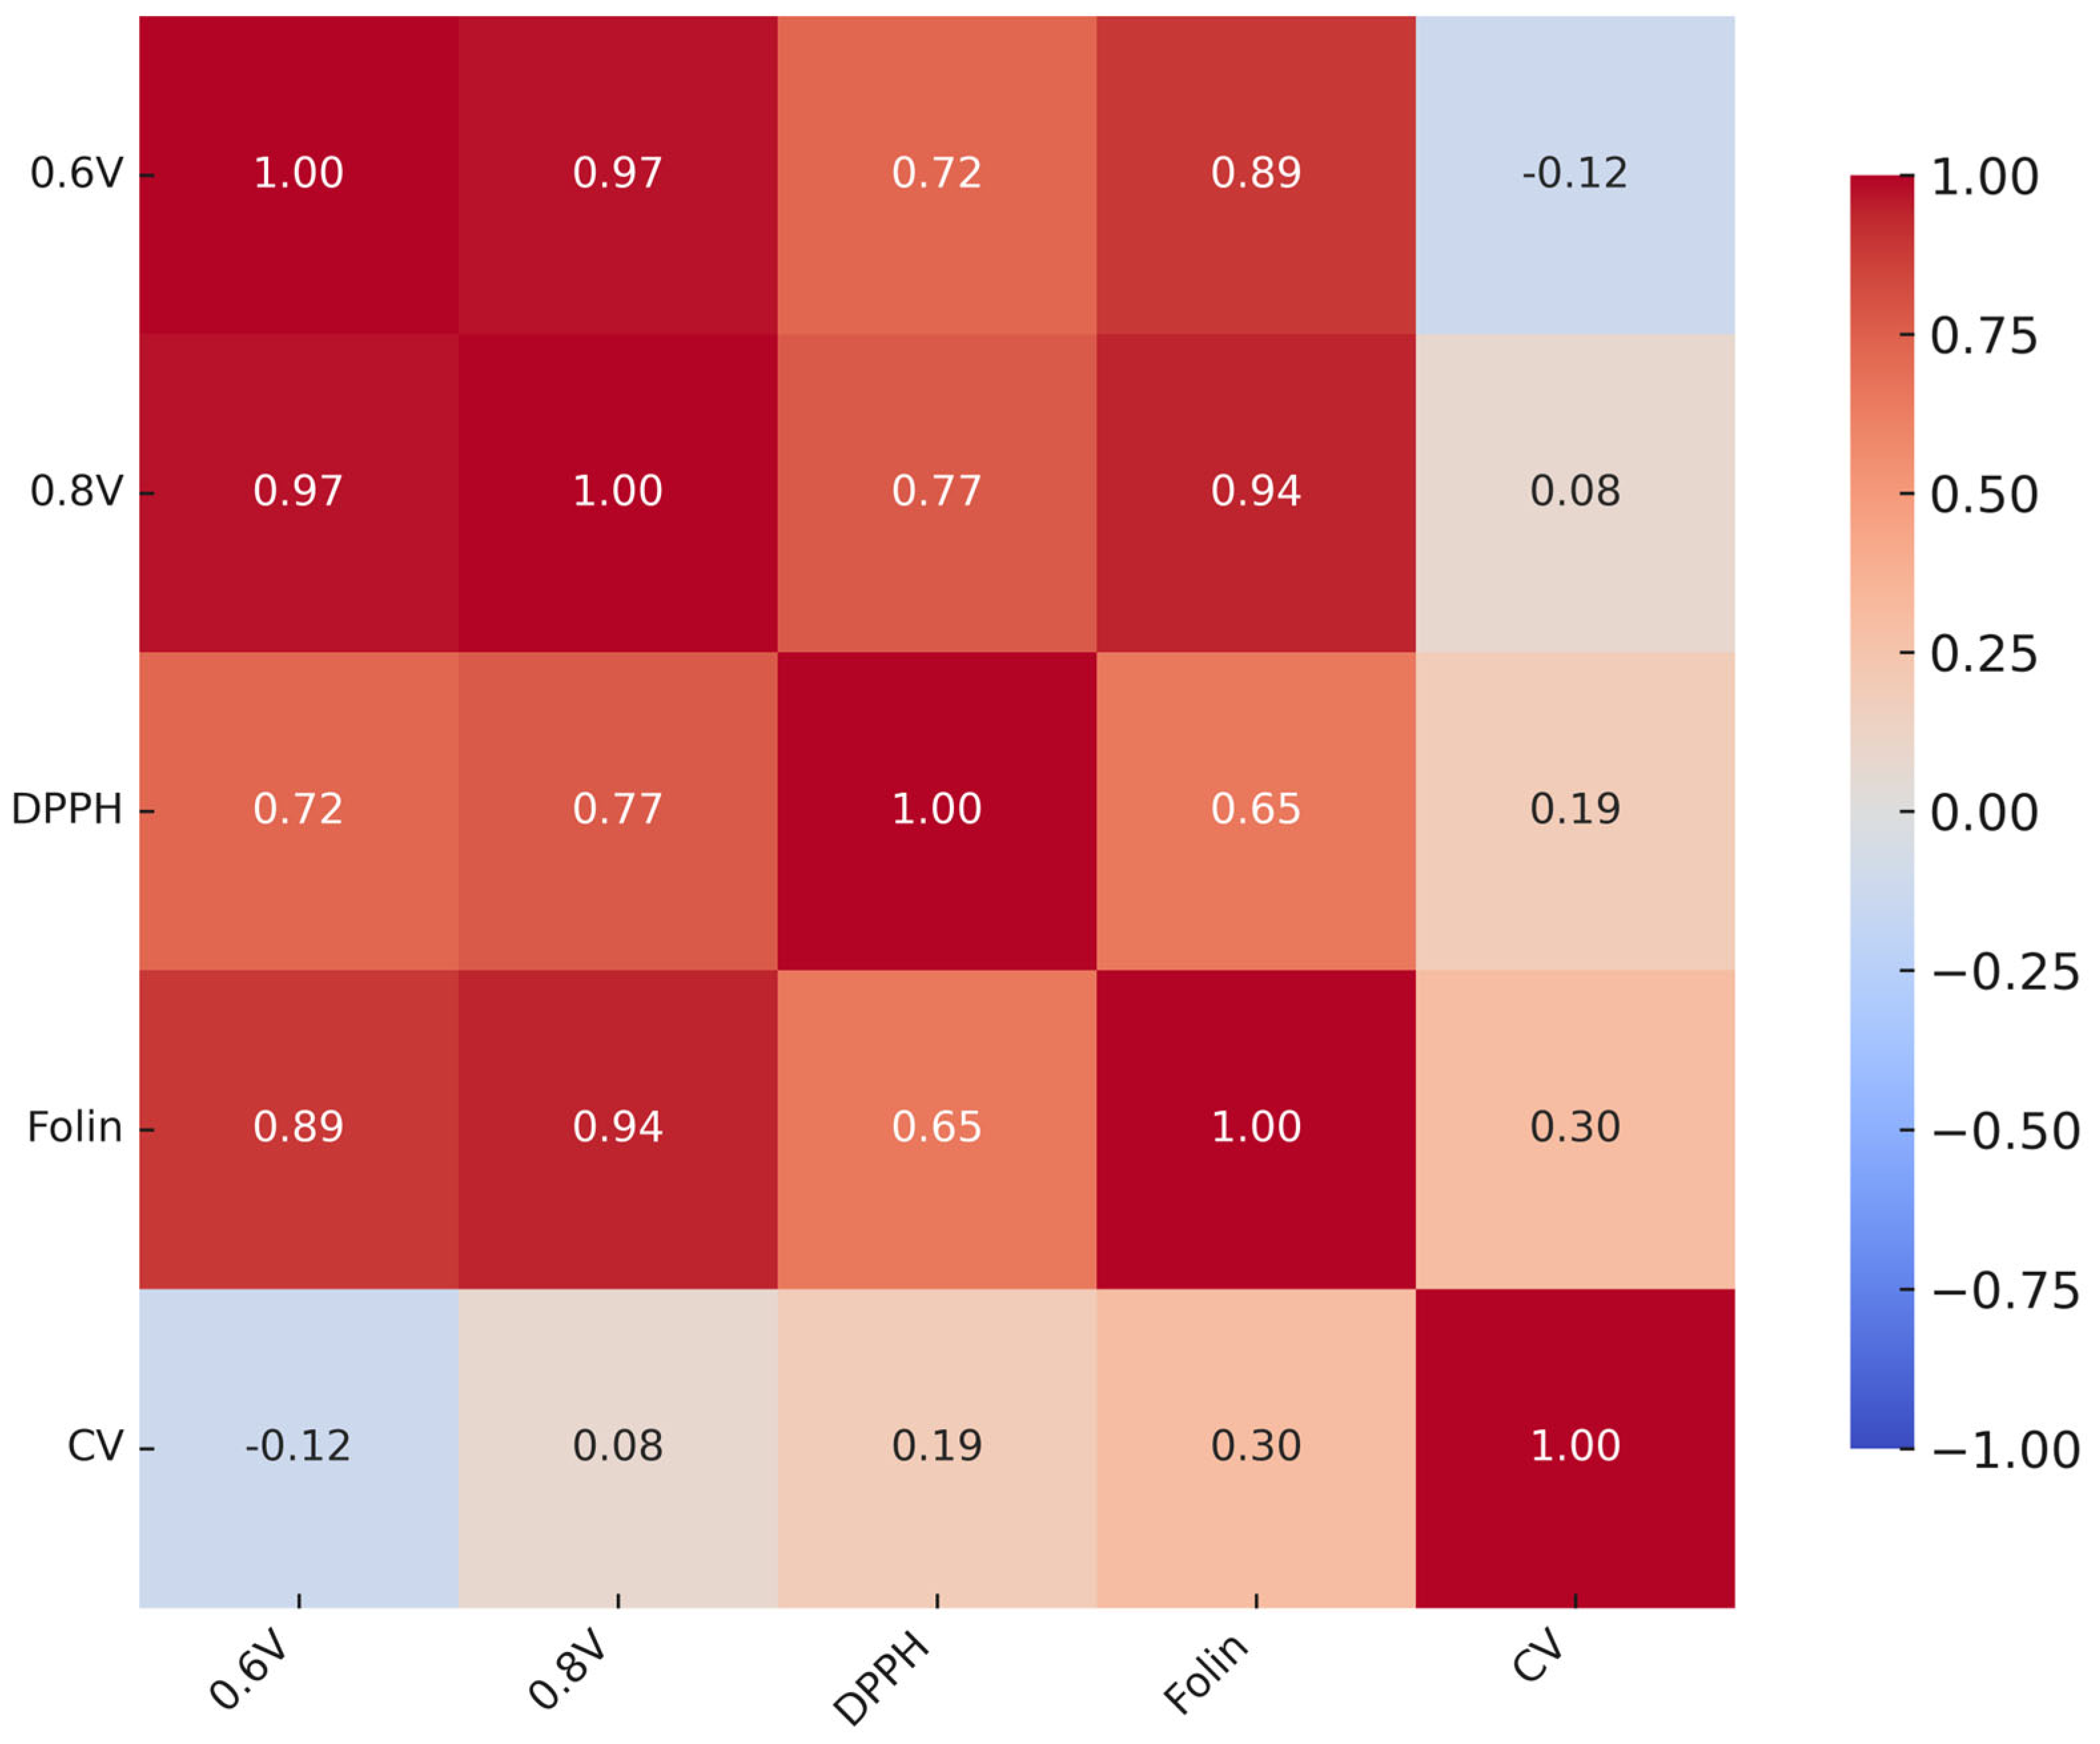
Relationships among methods were further examined using Pearson correlation coefficients. Principal component analysis (PCA) with varimax rotation was performed on standardized values to visualize similarities between assays and oil samples. The number of components was determined using eigenvalues > 1.
All analyses were carried out in Jamovi 2.6.26, with statistical significance set at p < 0.05, along with statistic-related graphic (biplot) generation.
