1. Introduction
Nectar, a sugar-rich product of flowering plants, serves as a crucial reward for pollinators, playing a pivotal role in plant reproduction and ecosystem dynamics. Its chemical composition is complex and highly variable, reflecting both the physiological state of the plant and the environmental conditions it experiences [
1]. Understanding this variability is paramount for ecological studies, agricultural practices, and the quality assessment of derived products such as honey. Nectar typically contains sugars, amino acids, proteins, fatty acids, salts, vitamin C, various secondary metabolites and water [
2]. The most common sugars in nectar are sucrose, glucose, and fructose, with average concentration ranging from approximately 10% to 70%
w/
w [
3]. However, the ratio of these sugars varies among different plant species. Amino acids in nectar are also important for pollinators. They provide essential nutrients that are not present in sugars alone. Some plant species have been found to have a higher concentration of certain amino acids in their nectar, which can make them more attractive to specific pollinators. Secondary metabolites in nectar can include alkaloids, flavonoids, and phenolic compounds. These can have various effects on pollinators, ranging from acting as attractants to serving as deterrents. Nectar volumes can range from less than a microlitre in many bee flowers to several millilitres in flowers pollinated by birds or bats.
A broad spectrum of analytical methods has been employed to study nectar chemistry, including its properties and pollutants. Chromatographic techniques are among the most established. Thin-layer chromatography (TLC) has been applied for analyzing sugar standards and nectar samples, with densitometry enabling quantitative determination of carbohydrates [
4]. High-performance liquid chromatography (HPLC) remains a traditional method for quantifying sugars and other analytes, although it requires extensive sample preparation and costly instrumentation [
5,
6]. Gas chromatography coupled with mass spectrometry (GC-MS) has been widely used for detecting pesticides and plasticizers (e.g., bisphenol A) in nectar [
2,
7], often following extraction and preconcentration by techniques such as QuEChERS (quick, easy, cheap, effective, rugged, and safe), magnetic solid phase extraction (MSPE) preconcentration, or dispersive liquid–liquid microextraction (DLLME) [
8,
9]. More advanced approaches such as liquid chromatography–mass spectrometry (LC-MS), tandem LC-MS/MS, and high-resolution Orbitrap LC-MS/MS allow highly sensitive and selective detection of neonicotinoid pesticides, their metabolites, and veterinary drug residues, especially when combined with solid-phase extraction (SPE) or related sample-preparation procedures [
10].
Elemental analysis methods also provide important information. Flame atomic absorption and emission spectrometry (FAAS/FAES) have been applied to determine elemental content in honey and nectar [
1,
11,
12]. Inductively coupled plasma mass spectrometry (ICP-MS) and optical emission spectrometry (ICP-OES) enable sensitive quantification of trace and heavy metals, typically following sample digestion (dry ashing, wet ashing with open or closed vessels, often microwave-assisted) or direct dissolution in water [
1,
2].
Other classical physicochemical methods remain relevant. Refractometry provides estimates of water content and total soluble solids based on refractive index [
4]. Titrimetric assays are applied to measure total titratable acidity and ascorbic acid content [
13]. The Lane–Eynon method, though nonspecific, quantifies total sugars [
6,
13]. Spectrophotometric assays detect compounds such as hydroxymethylfurfural (HMF), an indicator of heating or aging, while ash content and electrical conductivity measurements are used to further characterize nectar and honey [
4].
Biological and immunological methods also contribute to nectar and honey analysis [
6]. Microbiological techniques detect antibiotics such as tetracyclines, while immunoassays and receptor-based tests (e.g., ELISA) allow rapid screening of antibiotic residues in bee products. Imaging and radiological diagnostics have also been applied: diagnostic radioentomology using CT scanning provides non-destructive measurement of density differences within hives, enabling visualization of storage patterns and monitoring of artificial and natural diets.
While these methods yield valuable insights, they are often costly, time-consuming, or require extensive sample preparation or involve sample destruction. Importantly, they are not always suited for rapid discrimination of nectar samples by geographical or botanical origin, which is increasingly relevant for ecological research, authentication of bee products, and protection against adulteration. For this reason, vibrational spectroscopy (FTIR, Raman, NIR), especially when combined with chemometric tools, has gained prominence as a complementary approach, offering a powerful, non-invasive, and rapid means of characterizing the complex chemical fingerprints of biological matrices such as nectar, while enabling authentication of origin, detection of adulteration, and quality control of food products including honeys and fruit-based nectars [
13,
14,
15,
16,
17,
18,
19,
20,
21,
22,
23,
24,
25,
26]. This method leverages the interaction of IR light with molecular vibrations, providing a rich spectrum of information about various components, including carbohydrates, water, organic acids, and other secondary metabolites [
27,
28].
Fourier-transform infrared spectroscopy (FTIR) coupled with partial least squares regression (PLSR) has been widely applied to quantify major sugars such as glucose, fructose, and sucrose with high accuracy (R
2 = 0.97–0.99) and to determine biomarkers such as dihydroxyacetone (DHA), the precursor of antibacterial methylglyoxal in
Leptospermum nectar [
4,
5]. FTIR, often in combination with chemometric tools such as PCA, HCA, and PLS-DA, has also been used to classify honeys of different botanical and geographical origins, including Anatolian, Corsican, German, Lebanese and others [
18], and to detect adulteration with sugar syrups. More recent approaches have employed advanced multivariate methods such as Common Component Analysis (CCA) to capture subtle regional differences, for example, in Lebanese honeys, while models based on MIR spectra have consistently highlighted the diagnostic importance of the carbohydrate fingerprint region (1150–950 cm
−1 and 950–750 cm
−1).
Previous studies have shown that infrared spectral fingerprints capture location- and plant-specific differences, particularly in carbohydrate and C–H stretching regions, enabling effective discrimination of nectar and honey according to origin [
4,
16,
27]. Infrared spectroscopy has therefore become an increasingly important analytical tool in food science, as it is rapid, non-destructive, reagent-free, and can be seamlessly combined with chemometrics. In particular, near-infrared spectroscopy (NIR, 12500–4000 cm
−1) provides information from overtone and combination bands of C–H, N–H, and O–H vibrations, making it especially effective for on-line and at-line monitoring. Therefore, it supports the development of portable, field-deployable devices. Mid-infrared (MIR), typically acquired with Fourier-transform infrared spectroscopy (FTIR), records fundamental vibrations and thus yields highly specific fingerprints of complex food matrices such as nectar and honey. MIR spectra are dominated by strong O–H stretching of water near 3300 cm
−1, H–O–H bending at ~1640 cm
−1, carbohydrate-associated C–H stretching around 2935–2885 cm
−1, and the fingerprint region from 1500 to 650 cm
−1, which includes C–O, C–C, and C–H vibrations [
4,
16]. The 1150–950 cm
−1 zone is especially diagnostic for carbohydrates, while the anomeric region between 950 and 750 cm
−1 is highly sensitive for distinguishing floral origins.
Complementary vibrational techniques further extend the analytical potential. Raman spectroscopy, including FT-Raman and surface-enhanced Raman spectroscopy (SERS), provides additional molecular information based on polarizability changes, with minimal interference from water [
28]. These methods have been applied for carbohydrate profiling as well as for ultra-sensitive detection of pesticides and antibiotics in honey and nectar [
29]. Near-infrared spectroscopy (NIR) has also proven effective for rapid, non-destructive assessment of fruit-based nectars and beverages, enabling robust estimation of °Brix, acidity, and vitamin C content, and supporting classification and adulteration detection through methods such as PLS-DA and SVM [
14,
30]. Taken together, vibrational spectroscopy and chemometrics provide a versatile toolkit for characterizing nectar and honey, offering accurate quantification of key constituents, authentication of origin, detection of adulteration, and comprehensive chemical fingerprinting that complements traditional chromatographic and elemental techniques.
Overall, these findings demonstrate that vibrational spectroscopy—FTIR, NIR, and Raman—when coupled with chemometrics, is a versatile, non-invasive, and highly informative analytical platform. It can quantify key quality parameters, authenticate origin, detect adulteration, and characterize both nectar and honey across a broad range of floral and geographical sources, complementing but also reducing reliance on slower and more expensive chromatographic or elemental methods.
In our work, we applied FTIR spectroscopy to differentiate E. vulgare and H. helix nectars collected at different locations within Warsaw, Poland. We performed PCA to probe the landscape of variability coming from different experimental sources. We discuss the influence of the solvent used during the nectar collection on the quality of spectra as well as the differences in the IR spectra of nectar and the flower containing this nectar.
2. Results and Discussion
2.1. Echium vulgare Nectar
To characterize location-dependent chemical signatures of floral nectars, we analyzed
E. vulgare samples collected within the Warsaw area. This species was selected as a model because of its wide local distribution and relatively high nectar yield, which facilitated the acquisition of sufficient material for reproducible measurements. Infrared spectra of ten nectar samples representing 7 regions of Warsaw city were measured, preprocessed and evaluated. One of the locations was represented by duplicate samples, one by triplicate samples, while the remaining four locations were represented by a single sample each. The locations are shown in the map in
Figure S1 in Supplementary Materials.
Mean ATR-FTIR spectra (±SD) revealed consistent envelopes across all sites with location-specific intensity differences in two windows: C–H stretching (2750–3000 cm
−1) and the carbohydrate fingerprint (≈1200–950 cm
−1). Narrow SD bands within sites indicated good intra-location reproducibility, while between-site contrasts were most apparent near ~1100–1000 cm
−1 and in CH stretches near ~2930–2885 cm
−1. The most important bands appearing in ATR-FTIR spectra of carbohydrates are listed in
Table 1.
In particular, we focused on vibrational modes diagnostic for carbohydrates, which constitute the dominant constituents of nectar and honey. The C–H stretching region (3050–2800 cm
−1) includes symmetric and asymmetric stretching vibrations of CH, CH
2, and CH
3 groups, with the most intense features typically between 2935 and 2885 cm
−1, directly reflecting the saccharide backbone [
31]. The carbohydrate fingerprint region (1200–950 cm
−1) is dominated by C–O and C–C stretching modes of mono- and disaccharides. Within this range, sucrose exhibits distinctive doublets near ~1150–1050 cm
−1, while glucose and fructose a single peak at around 1025 and 1053 cm
−1, respectively (see
Figure S2 in Supplementary Materials). The anomeric region (950–750 cm
−1) is especially sensitive to glycosidic linkages and stereochemistry, with bands near 890 cm
−1 and 776 cm
−1 often used to distinguish specific carbohydrate conformations. Additional contributions from the O–H stretching band (~3300 cm
−1) and the H–O–H bending mode of water (~1640 cm
−1) are also observed in nectar spectra but can overlap with signals from organic acids and proteins. These diagnostic regions have been widely reported in the FTIR and Raman literature as the most informative for carbohydrate-rich matrices, including honeys and nectars [
4,
5,
13,
14].
All preprocessing steps followed a consistent pipeline. First, the spectra were restricted to the spectroscopically relevant regions of 800–1500 cm−1 (fingerprint region) and 2750–3000 cm−1 (C–H stretching region). An exception was made for Savitzky–Golay smoothing and derivative filters, which, when applied, were computed on the full spectra prior to range selection. After range restriction, baseline correction and normalization procedures (Standard Normal Variate, Multiplicative Scatter Correction, MinMax scaling, or Z-score scaling) were applied as specified for each variant.
Eight preprocessing strategies were tested, including raw spectra (no transformation), Savitzky–Golay smoothing and derivatives, baseline correction, normalization techniques, and their combinations (all variants are listed in
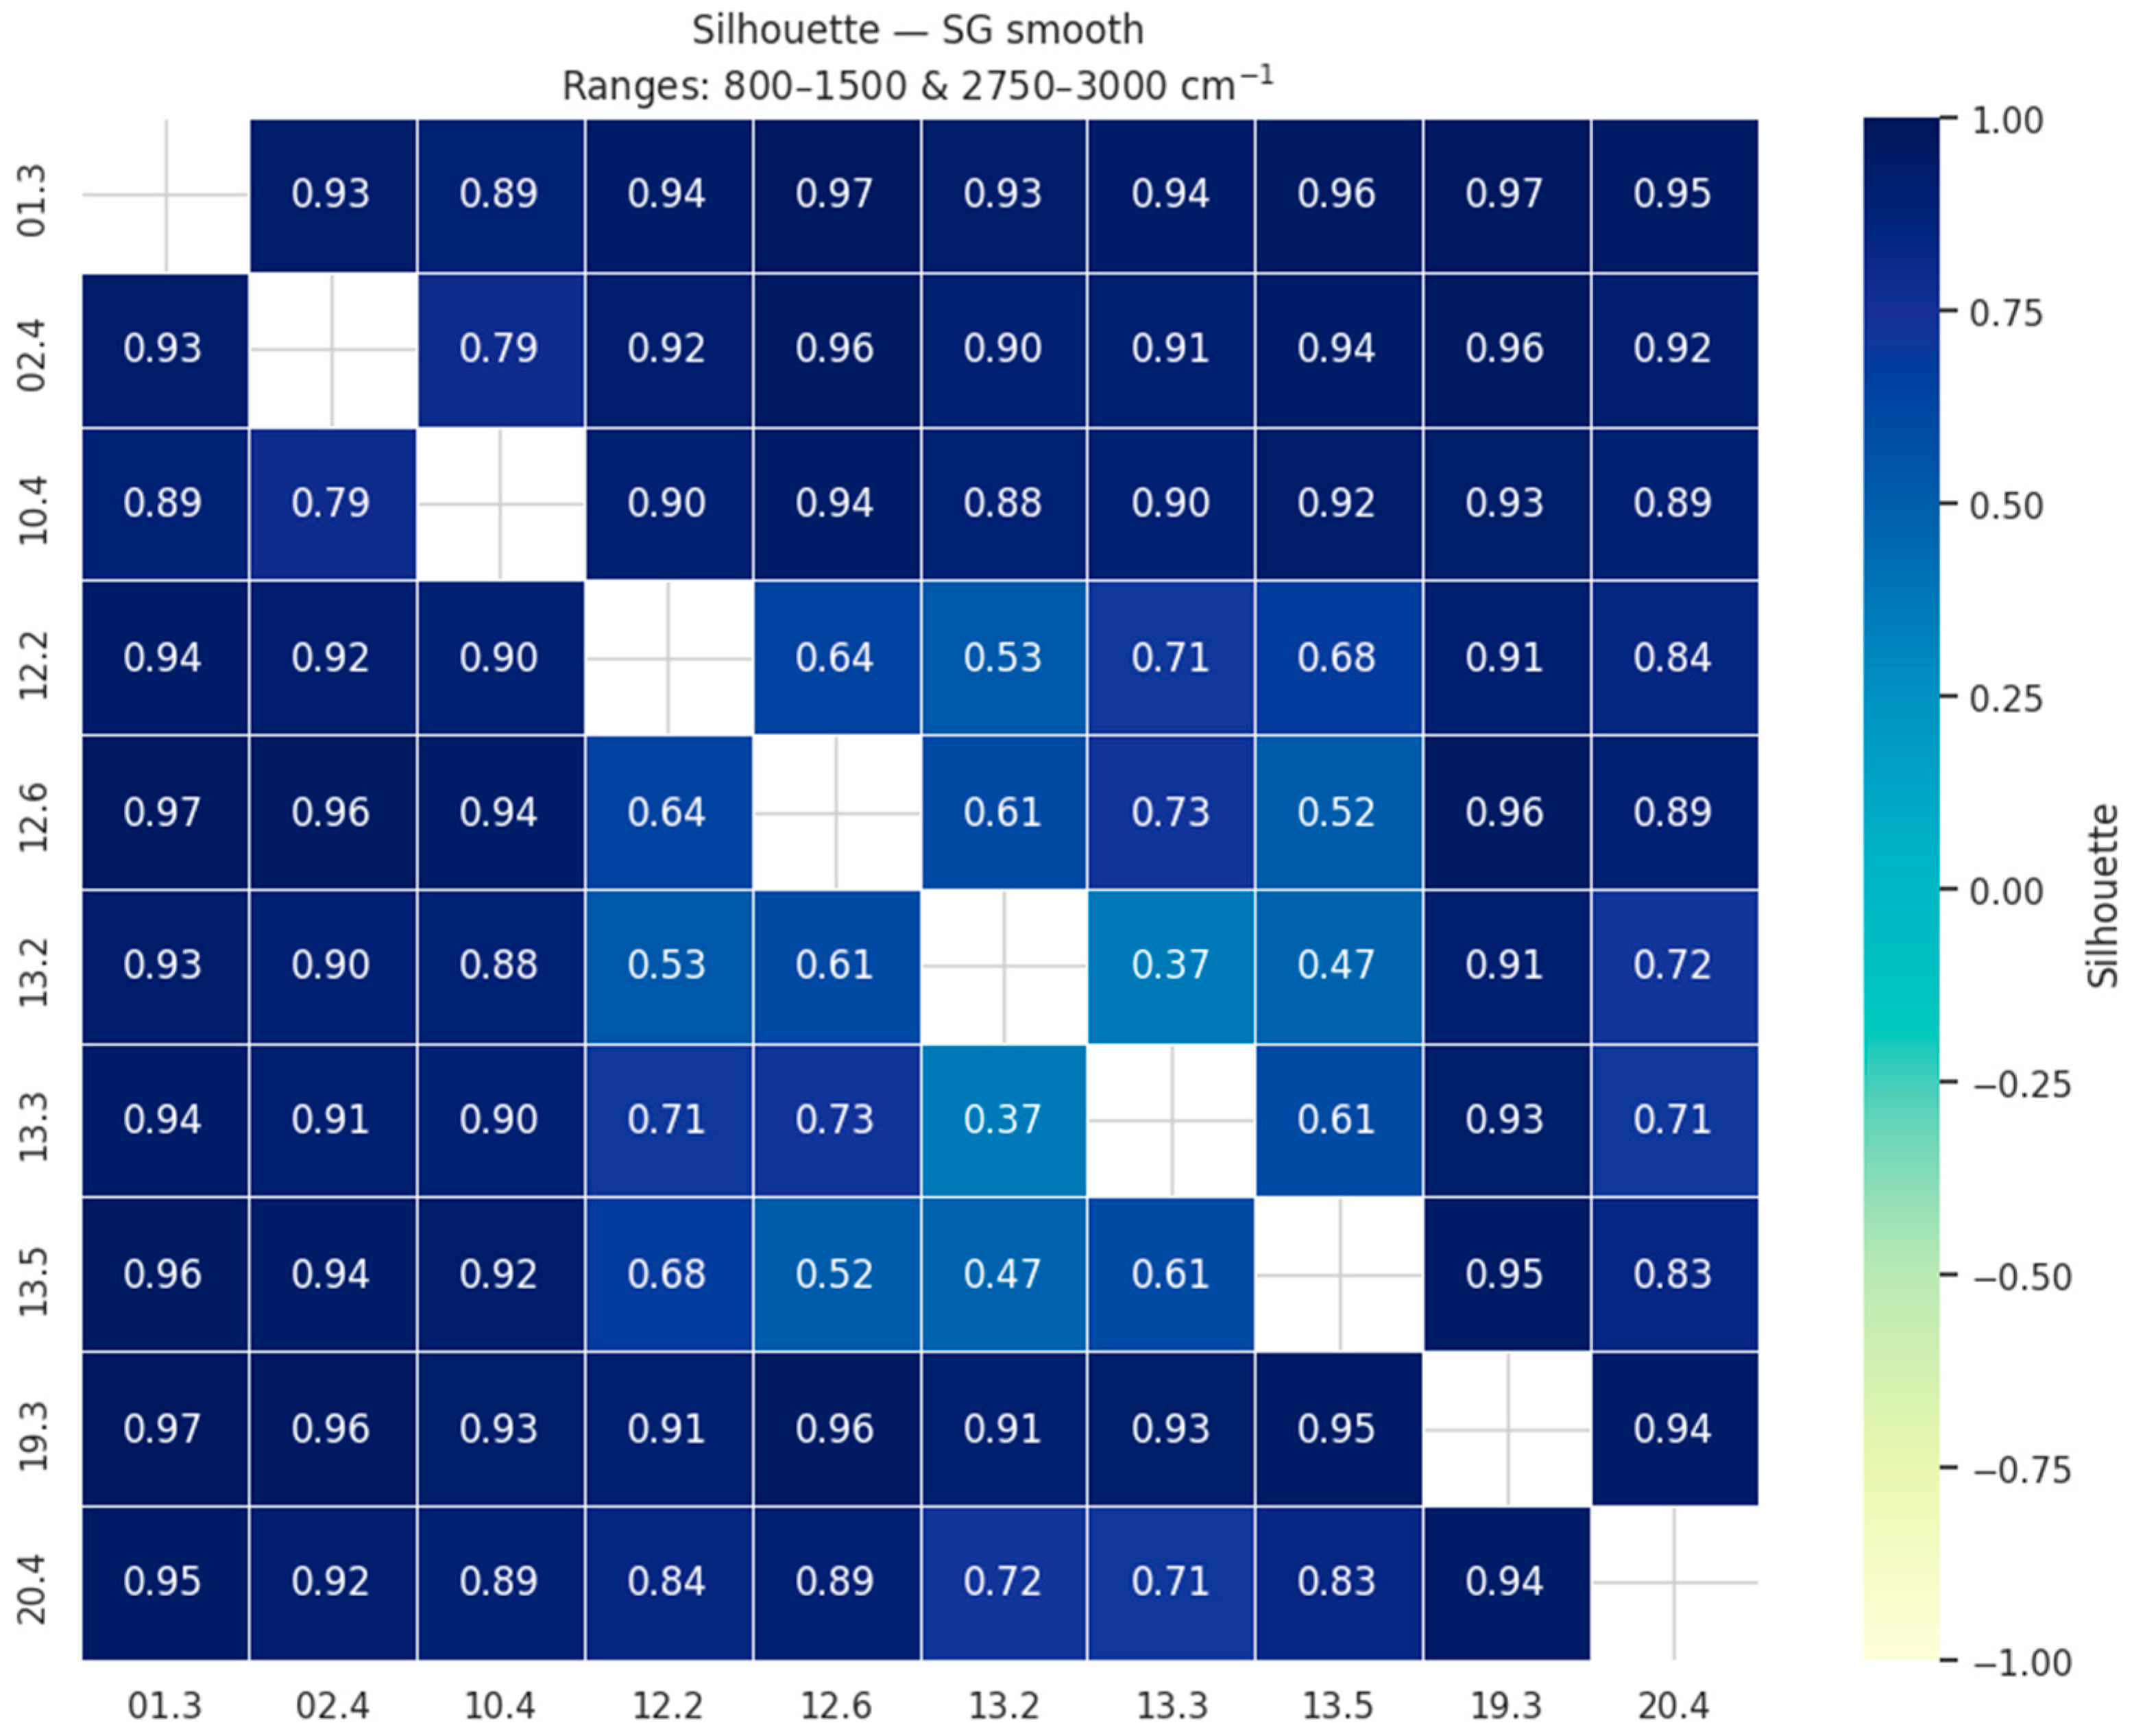
Table S2 in Supplementary Materials). Their effectiveness was evaluated using pairwise silhouette scores, which quantify the clustering quality between nectar samples from different collection sites. The silhouette coefficient ranges from −1 to +1: values close to +1 indicate that samples are well assigned to their own group and clearly separated from other groups, values around 0 reflect borderline or overlapping clusters, while negative values suggest potential misclassification.
To visualize these results, we constructed heatmaps of pairwise silhouette values (
Figure 1). In these matrices, both axes correspond to the sample locations, and each cell reports the average silhouette coefficient for the comparison of the two respective sites. High values (dark blue) indicate that the two locations form compact and well-separated clusters, whereas lighter colors mark weaker separation. The matrix is symmetric, but the full square is shown for clarity. This representation allows one to assess not only the overall clustering quality of each preprocessing strategy but also which specific site pairs are more easily discriminated.
The evaluation showed that the highest clustering quality was obtained for simple approaches, with Savitzky–Golay smoothing (mean silhouette = 0.84) and raw spectra without preprocessing (0.84) ranking at the top, closely followed by Savitzky–Golay smoothing combined with baseline correction and SNV normalization (0.83). Other methods, including baseline correction alone or in combination with MSC, MinMax, or Z-score scaling, yielded slightly lower but still comparable results (≈0.82). More complex preprocessing, particularly the use of Savitzky–Golay derivatives, resulted in markedly lower clustering quality (silhouette < 0.8, and as low as 0.47 for the second derivative). These results indicate that extensive preprocessing is not required for this dataset, and that simple smoothing or even the use of raw restricted spectra is sufficient to achieve clear and robust clustering and separation of samples according to their origin.
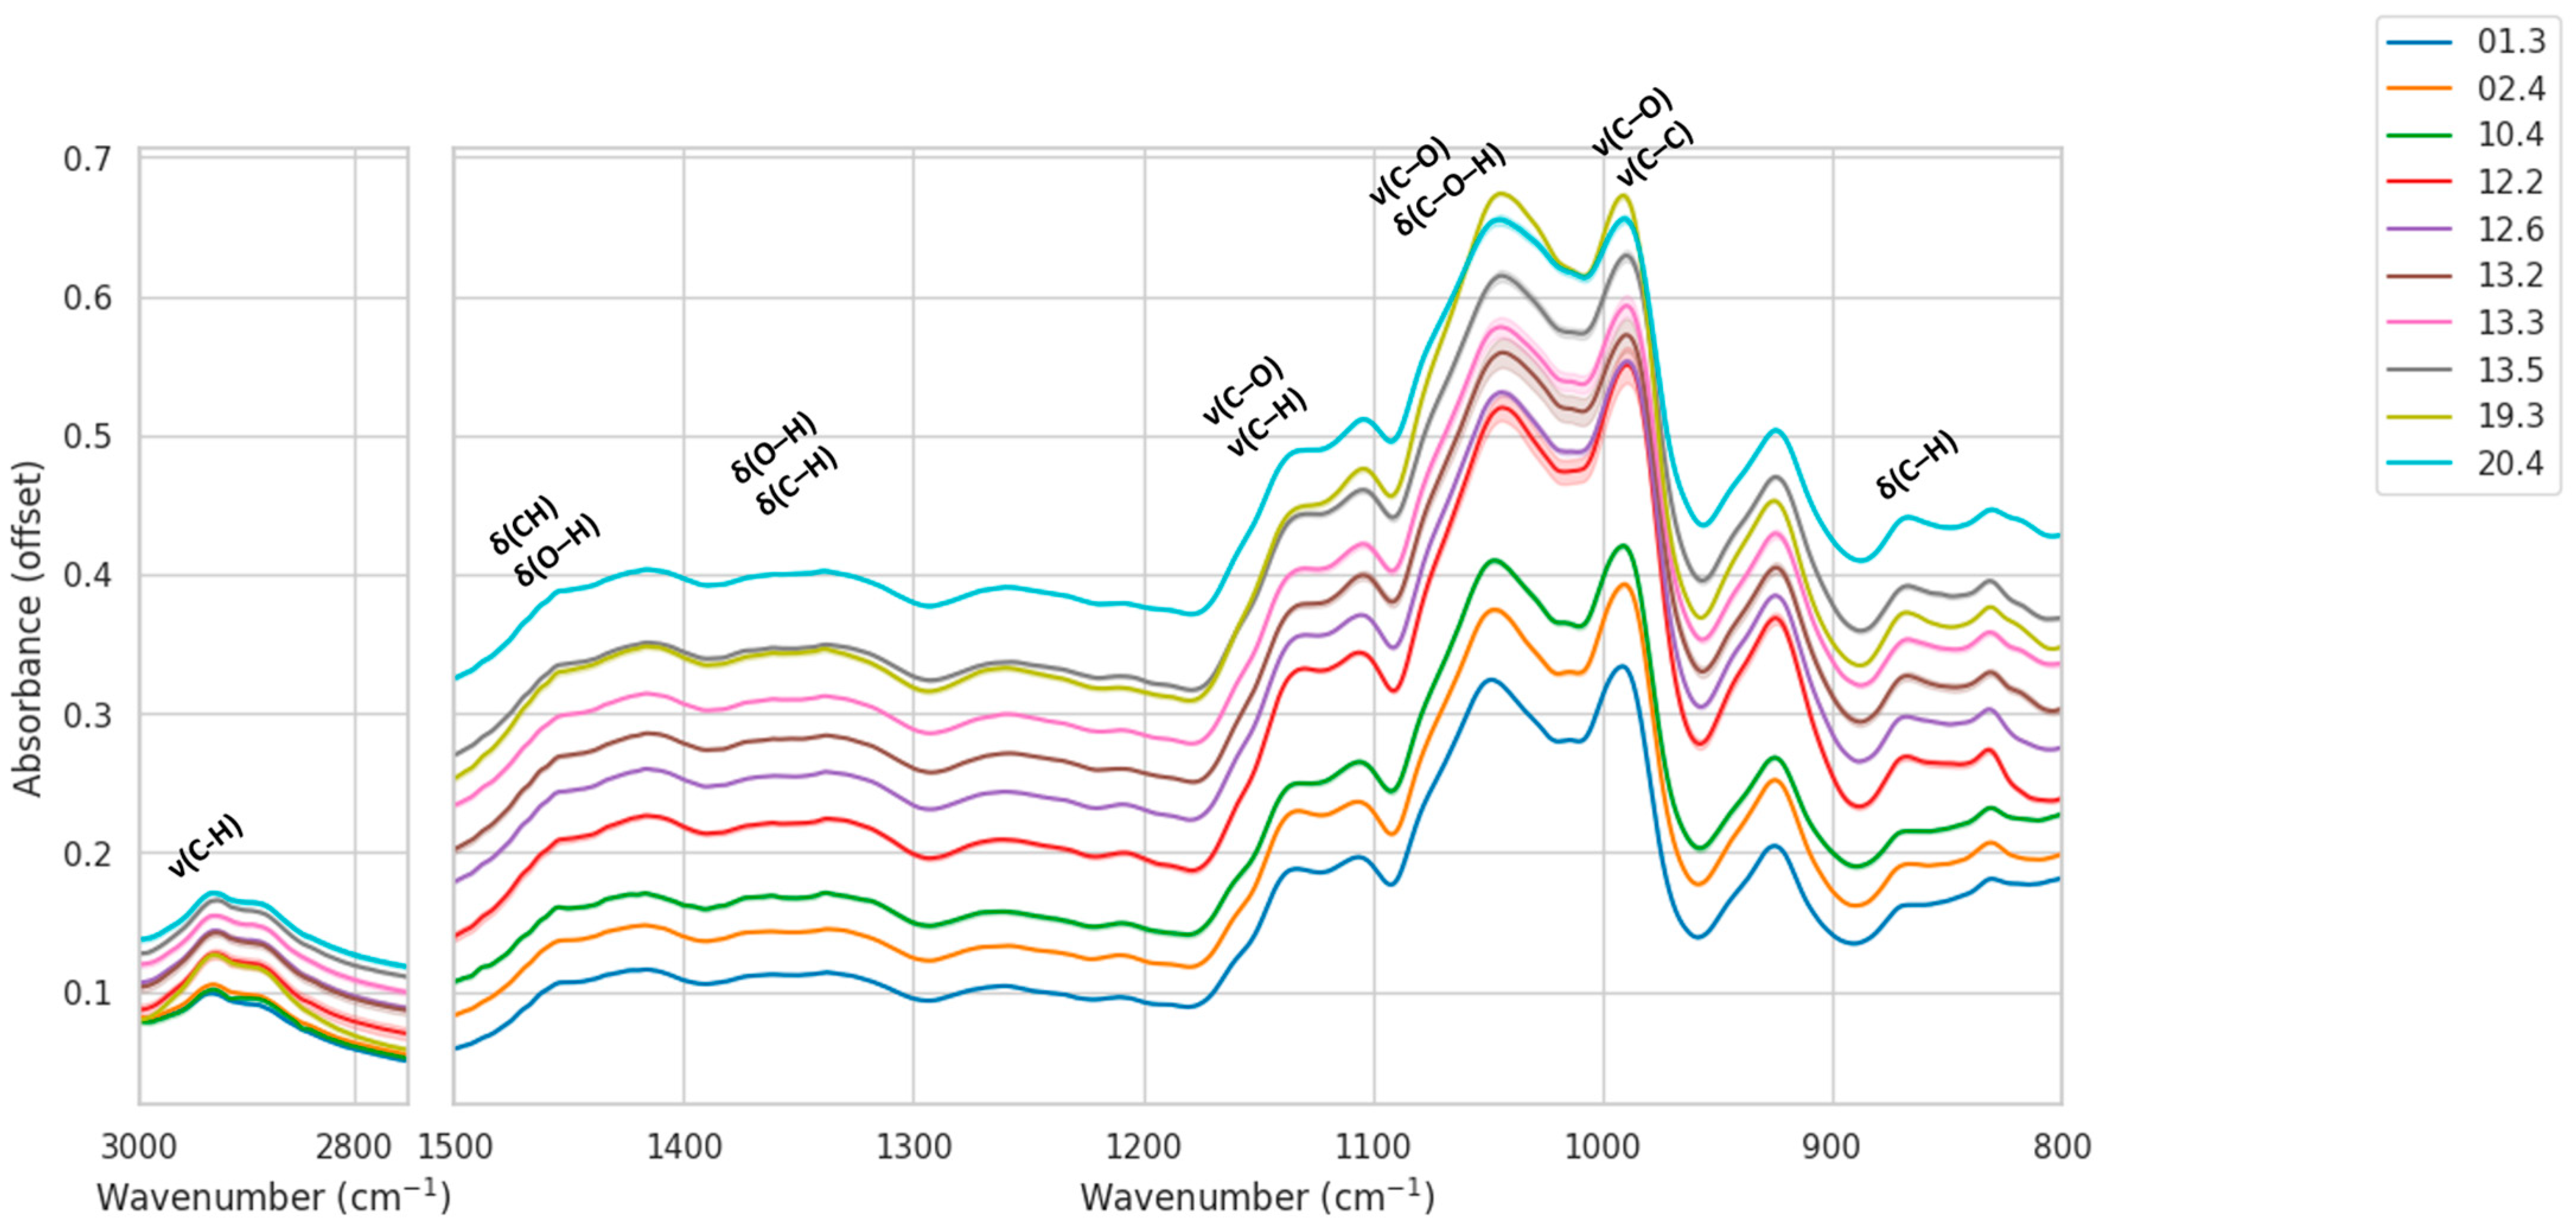
In line with these findings, inspection of the mean IR spectra with standard-deviation envelopes reveals systematic, location-dependent differences across both targeted regions (
Figure 2). In the C–H stretching window (2750–3000 cm
−1), samples from locations 12 and 13 exhibit the highest relative intensities, whereas location 19 shows consistently lower responses, which may be indicative of varying carbohydrate concentration. Within the fingerprint range (600–1500 cm
−1), the carbohydrate-dominated zone around 1200–950 cm
−1 displays pronounced variation: locations 12 and 13 present stronger bands near ~1100–1000 cm
−1, location 10 is intermediate, and locations 01/02 are comparatively weaker. The shaded SD envelopes are narrow, indicating high intra-location reproducibility and supporting the compact within-location grouping quantified in the distance analysis.
Comparable spectral differences have been described in previous FTIR studies of honey and nectar, where variation in carbohydrate vibrations in the 1200–900 cm
−1 region and C–H stretching bands around 2930–2850 cm
−1 were identified as key discriminators of botanical and geographical origin. For example, Gok and co-workers showed that differentiation of Anatolian honeys was achieved successfully by ATR-FTIR analysis of the 1800–750 cm
−1 range [
16], while Nickless et al. demonstrated that saccharide composition in
Leptospermum scoparium nectar could be reliably quantified by ATR-FTIR and related to cultivar-specific chemical signatures [
5]. More generally, Wiercigroch et al. emphasized that saccharide marker bands in the 1200–800 cm
−1 region and CH stretching vibrations between 3050 and 2800 cm
−1 constitute the principal vibrational fingerprints of carbohydrates in plant materials [
31]. Recent systematic reviews confirm that these spectral zones are the most informative for honey authentication and testing for adulteration. Thus, the location-dependent intensity differences observed in our averaged spectra correspond closely with known carbohydrate-dominated features, lending further support to their relevance for nectar discrimination.
Principal component analysis (PCA) further highlighted these systematic spectral differences (
Figure 3). For the SG-smoothed dataset, the first three components explained together nearly 99.3% of the variance (PC1 = 59.4%, PC2 = 38.6%, PC3 = 1.3%). Samples grouped tightly according to their geographical origin, with most locations clearly separated along PC1 and PC2. Nevertheless, samples from locations 12 and 13 partially overlapped, reflecting their high spectral similarity. The three-dimensional PCA projection (PC1–PC3) provided slightly improved visual discrimination between these two locations, with PC3 capturing subtle differences in the carbohydrate-associated region.
Inspection of PCA loadings plots (
Figure S3) revealed that PC1 and PC2 variance is dominated by carbohydrate-associated bands, especially the broad region around 1050–1000 cm
−1, with notable contributions from bands near 980 and 930 cm
−1. These features correspond to C–O and C–C stretching in glucose, fructose, and sucrose. PC2 emphasizes similar carbohydrate bands but with slightly shifted contributions. PC3, although capturing only 1.3% of variance, highlights CH-stretching vibrations at 2930–2850 cm
−1, indicating that even subtle variance in this region helps refine separation of closely related locations.
It should also be noted that not all locations were perfectly separated based on only PCA of total variance. This limitation may be partly methodological: nectar sampling is inherently challenging, as the available volume per flower is small, necessitating manual collection from a variable number of blossoms for each sample. Such variability introduces potential heterogeneity at the collection stage. On the other hand, the data clearly demonstrate that large geographical distances are not required to detect environmental influences on nectar IR spectra. Even within the same city, local conditions—such as differences in shading, soil composition, surrounding vegetation, presence of microorganisms, micro- and macro-organism activity, solar exposure, and local pollution—can shape the spectral fingerprint of nectar. With a greater emphasis on standardized sampling protocols, these subtle yet consistent environmental influences could be captured more systematically, enhancing the discriminatory power of the approach.
2.2. Hedera helix Nectar
The next set of nectar samples was collected from
H. helix. Due to the very low nectar content in the flowers, the diversity of the obtained dataset is considerably reduced compared to
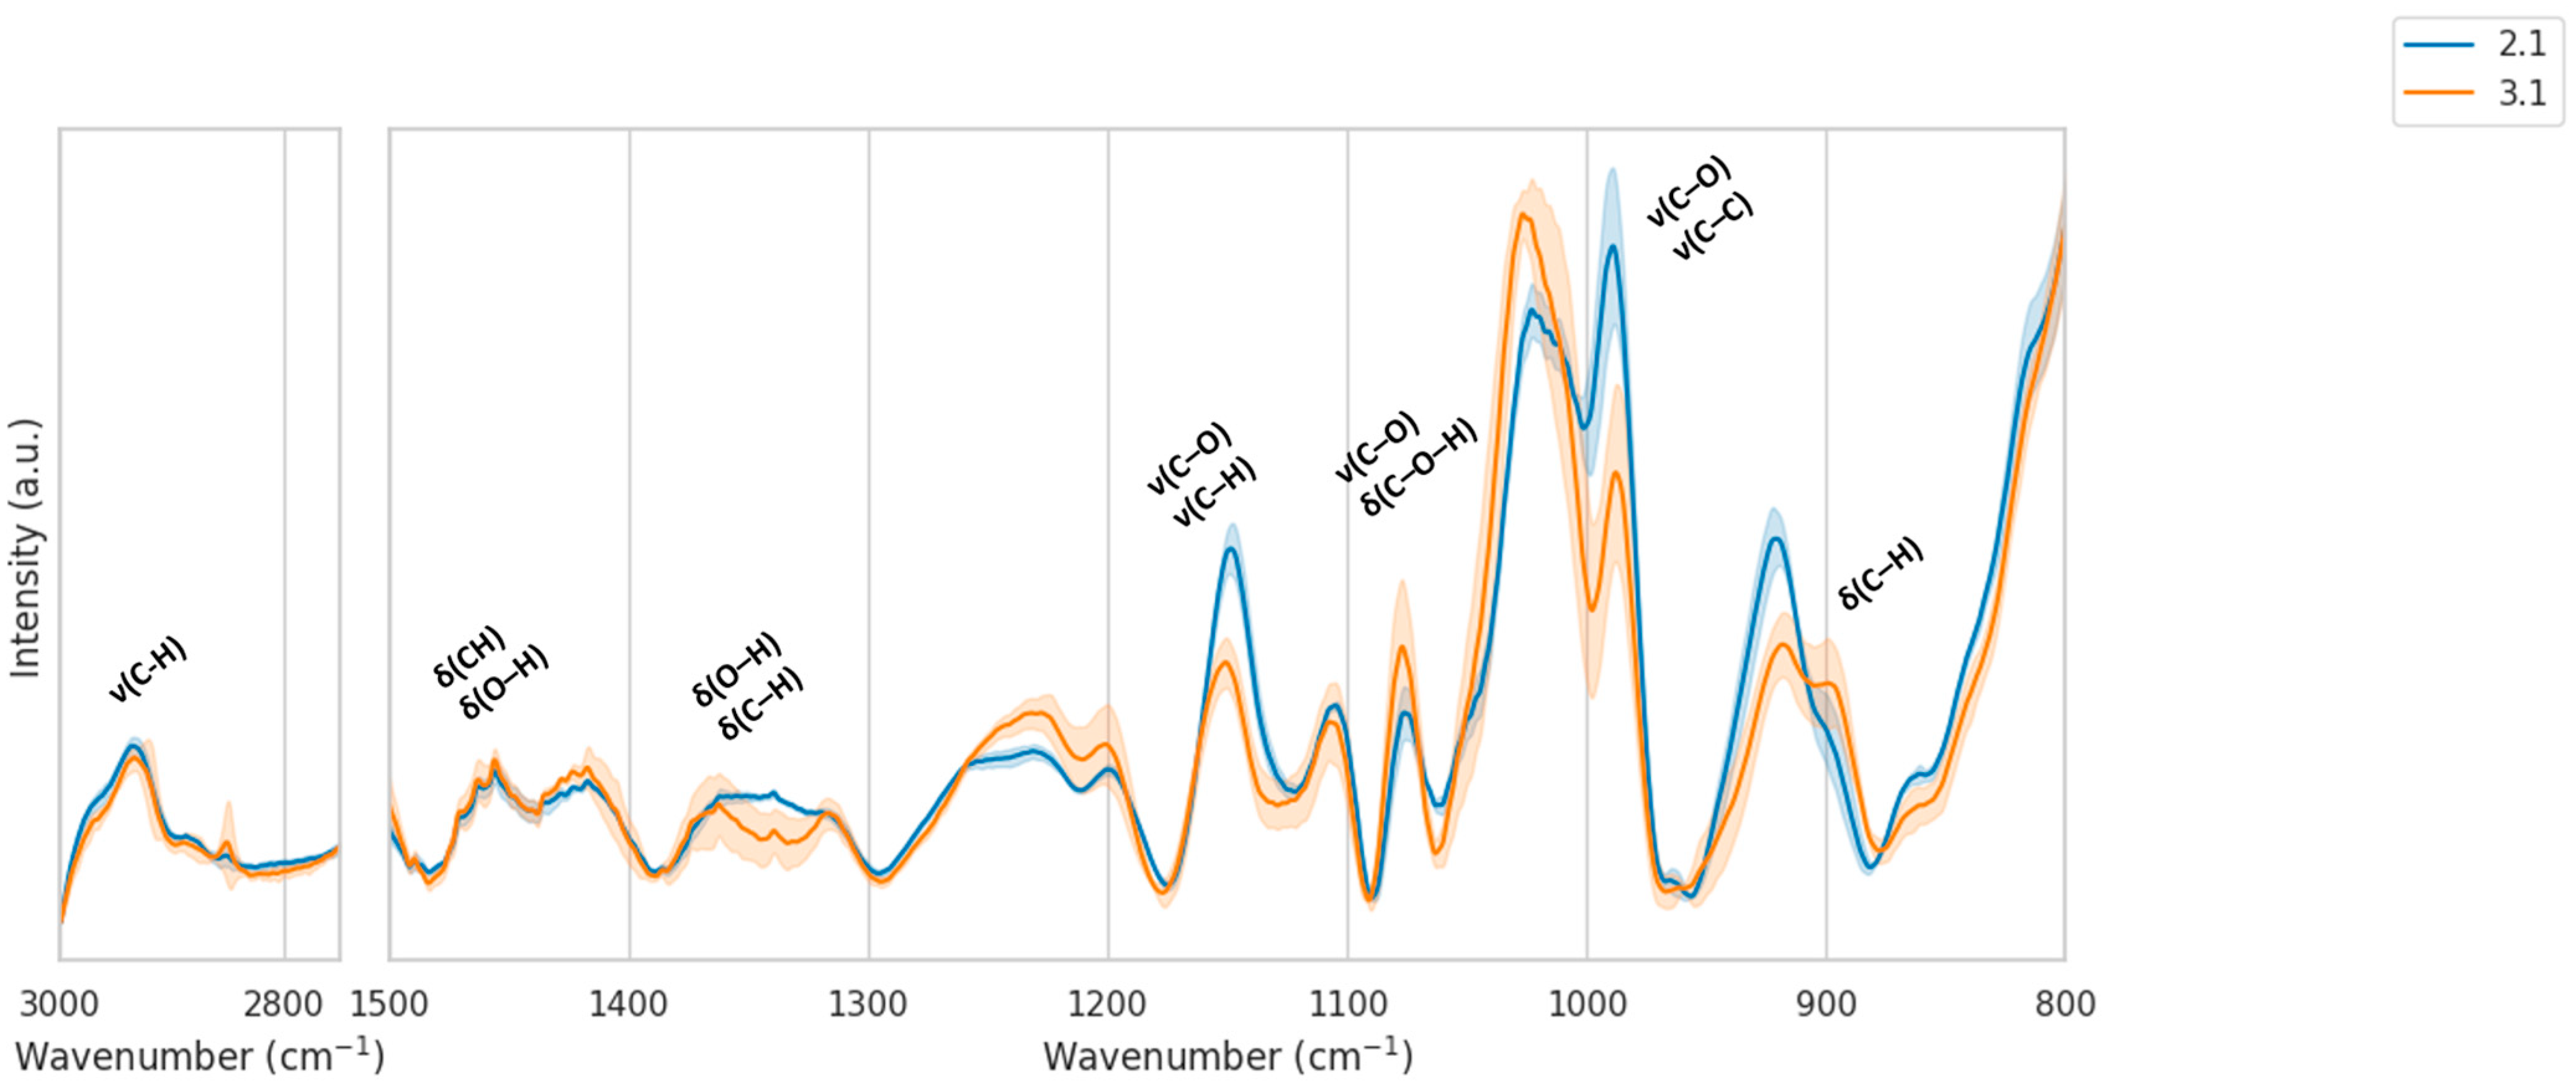
E. vulgare. As a result, the standard deviation of the IR spectra is higher, which makes spectral differences between the groups less pronounced (
Figure 4). In contrast to
E. vulgare, where the separation of the groups was clearer, in
H. helix the overlapping of signals can indicate plant’s higher resistance to local environment’s variability. This suggests that
E. vulgare nectar provides a better-resolved spectral fingerprint than
H. helix.
All preprocessing steps followed the same pipeline as in the E. vulgare dataset. The spectra were restricted to the spectroscopically relevant regions of 800–1500 cm−1 (fingerprint region) and 2750–3000 cm−1 (C–H stretching region).
Inspection of the mean IR spectra with standard-deviation envelopes (
Figure 4) indicates that, in contrast to
E. vulgare, the spectral variability within
H. helix samples is higher, reflected in broader shaded regions. This higher variance reduces the clarity of location-dependent differences. Nevertheless, several systematic spectral features are noticeable. In the C–H stretching region (2750–3000 cm
−1), both locations show overall similar band shapes, though with subtle differences in intensity distributions. In the fingerprint region (800–1500 cm
−1), the carbohydrate-dominated window (1150–950 cm
−1) again plays a major role: location 2.1 tends to display slightly stronger absorbance near ~1050–1000 cm
−1, whereas location 3.1 shows broader, less distinct features, coupled with increased baseline fluctuations. The more pronounced variability in location 3.1 is consistent with its wider SD envelopes, suggesting that nectar composition at this site is more heterogeneous. Part of this variability may also originate from the collection procedure, as rinsing each nectary disc with water or ethanol to obtain sufficient nectar volume could introduce solvent–matrix effects, further contributing to the broader variance observed in
H. helix spectra (see also
Section 2.3).
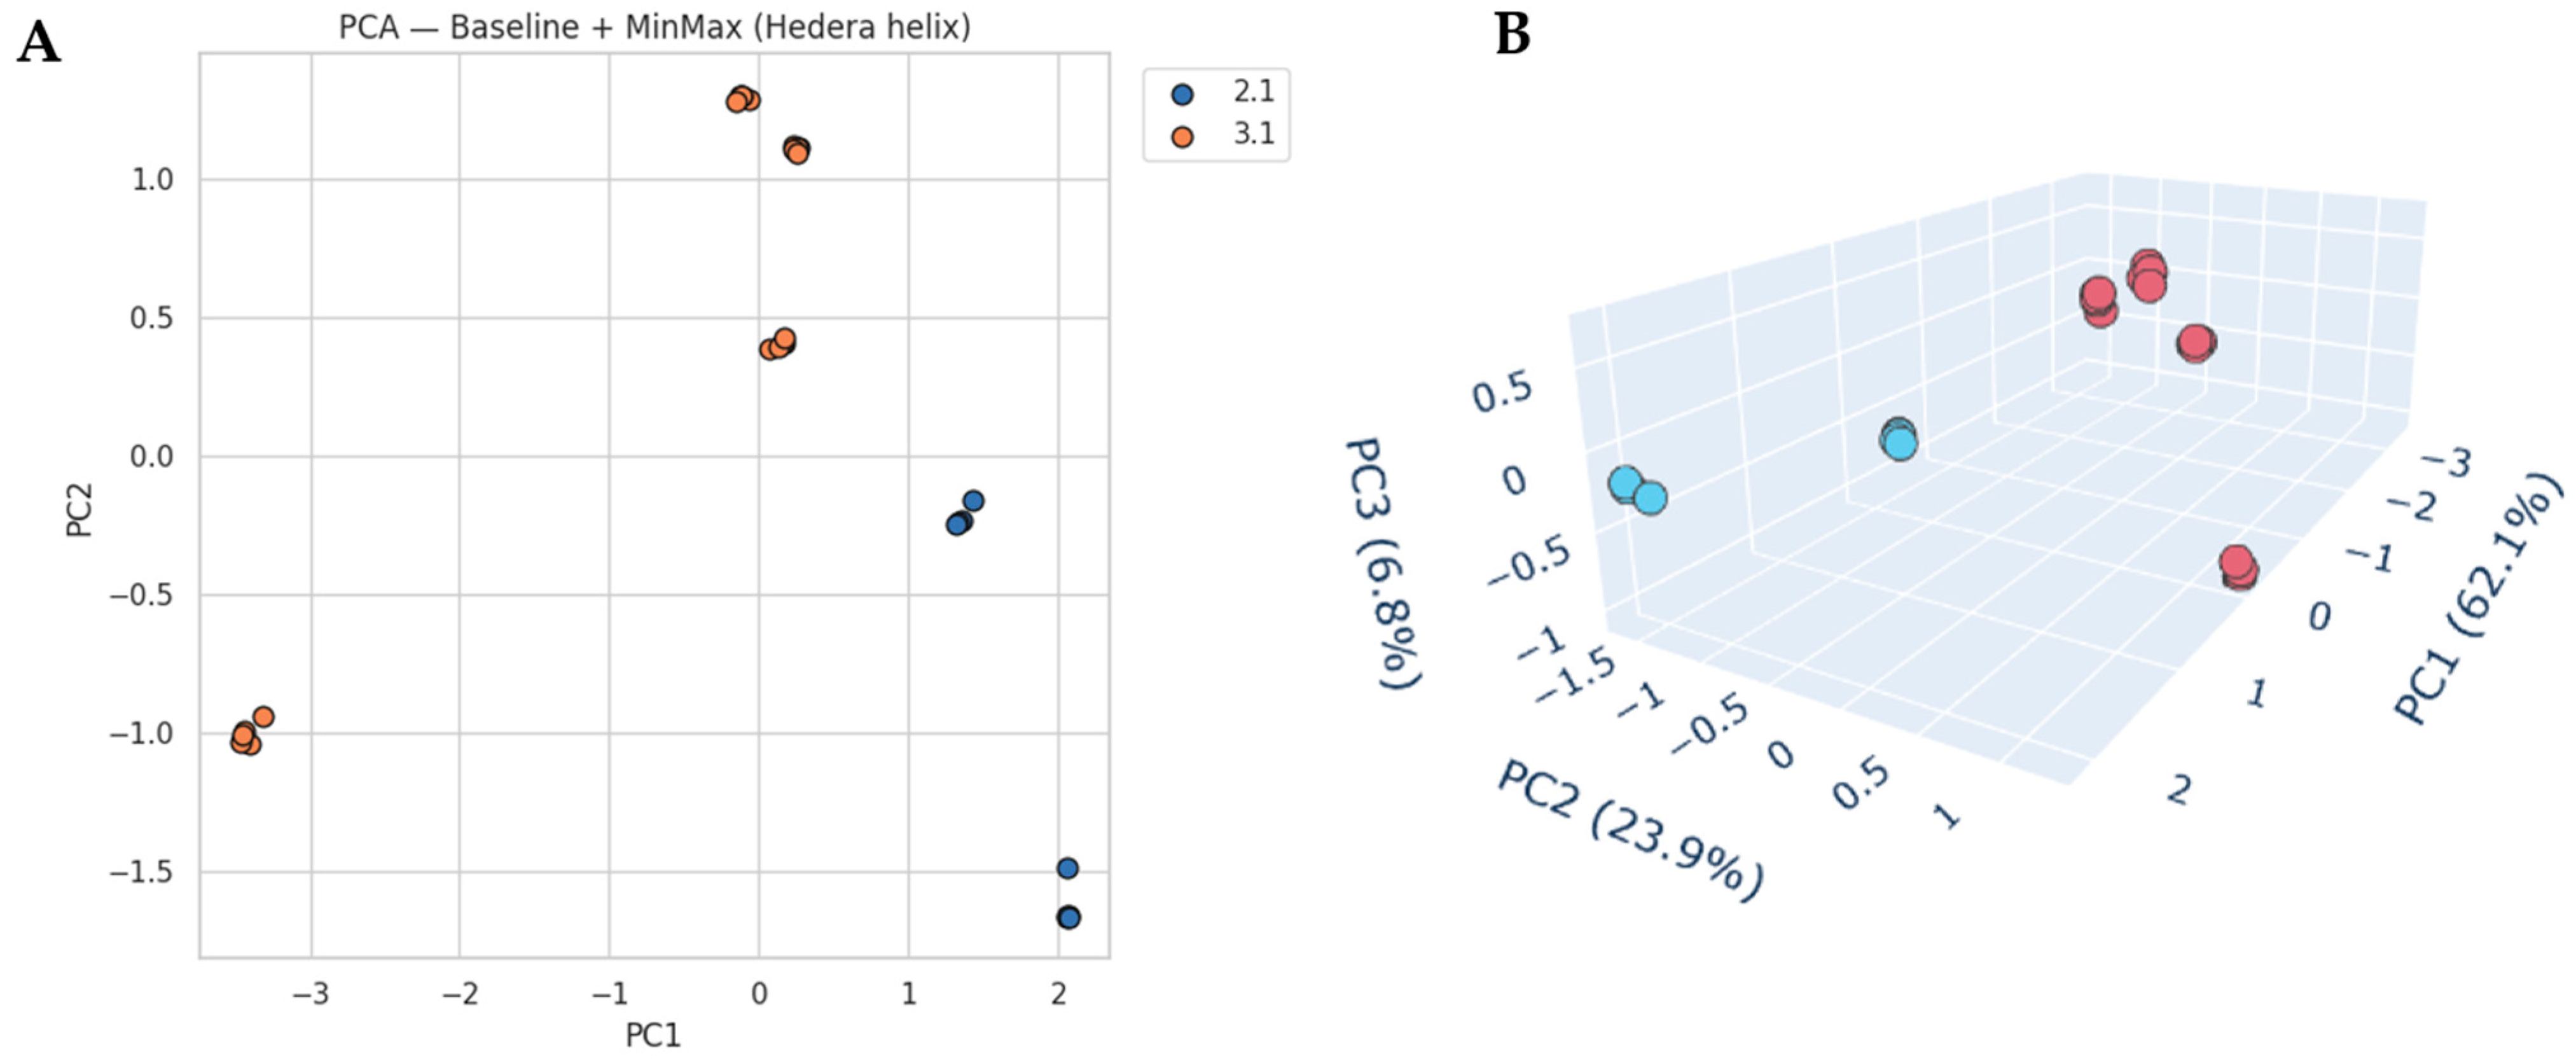
Principal component analysis (PCA) further highlights these differences (
Figure 5). The two-dimensional PCA score plot (PC1 vs. PC2) reveals a clear separation between locations 2.1 and 3.1. PC1 explains 62.1% and PC2 23.9% of the variance, together capturing over 86% of the spectral information. The three-dimensional PCA projection (PC1–PC3) further illustrates this separation, with PC3 (6.8%) adding minor discriminative information. Samples from location 2.1 cluster more tightly, while those from location 3.1 are more dispersed, indicating greater internal variability.
The PCA loadings (
Figure S4) confirm that the dominant discriminatory features appear in the carbohydrate-associated fingerprint region, particularly between 1100 and 950 cm
−1. Additional contributions from the C–H stretching region also plays a role, though to a lesser extent. These findings align with the carbohydrate-dominated nature of nectar IR spectra, as observed also for
E. vulgare.
Taken together, the results show that while H. helix nectar spectra display systematic, location-dependent variation in the fingerprint and C–H stretching regions, the increased variability within samples—particularly at location 3.1—is reflected in the inherent heterogeneity of H. helix nectar composition and the practical limitations of collecting sufficient nectar volumes from this species.
The two case studies conducted on E. vulgare and H. helix nectar samples highlight both commonalities and subtle differences in how FTIR spectroscopy combined with chemometric analysis can discriminate between samples of different geographical origins.
For E. vulgare, a larger set of locations was represented, including both single- and duplicate-sample sites. Silhouette analysis demonstrated that straightforward preprocessing or even raw spectra were sufficient to achieve compact clustering within locations and large distances between locations. PCA confirmed this outcome, with most locations clearly separated. Mean spectra revealed systematic differences between locations, especially in carbohydrate-associated bands (~1200–950 cm−1) and C–H stretching vibrations (2930–2850 cm−1).
For H. helix, the dataset was smaller (two locations, each with multiple biological replicates), but the results were consistent with those obtained for E. vulgare. PCA revealed that while location 2.1 samples clustered tightly, location 3.1 showed greater internal variability, as evidenced by both the PCA dispersion and the broader standard-deviation envelopes of the mean spectra. The spectral regions most responsible for the discrimination were again the carbohydrate fingerprint region (~1100–1000 cm−1) and the C–H stretching region (~2950–2850 cm−1), where location 3.1 displayed higher intensity and variability.
Taken together, these analyses provide converging evidence that FTIR, when combined with appropriate preprocessing and multivariate analysis, is highly effective in discriminating nectar samples by different locations, even with small distances, although the number of samples can be crucial to obtain reliable results. Moreover, the PCA loadings suggest that differences between locations are not systematic between species. The results reinforce previous literature findings that carbohydrate- and C–H-associated bands are the primary discriminators of nectar and honey provenance. Importantly, while E. vulgare demonstrated robust separation across multiple locations and H. helix confirmed the approach in a more constrained dataset, both case studies highlight the reproducibility of the method and its suitability for broader application in nectar and honey authentication.
2.3. Significance of the Sample Collection
The choice of solvent for nectar sample preparation has a substantial impact on the infrared spectral profile and, consequently, on the interpretation of chemical composition [
32].
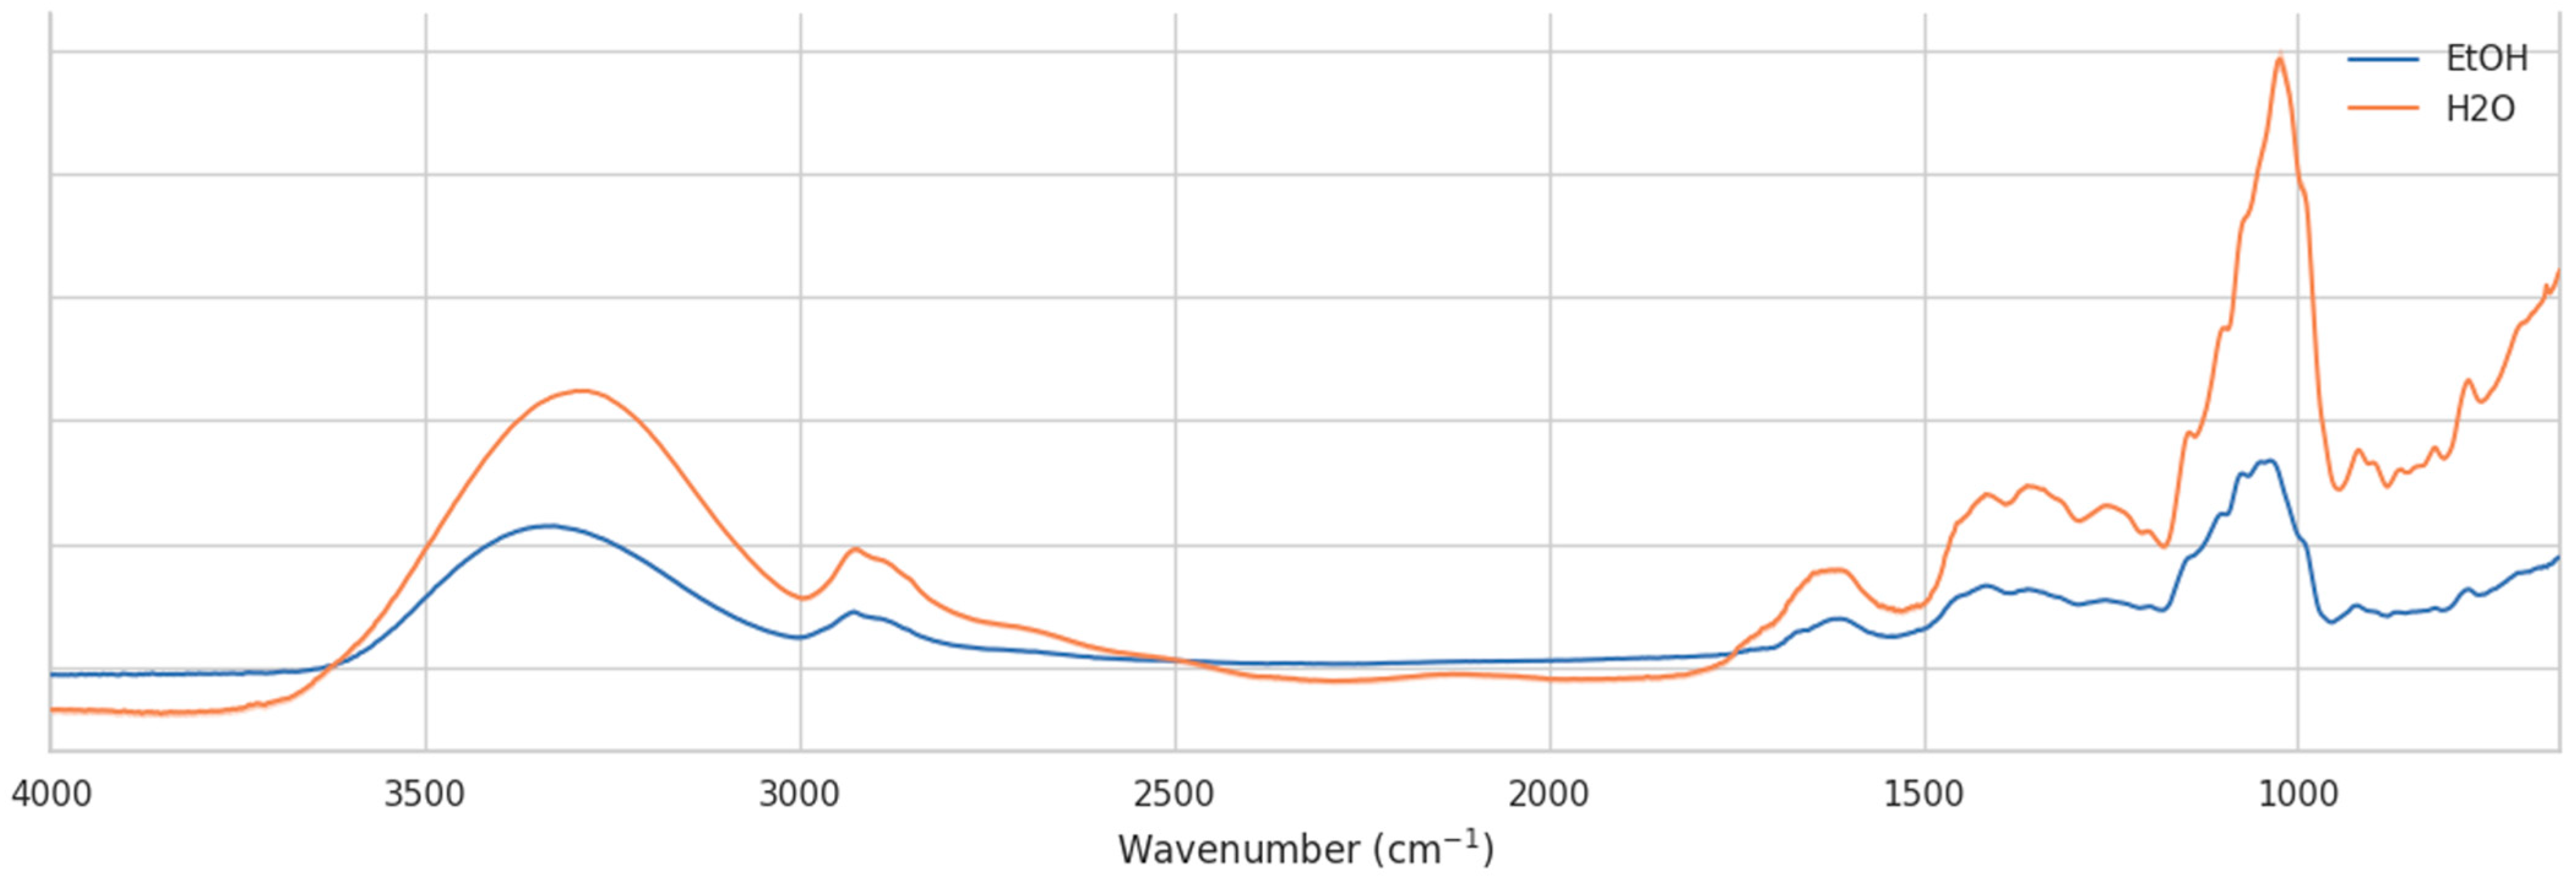
Figure 6 compares representative spectra of
H. helix nectar collected in water and ethanol. While the overall spectral envelopes are similar, clear intensity differences and band distortions are observed between the two solvents.
In the carbohydrate-dominated fingerprint region (1200–950 cm−1), spectra obtained from water-collected samples display sharper and more intense features, particularly around 1050–1000 cm−1, which can be attributed to C–O and C–C stretching vibrations of mono- and disaccharides. In contrast, ethanol-collected samples show lower absolute absorbances and a smoother profile in this range, likely due to partial overlap and hydrogen-bonding interactions with residual water. Similarly, in the C–H stretching region (2950–2850 cm−1), water-collected spectra exhibit more pronounced peaks, whereas the ethanol-collected spectra are attenuated.
These observations demonstrate that ethanol as a collection medium may enhance the resolution of saccharide-associated vibrational modes, facilitating more robust chemometric discrimination between samples. However, ethanol also introduces a risk of selective solubility and potential extraction bias, as some polar compounds may be preferentially retained in aqueous solutions. Water collection, on the other hand, minimizes solvent-related chemical interference but may suppress spectral features due to stronger hydrogen-bonding interactions and baseline distortions.
Overall, the comparison highlights the importance of standardized sample collection protocols. Differences between water- and ethanol-collected spectra, suggesting that direct comparison across solvents may lead to artificial clustering or misclassification. For reliable discrimination of nectar samples by location or botanical origin, consistent solvent use is essential, and ethanol may provide an advantage by amplifying the relevant carbohydrate signatures in the mid-infrared region.
2.4. E. vulgare flowers
The comparative analysis of FTIR spectra from
E. vulgare nectar (collected in water) and
E. vulgare floral tissue (
Figure 7) highlights the distinct chemical signatures of secreted nectar versus the plant matrix from which it originates. Although both spectra share common vibrational features related to carbohydrate structures, the relative band intensities and overall profiles are markedly different, reflecting their differing biochemical compositions.
In the carbohydrate-dominated fingerprint region (1200–950 cm−1), the nectar spectrum displays more intense and well-defined absorptions, consistent with a higher proportion of free sugars (primarily glucose, fructose, and sucrose). The flower tissue spectrum, by contrast, shows broader and less intense peaks in this range, indicative of saccharide moieties bound within complex cell wall polymers such as cellulose and hemicellulose.
The C–H stretching region (2950–2850 cm−1) is more pronounced in the nectar spectrum, further supporting the dominance of free carbohydrates and other low-molecular-weight organic compounds (e.g., sugars and organic acids). In the flower spectrum, however, additional bands appear in the 1700–1600 cm−1 region, attributable to C=O stretching and aromatic vibrations of phenolic compounds and proteins present in cellular structures. This suggests that flower tissue spectra are more chemically diverse, incorporating contributions from structural biopolymers, lipids, and secondary metabolites.
Overall, these results confirm that nectar spectra are dominated by soluble carbohydrates and present a cleaner fingerprint for chemometric discrimination, even of local geographical or botanical origins. In contrast, flower spectra reflect a more complex biochemical matrix, with significant contributions from structural and defensive metabolites. While flower tissue analysis provides valuable information about plant chemistry, nectar is a more suitable matrix for assessing the chemical cues available to pollinators and for authentication of honey origin.
These comparative analyses across both species further emphasize the importance of matrix and solvent choice in FTIR-based studies of nectar. In H. helix, the difference between water- and ethanol-collected samples highlighted how solvent effects can alter spectral intensity and band resolution, potentially influencing chemometric discrimination. In E. vulgare, the comparison of nectar with floral tissue underscored that while both share carbohydrate-related vibrational features, nectar provides a much cleaner and more reproducible spectral fingerprint dominated by soluble sugars. Together, these findings demonstrate that reliable authentication and discrimination depend not only on preprocessing and multivariate analysis but also critically on the selection of the biological matrix (nectar vs. plant tissue) and the collection medium (water vs. ethanol).
2.5. Artificial Test Samples
To further support the interpretation of chemical differences between natural nectar samples from different localities, artificial model samples were prepared and analyzed by FTIR spectroscopy. These comprised two environments: DIRTY (kept next to the crowded street) and CLEAN (kept in the garden as the reference), with a 40% sucrose solution in water serving as a control.
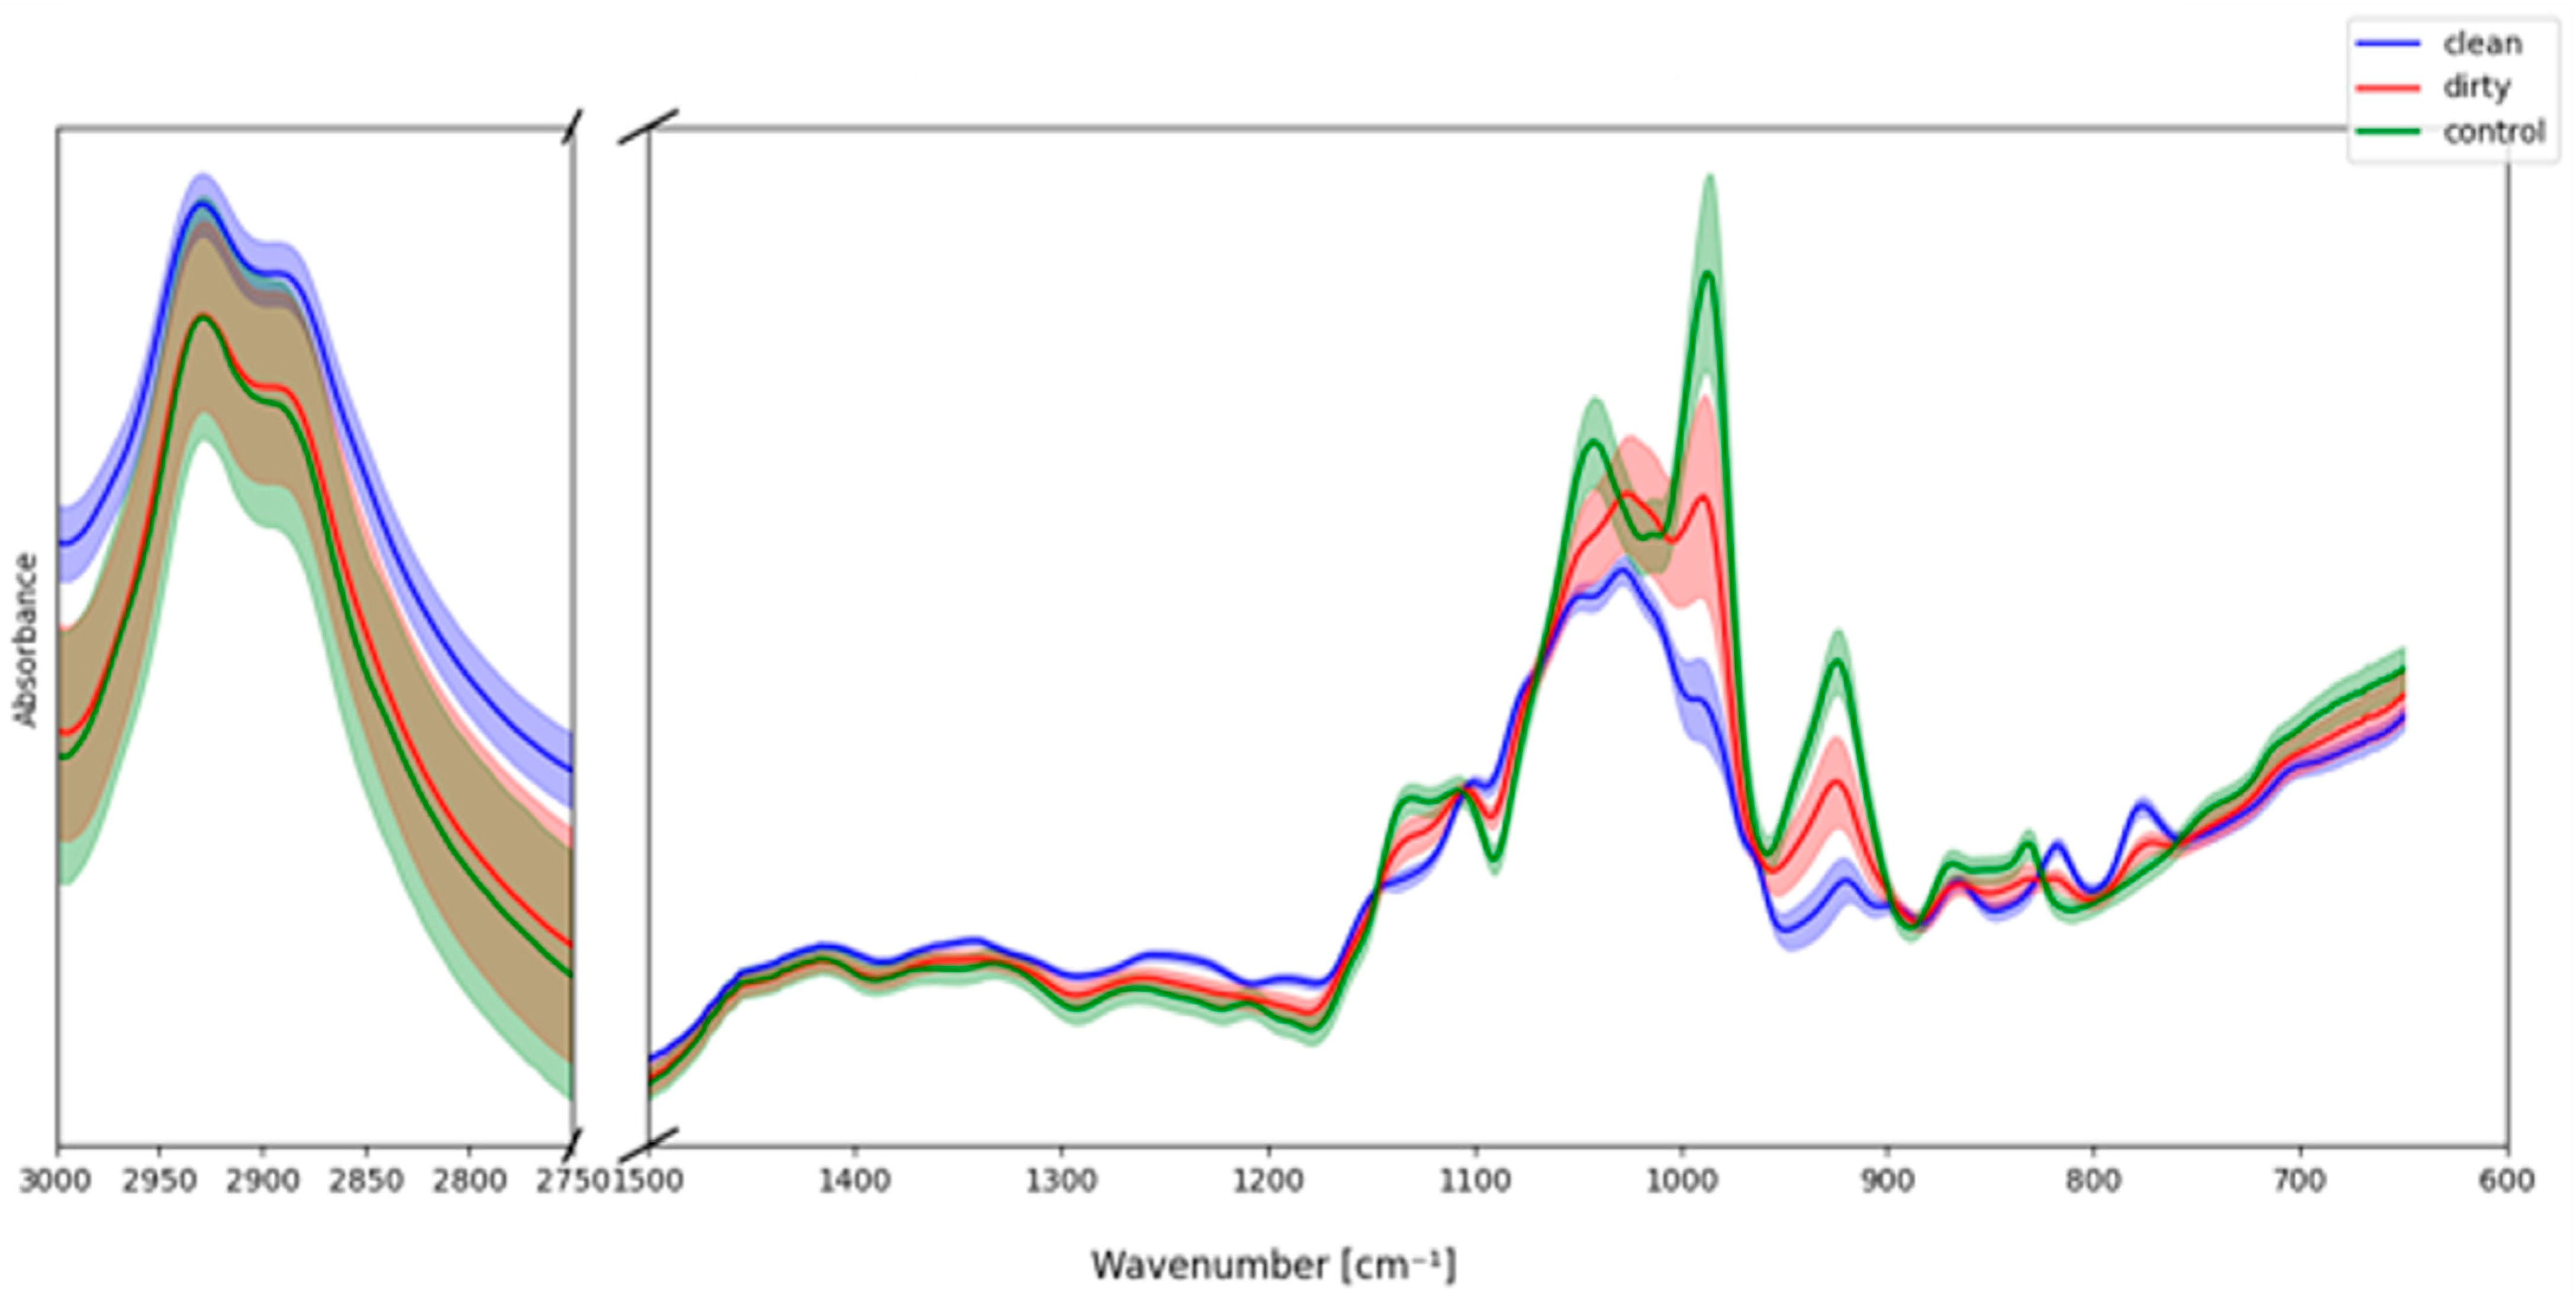
Average IR spectra of the three groups (
Figure 8) revealed clear differences, particularly in the fingerprint region (600–1500 cm
−1). The CLEAN samples displayed sharp and well-defined carbohydrate bands, closely resembling the sucrose control, especially in the 1200–950 cm
−1 region characteristic of C–O and C–C stretching in sugars. By contrast, the DIRTY samples exhibited broader absorptions and baseline distortions, with reduced band resolution in the range of 1100–1000 cm
−1, suggesting the presence of additional chemical constituents beyond pure saccharides.
Differences were also evident in the C–H stretching region (2750–3000 cm−1). While both CLEAN and control spectra showed typical carbohydrate-associated bands, the DIRTY samples displayed lower intensity and a flatter profile, consistent with environmental modifications or interference. These observations suggest that exposure to different environments can result in detectable chemical signatures in nectar-like matrices, affecting both band intensities and reproducibility.
Overall, the artificial sample analysis demonstrates that environmental conditions can significantly influence the IR spectral fingerprints of nectar analogues. The sucrose control highlights the baseline carbohydrate profile, while deviations in CLEAN and DIRTY samples illustrate how environmental exposure contributes to chemical variability. These findings support the interpretation of natural nectar spectra, where differences between localities may in part reflect environmental inputs beyond the intrinsic plant-derived carbohydrate composition.
These observations from the artificial samples strengthen the interpretation of the natural nectar datasets. The differences between CLEAN and DIRTY samples mirror the location-dependent variability observed in both E. vulgare and H. helix nectars, where samples collected from distinct environments showed variation in the carbohydrate fingerprint and C–H stretching regions. Thus, the artificial models confirm that part of the spectral heterogeneity in natural nectars likely originates from environmental influences, and they validate the chemometric discrimination of nectar samples by geographical origin.
2.6. Significance of Sample Collection
The comparative experiments carried out on nectar samples, plant tissue, and artificial models underline the importance of collection strategy and sample type for FTIR-based analysis. Each choice—solvent, biological matrix, or environmental exposure—can markedly influence spectral fingerprints and, consequently, the interpretation of chemometric results.
For H. helix nectar, the comparison of spectra collected in water and ethanol revealed that solvent strongly modulates spectral intensity and resolution. Ethanol-collected spectra displayed sharper and more pronounced carbohydrate-related bands, especially in the fingerprint region (1200–950 cm−1) and C–H stretching region (2950–2850 cm−1), whereas water-collected spectra showed dampened intensities due to hydrogen-bonding effects and residual solvent background. These findings demonstrate that consistent solvent use is critical, as differences introduced at the collection stage may propagate into chemometric models, potentially leading to artificial clustering.
For E. vulgare, the contrast between nectar and floral tissue spectra further emphasized the importance of selecting the appropriate biological matrix. Nectar spectra were dominated by soluble carbohydrates, producing cleaner and more reproducible fingerprints, while flower tissue spectra contained additional features arising from structural biopolymers and phenolic compounds. Although tissue spectra provide insight into plant chemistry, nectar offers the most relevant matrix for studies of pollinator interactions and for authentication of honey origin, as it directly represents the plant-derived sugar pool.
Artificial model samples offered additional evidence of the role of environmental exposure. Spectra from CLEAN and DIRTY samples, compared to a sucrose-water control, displayed noticeable differences despite their common carbohydrate base. The clean samples closely resembled the sucrose control, while the dirty samples exhibited broader bands, baseline shifts, and reduced resolution, consistent with the incorporation of environmental contaminants or additional organic constituents. These results demonstrate that environmental context can introduce variability into nectar spectra, paralleling the location-dependent differences observed in natural nectar datasets of both H. helix and E. vulgare.
Taken together, these findings highlight that reliable discrimination of nectar samples requires careful attention to sample collection strategy. Solvent, biological matrix, and environmental exposure all influence FTIR spectra and must be controlled or standardized to avoid misinterpretation. At the same time, the observed variability underscores the ecological and chemical richness of nectar, where both intrinsic plant metabolism and extrinsic environmental factors contribute to the spectral fingerprint.
