Abstract
The removal of soot particles via high-performance catalysts is a critical area of research due to the growing concern regarding air pollution. Among various potential catalysts suitable for soot oxidation, cerium oxide-based materials have shown considerable promise. In this study, CeO2 samples obtained using a range of preparation methods (including hydrothermal synthesis (HT), sonochemical synthesis (SC), and hard template synthesis (TS)) were tested in soot combustion. They were compared to commercially available material (COM). All synthesized ceria catalysts were thoroughly characterized using XRD, RS, UV/Vis-DR, XPS, H2-TPR, SEM, and TEM techniques. As confirmed in the current study, every tested ceria sample can be used as an effective soot oxidation catalyst, with a temperature of 50% soot conversion not exceeding 400 °C in a tight contact mode. A strong correlation was observed between the catalysts’ Ce3+ concentration and activity, with higher Ce3+ levels leading to improved performance. These findings underscore the importance of synthesis in optimizing ceria-based catalysts for environmental applications.
1. Introduction
Anthropogenic soot emissions and their subsequent respiration by humans pose a significant threat to our health. Respirable ultrafine particles generated during the combustion of fossil fuels emitted from both mobile and stationary sources enter the atmosphere, becoming part of particulate matter (PM), which can enter the human body through the respiratory system and cause many serious health issues [1,2]. Additionally, as a greenhouse pollutant, soot also plays a negative role in climate change [3].
In 2021, the World Health Organization established strict limits on PM concentrations in its new air quality guidelines [4]. These highlighted the need to develop effective catalysts for low-temperature oxidation of soot accumulated on diesel particulate filters (DPFs).
The catalytic activity of materials in soot oxidation is assessed in two modes: a tight contact, where soot and the catalyst are thoroughly mixed (e.g., in a mortar or ball mill), and a loose contact, where materials are combined less intensively (e.g., by mixing with a spatula). Tight contact allows for the evaluation of the intrinsic activity of the catalyst, while loose contact better simulates real conditions in DPFs, where triphasic interactions (soot, catalyst, and oxidizing gas) are involved. In both cases, correlations have been observed between catalytic activity and material properties, such as grain morphology, surface area of a catalyst, exposed crystallographic surfaces, and the presence of lattice defects [5,6,7].
Ceria (cerium dioxide) has been identified as a promising catalyst for soot oxidation [5,8,9,10]. Its advantages include the ability to release oxygen from the crystal lattice of CeO2 at elevated temperatures, accompanied by changes in the oxidation state of cerium, which is able to enhance oxygen storage capacity, depending on crystallite size and temperature. Previous studies have shown that crystallographic surfaces with under-coordinated oxygen sites (stabilized on 100 and 110 crystallographic planes) exhibit higher catalytic activity than stable surfaces such as (111). Consequently, nanocubes with exposed (100) and (110) surfaces exhibit higher activity at low temperatures than polycrystalline octahedral CeO2 morphology with (111) surfaces exposed [11]. Moreover, a higher surface area and smaller crystallite size improve low-temperature activity due to a higher surface-to-volume ratio and the associated quantum effects [12,13,14].
Catalysts with more contact points towards the deposited soot also enhance catalytic performance, particularly in loose contact mode. For instance, ceria nanofibers were found to be more effective in comparison to materials with undefined morphologies [15,16]. Even better results were obtained in the case of hydrothermally synthesized CeO2 crystallizing in the form of micrometric star-like structures or nanocubes, which demonstrated lower soot oxidation temperatures [17].
Calcination temperature also impacts catalytic activity. Hydrothermally synthesized micrometric star-like structures calcined at 600 °C showed a reduced activity due to crystallite sintering, but their favorable morphology was preserved [18]. Conversely, calcination of CeO2 at temperatures above 500 °C promoted the exposure of catalytically active (100) and (110) surfaces, although it led to a decrease in their surface areas and the overall catalytic activities [11]. Moreover, various morphologies result in different lattice strains that can also control, to some extent, the activity of CeO2-based catalysts in soot combustion [19]. While various dependencies have been described in the literature [20,21,22], systematic comparisons of CeO2 of different morphologies prepared through diverse synthesis methods remain quite limited.
In this study, we investigated the soot combustion performance of three CeO2 materials synthesized using different methods, including hydrothermal synthesis (HT), sonochemical synthesis (SC), and hard template synthesis (TS). The goal was to determine and understand the functional dependence of the catalytic performance of the studied ceria-based samples on their synthetic origin. We examined all prepared materials regarding their composition, morphology, and surface properties using X-ray diffraction, spectroscopic and microscopic techniques, and temperature-programmed reduction studies. We compared their activity in the soot combustion to the activity of a commercial material (CeO2 (COM)) and discussed the observed differences in terms of the ceria morphology and cerium oxidation state.
2. Results and Discussion
2.1. Characterization of the Synthesized Materials
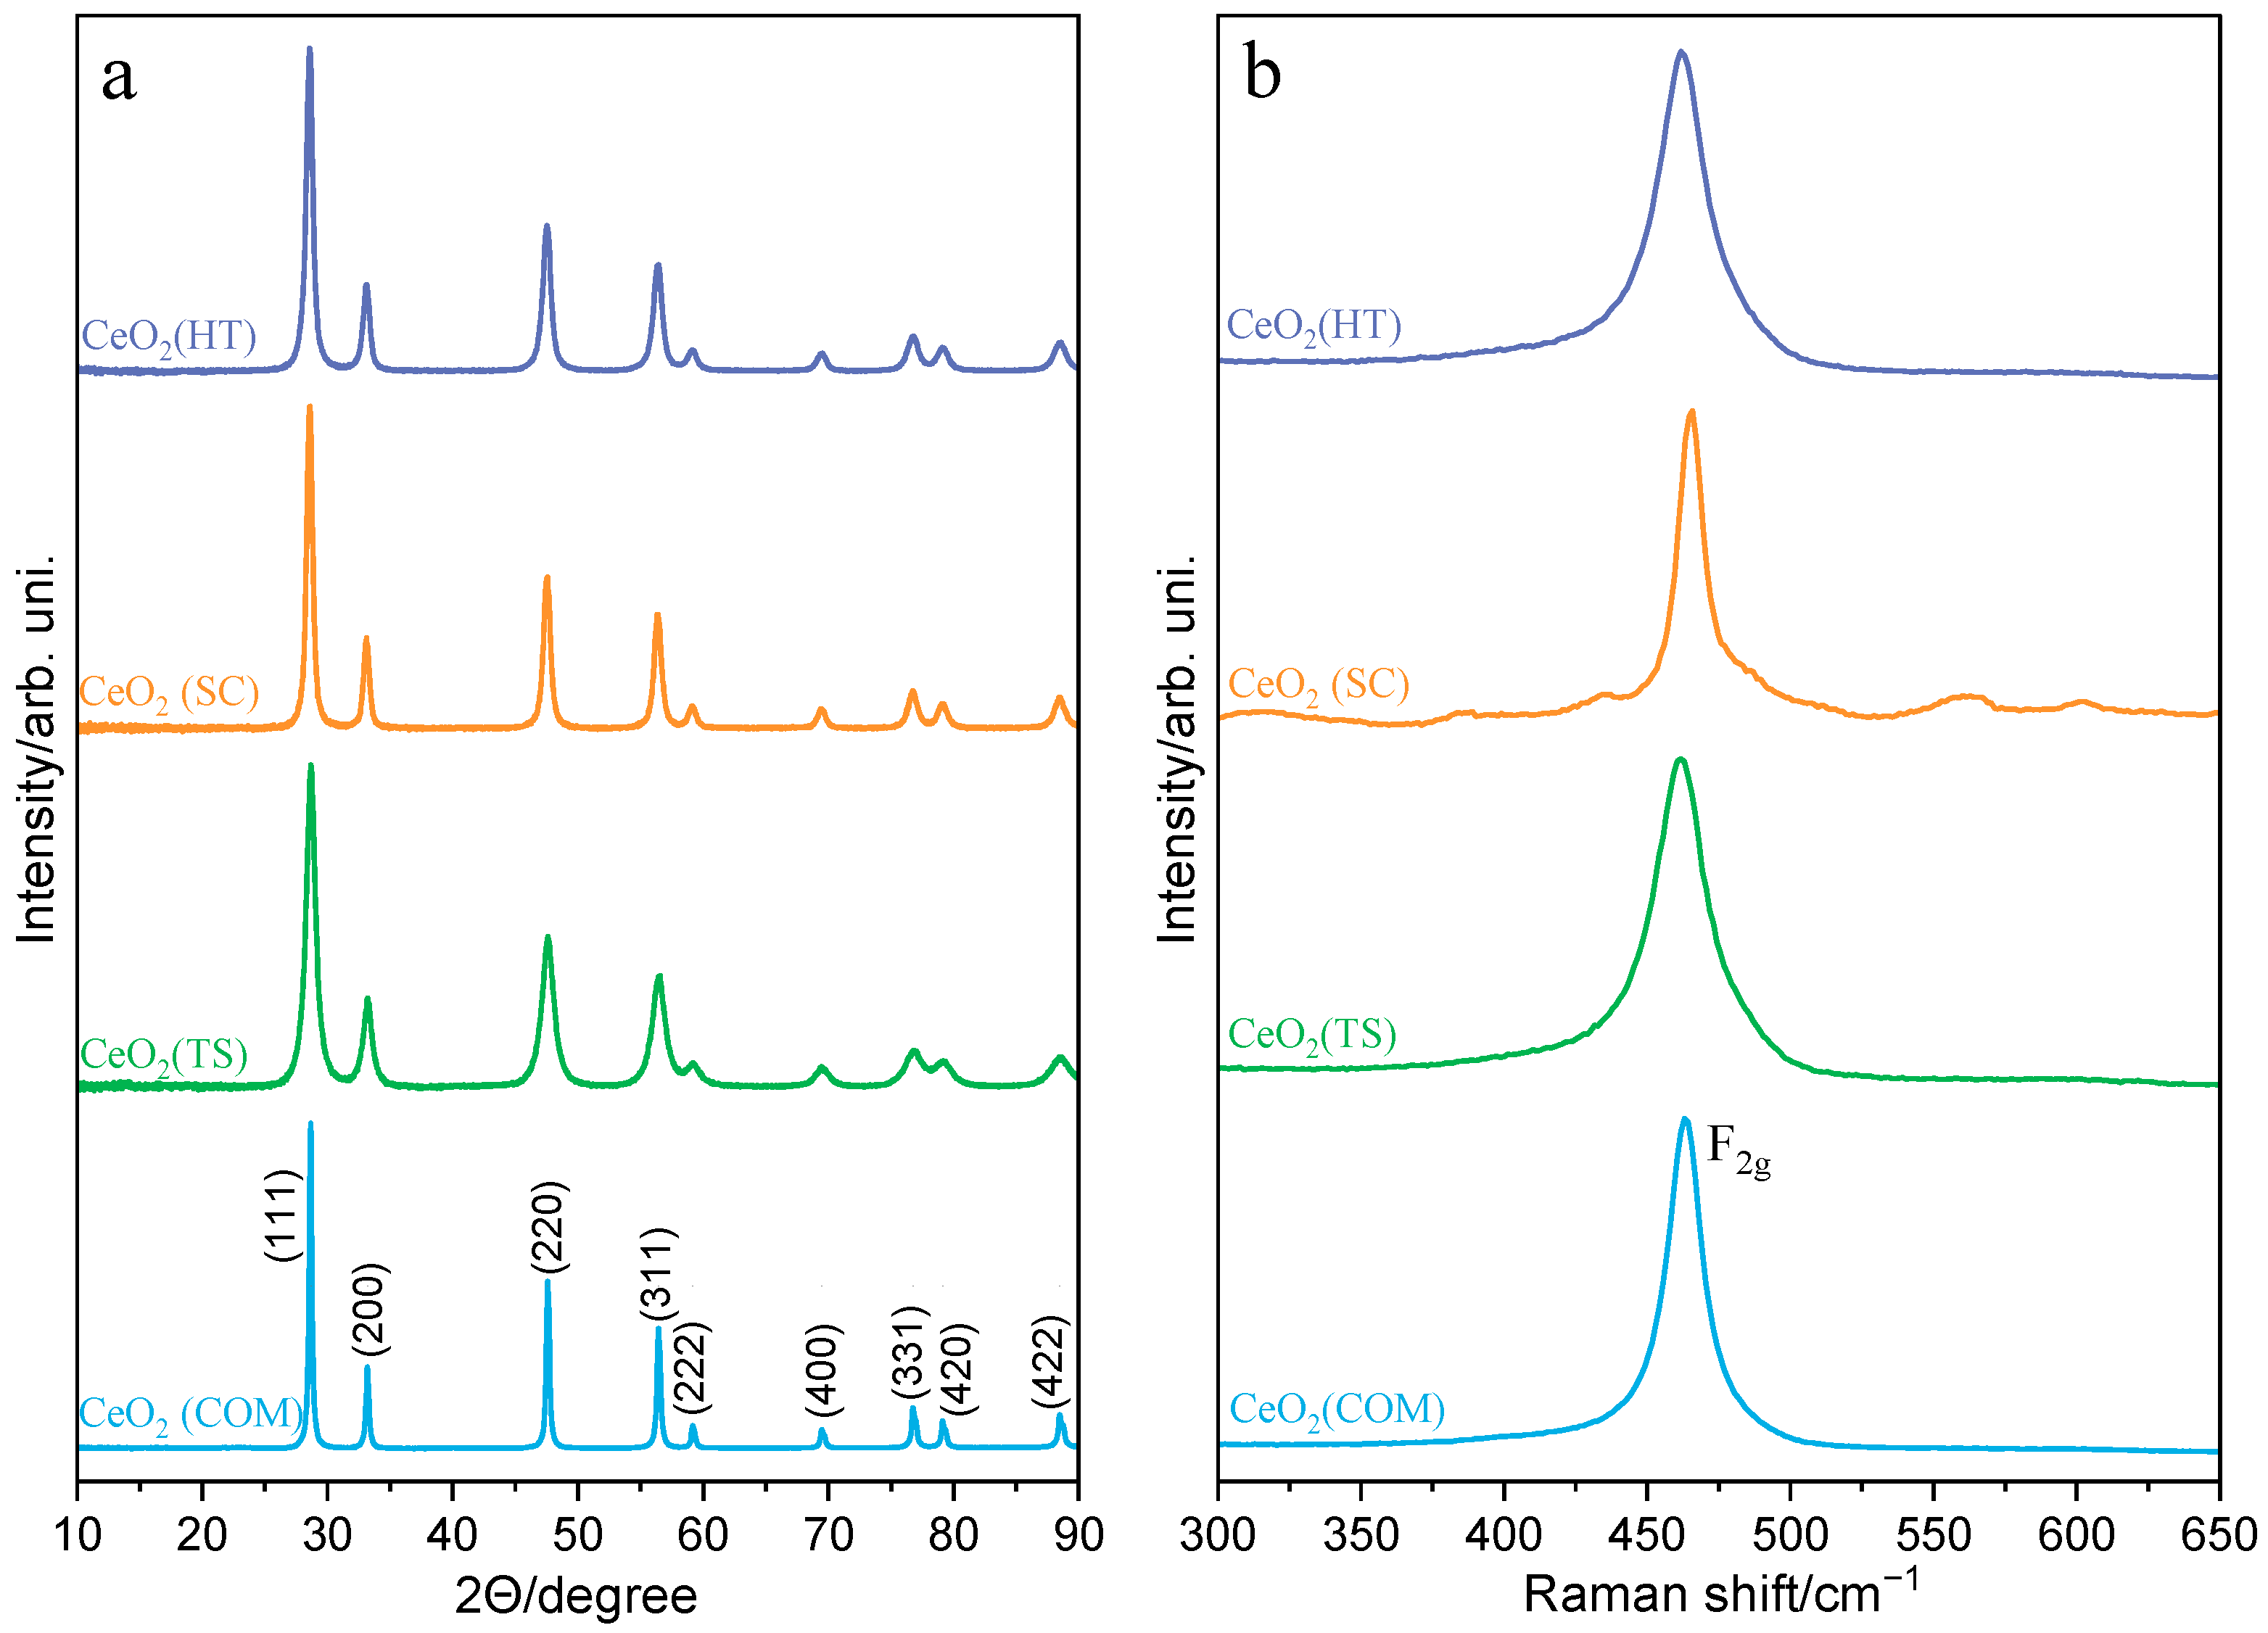
The series of ceria catalysts were characterized in terms of their structural and surface properties, including chemical and phase compositions, reducibility, and morphology. The XRD patterns of the synthesized and reference commercially available ceria materials, presented in Figure 1a, proved that all materials crystallized with a typical structure with a cubic unit cell (Fm3m). The X-ray diffraction lines characteristic of the cubic ceria oxide phase (ICSD-28753) at 2θ equal to 28.6°, 33.2°, 47.6°, 56.4°, 59.2°, 69.5°, 76.8°, 79.1°, and 88.5° were assigned to (111), (200), (220), (311), (222), (400), (311), (420), and (422) planes, respectively. Compared to commercially available ceria, the synthesized samples display distinctly broader diffraction peaks, indicating the formation of smaller crystallites (Table 1). Complementary structural characterization was performed using Raman spectroscopy (Figure 1b). The Raman spectra of all ceria samples are dominated by one characteristic F2g phonon mode, positioned around 462 cm−1, confirming a cubic fluorite CeO2 structure. According to the literature [23,24], this peak can shift to lower frequencies and broaden with decreased crystallite sizes. However, such relationships were not observed in the case of our CeO2 samples. Moreover, the Raman spectrum recorded for the CeO2(SC) sample shows very weak peaks between 525 and 575 cm−1. It is likely that they can be associated with oxygen defects occurring in the ceria lattice. The nature of these defects can be related to the presence of Frenkel-type defects formed by the displacement of O2− ions from their lattice positions to the vicinal interstitial positions [25,26,27]. This effect can be induced by the partial reduction of CeO2 samples during their synthesis or subsequent thermal treatment.

Figure 1.
XRD powder diffraction patterns (a) and Raman spectra (b) of CeO2(HT), CeO2(SC), CeO2(TS), and CeO2(COM) samples.

Table 1.
The average crystallite size of CeO2(HT), CeO2(SC), CeO2(TS), and CeO2(COM) samples calculated from XRD patterns using the Scherrer method and those determined from TEM images.
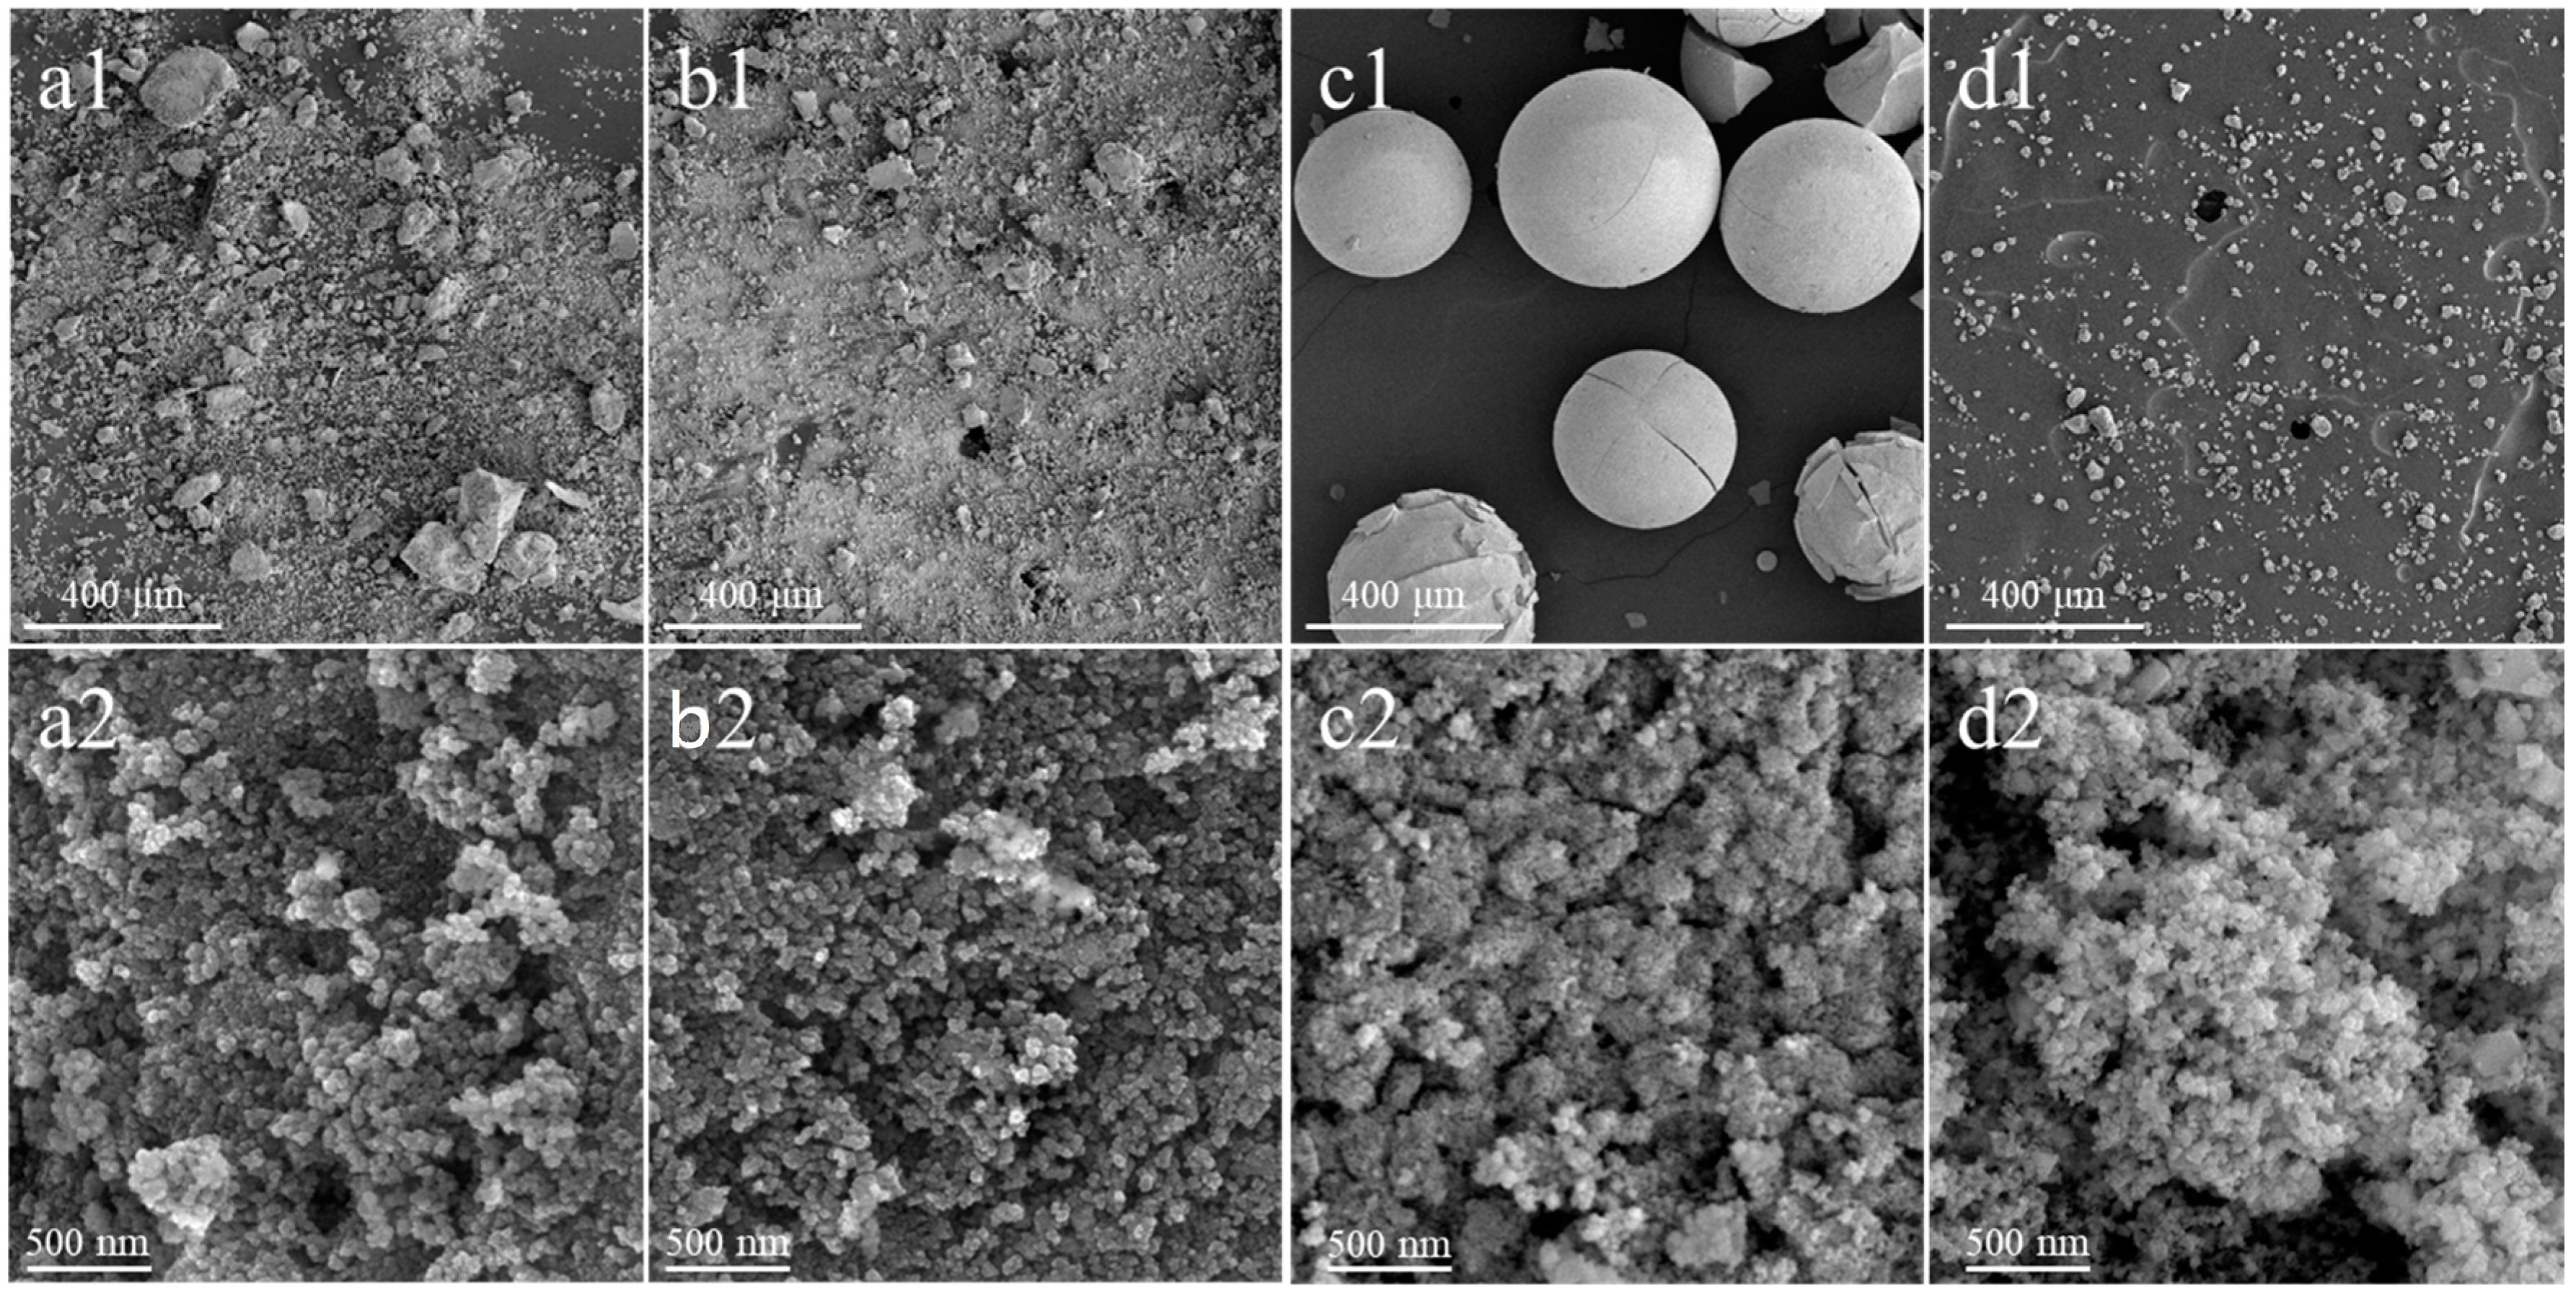
Figure 2 presents a comparison of the surface morphology of the synthesized and commercial ceria materials carried out via scanning electron microscopy (SEM).
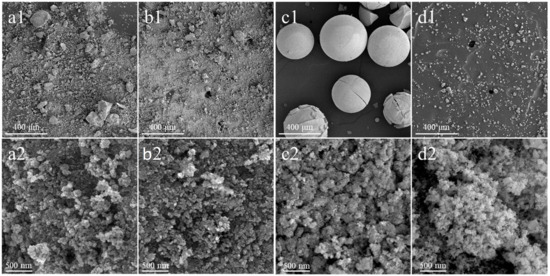
Figure 2.
SEM micrographs recorded at the magnification of 100× (1) and 50,000× (2) of CeO2(HT) (a1,a2), CeO2(SC) (b1,b2), CeO2(TS) (c1,c2), and CeO2(COM) (d1,d2) samples.
Among the samples studied, the CeO2(TS) sample, synthesized using the one-step hard template method, is quite characteristic in terms of morphology. As shown in Figure 2(c1), this material shows spherical particles, with cracks on the surface of the visible spheres formed due to the removal of volatile products formed during high-temperature synthesis [28]. In turn, the morphologies of the CeO2(HT), CeO2(SC), and materials are similar to those that are characteristic of commercial CeO2(COM). Irregular agglomerates with a broad size distribution induced by the presence of aggregated lamellar crystallites with irregular sizes and shapes are typical of such morphology.
Figure 3 shows a detailed microscopic analysis of the ceria materials conducted using a transmission electron microscope (TEM). The crystallites in the examined samples exhibited diverse shapes and sizes depending on their preparative histories. In the case of the CeO2(HT) catalyst, the crystallites show irregular, sometimes elongated shapes and are frequently observed as agglomerates composed of large and small crystallites (Figure 3(a1,a2)). The CeO2(HT) sample is dominated by CeO2 crystallites belonging to two size ranges, i.e., 6–7 nm and 10–11 nm, with an average size of 8.4 nm (Figure 3(a3)). The crystallites of the CeO2(SC) sample displayed better uniformity in shape compared to the previous sample (Figure 3(b1,b2)). Most of the crystallites visible in the recorded micrographs exhibited round and regular shapes. Significant variability in crystallite size typical of this sample is also evident in the size distribution histogram, which distinctly shows two size maxima in the ranges of 10–13 nm and 15–18 nm with an average crystallite size of 14.3 nm (Figure 3(b3)).
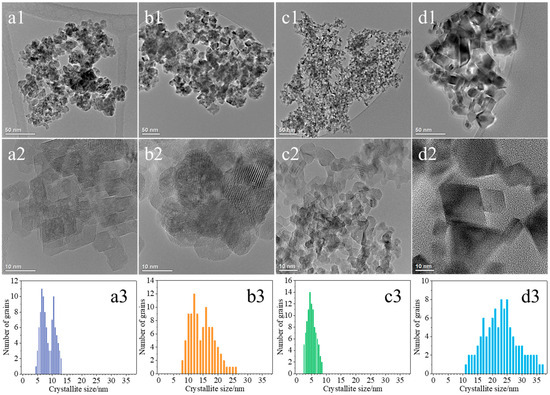
Figure 3.
TEM images together with histograms of crystallite size distribution of CeO2(HT) (a1–a3), CeO2(SC) (b1–b3), CeO2(TS) (c1–c3), and CeO2(COM) (d1–d3) samples.
The crystallites of the CeO2(TS) catalyst exhibit fairly regular and uniform shapes, with irregularities appearing less frequently (Figure 3(c1,c2)). The predominant ones were round and rectangular crystallites, and the elongated ones were observed only occasionally. The crystallites were generally small, not exceeding 10 nm, and the boundaries between them were quite visible. Nevertheless, the formation of agglomerates composed of several crystallites could still be observed. In the case of the CeO2(TS) sample, the average crystallite size is equal to 5.2 nm (Figure 3(c3)) and is the smallest among all the studied samples. Figure 3(d1,d2) show the crystallites of the commercial CeO2(COM) sample with highly diverse shapes and sizes. They exhibited relatively regular and repetitive shapes, including squares, rectangles, triangles, and rhombuses, and, less frequently, circular or elliptical shapes. The boundaries between individual crystallites were very well defined. Formation of agglomerates was rather uncommon. The average size of CeO2 crystallites typical of this sample reached approximately 22 nm (Figure 3(d3)), i.e., the largest among all the studied samples. Together with the average crystallite sizes determined from TEM images, the average diameters of crystallites (DXRD), calculated based on the Scherrer equation using a characteristic Bragg maximum at 2θ equal to 28.6° (111), are summarized in Table 1 for all investigated ceria-based samples. In most of the analyzed cases, the sizes observed through TEM are nearly half of those determined by the Scherrer method. The discrepancies between average sizes determined from XRD patterns using the Scherrer method and those obtained from TEM images can be attributed to the different physical principles and, hence, different information provided by these methods, exploiting individual particle sizes or average crystallite sizes, respectively. Thus, TEM provides localized, site-specific information, whereas XRD yields more average data, representing the entire sample analyzed.
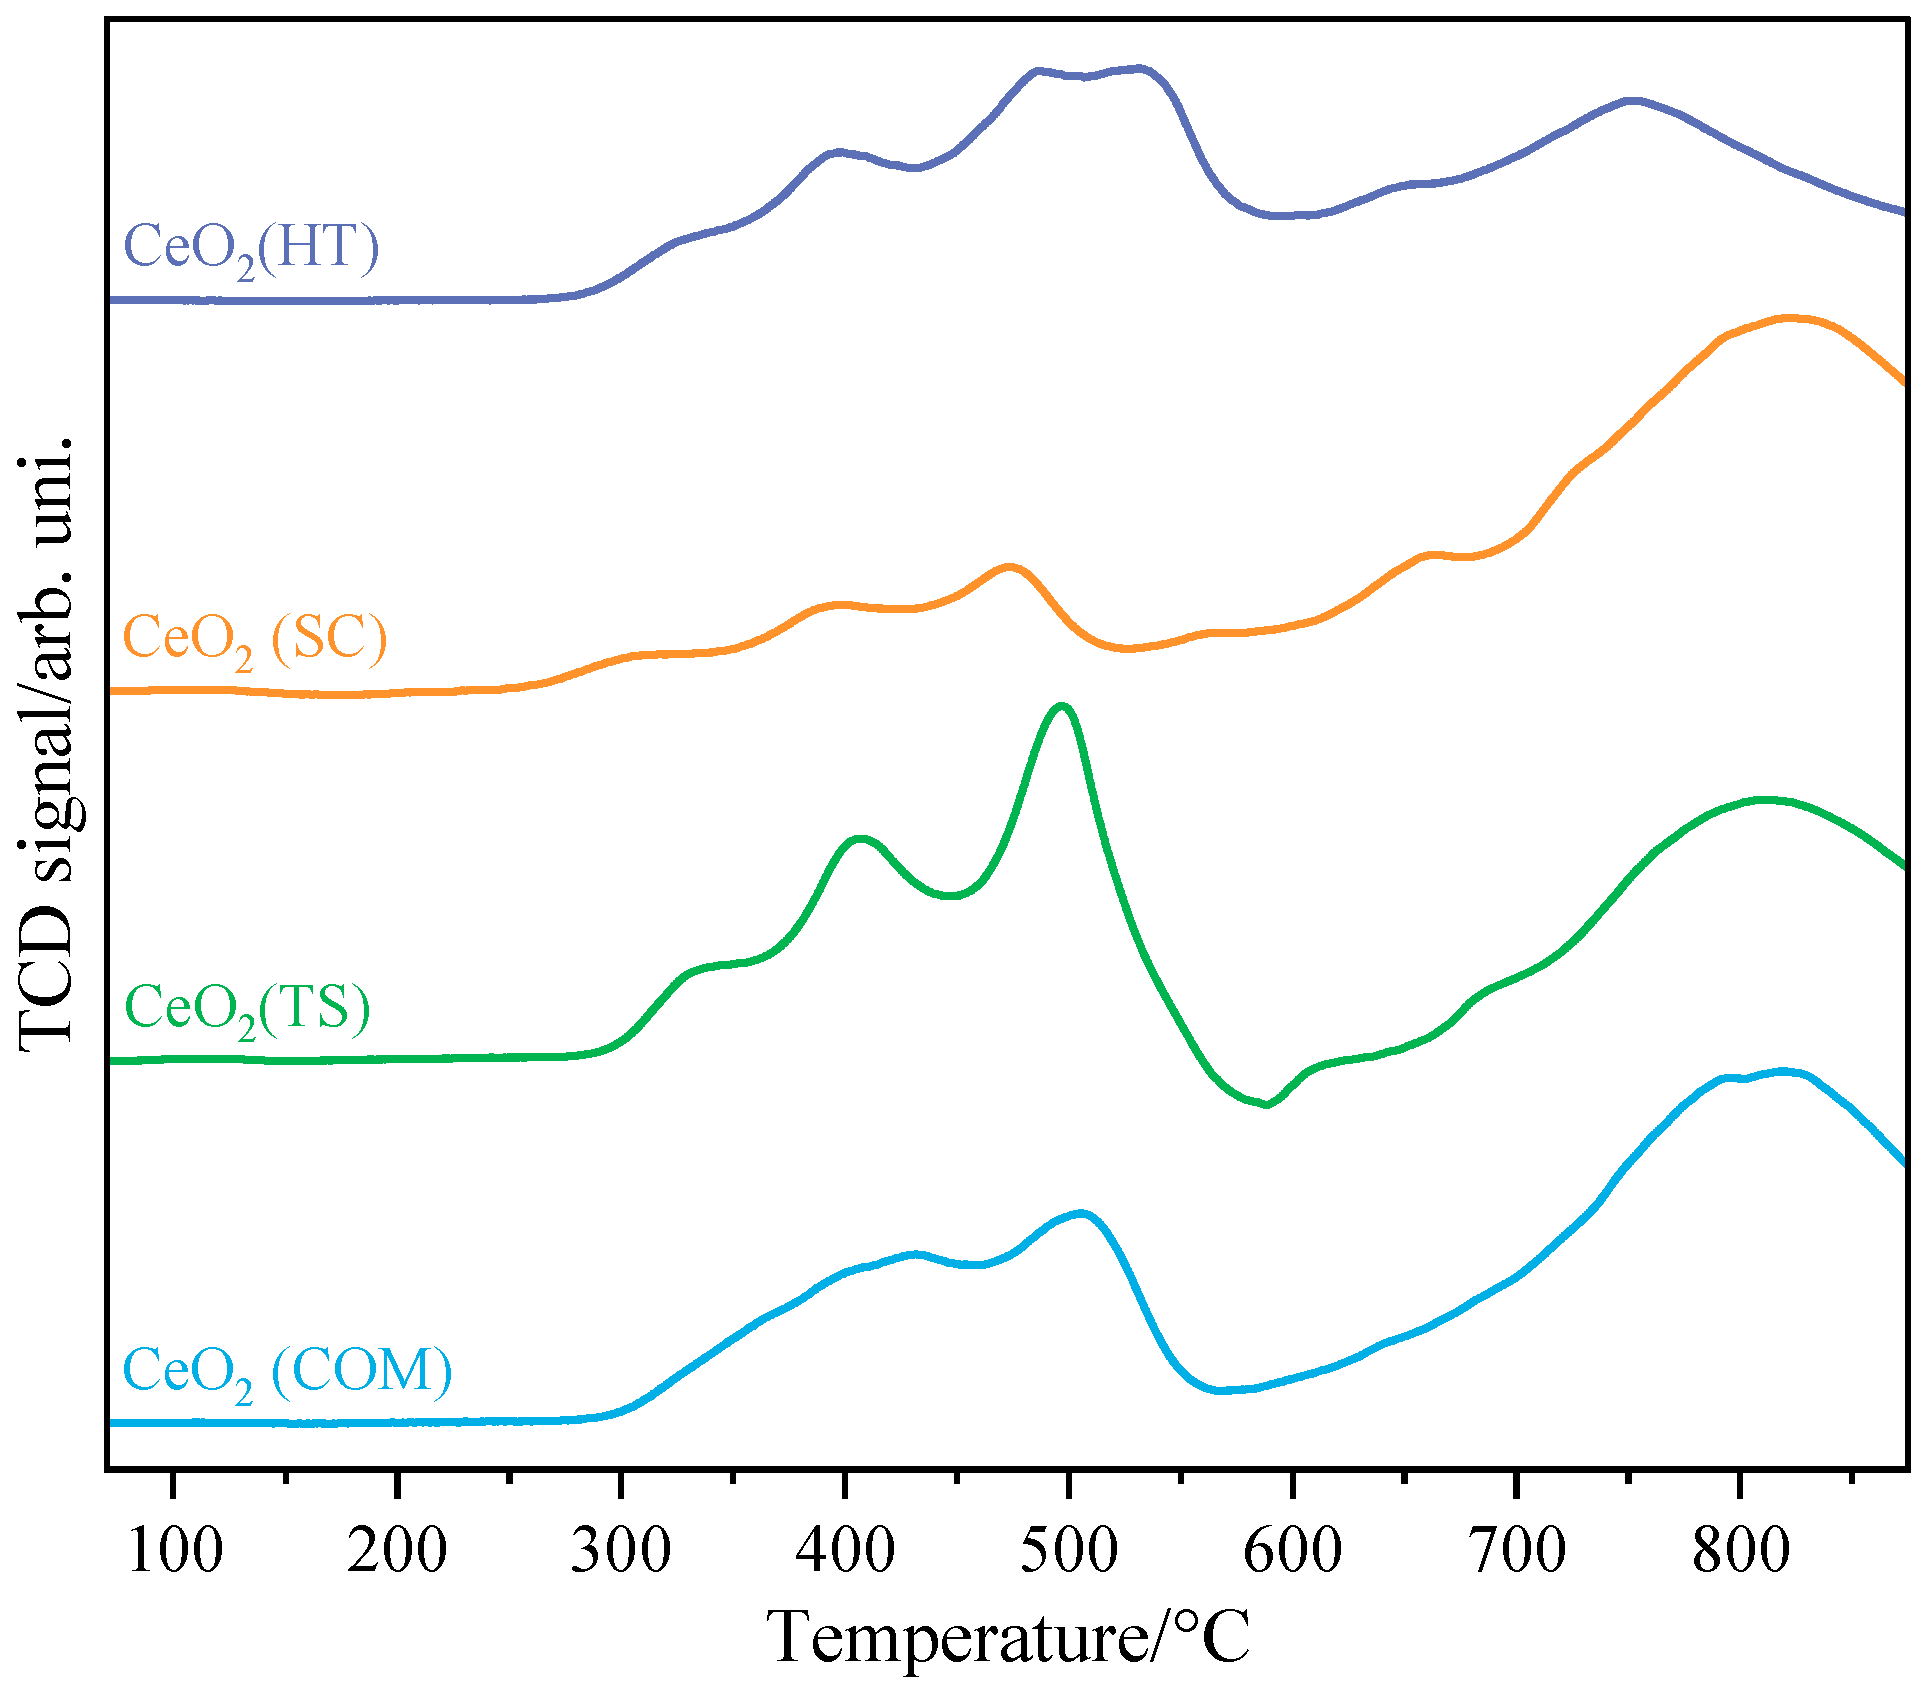
The results of temperature-programmed reduction by hydrogen of the investigated CeO2 samples are depicted in Figure 4. Two main regions can be visible in the obtained thermograms; the first one, in the temperature window of 250–500 °C, can be attributed to the reduction in the surface of CeO2, while the second one, above 600 °C, is related to the reduction in bulk CeO2 [29,30,31].
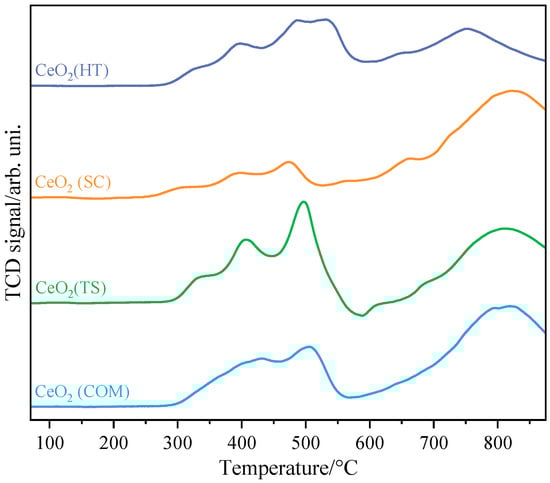
Figure 4.
H2-TPR profiles collected for CeO2(HT), CeO2(SC), CeO2(TS), and CeO2(COM) samples.
Analysis of the first region leads us to the statement that ceria obtained using the sonochemical and hydrothermal methods exhibited the lowest threshold temperatures for reduction (around 250 °C), while the commercial sample, as well as the one obtained using hard template synthesis, started to be reduced at distinctly higher temperatures (around 300 °C). Moreover, the first group of samples exhibited more complex reduction behavior, which suggests more complex oxygen mobility dependent on sample preparation history [32].
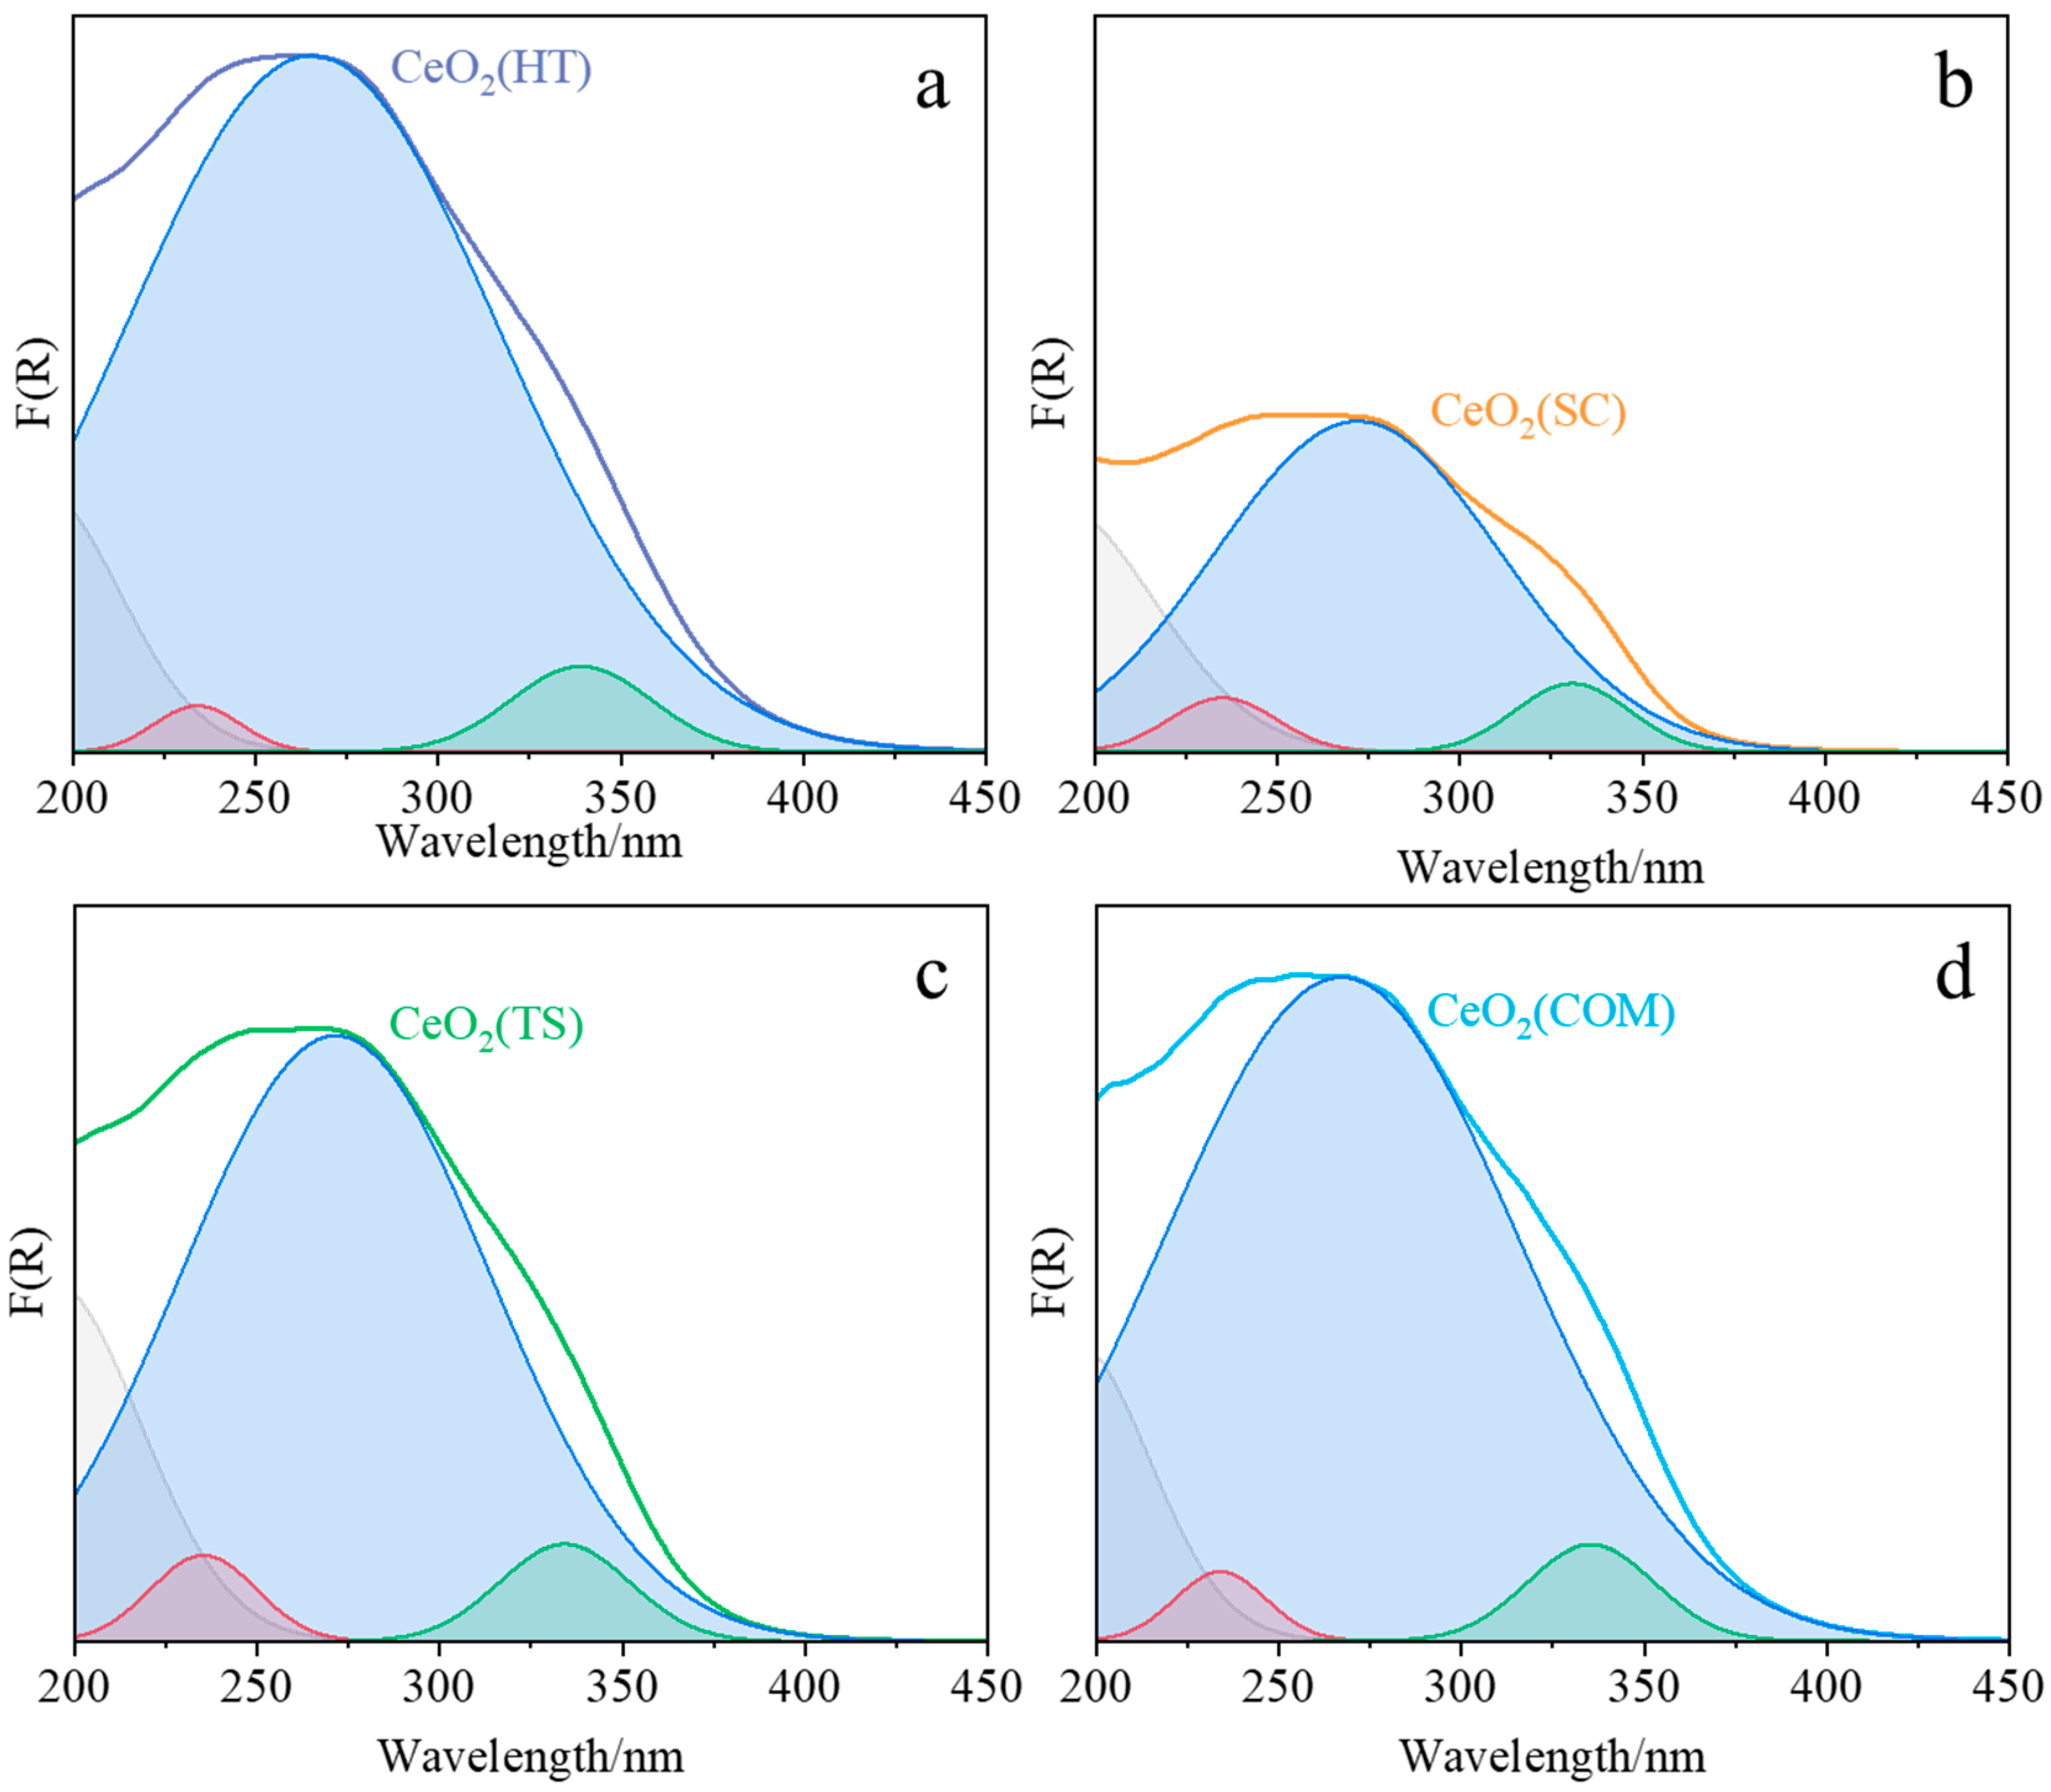
The XRD, Raman, and H2-TPR characterization results were complemented by UV/Vis-DR spectroscopic studies (Figure 5 and Table 2). The observed maxima of the bands attributed to the ligand-to-metal charge transfer Ce3+ ← O2− and Ce4+ ← O2− transitions were determined in the ranges of 232–235 nm and 260–272 nm, respectively, which remains in agreement with the literature [33,34]. Similarly, the position of the observed interband transition, between 331 and 348 nm, agrees well with the literature data [33,34]. Based on the Tauc plots [35], the values of the band gap for each investigated ceria sample were estimated. The smallest value of the band gap was determined for CeO2(HT) and CeO2(COM) (both 3.48 eV), CeO2(TS) (3.52 eV), and CeO2 (SC) (3.53 eV).
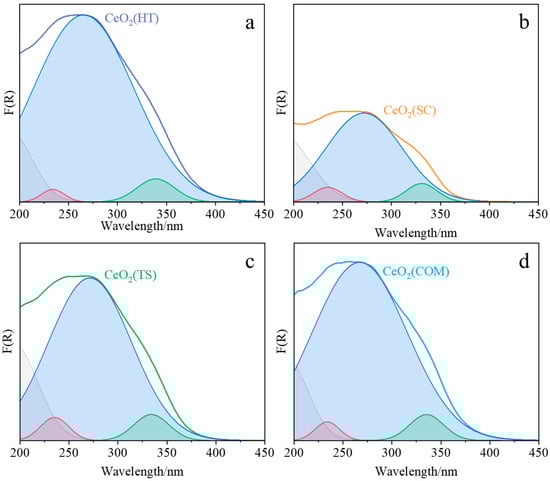
Figure 5.
DR UV–Vis spectra of CeO2(HT) (a), CeO2(SC) (b), CeO2(TS) (c), and CeO2(COM) (d) samples deconvoluted into individual peaks.
Table 2.
Parameters obtained after deconvolution of the UV/Vis-DR spectra and Tauc plots fitted for CeO2(HT), CeO2(SC), CeO2(TS), and CeO2(COM) samples.
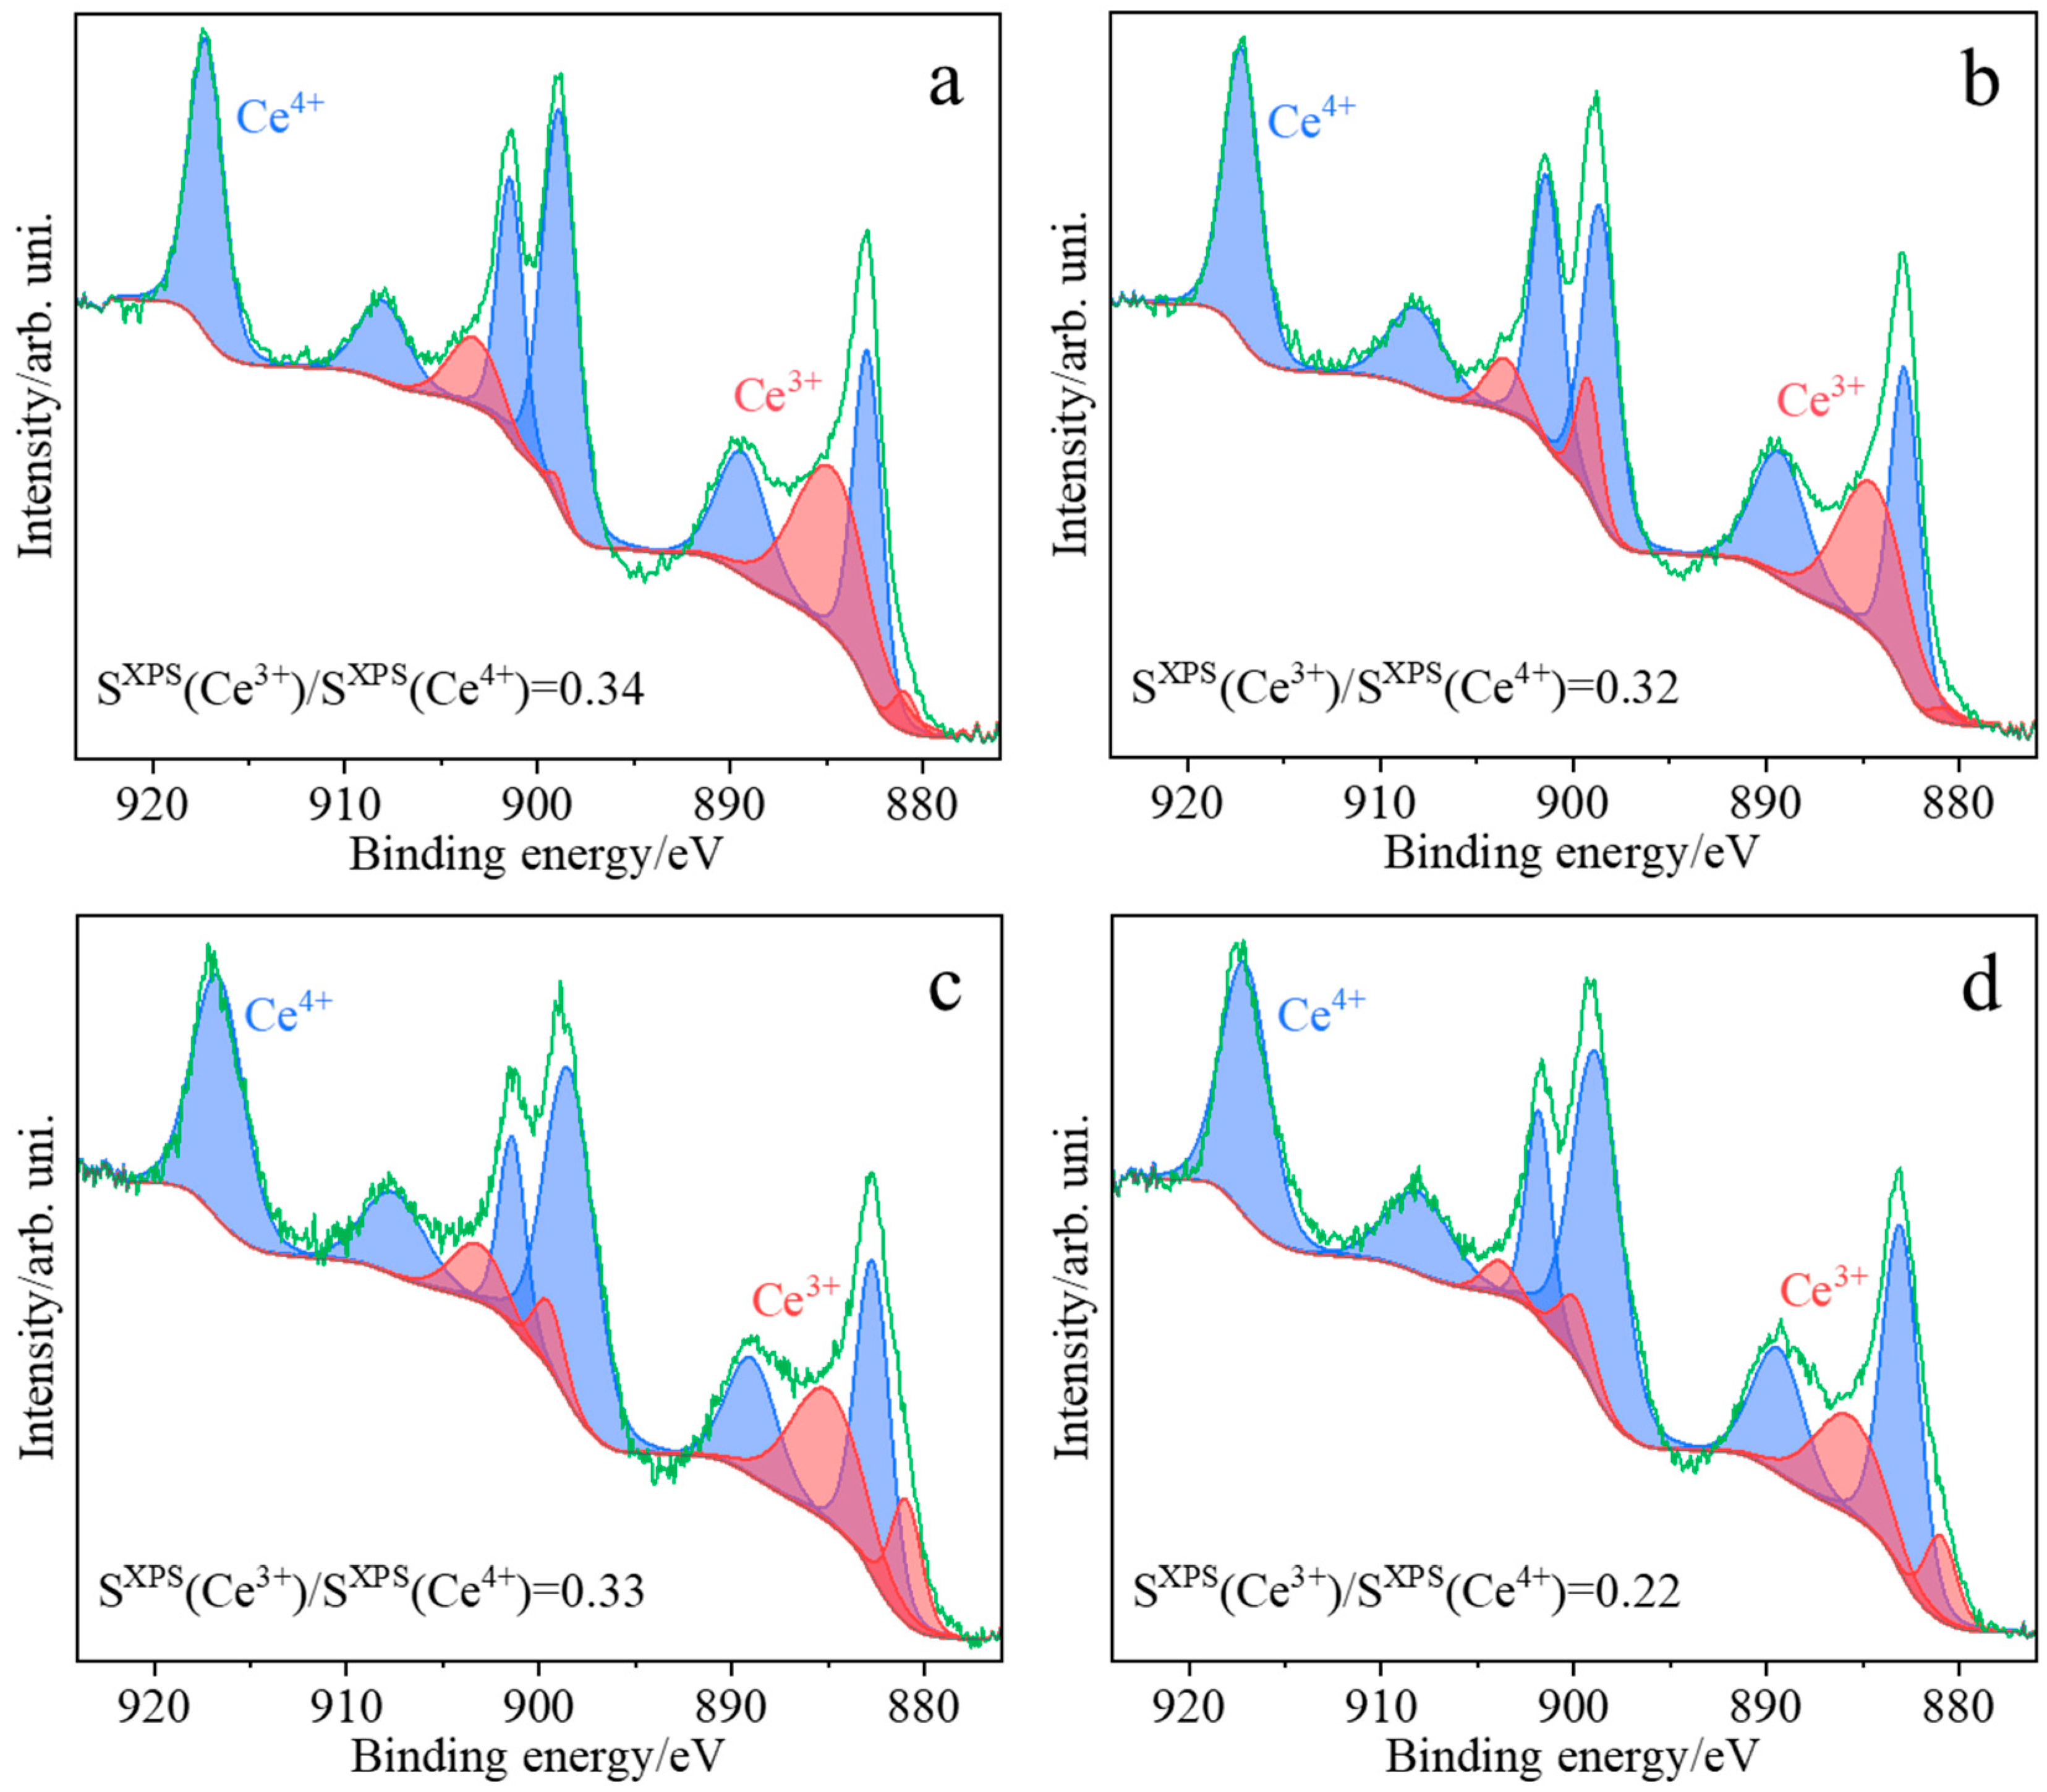
Based on the deconvoluted UV/Vis-DR spectra, the decreasing order of Ce3+/Ce4+ concentration ratios for ceria samples obtained by various methods can be proposed as follows: CeO2(SC) > CeO2(TS) > CeO2(COM) > CeO2(HT) (Table 2). In parallel, the XPS spectra confirm that both oxidation states of cerium, Ce4+ and Ce3+, coexist on the surfaces of all the investigated samples (Figure 6). However, a comparison of the order of Ce3+/Ce4+ concentration ratios based on UV/Vis-DR (Table 2) with that obtained from XPS spectra (Table 3): CeO2(HT) > CeO2(TS) > CeO2(SC) > CeO2(COM) suggests that the composition of the surface was different from that determined for the bulk.
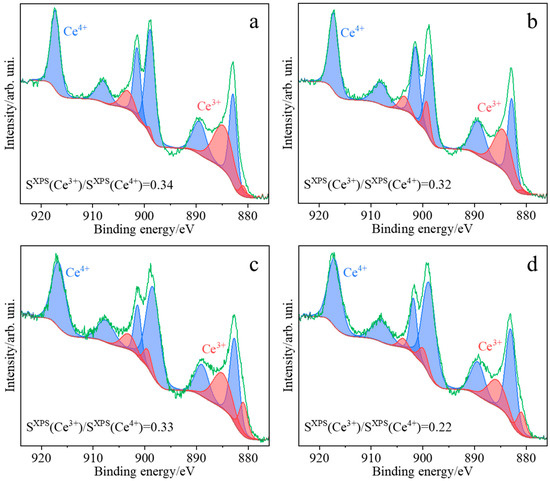
Figure 6.
XPS high-resolution spectra collected in the Ce 3d window for the investigated samples CeO2(HT) (a), CeO2(SC) (b), CeO2(TS) (c), and CeO2(COM) (d).
Table 3.
Atomic concentrations of elements detected in CeO2(HT), CeO2(SC), CeO2(TS), and CeO2(COM) samples by XPS spectra.
Ce3+/Ce4+ concentration ratios determined from deconvoluted XPS spectra distinctly differ for the samples synthesized via different preparation protocols. The samples obtained by hydrothermal synthesis (CeO2(HT)), hard template synthesis (CeO2(TS)), and sonochemical synthesis (CeO2(SC)) exhibited quite similar values of the Ce3+/Ce4+ ratio, at 0.34, 0.33, and 0.32, respectively, whereas the lowest value (0.22) was found for the commercial reference sample (CeO2(COM)). Based on the deconvolution of the O 1s region (Figure S1), it can be stated that the commercial reference sample exhibited the lowest ratio of the adsorbed oxygen to the lattice oxygen (0.18, see Table 3), while the remaining investigated samples can be ordered regarding their Oads/Olattice as CeO2(HT) and CeO2(TS) (0.25), and the highest Oads/Olattice ratio was found for CeO2(SC) (0.29). The ratio of total concentrations of cerium to oxygen is expected to be between 0.5 (for CeO2) and 0.66 (for Ce2O3). However, it should be noticed that the measured value of the Ce/O ratio is also affected by the presence of functional O-containing groups resulting from CO2 adsorption (carbon concentration varies from 20 to 50%) [36]. For most of the investigated samples, the determined Ce/O ratios (Table 3) are similar: 0.65 for CeO2(COM), 0.61 for CeO2(HT), and 0.59 for CeO2(SC). A significantly lower Ce/O ratio value was observed for the sample obtained using the hard template synthesis (0.18).
2.2. The Activity of the Ceria-Based Catalyst in the Soot Combustion Process
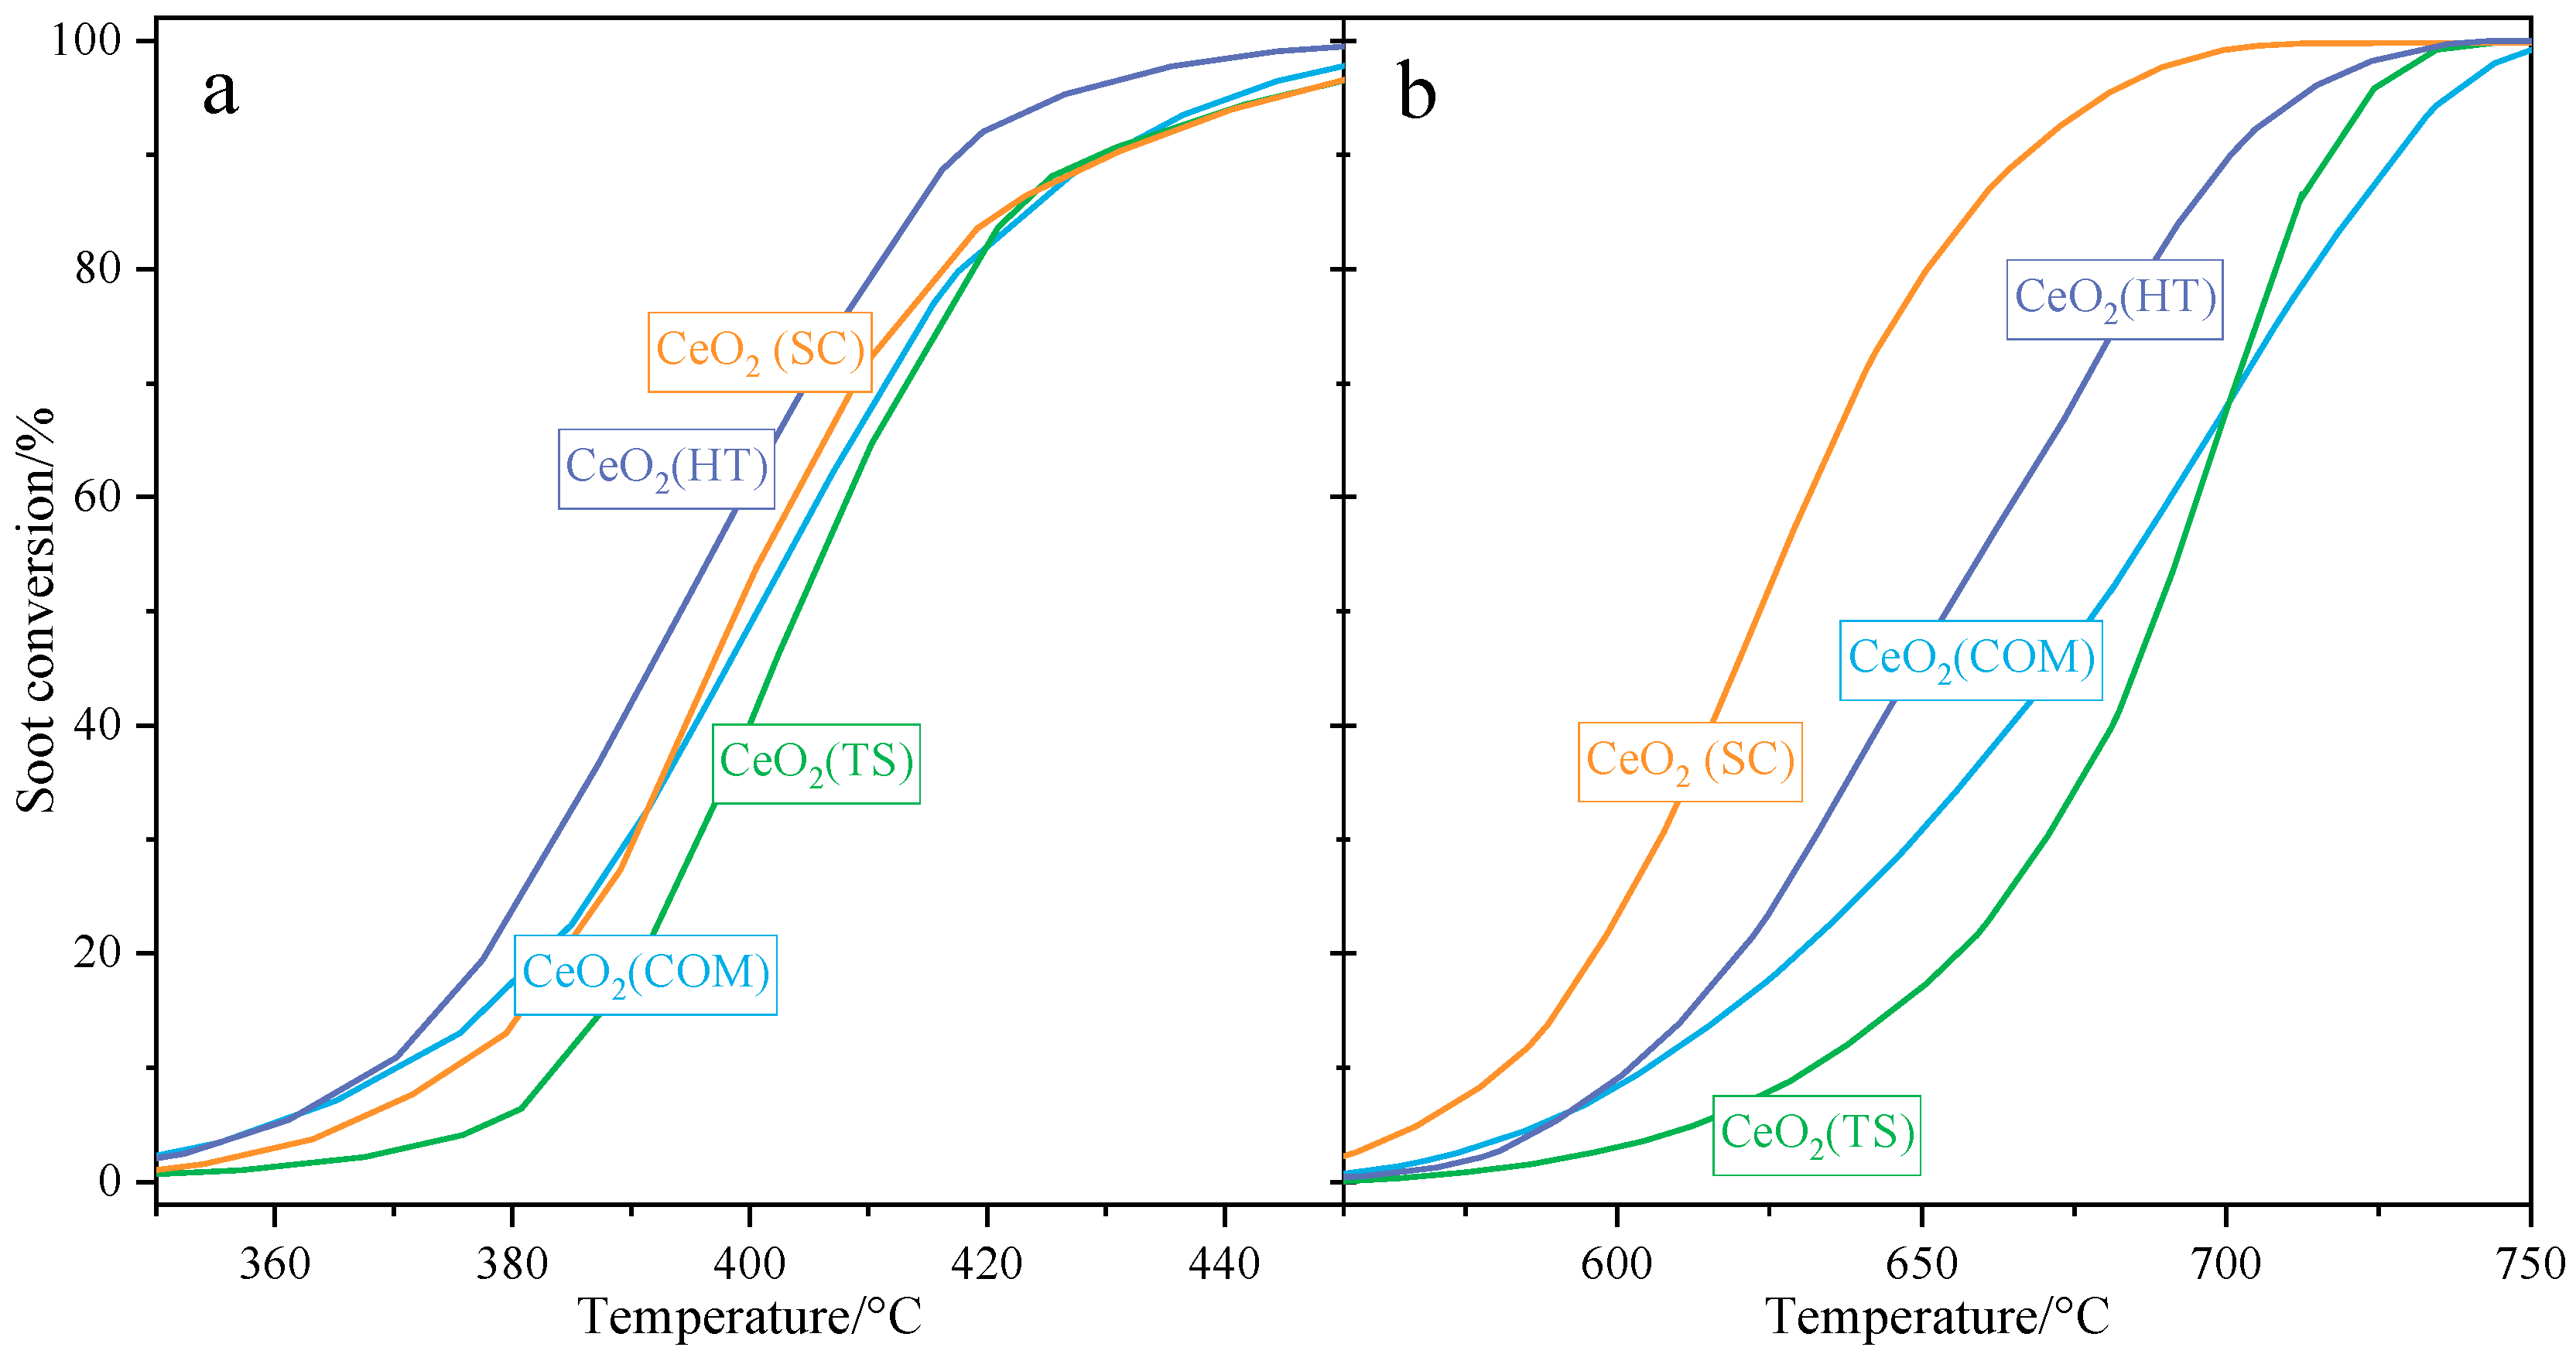
Figure 7 below presents a comparison of the catalytic activities determined for ceria-based catalysts in both tight (a) and loose (b) contact modes. In tight contact mode, the CeO2(HT) catalyst exhibited the highest activity (T50 = 394 °C). Meanwhile, the remaining ceria samples showed similar, slightly lower activities (T50 ≈ 400 °C). In loose contact mode, the activity trend changed. For the CeO2(SC) sample, the highest catalytic performance was observed (T5% = 623 °C), followed by that for CeO2(HT) (T50 = 654 °C). The activities determined for CeO2(TS) and for the commercial CeO2 samples were slightly lower, with T50 values of 689 °C and 679 °C, respectively. Based on the obtained results, it can be stated that all investigated samples showed a high degree of catalytic activities compared to the literature [10,37,38,39,40,41,42,43] and can be a promising premise for further optimization. Moreover, the catalysts studied showed almost 100% selectivity for CO2.
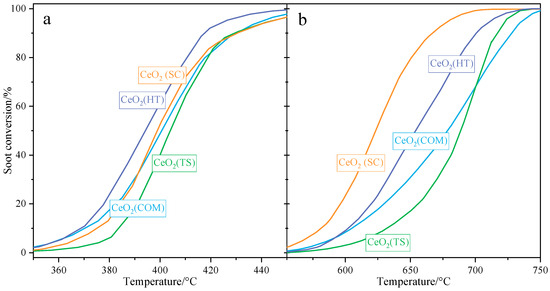
Figure 7.
Results of catalytic tests in soot oxidation (TPO-QMS) over CeO2(HT), CeO2(SC), CeO2(TS), and CeO2(COM) samples performed in tight (a) and loose (b) contact, respectively.
The active oxygen involved in soot combustion originates from both gaseous O2 and lattice O2− within the catalyst. The activation of gaseous O2 is strongly influenced by oxygen vacancies, while the generation of active lattice O2− depends on its mobility within the catalyst structure.
On ceria surfaces, gaseous O2 molecules accept electrons from Ce3+ ions associated with oxygen vacancies, forming active oxygen species such as O2− and O− (reaction 1). Consequently, soot can be oxidized by active oxygen species migrating from the catalyst’s surface (reaction 2). Also, the surface lattice O2− can react with free carbon atoms in soot, reducing Ce4+ to Ce3+ (reaction 3). Additionally, highly mobile bulk lattice O2− can migrate to the surface of ceria [18,44,45,46,47,48,49,50].
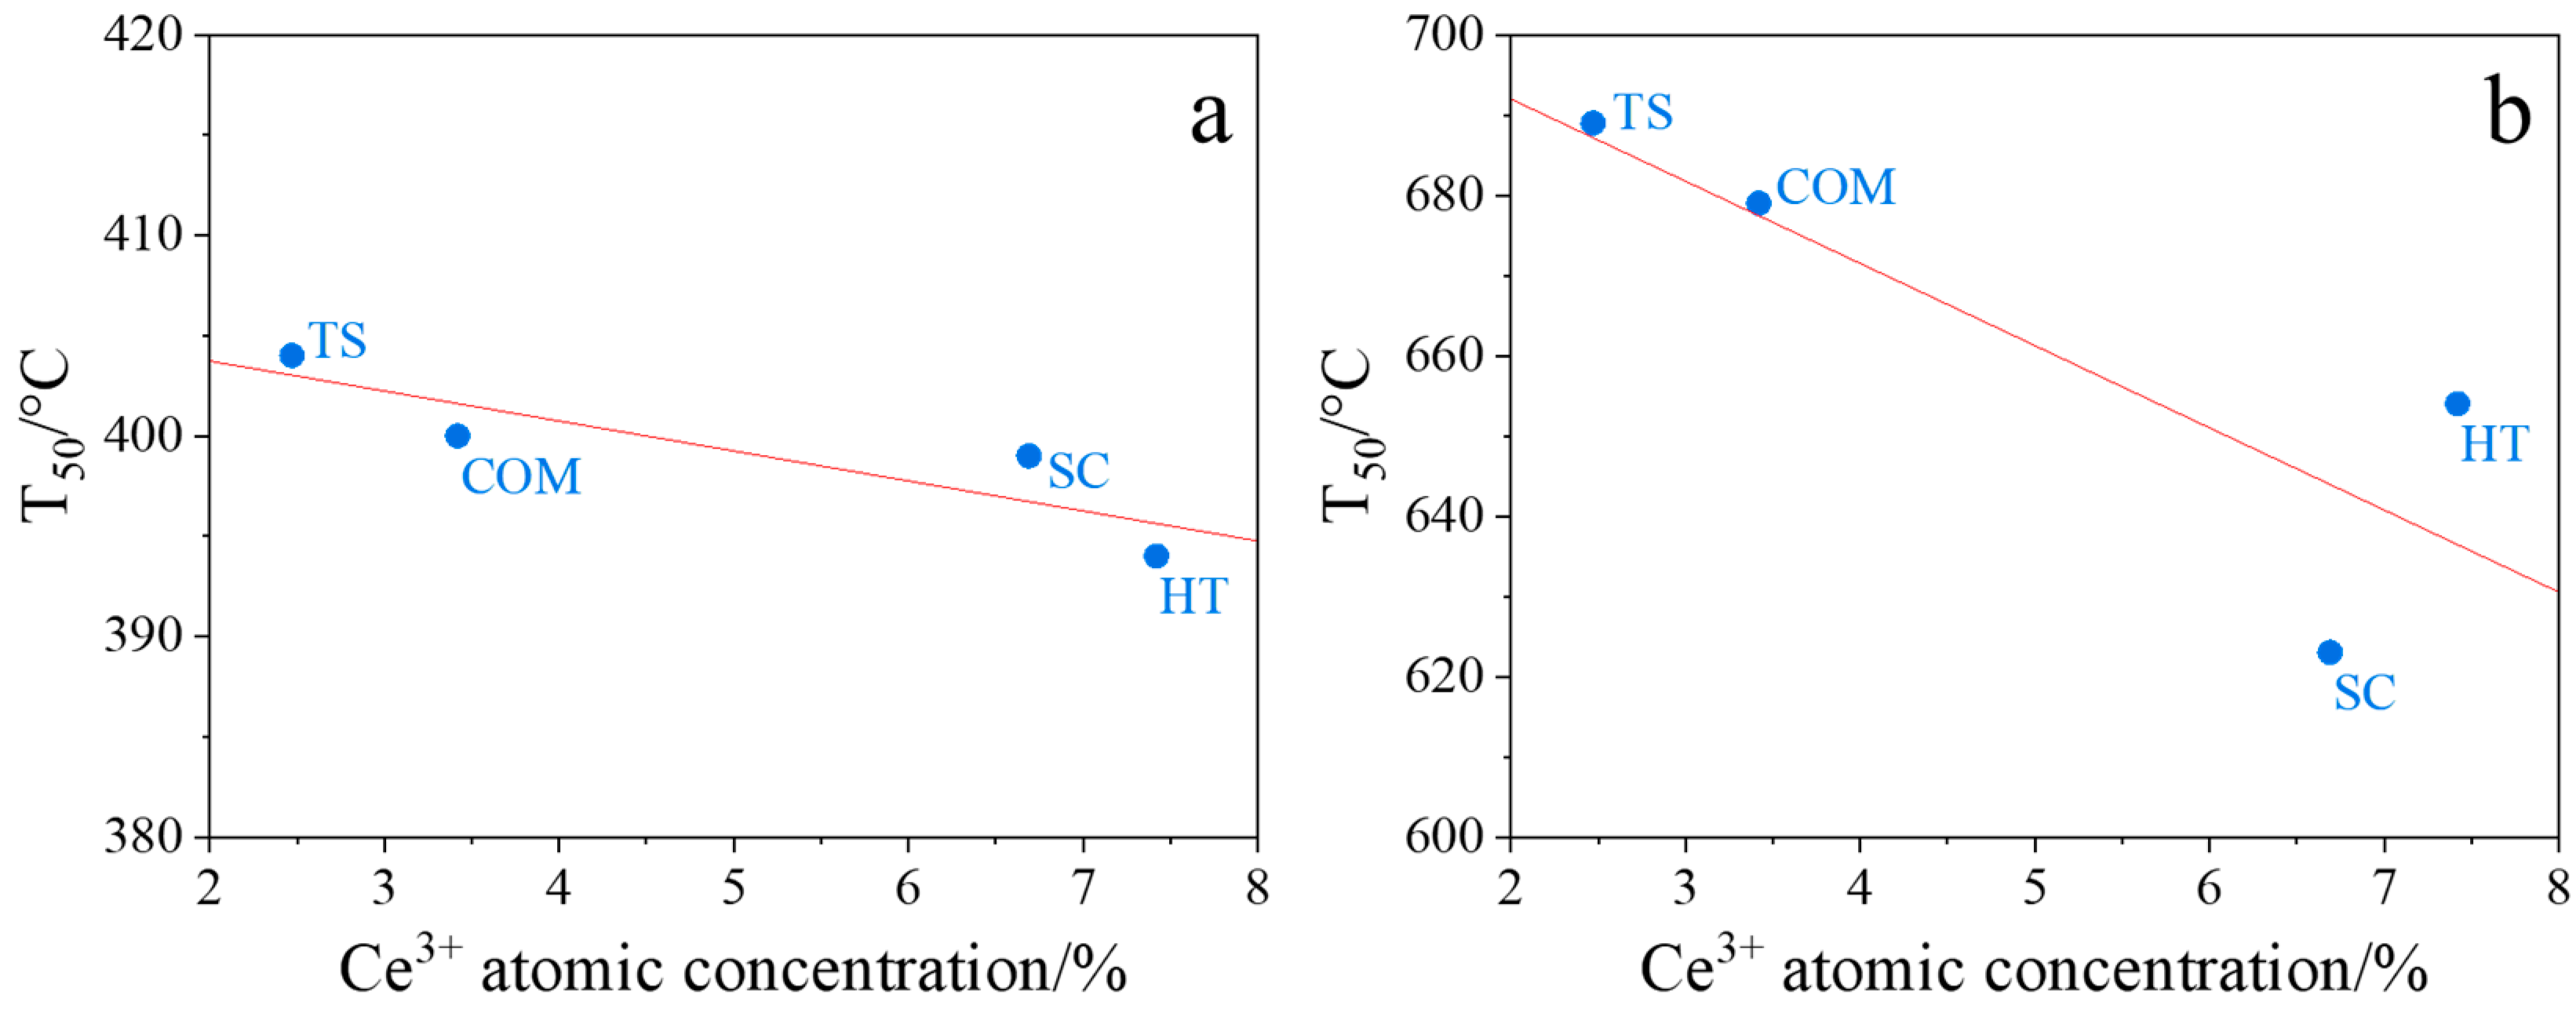
Our studies in tight and loose contact modes revealed a correlation between the soot combustion performance of ceria oxides and the corresponding Ce3+ concentrations, determined from XPS spectra (Table 3). As can be seen in Figure 8, CeO2(HT) and CeO2(SC) samples, which exhibit the highest Ce3+ concentration, also showed the highest activity in soot combustion (the lowest T50 value, Table 4). Therefore, the most accepted mechanism for soot combustion over studied CeO2 samples relies on the reduction of O2 molecules during a catalytic redox reaction by the Ce3+ cations acting as a reservoir of electrons.
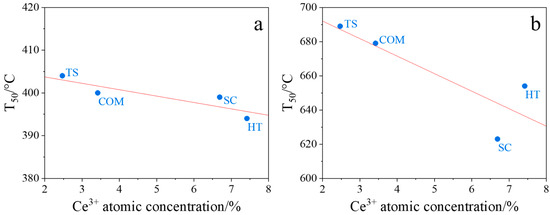
Figure 8.
Correlations between the temperature of 50% soot conversion in tight (a) and loose (b) contact modes and the Ce3+ concentrations from XPS measurements for CeO2(HT), CeO2(SC), CeO2(TS), and CeO2(COM) samples.
Table 4.
The catalytic activity parameters determined for the investigated ceria samples tested in soot combustion.
3. Materials and Methods
3.1. Catalyst Preparation
In this study, cerium oxide was prepared from a Ce(NO3)3∙6H2O (Merck, Darmstadt, Germany, 99.99%) precursor using various techniques, i.e., hydrothermal synthesis—CeO2(HT); sonochemical synthesis—CeO2(SC); thermal decomposition—CeO2(TD); and hard template synthesis—CeO2(TS). For comparison, commercially purchased cerium oxide—CeO2(COM) (Sigma-Aldrich, Saint Louis, MO, USA) was also examined.
3.1.1. Hydrothermal Synthesis
For the CeO2(HT) sample synthesis, the Ce(NO3)3∙6H2O precursor (Merck, Darmstadt, Germany, 99.99%) was dissolved in distilled water. During vigorous mixing, the NaOH solution (3 M) was subsequently added to obtain a precipitate of cerium hydroxide, and stirring was continued for 30 min. Then, the suspension was transferred to a stainless-steel autoclave with a Teflon lining before being heated for 24 h at 150 °C. After cooling, the obtained yellow-white powder was centrifuged and washed three times with water and ethanol. The catalyst was dried overnight at 80 °C and finally calcinated for 4 h at 500 °C.
3.1.2. Sonochemical Synthesis
For the CeO2(TD) sample synthesis, an ultrasonic probe with a diameter of 12 mm was used to sonicate the aqueous solution of Ce(NO3)3 (Merck, Darmstadt, Germany) for an hour (20 kHz, 500 W, amplitude 20%). Directly after starting the sonication, 3 mL of 25% ammonia solution was added dropwise to obtain a precipitate of cerium hydroxide. Subsequently, the suspension was centrifuged and dried overnight at 60 °C. Finally, the catalyst was calcinated for 4 h at 500 °C.
3.1.3. Template Synthesis
The cerium oxide CeO2(TS) was produced according to the slightly modified process described in [27]. In brief, deionized water-washed, vacuum-dried, and sieved Amberlite XAD7HP beads (Supelco, Sigma-Aldrich, Saint Louis, MO, USA) with a diameter of >0.5 µm were swollen in an aqueous solution of 45% w/w cerium (III) nitrate hexahydrate (Aldrich, Darmstadt, Germany) at room temperature. The polymer absorbs approx. 3 times its dry mass and increases its volume. The swollen polymer beads were calcined for 4 h at 500 °C at a heating rate of 1 °C/min in an air atmosphere before being cooled to room temperature [23].
3.1.4. Commercial Cerium Oxide
Commercial cerium oxide was purchased from Sigma-Aldrich (Saint Louis, MO, USA) (544841-5G).
3.2. Characterization of Materials
The phase composition was analyzed via X-ray diffraction (XRD) using a Rigaku Multiflex diffractometer with CuKα radiation (λ = 1.54 Å, 2θ: 5–90°, step: 0.02°, 2°/min) (Rigaku Corporation, Tokyo, Japan). The Raman spectra measurements were carried out using Renishaw InVia Qontor Raman Confocal Microscope (Renishaw, Wotton-under-Edge, Gloucestershire, UK). The samples were analyzed under magnification of 50 times. A laser with a wavelength of 785 nm and 0.5% of the total power was applied. The samples were exposed to laser radiation for 5 s. To obtain a desirable signal-to-noise ratio, 9 scans were accumulated. Each sample’s Raman spectra were collected at 5 different measurement points, and the Raman spectra obtained at different locations confirmed the samples’ homogeneity.
Catalyst imaging was carried out using a Quanta 3D FEG scanning electron microscope (SEM, FEI) (FEI Company, Hillsboro, OR, USA) with samples mounted on aluminum supported with carbon conductive tape and analyzed at 30 kV. Detailed morphological characterization was conducted using a Titan G2 scanning transmission electron microscope (TEM, FEI) (FEI Company, Hillsboro, OR, USA) at 300 kV. Element distribution was mapped via energy dispersion X-ray spectroscopy (EDX) in scanning TEM mode (STEM).
Spectra in the ultraviolet and visible regions in the diffuse reflectance mode (UV/Vis-DR) were collected by Lambda 650 (Perkin Elmer, Waltham, MA, USA) with the Praying Mantis (Harrick Scientific Products, New York, NY, USA) device. The experiments were performed in ambient conditions in the range of 200–900 nm, with a resolution of 1 nm. Spectra were converted according to the Kubelka–Munk equation and deconvoluted with Fityk software (version number: 0.8.0). A Tauc plot was used to determine the band gap.
Temperature-programmed reduction by hydrogen (H2-TPR) was performed in a quartz-tube reactor with a fixed bed. An amount of 50 mg of the sample was placed in the reactor and degassed in helium at 300 °C for 30 min. Then, the sample was cooled, and the gas mixture was changed to 5% H2 in Ar with a flow of 50 mL/min. Tests were performed for room temperature to 920 °C with a ramp of 5 °C/min. Changes in hydrogen concentration were monitored using a thermal conductivity detector (TCD, Agilent, Santa Clara, CA, USA).
X-ray photoelectron spectroscopy (XPS) studies were conducted using a PREVAC multi-chamber ultra-high vacuum system (PREVAC, Rogów, Poland) with a Scienta R4000 analyzer (Gammadata Scienta, Uppsala, Sweden). Spectra were collected using a Scienta SAX-100 X-ray source (Al Kα, 1486.6 eV) (Scienta Omicron AB, Uppsala, Sweden) and XM 650 Monochromator (Scienta Omicron AB, Uppsala, Sweden). Survey spectra were recorded at 200 eV pass energy (500 meV step) and high-resolution spectra (Ce 3d, O 1s, C 1s) at 50 eV pass energy (50–100 meV step). The base pressure was 5 × 10⁻⁹ mbar. Data analysis was performed with CasaXPS software (v2.3.23 PR1.0).
3.3. Catalytic Activity
The catalytic activity of the samples was measured in the reaction of model soot oxidation. An amount of 50 mg of a catalyst was mixed with 5 mg of soot (Printex U, Evonik Industries, Essen, Germany). In the case of tight contact mode, the mixture was ground in an agate mortar for 10 min; in the case of loose contact mode, a catalyst was shaken with soot in an Eppendorf probe for a minute. The prepared mixtures were placed in a quartz U-tube in a 5% oxygen flow in helium and heated at room temperature from a rate of 10 °C/min to 900 °C. The process of soot oxidation was monitored by probing the exhaust gases with a quadrupole mass spectrometer. The analyzed molecules included O2, CO2, CO, H2O, NO, and NO2. Because the observed low MS signal attributed to CO originates from CO2 fragmentation (according to Hiden Analytical, 11% of the CO2 signal corresponds in the MS spectra to CO, its fragmentation product), CO2 was thus regarded to be the only product of soot combustion.
4. Conclusions
A series of ceria materials were synthesized using various methods and analyzed in detail using XRD, Raman spectroscopy, UV-Vis, XPS, H2-TPR, SEM, and TEM techniques. Their catalytic behavior in soot combustion was investigated. Systematic research demonstrated that the catalytic activity of CeO2 in soot combustion can be effectively tailored using the appropriate method of synthesis. Hydrothermal synthesis (HT) and sonochemical synthesis (SC) produced CeO2 materials with more promising catalytic properties. All of them showed 50% soot conversions at temperatures below 400 °C in tight contact mode, demonstrating superior catalytic performance in comparison to the commercial CeO2 (COM) and CeO2(TS) samples. A clear correlation was established between Ce3+ concentration (as determined by XPS) and soot combustion performance. Higher Ce3+ concentrations were associated with enhanced catalytic activity. These findings highlight the importance of synthesis methods in optimizing ceria-based catalysts for environmental applications.
Supplementary Materials
The following supporting information can be downloaded at https://www.mdpi.com/article/10.3390/molecules30020358/s1. Figure S1. XPS high-resolution spectra collected in O 1s window for the investigated samples: CeO2(HT) (a), CeO2(SC) (b), CeO2(TS) (c) and CeO2(COM) (d). Figure S2. Survey XPS spectra collected for the investigated samples: CeO2(HT) (a), CeO2(SC) (b), CeO2(TS) (c) and CeO2(COM) (d).
Author Contributions
Conceptualization, G.G.; methodology, G.G, A.S., P.L. and G.S.; formal analysis, G.G, M.G. and P.L.; investigation, A.W., P.L, G.G. and G.S.; resources, G.G.; data curation, A.W., P.L. and G.G.; writing—original draft preparation, A.W., P.L. and G.G.; writing—review and editing, G.G., A.A. and A.K.; visualization, A.W.; supervision G.G.; project administration, G.G.; funding acquisition, G.G. All authors have read and agreed to the published version of the manuscript.
Funding
This research was funded by grant no. 2021/43/D/ST4/03016 from the National Science Centre, Poland.
Institutional Review Board Statement
Not applicable.
Informed Consent Statement
Not applicable.
Data Availability Statement
The data will be available upon request.
Acknowledgments
The Raman spectra were carried out using research infrastructure funded by the European Union in the framework of the Smart Growth Operational Programme, Measure 4.2; Grant No. POIR.04.02.00-00-D001/20, “ATOMIN 2.0—Center for materials research on ATOMic scale for the INnovative economy”.
Conflicts of Interest
The authors declare no conflicts of interest.
References
- Tang, R.; Shang, J.; Qiu, X.; Gong, J.; Xue, T.; Zhu, T. Origin, Structural Characteristics, and Health Effects of Atmospheric Soot Particles: A Review. Curr. Pollut. Rep. 2024, 10, 532–547. [Google Scholar] [CrossRef]
- Das, A.; Pantzke, J.; Jeong, S.; Hartner, E.; Zimmermann, E.J.; Gawlitta, N.; Offer, S.; Shukla, D.; Huber, A.; Rastak, N.; et al. Generation, Characterization, and Toxicological Assessment of Reference Ultrafine Soot Particles with Different Organic Content for Inhalation Toxicological Studies. Sci. Total Environ. 2024, 951, 175727. [Google Scholar] [CrossRef]
- Li, W.; Riemer, N.; Xu, L.; Wang, Y.; Adachi, K.; Shi, Z.; Zhang, D.; Zheng, Z.; Laskin, A. Microphysical Properties of Atmospheric Soot and Organic Particles: Measurements, Modeling, and Impacts. NPJ Clim. Atmos. Sci. 2024, 7, 65. [Google Scholar] [CrossRef]
- World Health Organization. WHO Global Air Quality Guidelines. Particulate Matter (PM2.5 and PM10), Ozone, Nitrogen Dioxide, Sulfur Dioxide and Carbon Monoxide; World Health Organization: Geneva, Switzerland, 2021. [Google Scholar]
- Zuhra, Z.; Li, S.; Xie, G.; Wang, X. Soot Erased: Catalysts and Their Mechanistic Chemistry. Molecules 2023, 28, 6884. [Google Scholar] [CrossRef]
- Wu, K.; Sun, L.D.; Yan, C.H. Recent Progress in Well-Controlled Synthesis of Ceria-Based Nanocatalysts towards Enhanced Catalytic Performance. Adv. Energy Mater. 2016, 6, 1600501. [Google Scholar] [CrossRef]
- Putla, S.B.; Kamali, M.; Swapna, B.; Reddy, B.M.; Sudarsanam, P. Review of Shape-Controlled CeO2 Nanocatalysts for Purification of Auto-Exhaust Pollutants. ACS Appl. Nano Mater. 2024, 7, 6749–6771. [Google Scholar] [CrossRef]
- Liu, S.; Wu, X.; Weng, D.; Ran, R. Ceria-Based Catalysts for Soot Oxidation: A Review. J. Rare Earths 2015, 33, 567–590. [Google Scholar] [CrossRef]
- Mishra, U.K.; Chandel, V.S.; Singh, O.P. A Review on Cerium Oxide–Based Catalysts for the Removal of Contaminants. Emergent Mater. 2022, 5, 1443–1476. [Google Scholar] [CrossRef]
- Legutko, P.; Stelmachowski, P.; Yu, X.; Zhao, Z.; Sojka, Z.; Kotarba, A. Catalytic Soot Combustion—General Concepts and Alkali Promotion. ACS Catal. 2023, 13, 3395–3418. [Google Scholar] [CrossRef]
- Aneggi, E.; Wiater, D.; De Leitenburg, C.; Llorca, J.; Trovarelli, A. Shape-Dependent Activity of Ceria in Soot Combustion. ACS Catal. 2014, 4, 172–181. [Google Scholar] [CrossRef]
- Miceli, P.; Bensaid, S.; Russo, N.; Fino, D. CeO2-Based Catalysts with Engineered Morphologies for Soot Oxidation to Enhance Soot-Catalyst Contact. Nanoscale Res. Lett. 2014, 9, 254. [Google Scholar] [CrossRef] [PubMed]
- Piumetti, M.; Bensaid, S.; Russo, N.; Fino, D. Nanostructured Ceria-Based Catalysts for Soot Combustion: Investigations on the Surface Sensitivity. Appl. Catal. B 2015, 165, 742–751. [Google Scholar] [CrossRef]
- Piumetti, M.; Bensaid, S.; Andana, T.; Dosa, M.; Novara, C.; Giorgis, F.; Russo, N.; Fino, D. Nanostructured Ceria-Based Materials: Effect of the Hydrothermal Synthesis Conditions on the Structural Properties and Catalytic Activity. Catalysts 2017, 7, 174. [Google Scholar] [CrossRef]
- Bensaid, S.; Russo, N.; Fino, D. CeO2 Catalysts with Fibrous Morphology for Soot Oxidation: The Importance of the Soot-Catalyst Contact Conditions. Catal. Today 2013, 216, 57–63. [Google Scholar] [CrossRef]
- Kumar, P.A.; Tanwar, M.D.; Bensaid, S.; Russo, N.; Fino, D. Soot Combustion Improvement in Diesel Particulate Filters Catalyzed with Ceria Nanofibers. Chem. Eng. J. 2012, 207–208, 258–266. [Google Scholar] [CrossRef]
- Piumetti, M.; van der Linden, B.; Makkee, M.; Miceli, P.; Fino, D.; Russo, N.; Bensaid, S. Contact Dynamics for a Solid-Solid Reaction Mediated by Gas-Phase Oxygen: Study on the Soot Oxidation over Ceria-Based Catalysts. Appl. Catal. B 2016, 199, 96–107. [Google Scholar] [CrossRef]
- Miceli, P.; Bensaid, S.; Russo, N.; Fino, D. Effect of the Morphological and Surface Properties of CeO2-Based Catalysts on the Soot Oxidation Activity. Chem. Eng. J. 2015, 278, 190–198. [Google Scholar] [CrossRef]
- Legutko, P.; Gryboś, J.; Fedyna, M.; Janas, J.; Wach, A.; Szlachetko, J.; Adamski, A.; Yu, X.; Zhao, Z.; Kotarba, A.; et al. Soot Combustion over Niobium-Doped Cryptomelane (K-OMS-2) Nanorods—Redox State of Manganese and the Lattice Strain Control the Catalysts Performance. Catalysts 2020, 10, 1390. [Google Scholar] [CrossRef]
- Leonardi, S.A.; Tuler, F.E.; Gaigneaux, E.M.; Debecker, D.P.; Miró, E.E.; Milt, V.G. Novel Ceramic Paper Structures for Diesel Exhaust Purification. Environ. Sci. Pollut. Res. 2018, 25, 35276–35286. [Google Scholar] [CrossRef]
- Cooper, A.; Davies, T.E.; Morgan, D.J.; Golunski, S.; Taylor, S.H. Influence of the Preparation Method of Ag-K/CeO2-ZrO2-Al2O3 Catalysts on Their Structure and Activity for the Simultaneous Removal of Soot and Nox. Catalysts 2020, 10, 294. [Google Scholar] [CrossRef]
- Wang, K.; Guan, B.; Li, K.; Zhan, R.; Lin, H.; Huang, Z. Study on Oxidation Activity of CuCeZrOx Doped with K for Diesel Engine Particles in NO/O2. J. Shanghai Jiaotong Univ. Sci. 2018, 23, 18–27. [Google Scholar] [CrossRef]
- Wu, Z.; Li, M.; Howe, J.; Meyer, H.M.; Overbury, S.H. Probing Defect Sites on CeO2 Nanocrystals with Well-Defined Surface Planes by Raman Spectroscopy and O2 Adsorption. Langmuir 2010, 26, 16595–16606. [Google Scholar] [CrossRef] [PubMed]
- Weber, W.H.; Bass, K.C.; McBride, J.R. Raman study of CeO2. Second-order scattering, lattice dynamics, and particle-size effects. Phys. Rev. B 1993, 48, 178–185. [Google Scholar] [CrossRef] [PubMed]
- Agarwal, S.; Zhu, X.; Hensen, E.J.M.; Lefferts, L.; Mojet, B.L. Defect Chemistry of Ceria Nanorods. J. Phys. Chem. C 2014, 118, 4131–4142. [Google Scholar] [CrossRef]
- Sartoretti, E.; Novara, C.; Giorgis, F.; Piumetti, M.; Bensaid, S.; Russo, N.; Fino, D. In situ Raman analyses of the soot oxidation reaction over nanostructured ceria-based catalyst. Sci. Rep. 2019, 9, 3875. [Google Scholar] [CrossRef] [PubMed]
- Sartoretti, E.; Novara, C.; Paganini, M.C.; Chiesa, M.; Castellino, M.; Giorgis, F.; Piumetti, M.; Bensaid, S.; Fino, D.; Russo, N. Investigation of Cu-doped ceria through a combined spectroscopic approach: Involvement of different catalytic sites in CO oxidation. Catal. Today 2023, 420, 114037. [Google Scholar] [CrossRef]
- Sienkiewicz, A.; Kierys, A. Polymer Templated Production of Highly Porous Cerium Oxide in Direct Temperature Driven Transformation of Cerium(III) Salt. Microporous Mesoporous Mater. 2021, 318, 111032. [Google Scholar] [CrossRef]
- Legutko, P.; Kozieł, M.; Kowalczyk, A.; Michalik, M.; Adamski, A. Effect of Active Phase Precursor on Structural, Textural and Catalytic Properties of the Model NiOx/CeO2 System Active in Dry Reforming of Methane. Crystals 2024, 14, 634. [Google Scholar] [CrossRef]
- Shan, W.; Guo, H.; Liu, C.; Wang, X. Controllable Preparation of CeO2 Nanostructure Materials and Their Catalytic Activity. J. Rare Earths 2012, 30, 665–669. [Google Scholar] [CrossRef]
- Song, Z.; Liu, P.; Fu, Y.; Liu, H.; Huang, Z.; Kang, H.; Mao, Y.; Liu, B.; Guo, Y. Promotional Effect of Acidic Oxide on Catalytic Activity and N2 Selectivity over CeO2 for Selective Catalytic Reduction of NOx by NH3. Appl. Organomet. Chem. 2019, 33, e4919. [Google Scholar] [CrossRef]
- Liu, L.; Shi, J.; Zhang, X.; Liu, J. Flower-Like Mn-Doped CeO2 Microstructures: Synthesis, Characterizations, and Catalytic Properties. J. Chem. 2015, 2015, 254750. [Google Scholar] [CrossRef]
- Lupa, J.; Morlo, K.; Dobrowolski, R.; Legutko, P.; Sienkiewicz, A.; Kierys, A. Highly Porous Cerium Oxide Prepared via a One-Step Hard Template Method as an Extremely Effective Adsorbent for Arsenic Species Removal from Water. Chem. Eng. J. 2023, 474, 145750. [Google Scholar] [CrossRef]
- Bensalem, A.; Muller, J.C.; Bozon-Verduraz, F. From Bulk CeO2 to Supported Cerium-Oxygen Clusters: A Diffuse Reflectance Approach. J. Chem. Soc. Faraday Trans. 1992, 88, 153–154. [Google Scholar] [CrossRef]
- Tauc, J.; Grigorovici, R.; Vancu, A. Optical Properties and Electronic Structure of Amorphous Germanium. Phys. Status Solidi 1966, 15, 627–637. [Google Scholar] [CrossRef]
- Comini, N.; Huthwelker, T.; Diulus, J.T.; Osterwalder, J.; Novotny, Z. Factors Influencing Surface Carbon Contamination in Ambient-Pressure X-Ray Photoelectron Spectroscopy Experiments. J. Vac. Sci. Technol. A Vac. Surf. Film. 2021, 39, 043203. [Google Scholar] [CrossRef]
- Bueno-López, A. Diesel Soot Combustion Ceria Catalysts. Appl. Catal. B 2014, 146, 1–11. [Google Scholar] [CrossRef]
- Alcalde-Santiago, V.; Davó-Quiñonero, A.; Lozano-Castelló, D.; Bueno-López, A. On the Soot Combustion Mechanism Using 3DOM Ceria Catalysts. Appl. Catal. B 2018, 234, 187–197. [Google Scholar] [CrossRef]
- Sorolla-Rosario, D.; Davó-Quiñonero, A.; Bailón-García, E.; Lozano-Castelló, D.; Bueno-López, A. Key-Lock Ceria Catalysts for the Control of Diesel Engine Soot Particulate Emissions. ChemCatChem 2020, 12, 1772–1781. [Google Scholar] [CrossRef]
- Fino, D.; Bensaid, S.; Piumetti, M.; Russo, N. A Review on the Catalytic Combustion of Soot in Diesel Particulate Filters for Automotive Applications: From Powder Catalysts to Structured Reactors. Appl. Catal. A Gen. 2016, 509, 75–96. [Google Scholar] [CrossRef]
- Li, Y.; Qin, T.; Ma, Y.; Xiong, J.; Zhang, P.; Lai, K.; Liu, X.; Zhao, Z.; Liu, J.; Chen, L.; et al. Revealing Active Edge Sites Induced by Oriented Lattice Bending of Co-CeO2 Nanosheets for Boosting Auto-Exhaust Soot Oxidation. J. Catal. 2023, 421, 351–364. [Google Scholar] [CrossRef]
- Li, Y.; Guo, H.; Xiong, J.; Ma, Y.; Li, X.; Zhang, P.; Zhang, S.; Wei, Y. The Catalyst of Ruthenium Nanoparticles Decorated Silicalite-1 Zeolite for Boosting Catalytic Soot Oxidation. Catalysts 2023, 13, 1167. [Google Scholar] [CrossRef]
- Cao, C.; Yang, H.; Xiao, J.; Yang, X.; Ren, B.; Xu, L.; Liu, G.; Li, X. Catalytic Diesel Soot Elimination over Potassium Promoted Transition Metal Oxide (Co/Mn/Fe) Nanosheets Monolithic Catalysts. Fuel 2021, 305, 121446. [Google Scholar] [CrossRef]
- Wang, H.; Liu, S.; Zhao, Z.; Zou, X.; Liu, M.; Liu, W.; Wu, X.; Weng, D. Activation and Deactivation of Ag/CeO2 during Soot Oxidation: Influences of Interfacial Ceria Reduction. Catal. Sci. Technol. 2017, 7, 2129–2139. [Google Scholar] [CrossRef]
- Chen, Z.; Chen, L.; Jiang, M.; Gao, X.; Huang, M.; Li, Y.; Ren, L.; Yang, Y.; Yang, Z. Controlled Synthesis of CeO2 Nanorods and Their Promotional Effect on Catalytic Activity and Aging Resistibility for Diesel Soot Oxidation. Appl. Surf. Sci. 2020, 510, 145401. [Google Scholar] [CrossRef]
- Zhu, L.; Yu, J.; Wang, X. Oxidation Treatment of Diesel Soot Particulate on CexZr1−xO2. J. Hazard. Mater. 2007, 140, 205–210. [Google Scholar] [CrossRef] [PubMed]
- Stegmayer, M.Á.; Milt, V.G.; Miró, E.E. Biomorphic Synthesis of Cobalt Oxide and Ceria Microfibers. Their Application in Diesel Soot Oxidation. Catal. Commun. 2020, 139, 105984. [Google Scholar] [CrossRef]
- Chen, L.; Liu, F.; Li, X.; Tao, Q.; Huang, Z.; Zuo, Q.; Chen, Y.; Li, T.; Fu, M.; Ye, D. Surface Adsorbed and Lattice Oxygen Activated by the CeO2/Co3O4 Interface for Enhancive Catalytic Soot Combustion: Experimental and Theoretical Investigations. J. Colloid Interface Sci. 2023, 638, 109–122. [Google Scholar] [CrossRef]
- Liu, P.; Liang, X.; Dang, Y.; He, J.; Shirazi-Amin, A.; Achola, L.A.; Dissanayake, S.; Chen, H.; Fu, M.; Ye, D.; et al. Effects of Zr substitution on soot combustion over cubic fluorite-structured nanoceria: Soot-Ceria contact and interfacial oxygen evolution. J. Environ. Sci. 2021, 101, 293–303. [Google Scholar] [CrossRef]
- Stelmachowski, P.; Kopacz, A.; Legutko, P.; Indyka, P.; Wojtasik, M.; Ziemianski, L.; Żak, G.; Sojka, Z.; Kotarba, A. The role of crystallite size of iron oxide catalyst for soot combustion. Catal. Today 2015, 257, 111–116. [Google Scholar] [CrossRef]

Disclaimer/Publisher’s Note: The statements, opinions and data contained in all publications are solely those of the individual author(s) and contributor(s) and not of MDPI and/or the editor(s). MDPI and/or the editor(s) disclaim responsibility for any injury to people or property resulting from any ideas, methods, instructions or products referred to in the content. |
© 2025 by the authors. Licensee MDPI, Basel, Switzerland. This article is an open access article distributed under the terms and conditions of the Creative Commons Attribution (CC BY) license (https://creativecommons.org/licenses/by/4.0/).