2.1. Characterization of the Catalysts
Mono- and bimetallic Pd/ZnO, Pd-Pec/ZnO, and PdCu-Pec/ZnO catalysts were prepared via an adsorption method. The amounts of the polymer and metal ions adsorbed on ZnO were assessed by determining their concentrations in the mother liquor after the sorption process. The pectin concentration was determined by measuring the viscosity of the mother liquor and referencing a previously established calibration curve, while the concentration of metal ions was determined using a photoelectric colorimetric (PEC) method.
Table 1 summarizes the results of pectin adsorption onto ZnO for the Pec/ZnO and Pd-Pec/ZnO composites. The data reveal distinct differences in the adsorption behavior between the two systems. In the Pec/ZnO system, the degree of pectin adsorption decreases from 100% to 59% as the amount of pectin introduced into the system increases from 18.5 to 92.5 mg. This trend indicates a saturation of available adsorption sites on the surface of ZnO, leading to a plateau in the pectin content within the final composite, which reaches a maximum of approximately 5.0 wt%. In contrast, the Pd-Pec/ZnO system exhibited an adsorption degree of 96–100%. This enhanced adsorption performance is likely related to the formation of polymer–metal complexes between pectin molecules and Pd
2+ ions. The interaction between palladium and functional groups of pectin (such as carboxyl and hydroxyl groups) may promote partial crosslinking of the polymer chains, increasing their affinity for the surface of ZnO. Depending on the amount of pectin introduced, the calculated pectin content was found to be 1.8 wt%, 3.4 wt%, and 5.0 wt% for the Pec/ZnO composites and 1.8 wt%, 3.5 wt%, and 8.1 wt% for the Pd-Pec/ZnO composites. For simplicity, the obtained Pec/ZnO and Pd-Pec/ZnO composites were designated as Pec1.8/ZnO, Pec3.4/ZnO, Pec5.0/ZnO, Pd-Pec1.8/ZnO, Pd-Pec3.5/ZnO, and Pd-Pec8.1/ZnO, where the number indicates the pectin content (in wt%) in the composite.
The presence and varying content of pectin in the composites was confirmed using thermogravimetric analysis (TGA) and infrared spectroscopy (IR). According to TGA data (
Figure 1), the thermal degradation of pectin and Pd-Pec/ZnO composites occurred in two main stages. In the low-temperature region (up to ~220–280 °C), minor weight loss was observed, attributed to the evaporation of physically adsorbed water and the removal of other small molecules [
20,
21]. The main degradation step, associated with the decomposition of the pectin, occurs at higher temperatures. The variations in thermogram profiles confirm differences in the polymer content and structure across the samples [
21,
22].
The inset in
Figure 1 shows the TGA curve of pure pectin, which exhibits a ~12.4% weight loss below 220 °C due to moisture removal. This is followed by a major weight loss (~55%) in the 220–500 °C range, corresponding to the thermal decomposition of the polymer backbone. It should be noted that the residual mass of ~33% for pure pectin at 500 °C is consistent with the values in the literature reported for commercial pectins (32–34%) [
21,
22]. Furthermore, the observed weight loss in the 220–500 °C range (~55%) closely matches previous data for apple pectin (~50%) [
23].
In the Pd-Pec1.8/ZnO composite, pectin decomposition began at a higher temperature (~280 °C), indicating enhanced thermal stability. A weight loss of 2.2% below this temperature is attributed to the evaporation of physically bound water. In the 280–500 °C range, the weight loss was 1.1%. Given that pure pectin loses approximately 55% of its mass at this stage (
Figure 1, inset), the pectin content in Pd-Pec1.8/ZnO was estimated to be around 2.0 wt%. This estimate is consistent with the viscosimetry data presented in
Table 1, confirming the effective and quantitative deposition of pectin on the ZnO surface.
For the Pd-Pec3.5/ZnO composite, decomposition began at approximately 265 °C. A weight loss of 1.7% observed below this temperature is attributed to the evaporation of bound water. In the 265–500 °C range, the sample lost an additional 2.1% of its mass. Based on the weight loss characteristic of pure pectin, the calculated pectin content in the composite was approximately 3.8 wt%, which closely matched the viscosimetry-based result of 3.5 wt% (
Table 1).
In the case of Pd-Pec8.1/ZnO, thermal decomposition of the polymer started at approximately 240 °C. A weight loss of 2.0% below this temperature is attributed to the release of bound water. A further 4.2% weight loss observed in the range of 240–500 °C indicated a pectin content of approximately 7.6 wt%, which is in good agreement with the value of 8.1 wt% obtained from viscosimetry (
Table 1).
Importantly, the onset temperature of pectin decomposition was found to be inversely proportional to its content in the composite: 280 °C for Pd-Pec1.8/ZnO, 265 °C for Pd-Pec3.5/ZnO, 240 °C for Pd-Pec8.1/ZnO, and 220 °C for pure pectin. This shift can be attributed to differences in the degree of crosslinking between pectin and palladium ions. Since the Pd content remained constant across all samples, the Pd:pectin molar ratio varied, resulting in different levels of crosslinking. In Pd-Pec1.8/ZnO, the Pd:pectin molar ratio was approximately 1:1, indicating nearly complete crosslinking. In Pd-Pec3.5/ZnO and Pd-Pec8.1/ZnO, the ratios were approximately 1:2 and 1:5, respectively, corresponding to lower degrees of crosslinking and, consequently, reduced thermal stability. This interpretation is consistent with the literature data. For example, a pectin-based hydrogel (pectin-co-poly(MAA)) exhibited a significantly higher decomposition onset temperature (>400 °C) compared to pure pectin (~240 °C) [
22]. Similarly, pectin derivatives, such as polyphenol-conjugated pectins, demonstrated enhanced structural stability, with decomposition starting at 240–250 °C, whereas native pectin began to decompose at approximately 230 °C [
21].
Figure 2 shows IR spectra of pectin, Pd/ZnO, Pd-Pec1.8/ZnO, Pd-Pec8.1/ZnO, and Pec5.0/ZnO. The IR spectrum of pectin displays characteristic absorption bands corresponding to various functional groups of the polymer. Specifically, the bands at 3440 cm
−1, 1752 cm
−1, and 1625 cm
−1 are attributed to the stretching vibrations of –OH, C=O of ester and C=O of carboxylic acid groups, respectively [
24]. Notably, the absorbance is higher at 1752 cm
−1 than at 1625 cm
−1, confirming a high degree of esterification of the pectin (more than 50%). In addition, the region between 1200 and 1500 cm
−1 contains absorption bands associated with the stretching and bending vibrations of –C–OH, –C–H, and –O–H functional groups [
25]. The broad absorption band in the range of 950–1200 cm
−1 corresponds to the “fingerprint” region of carbohydrates, which is crucial for identifying key structural units such as C–O, C–O–C, and C–C bonds in polysaccharides [
26]. The IR spectrum of Pd/ZnO exhibits characteristic bands at 400–500 cm
−1, 1635 cm
−1, and 3443 cm
−1. The intensive band in the range of 400–500 cm
−1 corresponds to the Zn–O stretching vibrations, which are typical for ZnO-based materials [
27]. The band at 1635 cm
−1 is assigned to the bending vibrations of adsorbed water molecules (H–O–H), while the broad absorption band at 3443 cm
−1 is attributed to the O–H stretching vibrations of surface hydroxyl groups or physically adsorbed water [
28]. The IR spectra of Pec5.0/ZnO and Pd-Pec/ZnO composites display absorption bands characteristic of both pectin and Pd/ZnO, confirming the successful incorporation of the polymer into the composite structure. Notably, the intensity of pectin-related bands (especially evident in the fingerprint region around 950–1200 cm
−1) increases in the following order, Pd-Pec1.8/ZnO < Pec5.0/ZnO < Pd-Pec8.1/ZnO, reflecting the increasing pectin content in the composites. This trend is consistent with the results obtained from viscosimetry (
Table 1) and TGA (
Figure 1), further confirming the varying amounts of polymer deposited on the ZnO surface. Moreover, a comparison of IR spectra of pectin, Pec5.0/ZnO, and Pd-Pec8.1/ZnO composites indicated interaction of pectin with both ZnO and Pd ions. This is evidenced by the shift of the ester carbonyl (COOR) band from 1752 cm
−1 in pure pectin to 1735 cm
−1 in Pec5.0/ZnO and 1749 cm
−1 in Pd-Pec8.1/ZnO. Furthermore, new bands appearing at 1512 (Pec5.0/ZnO) and 1516 cm
−1 (Pd-Pec8.1/ZnO) in the composite samples can be attributed to the asymmetric stretching vibrations of carboxylate anions (COO
−) [
29], indicating coordination between deprotonated carboxyl groups and Zn
2+ or Pd
2+ ions. Minor shifts in the fingerprint region (950–1200 cm
−1) further support the structural modification of pectin upon interaction with the inorganic components.
According to photoelectric colorimetric (PEC) analysis data, palladium ions were quantitatively adsorbed (~100%) on ZnO, which can be explained by the hydrolysis of Pd ions in the presence of ZnO. Pec/ZnO composites with a low pectin content (up to ~3.5 wt%) also demonstrated high sorption capacity (96–99%) toward Pd
2+ ions. In these cases, palladium ions likely interact with both ZnO and the pectin adsorbed on its surface. However, when the pectin content in the Pec/ZnO composite was increased to ~8 wt%, the degree of Pd adsorption decreased to 86.6%. This could be attributed to the binding of Pd
2+ ions with excess pectin that was not adsorbed onto the ZnO surface. This assumption was further supported by an additional experiment: the clarification of the mother liquor upon ethanol addition to the Pd
2+–Pec–ZnO system suggested the complete removal of the free Pd–Pec complex via precipitation. During the preparation of bimetallic catalysts, palladium was introduced into the system after copper. In these cases, the amount of palladium introduced was lower, which likely facilitated its more complete sorption. As a result, the degree of Pd
2+ adsorption reached 99–100%. Copper ions were also effectively adsorbed in the PdCu–Pec1.8/ZnO composites, with adsorption degrees ranging from 90% to 96% depending on the Pd:Cu ratio. Based on PEC analysis, the total metal (Pd and Cu) content in the catalysts was approximately 1 wt%, which was consistent with the results obtained by energy-dispersive X-ray (EDX) elemental analysis (
Table 2).
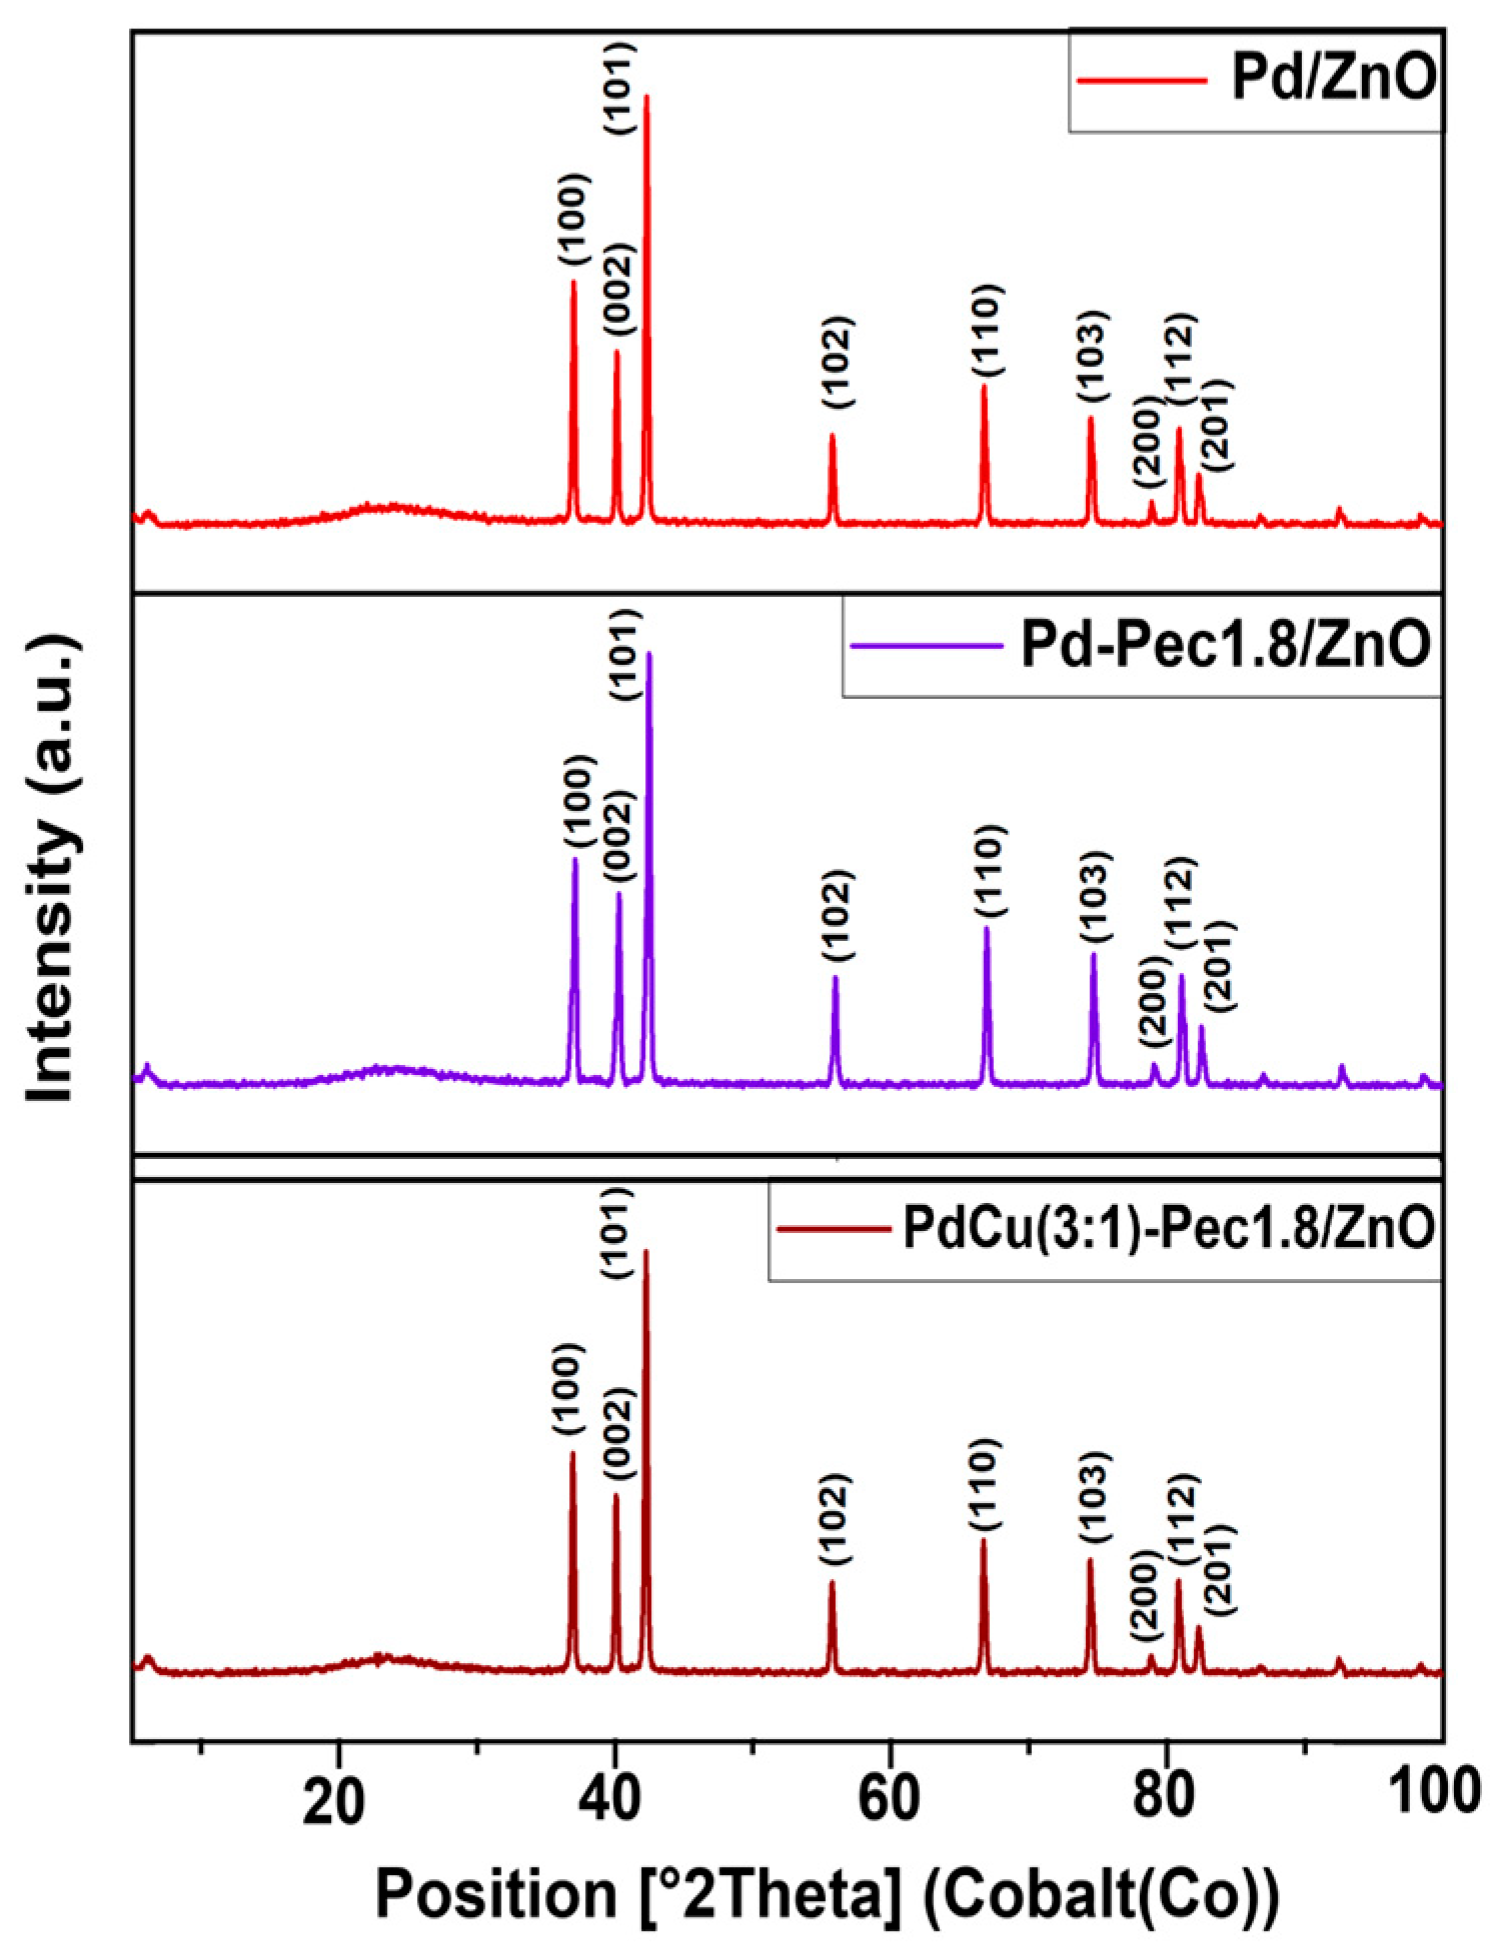
The results of X-ray powder diffraction analysis (XRD) of the Pd/ZnO, Pd-Pec1.8/ZnO, and PdCu(3:1)-Pec1.8/ZnO are shown in
Figure 3. All XRD patterns showed characteristic peaks at 36.9°, 40.0°, 42.2°, 55.6°, 66.7°, 74.4°, 78.8°, 80.8°, and 82.3°, corresponding to the (100), (002), (101), (102), (110), (103), (200), (112), and (201) planes of ZnO hexagonal wurtzite structures (JCPDS card no. 79-2205) [
30]. No diffraction peaks corresponding to palladium (Pd or PdO) or copper (Cu, Cu
2O, or CuO) species were observed in the XRD patterns of the catalysts. This absence can be attributed to the low metal content (Pd and Cu) in the samples, as well as the small size and high dispersion of the metal particles [
15].
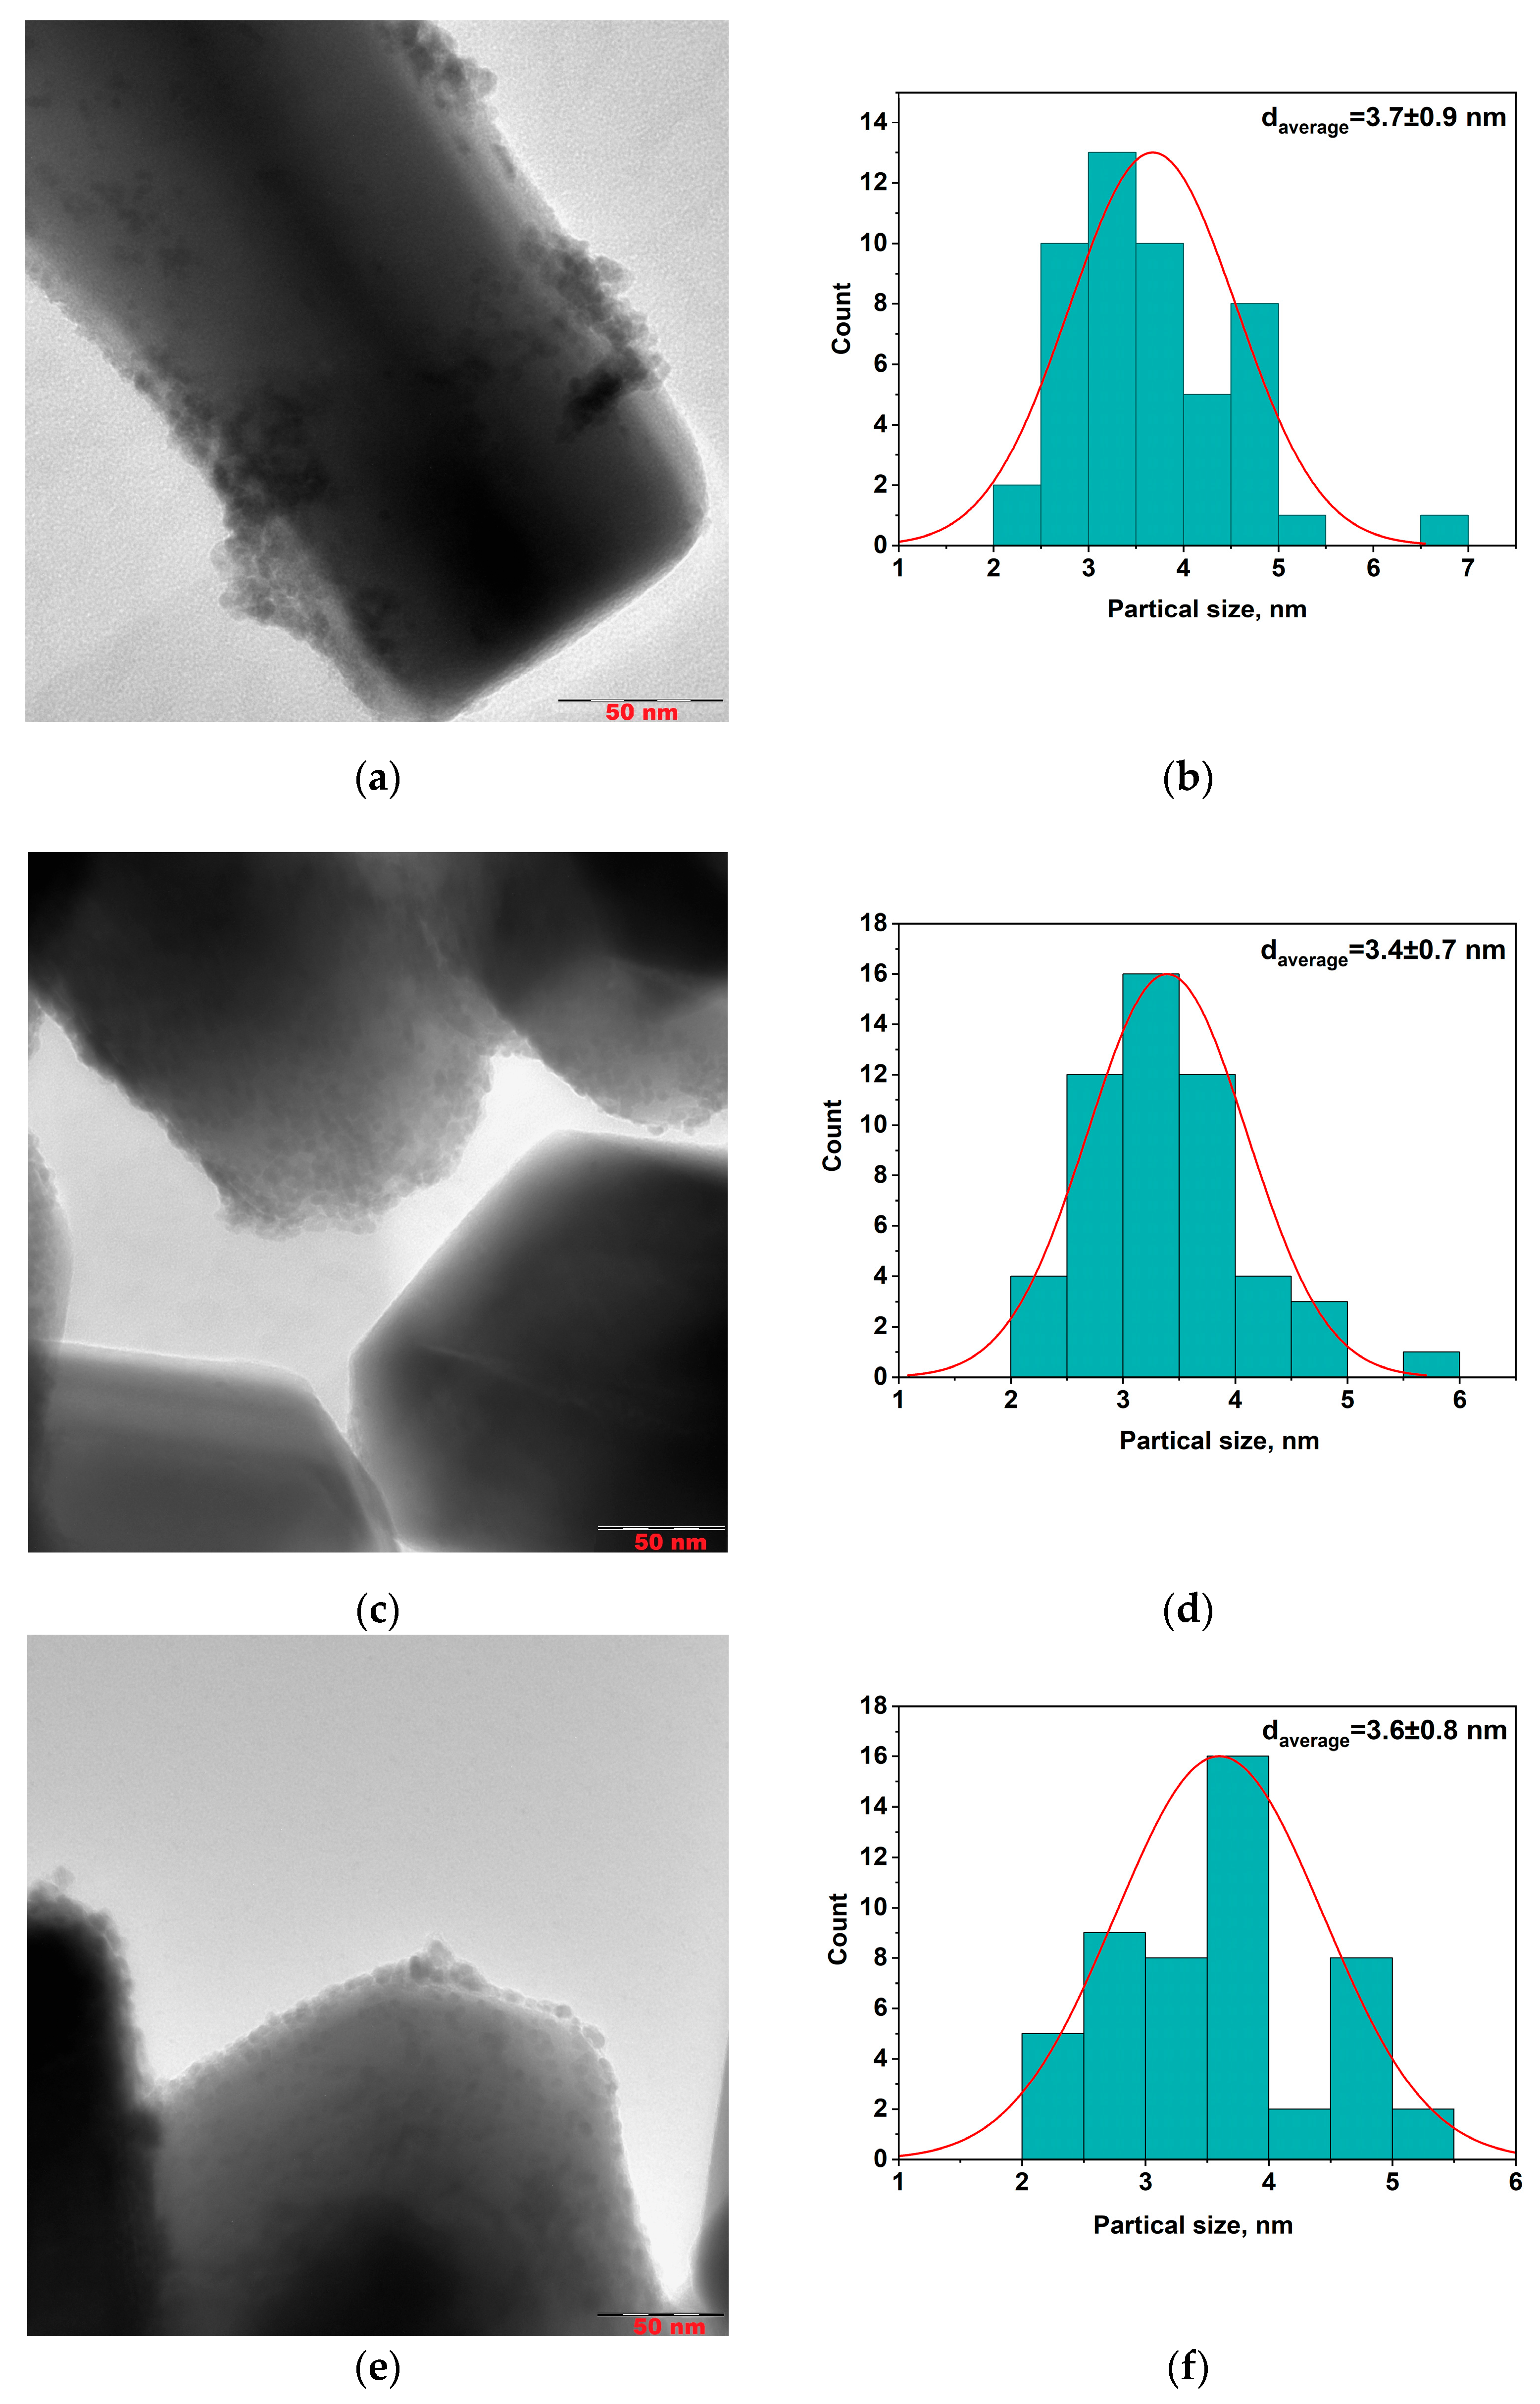
To evaluate the size of metal particles and their distribution of a support surface Pd/ZnO, Pd-Pec1.8/ZnO, and PdCu(3:1)-Pec1.8/ZnO were studied using transmission electron microscopy (TEM) method (
Figure 4). Prior to conducting the studies, the catalysts were treated with hydrogen (1 atm) in a reactor at 40 °C for 30 min.
According to TEM studies, the Pd/ZnO catalyst is composed of palladium (Pd) nanoparticles with a primary size of approximately 3.7 nm (
Figure 4b). These nanoparticles tend to aggregate, forming larger nanoclusters ranging from 10 to 30 nm in size, which are distributed across various sites of the ZnO support. However, in certain regions, Pd nanoparticles remain well-dispersed without forming aggregates (
Figure 4a). In contrast, both the Pd–Pec1.8/ZnO (
Figure 4c) and bimetallic PdCu(3:1)–Pec1.8/ZnO (
Figure 4e) catalysts exhibit a uniform distribution of nanoparticles on the ZnO support, with an average particle size of approximately 3.4–3.6 nm (
Figure 4d,f). The nanoparticles are predominantly spherical or slightly oval in shape, and show no signs of significant aggregation compared to those of unmodified Pd/ZnO (
Figure 4a,c,e). Additional high-magnification TEM images of the same catalysts are presented in the
Supplementary Information (Figure S1a–c), confirming both the particle sizes indicated by the histograms (
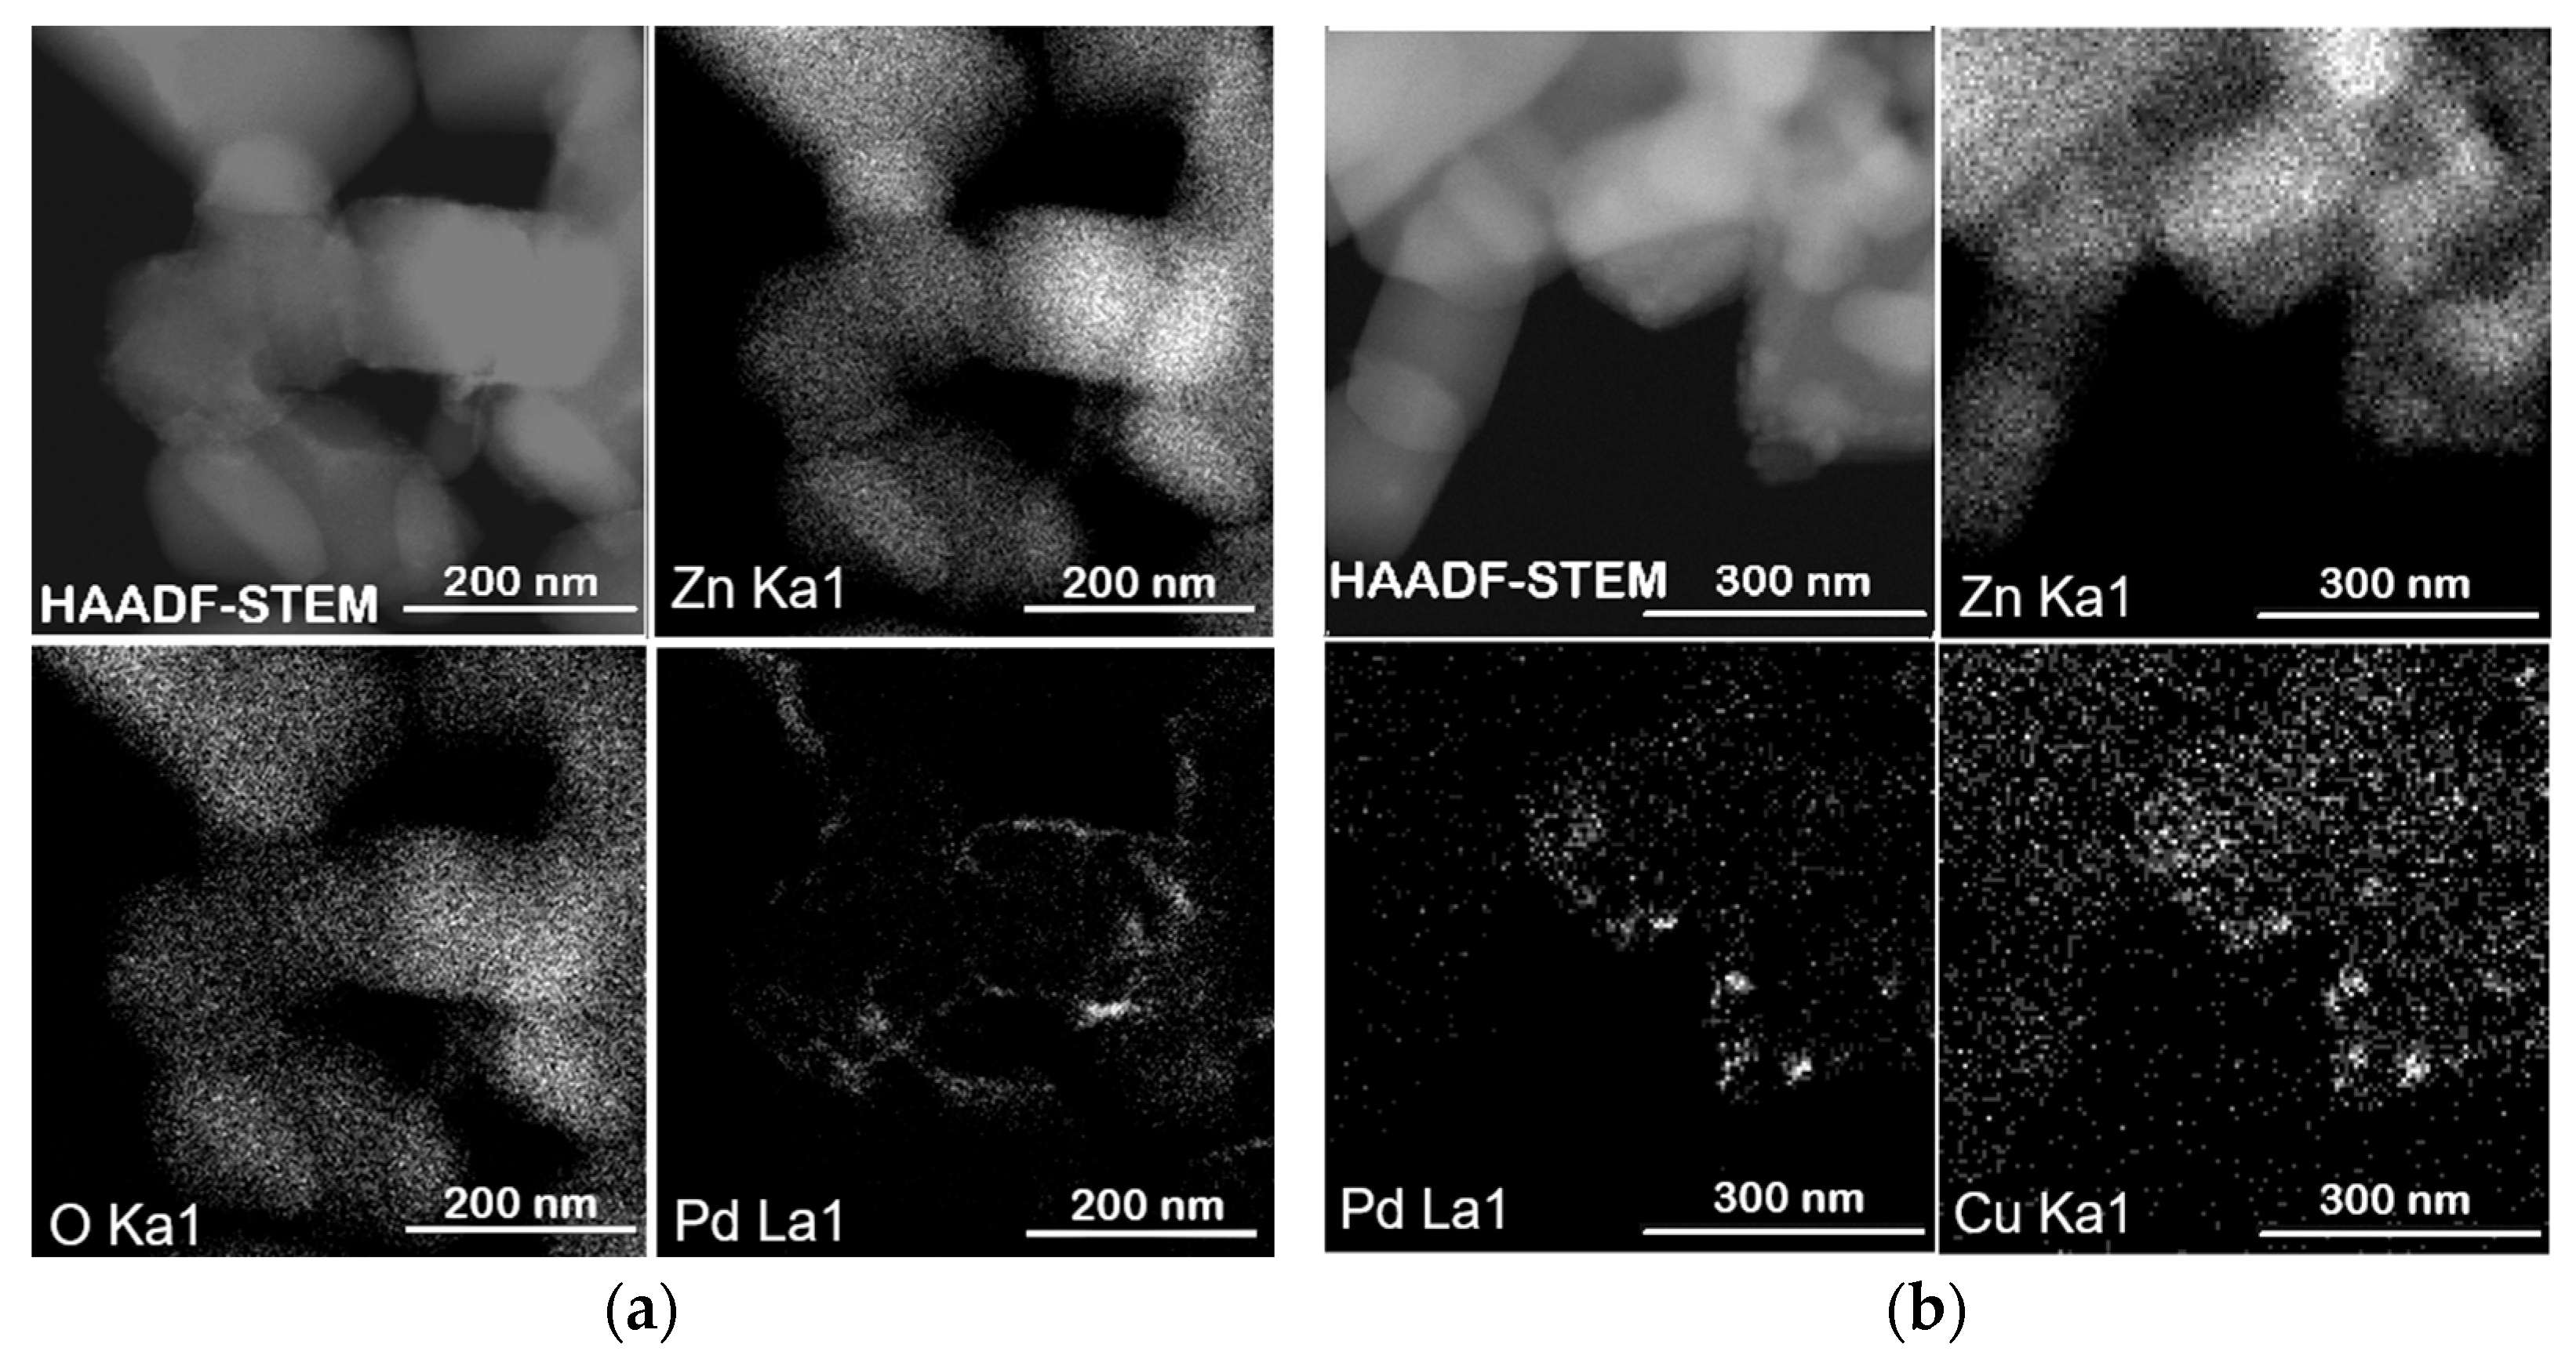
Figure 4b,d,f) and the particle morphology and dispersion. The use of pectin as a stabilizing agent during synthesis likely contributes to this homogeneous dispersion by preventing nanoparticle growth and aggregation. Elemental mapping analysis of the Pd–Pec1.8/ZnO catalyst (
Figure 5a) further confirms the homogeneous distribution of palladium on the Pec1.8/ZnO support surface. The HAADF-STEM image, along with the corresponding EDX elemental maps for Zn (Zn Kα1), O (O Kα1), and Pd (Pd Lα1), shows that palladium is well dispersed across the support, without evidence of significant aggregation or phase separation. Similarly, the elemental maps of the PdCu(3:1)–Pec1.8/ZnO catalyst (
Figure 5b) show uniform distribution and co-localization of Pd and Cu nanoparticles on the ZnO surface. The overlapping bright spots in the Pd and Cu maps suggest that both metals may be spatially coincident, which could indicate the formation of bimetallic nanoparticles or alloys.
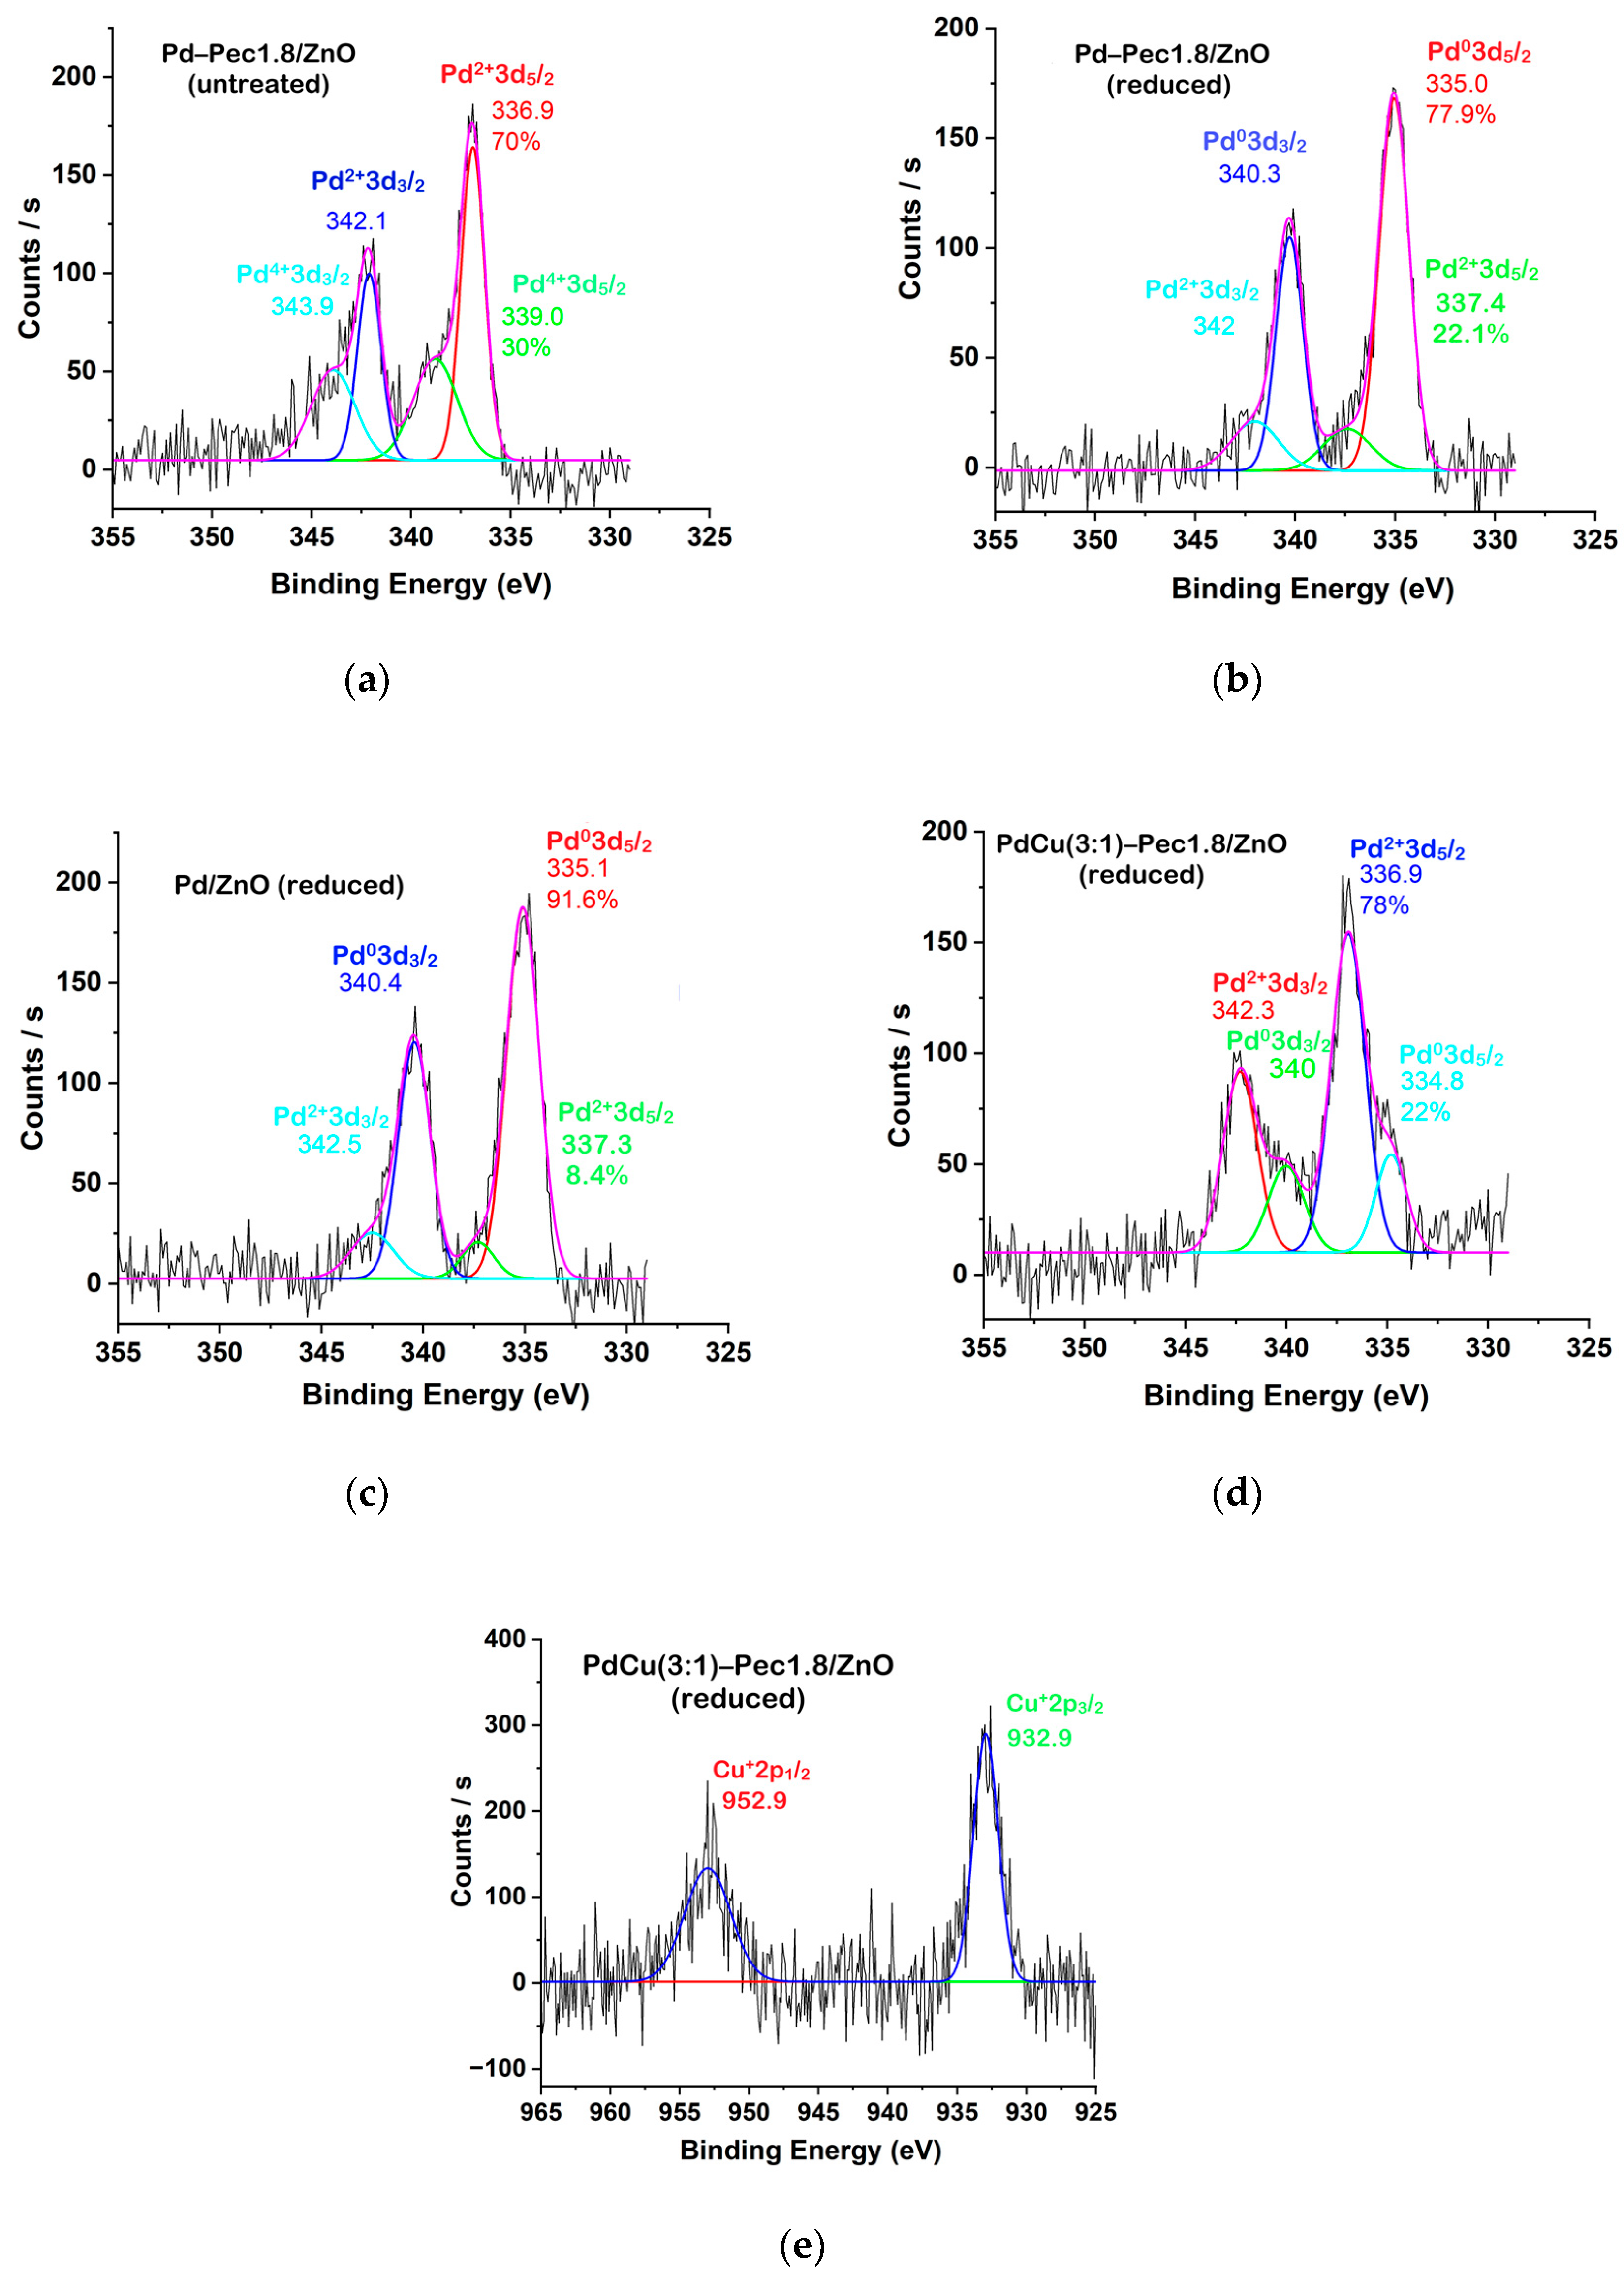
To assess the oxidation states of palladium and copper species during the hydrogenation process, X-ray photoelectron spectroscopy (XPS) was employed. The catalysts (Pd/ZnO, Pd-Pec1.8/ZnO, and PdCu(3:1)-Pec1.8/ZnO) were pretreated with molecular hydrogen at 40 °C in a reactor prior to XPS analysis. Additionally, untreated Pd-Pec1.8/ZnO was analyzed to determine the effect of hydrogen pretreatment on the Pd species.
Figure 6 shows the Pd 3d and Cu 2p regions of the XPS spectra of the catalysts. The deconvoluted Pd 3d signals (
Figure 6a–d) clearly illustrate the different oxidation states of Pd existing on the surface of the catalysts. In the untreated Pd-Pec1.8/ZnO, Pd 3d
5/2 peaks with binding energies at 336.9 eV and 339.0 eV can be attributed to Pd in +2 and +4 oxidation states, respectively (
Figure 6a) [
31,
32]. Treatment of the catalyst with molecular hydrogen at 40 °C led to significant changes in the Pd 3d spectral profile (
Figure 6b). The peak at 339.0 eV (Pd
4+) disappeared, and a new peak emerged at 335.0 eV, characteristic of metallic palladium (Pd
0) [
33,
34]. In the reduced Pd-Pec1.8/ZnO sample, Pd
0 (335.0 eV) became the dominant species, representing 78% of the surface Pd, while Pd
2+ (337.4 eV) accounted for 22%. This confirms that hydrogen treatment effectively converts oxidized Pd species (Pd
4+ and Pd
2+) into metallic Pd
0, thereby modulating the electronic state of palladium. Such modulation is expected to strongly influence catalytic behavior in hydrogenation reactions. Similarly, the reduced Pd/ZnO catalyst exhibited Pd 3d
5/
2 peaks at 335.1 eV and 337.3 eV, associated with Pd
0 (92%) and Pd
2+ (8%), respectively (
Figure 6c). This suggests that the incorporation of pectin did not significantly affect the redox state of palladium after hydrogen treatment. In contrast, modification with copper led to notable changes in the Pd 3d spectral profile. The reduced PdCu(3:1)-Pec1.8/ZnO catalyst exhibited Pd
5/
2 peaks at 334.8 eV and 336.9 eV, with Pd
2+ becoming the predominant species (78%) and Pd
0 contributing only 22% (
Figure 6d).
The Cu 2p
3/
2 region of the XPS spectrum (
Figure 6e) displays a main peak at ~933 eV with a full width at half maximum (FWHM) of 2.1 eV, which is characteristic of Cu
+ in Cu
2O [
35]. This suggests that Cu
2+ species were effectively reduced to Cu
+ during H
2 pretreatment.
These observations suggest the formation of a core–shell-like structure, in which palladium forms the core and copper is preferentially located at the outer surface. This assumption is based on several experimental observations. The negative shift of the Pd 3d
5/
2 peak by 0.2 eV (from 335.0 eV in Pd-Pec1.8/ZnO to 334.8 eV in PdCu(3:1)-Pec1.8/ZnO) indicates electron transfer from Cu to Pd, in agreement with literature reports on PdCu systems [
36,
37]. This shift confirms that Pd and Cu are in direct contact and interact electronically. However, although electron donation from Cu to Pd would typically be expected to facilitate the reduction of Pd
2+ to Pd
0 [
38], our data reveal the opposite trend: only 22% of Pd is reduced in the bimetallic system, compared to 78% in the monometallic analog. This apparent paradox can be reasonably explained by the physical blockage of Pd active sites by surface Cu atoms, which hinders hydrogen access and thus suppresses Pd reduction. In contrast, Cu
2+ is fully reduced to Cu
+, indicating that Cu is more surface-exposed, while Pd is likely more internally located, supporting a core–shell-like structural arrangement, in which Pd forms the core and Cu the shell. The enhanced reducibility of Cu is consistent with a previous report [
39], where Pd facilitates Cu reduction through hydrogen spillover or synergistic electronic effects. Although this study does not directly confirm a core–shell structure, it supports the observed preferential reduction of Cu in bimetallic systems. Importantly, this assumption does not contradict the elemental mapping (EDX) data (
Figure 5b), which show colocalization of Pd and Cu, but with a slightly broader spatial distribution of Cu. This observation may reflect the surface enrichment of Cu, and is compatible with a core–shell-like architecture where Pd resides predominantly in the particle interior. Taken together, these results indicate that Cu not only alters the electronic structure of Pd, but also modulates its accessibility to reducing agents, ultimately impacting the reducibility and catalytic performance of the bimetallic system.
2.2. Catalytic Properties of Pd and PdCu Catalysts in Hydrogenation Process
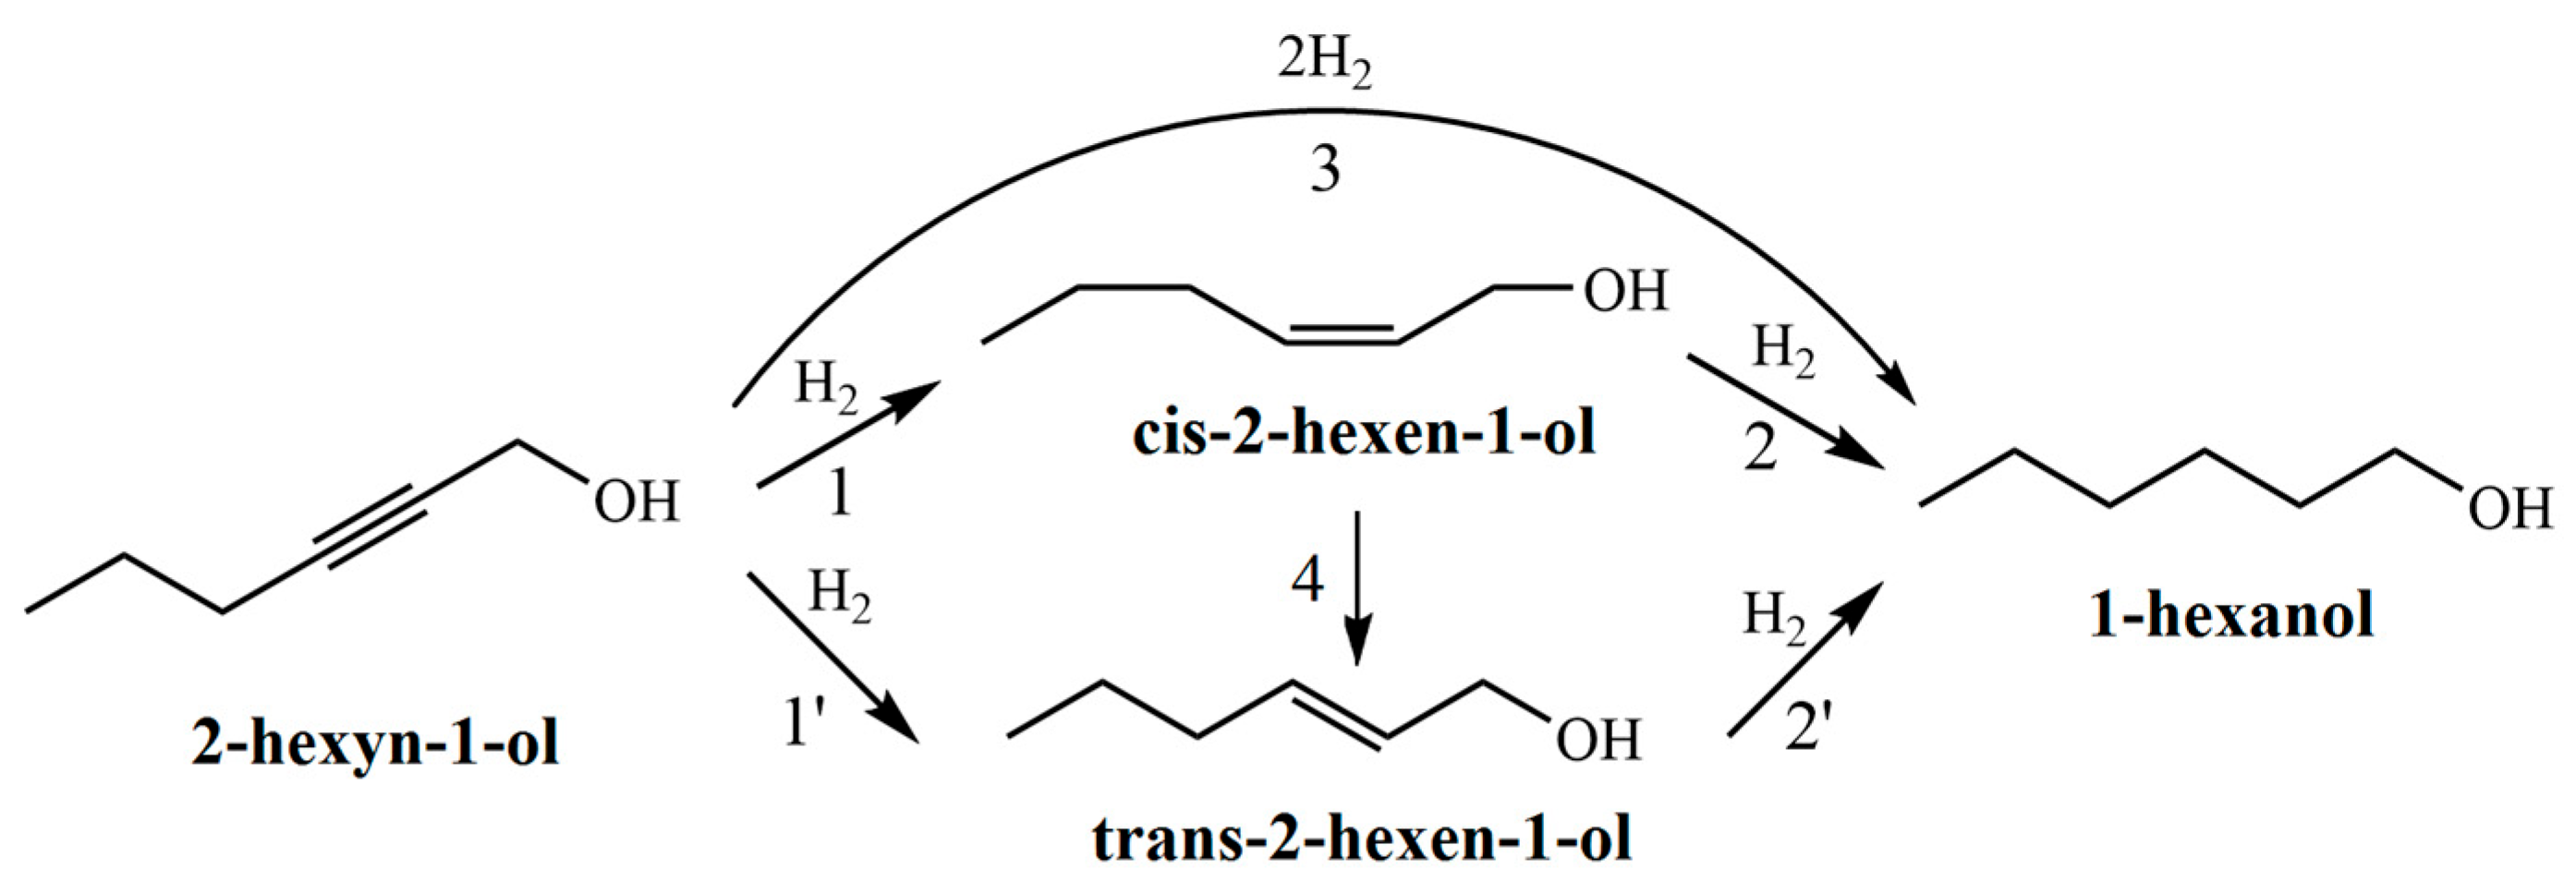
The hydrogenation of 2-hexyn-1-ol proceeds via a consecutive reaction pathway (
Figure 7). In the first step, the triple C≡C bond of the acetylenic alcohol is selectively reduced to a double C=C bond, forming both cis- and trans-isomers of 2-hexen-1-ol (
Figure 7, reactions 1 and 1′). These intermediates are further hydrogenated to 1-hexanol (
Figure 7, reactions 2 and 2′). Additionally, direct hydrogenation of 2-hexyn-1-ol to 1-hexanol without accumulation of intermediates is also possible (
Figure 7, reaction 3). It should also be noted that cis-2-hexen-1-ol may isomerize to its trans counterpart under the reaction conditions (
Figure 7, reaction 4).
To investigate the catalytic performance in these transformations, two sets of catalysts were studied. In the first part, a series of monometallic Pd/ZnO catalysts with varying pectin content were examined to evaluate the effect of pectin modification on activity and selectivity. In the second part, the performance of the optimized monometallic catalyst was compared with bimetallic PdCu-Pec/ZnO catalysts, in which the Pd to Cu mass ratio was systematically varied to assess the influence of copper incorporation on the hydrogenation behavior.
The activity of the catalysts was evaluated by measuring the hydrogen uptake as a function of time. Based on the H2 consumption data, the reaction rate was calculated. The selectivity of the process was determined by chromatographic analysis of reaction mixtures sampled at different time intervals.
Figure 8 shows the results of testing the monometallic Pd/ZnO catalysts in the hydrogenation of 2-hexyn-1-ol.
Figure 8a presents the variation in H
2 uptake over time during the reaction. The Pd/ZnO and Pd-Pec/ZnO catalysts with lower pectin content demonstrated higher catalytic activity compared to Pd-Pec8.1/ZnO. The semi-hydrogenation point (50 mL of H
2 uptake) was reached after 8, 9, 10, and 20 min for Pd-Pec1.8/ZnO, Pd-Pec3.5/ZnO, Pd/ZnO, and Pd-Pec8.1/ZnO, respectively. These results suggest that modification with a small amount of pectin slightly improves the activity of the Pd/ZnO catalyst. However, a further increase in pectin content leads to a decrease in activity, most likely due to the steric hindrance caused by the excess polymer, which limits substrate access to the Pd active sites [
40].
Figure 8b shows the hydrogenation rate (W), calculated from the H
2 uptake data. For all Pd-Pec/ZnO catalysts, the reaction rate increased during the first two minutes and remained nearly constant until the semi-hydrogenation point. Then, the rate increased again, reached a maximum, and subsequently dropped sharply. In contrast, the unmodified Pd/ZnO catalyst exhibited a slower and more gradual increase in reaction rate during the initial period up to the semi-hydrogenation point, without the sharp initial rise characteristic of the pectin-modified samples. This behavior can be attributed to a more uniform distribution of palladium particles on the support surface in the pectin-modified catalyst compared to the polymer-free system, as evidenced by the TEM data (
Figure 4).
According to chromatographic analysis, cis-2-hexen-1-ol accumulated in the reaction medium over Pd-Pec1.8/ZnO during the initial period and was subsequently reduced to 1-hexanol (
Figure 8c), which confirmed the occurrence of Paths 1 and 2 in
Figure 7, respectively. The accumulation of cis-2-hexen-1-ol was accompanied by the formation of minor amounts of trans-2-hexen-1-ol and 1-hexanol, whose yields at the semi-hydrogenation point (8 min) were 2% and 1%, respectively, while the yield of cis-2-hexen-1-ol reached 80%. The appearance of trans-2-hexen-1-ol and 1-hexanol before the semi-hydrogenation point confirmed the occurrence of Paths 1′ and 3 (
Figure 7). After passing the semi-hydrogenation point, a portion of the accumulated cis-2-hexen-1-ol was also converted to trans-2-hexen-1-ol (Path 4), which was eventually reduced to 1-hexanol (Path 2′ in
Figure 7). The composition of the reaction mixture changed similarly on the rest Pd/ZnO catalysts (
Figure S2). The maximum cis-2-hexen-1-ol yields were determined to be 78% at 11 min for Pd/ZnO, 76% at 11 min for Pd-Pec3.5/ZnO, and 77% at 20 min for Pd-Pec8.1/ZnO. These data confirmed that Pd-Pec/ZnO catalysts with lower pectin content (1.8% and 3.5 wt) exhibited slightly higher activity than Pd/ZnO, whereas Pd-Pec8.1/ZnO demonstrated the lowest activity. The selectivity-versus-conversion curves (
Figure 8d) showed that Pd/ZnO (97%) and Pd-Pec1.8/ZnO (96%) exhibited higher selectivity toward cis-2-hexen-1-ol compared to Pd-Pec3.5/ZnO (89%) and Pd-Pec8.1/ZnO (89%).
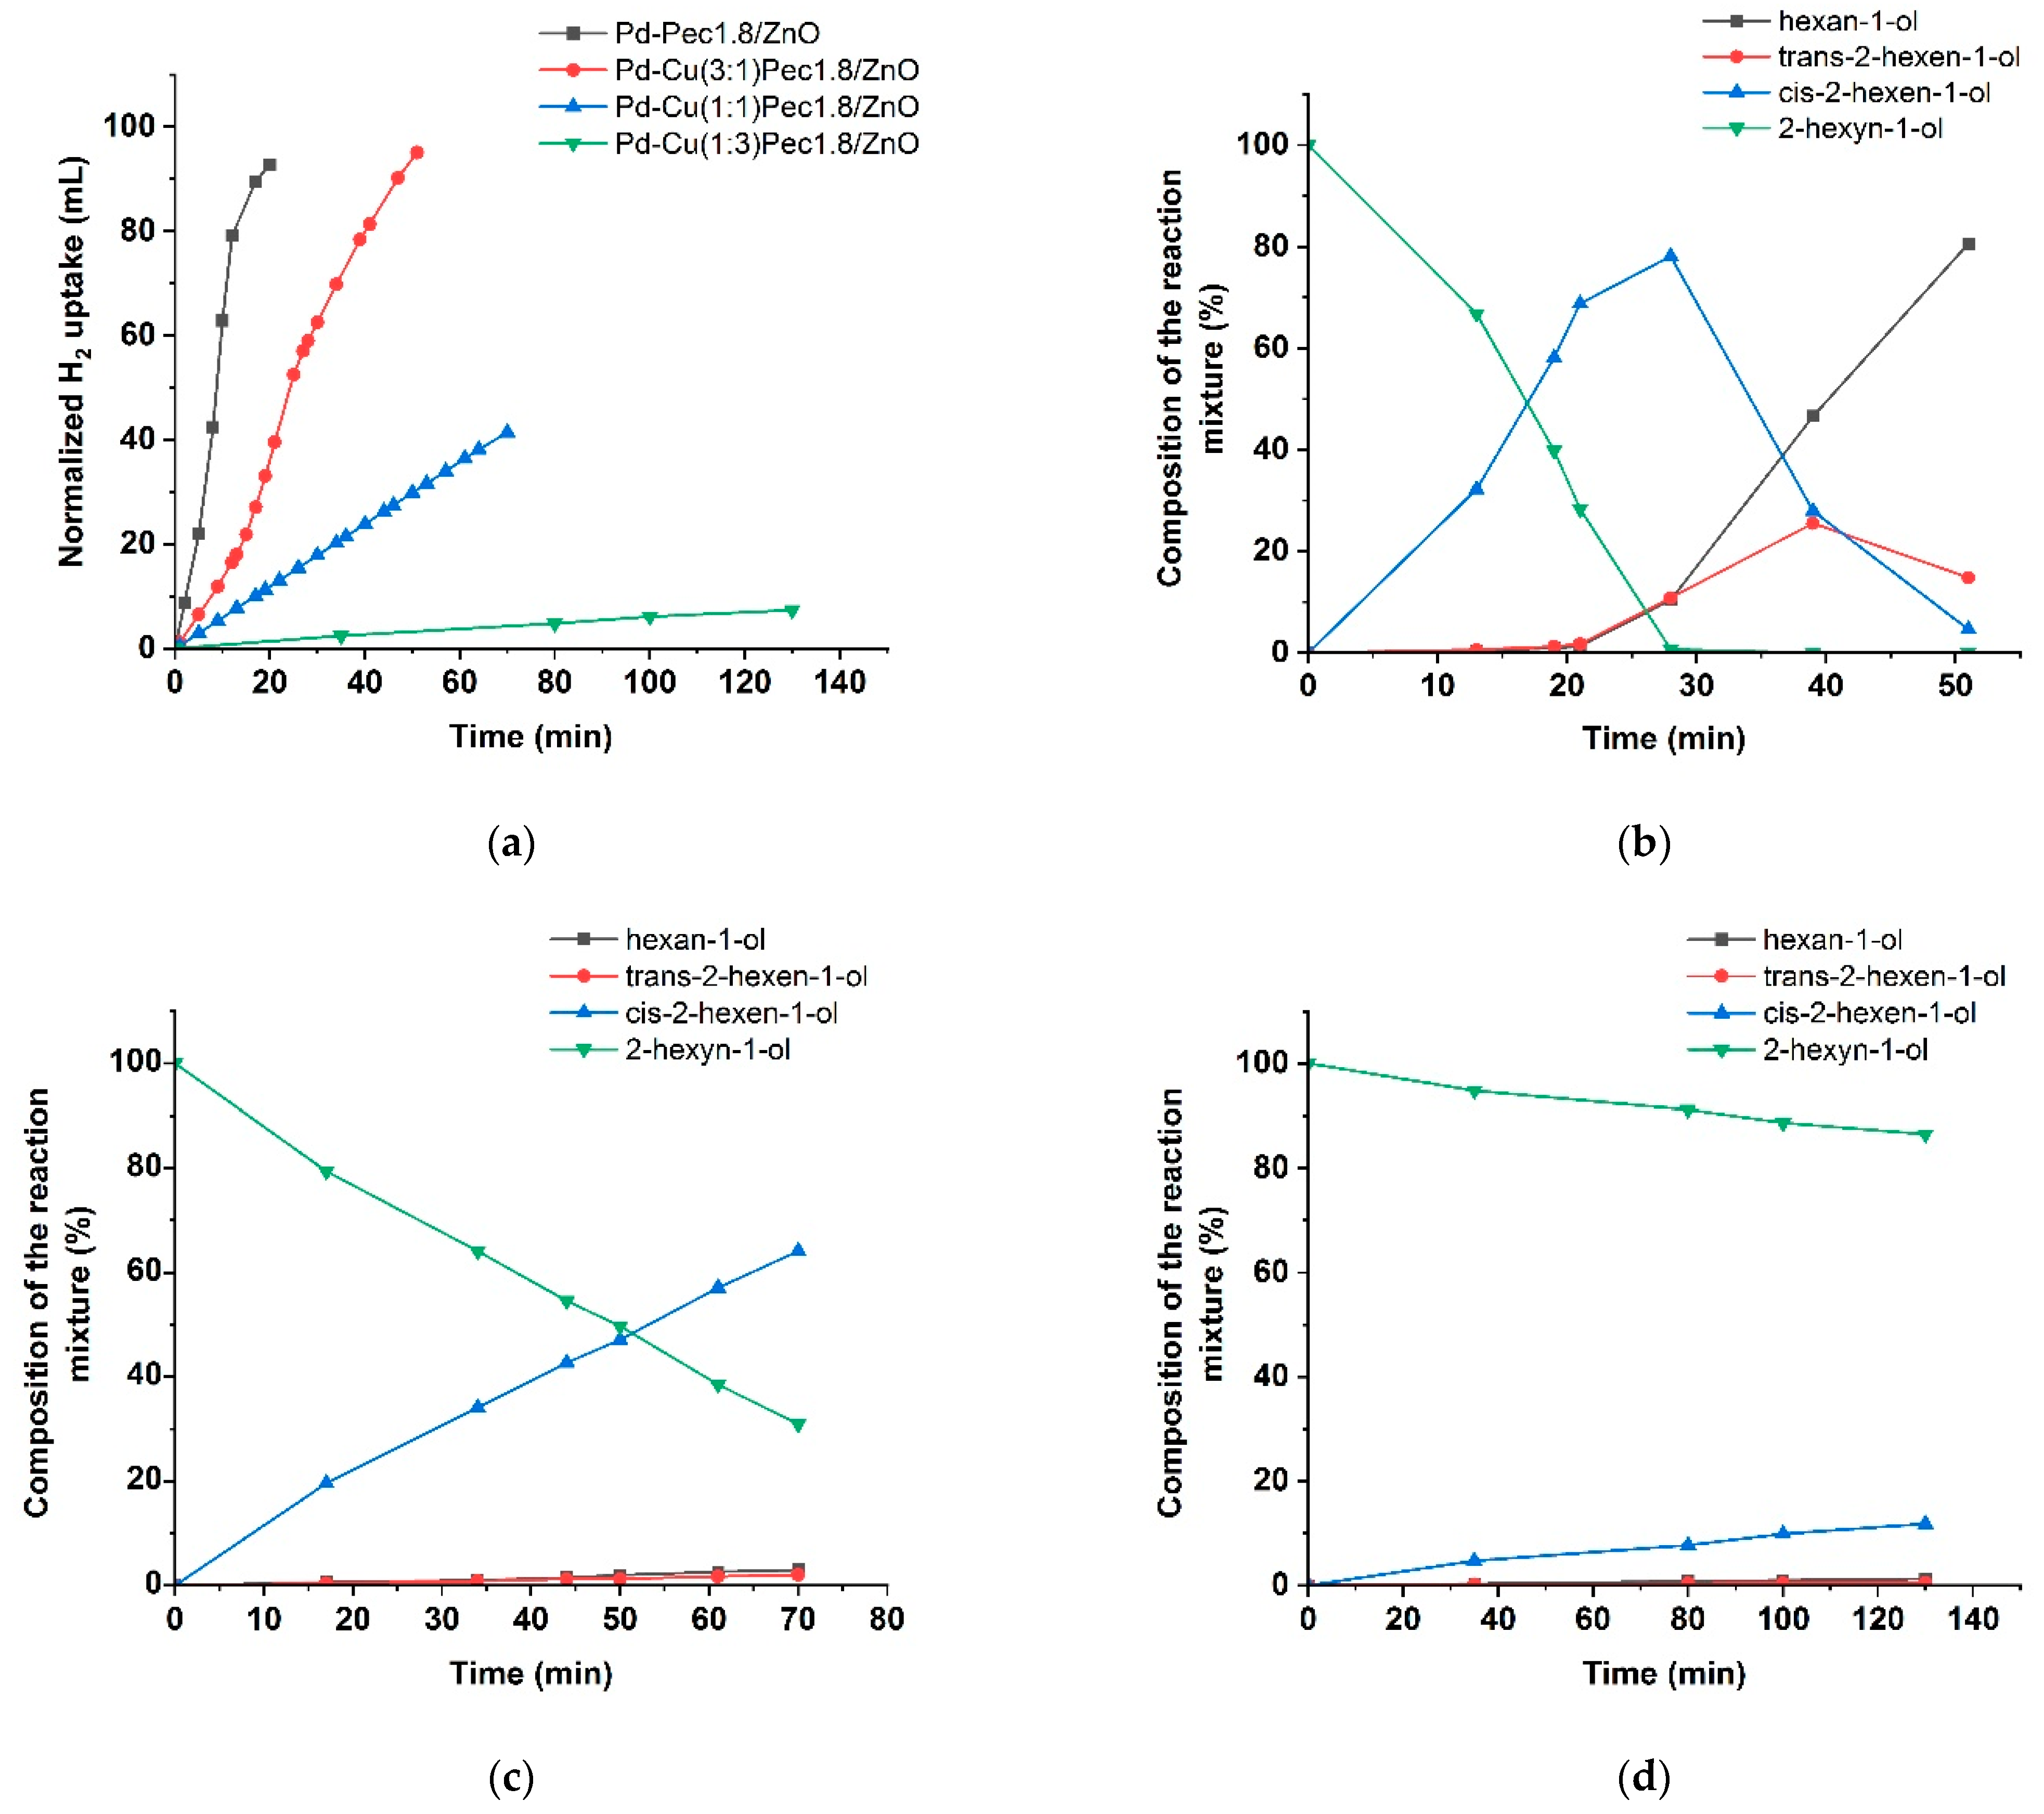
Figure 9 presents the results of testing the bimetallic PdCu-Pec1.8/ZnO catalysts. The modification with copper was shown to be significantly affected the activity of the optimized Pd-Pec1.8/ZnO catalyst. Compared to the monometallic Pd-Pec1.8/ZnO catalyst, which reached the semi-hydrogenation point in 8 min, the bimetallic PdCu(3:1)–Pec1.8/ZnO catalyst required a significantly longer time of 24 min under identical conditions. The other bimetallic catalysts exhibited negligible activity. Hydrogen uptake reached 41 mL for PdCu(1:1)-Pec1.8/ZnO (after 70 min) and 7 mL for PdCu(1:3)-Pec1.8/ZnO (after 130 min) (
Figure 9a). This altered behavior can be attributed to the incorporation of copper, which, according to the XPS data (
Figure 6), appears to cover the Pd species and suppress their reduction to the catalytically active metallic state (Pd
0). The composition of the reaction mixture over PdCu(3:1)-Pec1.8/ZnO changed similarly to that observed for the monometallic analog, but at a slower rate. The maximum yield of cis-2-hexen-1-ol before reaching the semi-hydrogenation point (24 min) was 69% at 72% substrate conversion (data at 21 min), corresponding to 96% selectivity toward the target product (
Figure 9b). The yield of cis-2-hexen-1-ol on PdCu(1:1)-Pec1.8/ZnO reached 64% at 69% substrate conversion (70 min) (
Figure 9c), whereas for PdCu(1:3)-Pec1.8/ZnO this value did not exceed 12%, even after 130 min of reaction (
Figure 9d).
The hydrogenation rate and selectivity of the catalysts, calculated from hydrogen uptake and chromatographic analysis data, respectively, are summarized in
Table 3.
Modification with a minimal amount of pectin (1.8%) led to a slight improvement in the activity of the Pd/ZnO catalyst, while maintaining similarly high selectivity toward cis-2-hexen-1-ol. The increased activity can be attributed to the stabilizing effect of pectin, which promoted a more uniform distribution of palladium particles on the support surface. However, further increasing the pectin content to ~8% resulted in decreased activity and selectivity. This effect is likely due to steric hindrance restricting substrate access to the active sites caused by excess polymer. The addition of copper caused a significant decrease in catalyst activity, which is attributed to its influence on the state and structural environment of the palladium active sites. At the same time, selectivity was not improved, and even decreased, for samples with higher copper content.
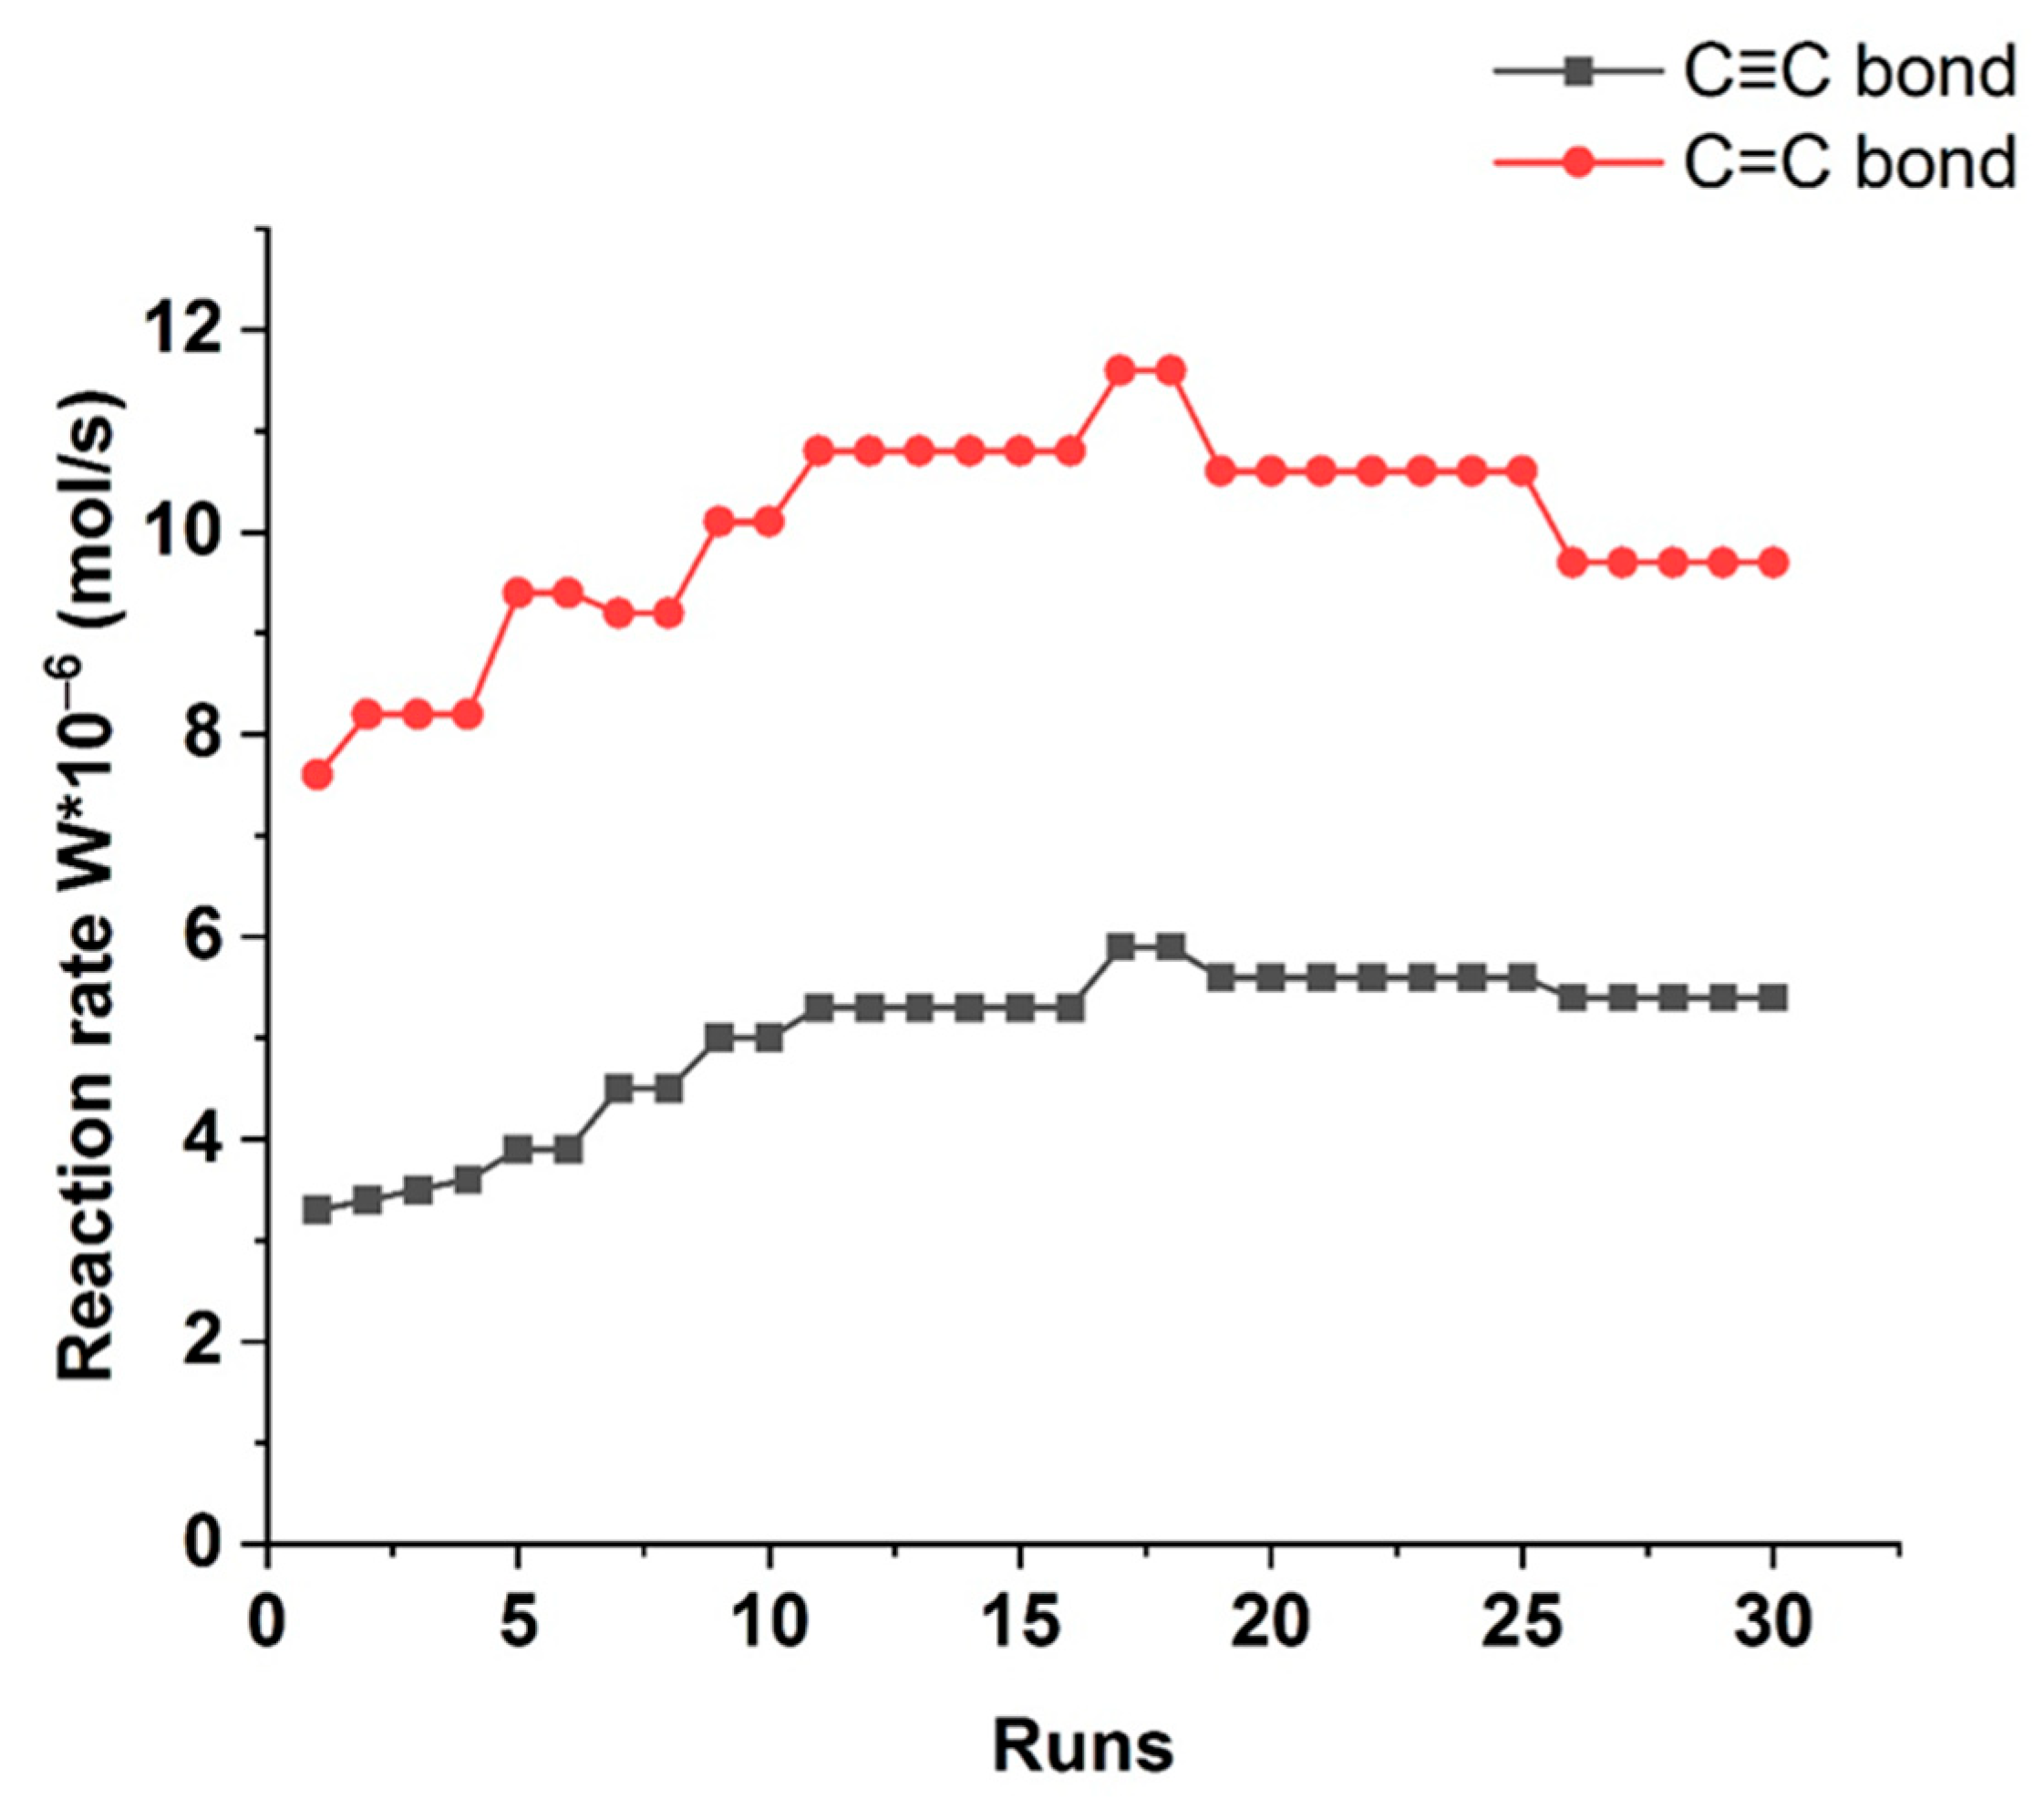
The most optimal Pd-Pec1.8/ZnO catalyst was successfully reused during 30 runs without loss in its activity (
Figure 10). Moreover, after the first run, insignificant increase in catalytic efficiency was observed: the reaction rates of W
C≡C and W
C=C in the subsequent cycles reached 5.9 × 10
−6 and 11.6 × 10
−6 mol/s, respectively. This enhancement can be attributed to the more complete reduction of Pd
2+ to catalytically active Pd
0 during the initial reaction cycles [
41]. Elemental analysis of the catalyst after 30 cycles showed that the palladium content did not decrease, but rather slightly increased from 0.96 wt% to 1.09 wt%. This indicates that Pd leaching is practically negligible. A minor increase in surface Pd concentration can be attributed to the reduction of PdO to metallic Pd during the reaction, resulting in surface enrichment of catalytically active Pd
0 species. Atomic absorption spectroscopy (AAS) analysis of the reaction solution after 30 runs showed palladium levels comparable to those in the blank sample, indicating no measurable leaching and confirming the catalyst’s excellent stability.
The catalytic properties of Pd-Pec1.8/ZnO were compared to those of other reported Pd catalysts (
Table 4). The values of selectivity to cis-olefinic alcohols (96%), the reaction rate in terms of TOF (0.7 s
−1), and stability in terms of TON (29,000) were comparable to those of other advanced Pd-based catalysts supported on various materials. Moreover, after the first ten runs, the activity of the Pd-Pec1.8/ZnO catalyst increased, with the reaction rate in terms of TOF reaching up to 1.0 s
−1, indicating excellent stability and potential for long-term application.
2.3. Perfomance of the Catalysts in Photocatalytic H2 Production
Before conducting photocatalytic H
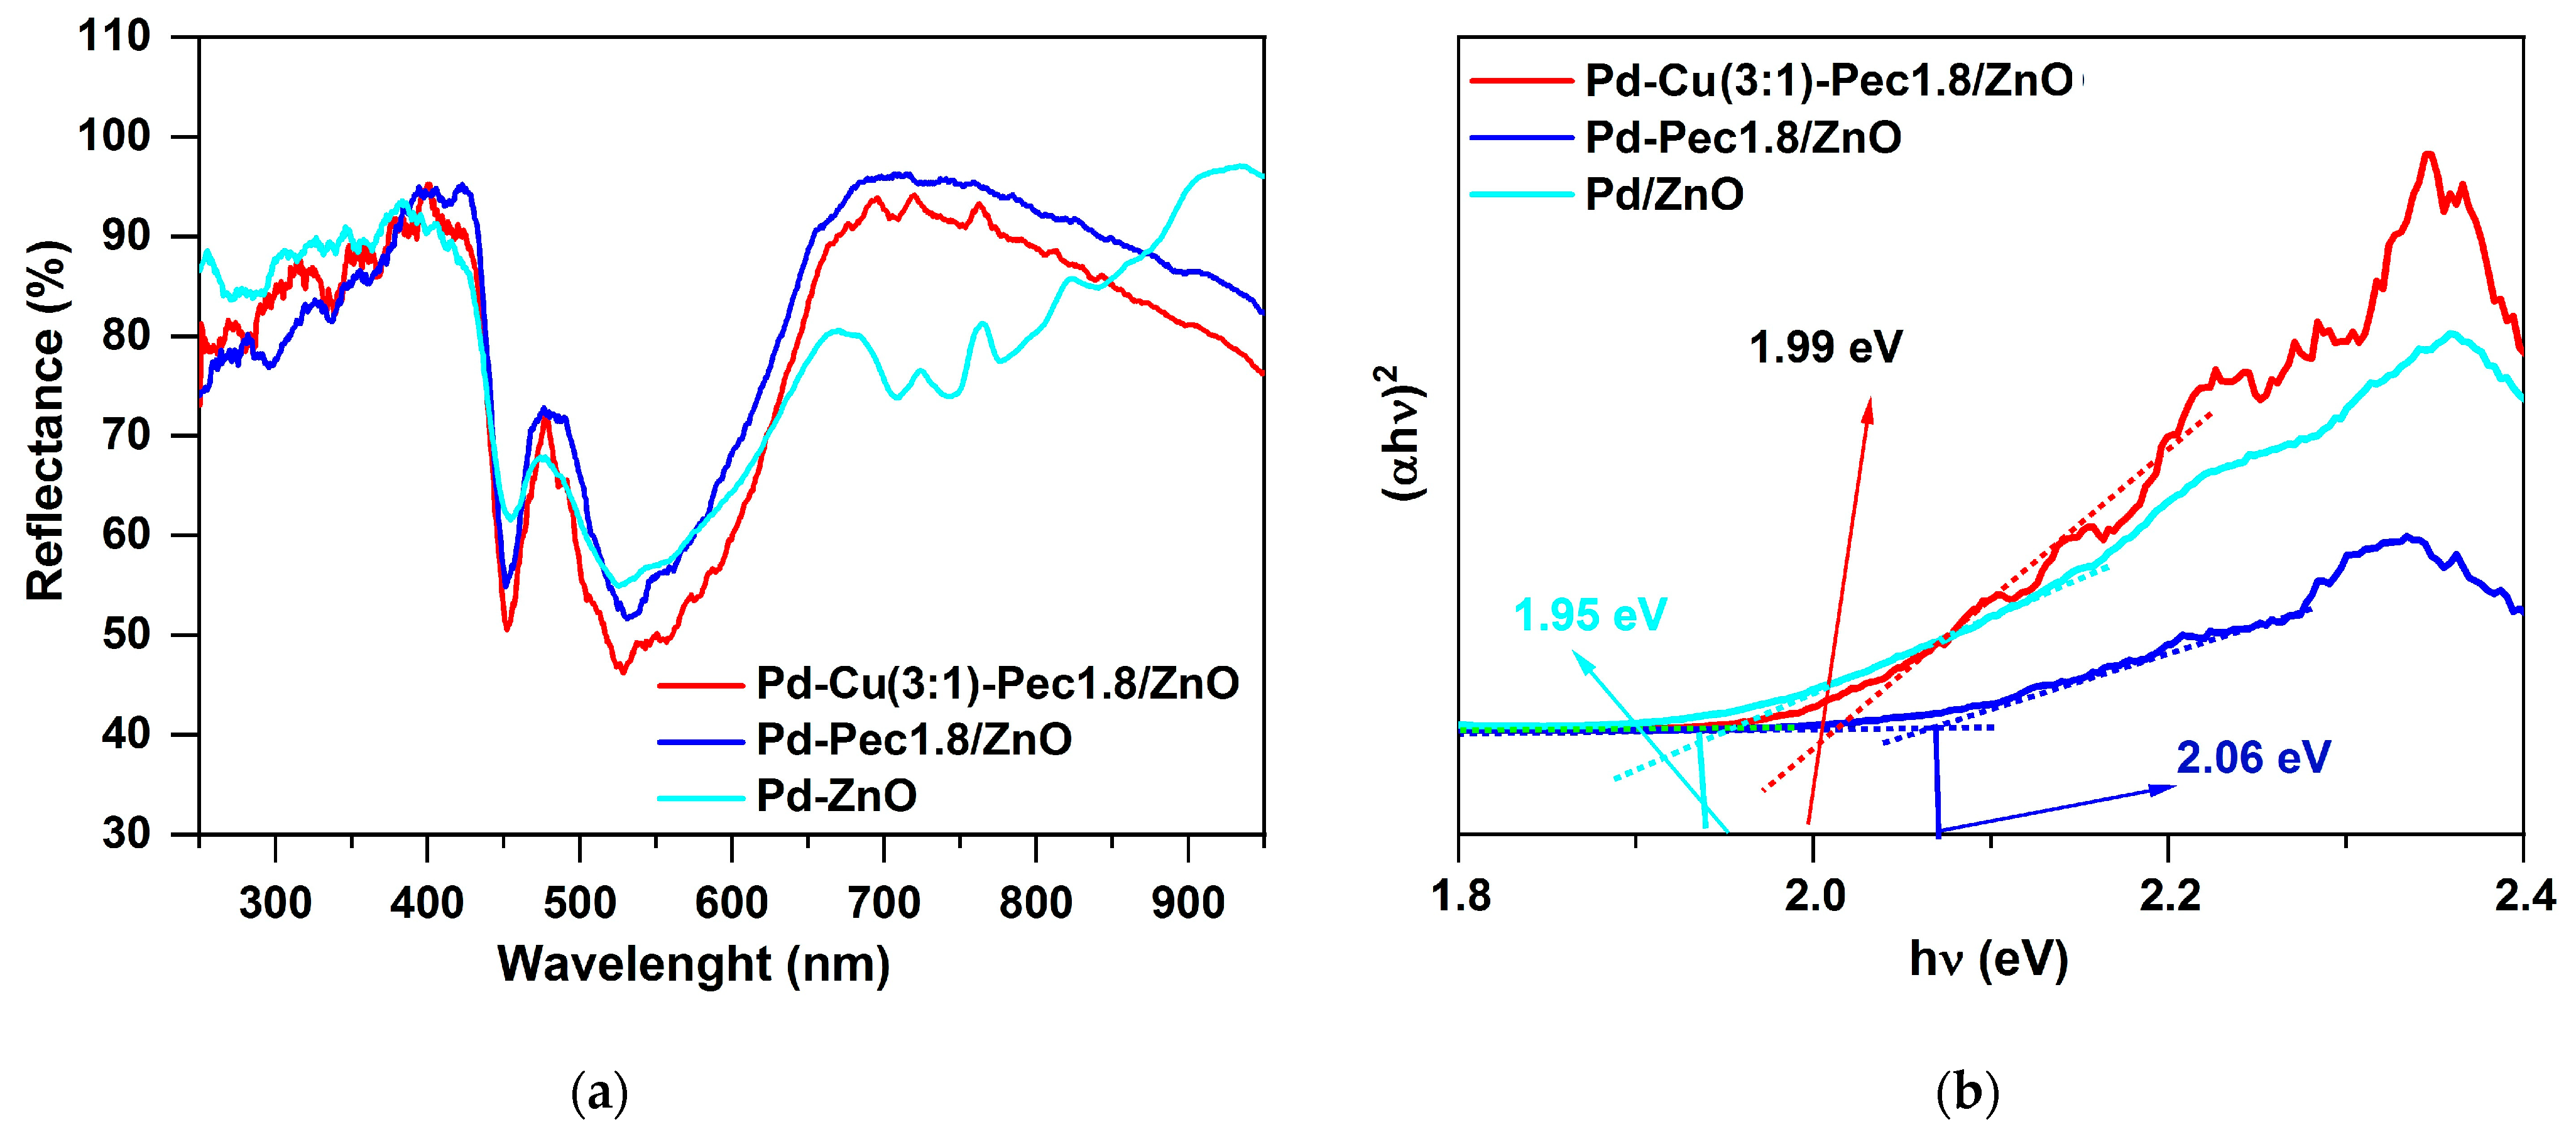
2 evolution experiments, the optical properties of Pd/ZnO, Pd-Pec1.8/ZnO, and Pd-Cu(3:1)-Pec1.8/ZnO were evaluated using Ultraviolet–Visible diffuse reflectance spectroscopy (UV-vis DRS) method (
Figure 11).
Figure 11a shows the UV–Vis diffuse reflectance spectra of the catalysts. Compared with the literature data for pristine ZnO, where the absorption edge is typically observed at ~380–400 nm [
43], a noticeable red shift of the absorption edge to ~430–450 nm is observed for all palladium-containing samples. This shift may be attributed to the surface plasmon resonance (SPR) effect of metallic Pd nanoparticles, which extends the light absorption into the visible region [
44]. The Pd/ZnO sample exhibits three distinct absorption bands (observed as reflectance minima) in the regions of approximately 400–500 nm, 500–600 nm, and 650–800 nm. These features likely originate from the superposition of interband transitions in ZnO, SPR of Pd, and possibly electronic transitions associated with palladium aggregates formed on the surface of ZnO [
44]. Interestingly, in the pectin-modified samples (Pd-Pec1.8/ZnO and PdCu(3:1)-Pec1.8/ZnO), the broad absorption band in the 650–800 nm region is absent. This disappearance is probably due to stabilization role of pectin, preventing the aggregation of Pd nanoparticles on the surface of ZnO (
Figure 4) and the formation of larger plasmon-active domains. Tauc plot analysis (
Figure 11b) showed that the band gap values were 1.95, 1.99, and 2.06 eV for Pd/ZnO, PdCu(3:1)-Pec1.8/ZnO, and Pd-Pec1.8/ZnO, respectively. All values are significantly lower than that of pristine ZnO (~3.37 eV) [
44], confirming the strong modifying effect of metal nanoparticles and Pec component on the electronic structure of ZnO.
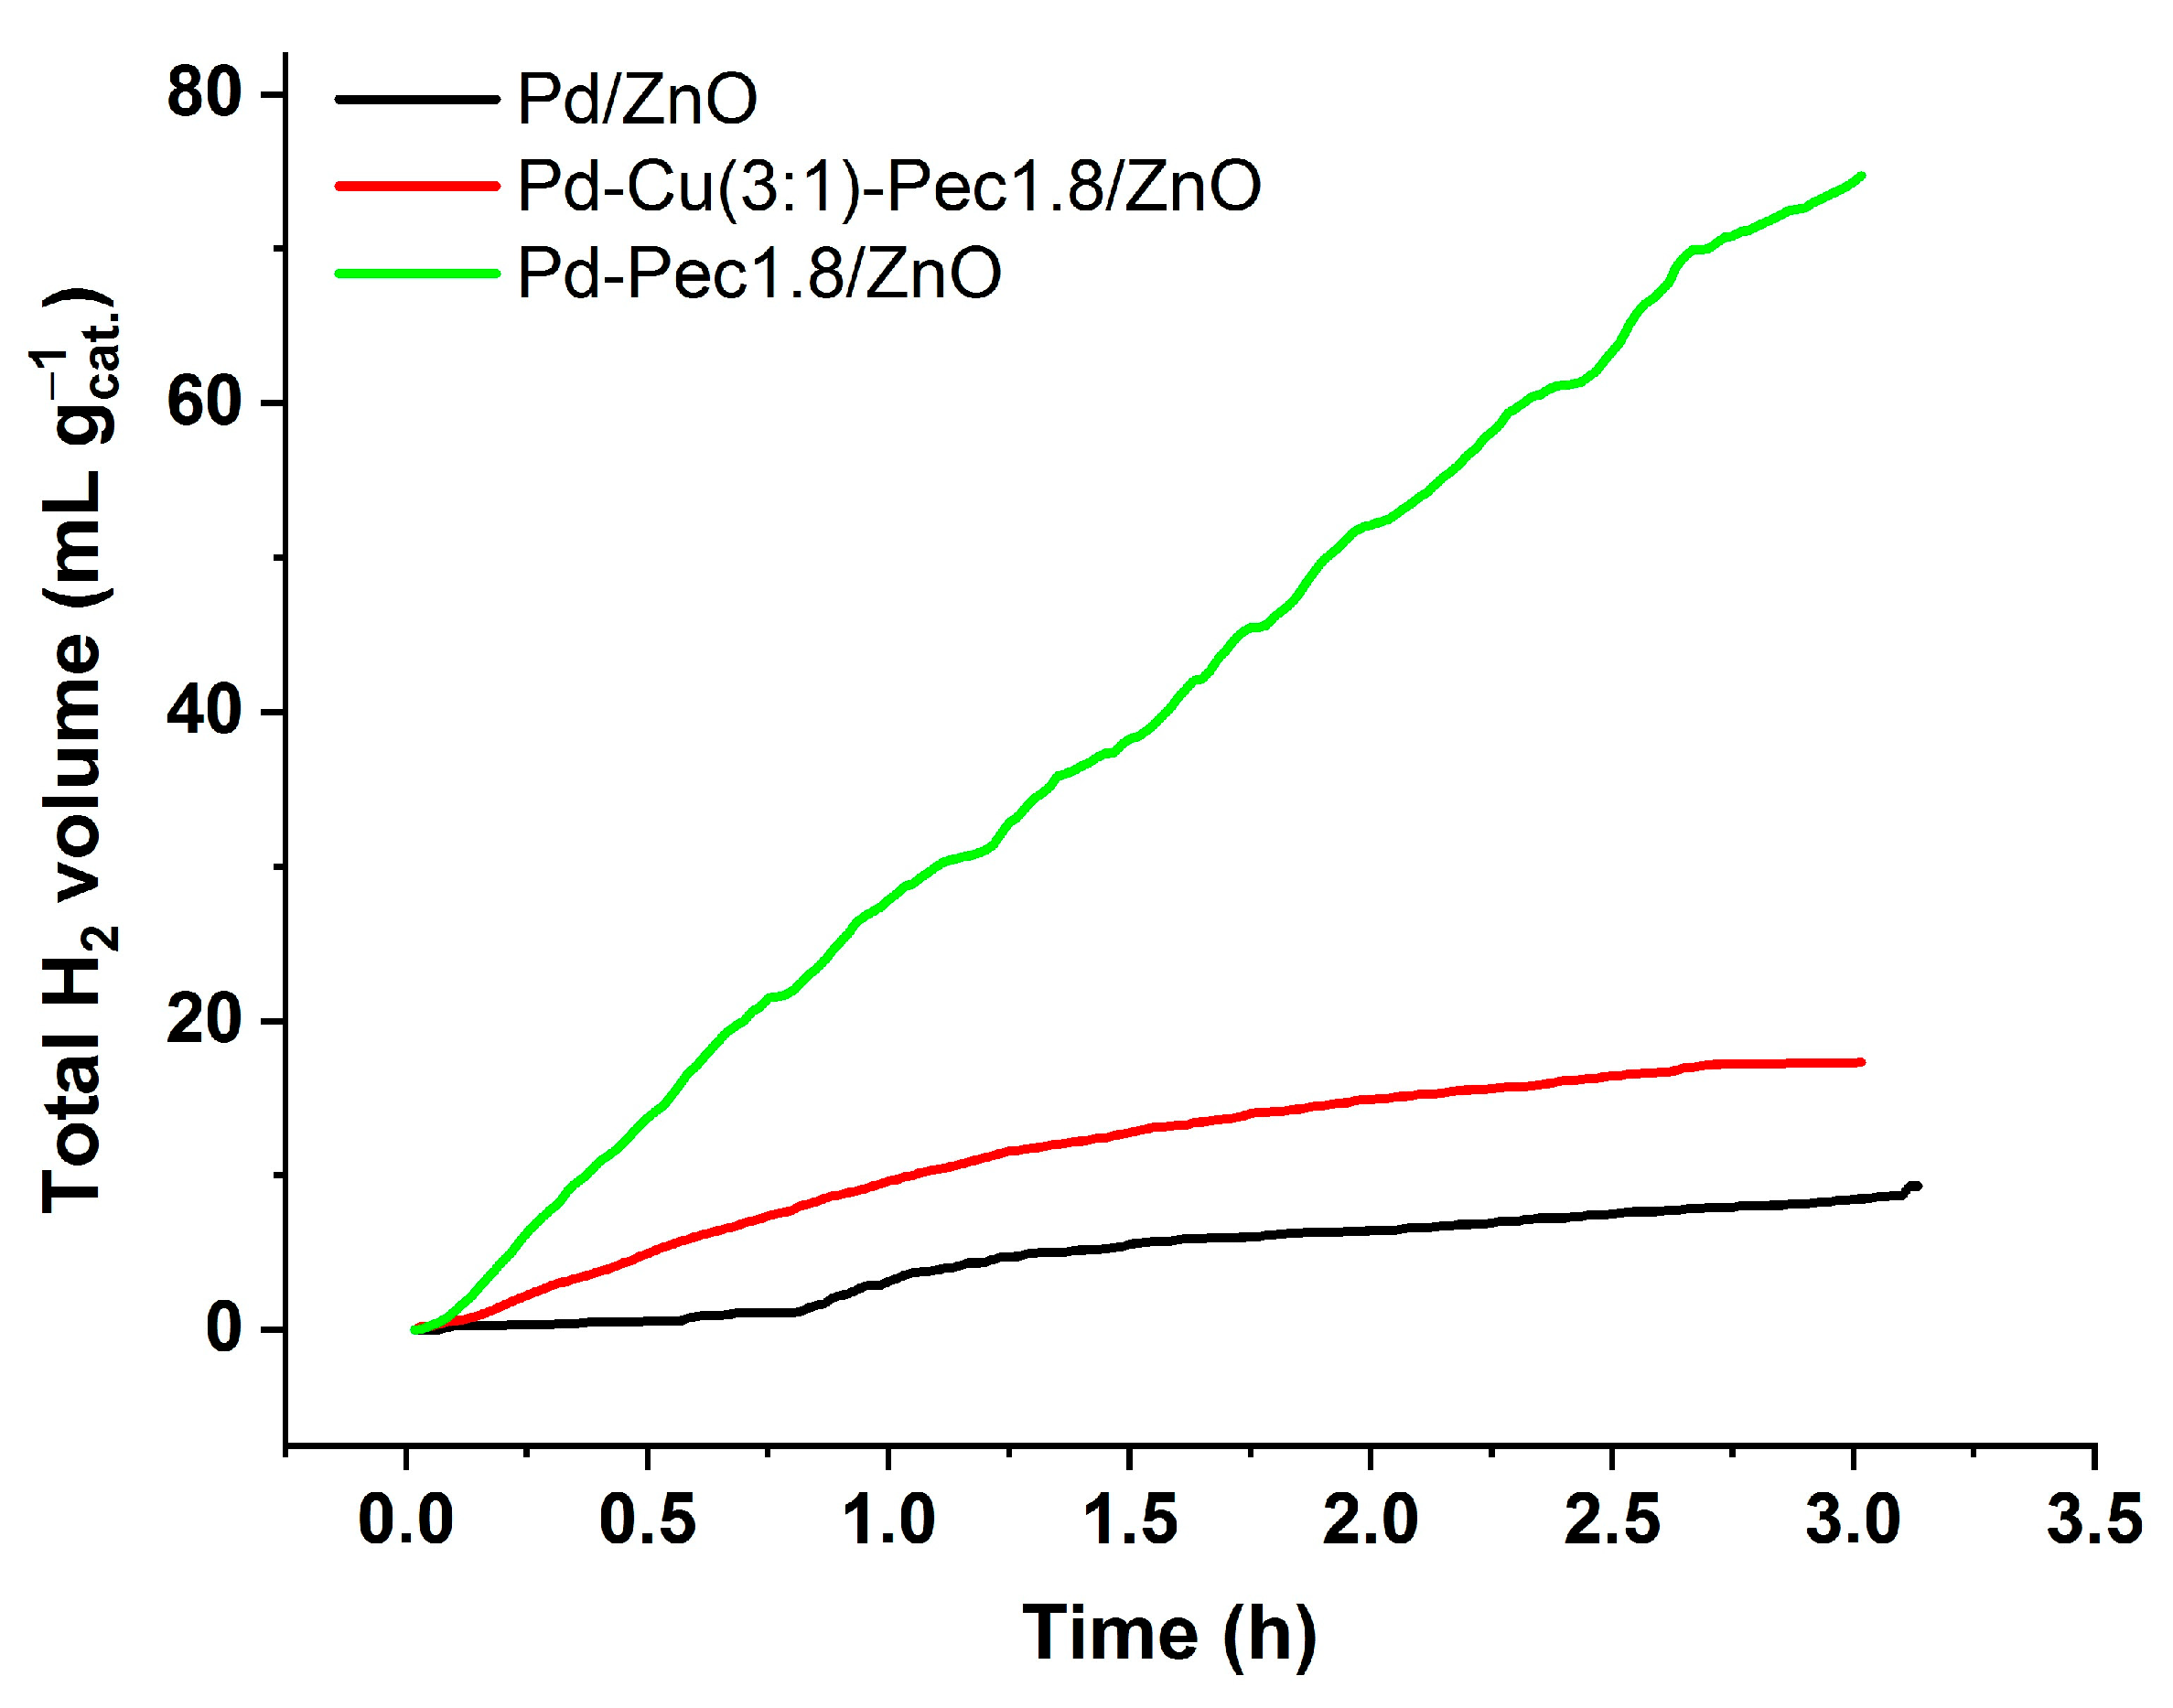
Despite having the widest band gap, Pd–Pec1.8/ZnO demonstrated the highest photocatalytic activity for hydrogen evolution under visible-light irradiation. Conversely, Pd/ZnO, with the narrowest band gap, was the least active, while the bimetallic Pd–Cu(3:1)–Pec1.8/ZnO sample showed intermediate performance. The total amount of hydrogen produced within 3 h was 74.7, 17.3, and 9.3 mL/g
cat for Pd-Pec1.8/ZnO, PdCu(3:1)-Pec1.8/ZnO, and Pd/ZnO, respectively (
Figure 12). Accordingly, the photocatalytic hydrogen evolution rate (PCHE) followed the order: Pd–Pec1.8/ZnO (1.11 mmol/(h·g
cat)) ≫ PdCu(3:1)–Pec1.8/ZnO (0.26 mmol/(h·g
cat)) > Pd/ZnO (0.14 mmol/(h·g
cat)). The PCHE rate of Pd–Pec1.8/ZnO (1.11 mmol/(h·g
cat)) is comparable to those of several advanced photocatalysts reported in the literature. For example, 5 wt% Pd–ZnS demonstrated a hydrogen evolution rate of 0.94 mmol/(h·g
cat) under similar conditions (50 mg catalyst, Na
2S/Na
2SO
3 as sacrificial agent, light intensity 100 mW cm
−2) [
45]. Likewise, Pd@TiO
2CA achieved 0.76 mmol/(h·g
cat) [
41] and RGO–Cd
0.
60Zn
0.
40S–0.5%Mo reached 1.54 mmol/(h·g
cat) [
46], both under simulated solar light (1000 W m
−2) with Na
2S/Na
2SO
3 as sacrificial agents.
Pd–Pec1.8/ZnO and PdCu(3:1)–Pec1.8/ZnO demonstrated higher photocatalytic performance compared to Pd/ZnO. According to TEM studies (
Figure 4), in both pectin-modified samples metal nanoparticles (Pd and Cu) with an average size of 3.4–3.6 nm were uniformly dispersed over the ZnO surface. In contrast, for Pd/ZnO, Pd nanoparticles (3.7 nm) tended to form larger aggregates with sizes up to 10–30 nm. This clearly indicates that the catalysts’ performance is primarily governed by their morphological and structural characteristics, rather than by differences in band gap values. A similar morphology-driven enhancement of photocatalytic activity was demonstrated by Wang et al. [
47], who developed a homojunction photocatalyst based on CeO
2 nanosheets with spatially separated oxidation and reduction phases located on opposite surfaces. The distinct crystalline facets of the smooth and rough sides enabled the efficient separation of photogenerated charge carriers. This morphological design resulted in a threefold increase in hydrogen evolution activity compared to pristine CeO
2 nanosheets, and even outperformed Au-modified CeO
2, despite the absence of noble metal co-catalysts. These findings highlight that structural and morphological features can exert a more significant impact on photocatalytic performance than conventional modifiers aimed at tuning the electronic and optical properties.
However, between the two pectin-modified samples, Pd–Pec1.8/ZnO exhibited superior activity compared to PdCu(3:1)–Pec1.8/ZnO, despite having a similar nanoparticle size and dispersion. XPS analysis provides insight into this difference (
Figure 6). After H
2 treatment, both catalysts contained Pd
0 species, which are known to act as efficient electron traps [
48], enhancing the spatial separation of photogenerated charge carriers via the ZnO–Pd Schottky junction. This suppresses charge recombination and promotes overall photocatalytic activity. In Pd–Pec1.8/ZnO, the high proportion of metallic Pd
0 (~78%) provides a large number of active sites for electron trapping and catalytic hydrogen evolution. In contrast, PdCu(3:1)–Pec1.8/ZnO contains significantly less Pd
0 (~22%), which already limits its efficiency. Furthermore, XPS analysis suggests that, in the bimetallic system, Pd nanoparticles may be partially or fully covered by a Cu-based shell, forming core–shell-like structures. This coverage can hinder the direct formation of a ZnO–Pd Schottky junction, which is crucial for efficient electron extraction and charge separation. As a result, the role of charge trapping may shift from Pd
0 to Cu
2O. The ability of Cu species (e.g., Cu
2O) to facilitate charge separation is significantly inferior to that of metallic palladium (Pd
0) [
49]. Consequently, the photocatalytic efficiency of the bimetallic system remains lower, despite the presence of an additional component.
In summary, the superior activity of Pd–Pec1.8/ZnO can be attributed to (i) enhanced light absorption in the visible region, likely resulting from the plasmonic effect of Pd nanoparticles; (ii) more uniform dispersion of Pd nanoparticles, leading to improved charge separation and efficient utilization of active sites; and (iii) the absence of Pd–Cu interactions, which, in the bimetallic sample, hinder the reduction of Pd2+ to catalytically active Pd0, thereby limiting the formation of effective electron traps.
The long-term stability of the most active Pd–Pec1.8/ZnO catalyst was evaluated over three consecutive photocatalytic cycles (3 h each) under identical conditions without replacing the catalyst. The total hydrogen yield in the first run was 74.7 mL/gcat, while in the second and third runs it slightly decreased to 71.0 and 70.5 mL/gcat, respectively, corresponding to ~94.3% retention of the initial activity. These results confirm that the catalyst can be reused at least three times without significant loss of performance, demonstrating good stability and recyclability.


