Article

The Impact of Proinflammatory M1 Macrophages on the Proliferation and Expression of Cyclin E2, Mitogen-Activated Protein Kinases 4 and 7 in Hepatocytes Isolated from a Diethylnitrosamine-Induced Hepatocellular Carcinoma Rat Model

by
Marta Wójcik
1,
Luisa Pozzo
2,
Andrea Vornoli
2,
Vincenzo Longo
2,
Anna Śmiech
3,
Joanna Czerwik-Marcinkowska
4,
Iwona Rozempolska-Rucińska
5,
Agnieszka Chrapko
6 and
Szymon Zmorzynski
7,*
1
Oncology Lab, Department of Epizootiology and Clinic of Infectious Diseases, Faculty of Veterinary Medicine, University of Life Sciences in Lublin, 20-612 Lublin, Poland
2
Institute of Agricultural Biology and Biotechnology, National Research Council, 56124 Pisa, Italy
3
Department of Pathomorphology and Forensic Medicine, Faculty of Veterinary Medicine, University of Life Sciences in Lublin, 20-612 Lublin, Poland
4
Institute of Biology, Jan Kochanowski University, 25-369 Kielce, Poland
5
Institute of Biological Basis of Animal Production, University of Life Sciences in Lublin, 20-950 Lublin, Poland
6
Institute of Health Sciences, the J.P II Catholic University of Lublin, 20-708 Lublin, Poland
7
Institute of Human Sciences, Faculty of Health Sciences, Academy of Zamosc, 22-400 Zamosc, Poland
*
Author to whom correspondence should be addressed.
Molecules 2025, 30(17), 3657; https://doi.org/10.3390/molecules30173657
Submission received: 28 July 2025 / Revised: 25 August 2025 / Accepted: 5 September 2025 / Published: 8 September 2025
(This article belongs to the Section Chemical Biology)

Abstract

Background: Hepatocellular carcinoma (HCC) is highly resistant to conventional therapies, highlighting the need for novel immunotherapeutic approaches. In the tumor microenvironment (TME), the role of proinflammatory M1 macrophages remains ambiguous. The proteins Mapk4/7 and cyclin E2 (CE2, Ccne2) are crucial for regulating hepatocyte proliferation and may be important factors driving the development of HCC. This study aimed to investigate the effects of M1 macrophages on CE2 and Mapk4/7 expression, as well as hepatocyte proliferation, in a rat model of partial hepatectomy (PH) with or without diethylnitrosamine (DEN)-induced HCC. (2) Methods: Twenty female Wistar rats were assigned to nonneoplastic (PH) or neoplastic (PH/DEN) groups. Gene expression (CE2, Mapk4/7) was quantified via real-time PCR. (3) Results: Overexpression of CE2 and increased proliferation were observed in PH/DEN hepatocytes, whereas exposure to proinflammatory M1 macrophages significantly reduced their proliferative activity. Mapk4/7 expression patterns were modulated by the TME and significantly differ depending on macrophage activation status in both PH and PH/DEN-derived hepatocytes. (4) Conclusions: Our findings indicate that CE2 expression is upregulated in PH/DEN cells, with a notable decrease in the presence of M1 macrophages. In contrast, compared with control macrophages, M1 macrophages did not significantly affect Mapk4/7 expression.

1. Introduction

Hepatocellular carcinoma (HCC) is the most common type of primary liver cancer and is associated with high morbidity and mortality rates [1,2,3]. Despite significant advances in the management of HCC, the prognosis after local therapies and surgical resection remains poor [4].
The tumor microenvironment (TME) consists of malignant cells and a variety of normal cell types [5]. Tumor-transformed hepatocytes exhibit increased anaerobic glycolysis and secrete signaling molecules, including L-6, tumor necrosis factor alpha (TNF-α), and exosomal miRNAs, into the microenvironment [6,7,8,9]. Various factors can influence the TME through distinct mechanisms, notably by modulating macrophage activity. Within the TME, immune cells with diverse phenotypes are present, including both proinflammatory M1 and anti-inflammatory M2 macrophages [10]. Tumors tend to promote the M2 phenotype of macrophages (i.e., immunosuppressive, promoting angiogenesis and tumor growth), precisely to avoid the immune response [11]. Nevertheless, some inflammatory signals released from necrotic tumor areas can temporarily activate macrophages toward the M1 phenotype (proinflammatory), especially in the very early stages of the antitumor response [12]. Although M2 macrophages (Mf-M2) are well recognized for their protumor role, the function of M1 macrophages (Mf-M1) in HCC development is complex and context dependent [13]. On the one hand, M1 macrophages are thought to be tumoricidal, through the release of inflammatory cytokines, reactive nitrogen intermediates (RNI), and reactive oxygen species (ROS) [14]. From another perspective, these macrophages promote tumorigenesis and tumor progression [13].
It has been suggested that cell proliferation is directly associated with carcinogenesis [15]. During HCC development, an increase in the rate of proliferation is one of the earliest phenotypic changes detected in preneoplastic and neoplastic hepatocytes [16]. Thus, cell proliferation is a useful parameter for predicting the aggressiveness of HCC cells. Mapk4 and Mapk7 (Erk5, Bmk1) belong to the mitogen-activated protein kinase (Mapk) subfamily, which regulates many cellular processes, including proliferation, differentiation, and the stress response [17,18]. They are critical in the passage of cells through cell cycle checkpoints. Mapk4/7 kinases can modulate cyclin expression. Cyclin E2 (CE2, Ccne2) binds and activates its kinase partner, the cyclin-dependent kinase 2 (Cdk2) [19]. Thus, the formed complexes phosphorylate proteins that govern cell cycle progression, as well as proteins involved in histone biosynthesis, centrosome duplication, and the firing of DNA replication origins [20]. Through the phosphorylation of regulatory proteins, Mapk4/7 affects the activity of CE2/Cdk2 complexes, facilitating cell cycle progression [21]. In HCC, increased Mapk activity is often associated with increased tumor cell proliferation [18,22]. These findings suggest that increased activity of Mapks, including Mapk4 and Mapk7, may contribute to increased proliferation of cancer cells in HCC. CE2 overexpression promotes uncontrolled cell division and tumor progression [23]. During the cell cycle, the relevant mechanism that drives cells from the G0/G1 phase into the S phase is controlled by CE2 [19]. For HCC, many authors have indicated a strong relationship between the expression of CE2 and the proliferative activity of neoplastic liver cells [23,24,25]. Cyclin E overexpression is observed in most HCC cases and has been shown to be correlated with poor clinical outcomes [25]. Collectively, these findings suggest that CE2 intensifies cell proliferation, driving tumorigenic processes during HCC development [26].
Considering the above information, we analyzed the effects of proinflammatory M1 macrophages on the expression of CE2 and Mapk4/7 in hepatocytes isolated from a rat model of diethylnitrosamine-induced (DEN-induced) hepatocellular carcinoma. DEN is a very well-known chemical carcinogen that is widely used in experimental models to induce HCC in rodents [27]. It mimics the processes that occur in humans with chronic liver damage (e.g., alcohol, hepatitis B/C), but in an accelerated and controlled manner [28]. To investigate the correlation between CE2, Mapk4/7 and neoplastic hepatocyte apoptosis, we employed a well-known and highly reproducible rat model of DEN-induced hepatocarcinogenesis. Moreover, considering the tumorigenic activity of Mf-M1, we sought to analyze their influence on CE2 expression, as well as on Mapk4/7 and the proliferative activity of neoplastic rat hepatocytes. To achieve this goal, we used the dynamic flow Quasi-Vivo System, which allows the coculture of different cell types, thereby allowing the analysis of their interactions with each other. To the authors’ knowledge, the proposed research has not previously been conducted to this extent.

2. Results

The present study concerns the analysis of CE2 and Mapk4/7 expression in rat hepatocytes after partial hepatectomy (PH) and PH/DEN. In addition, we analyzed (I) liver function via the following serum markers: alanine aminotransferase (ALT), aspartate aminotransferase (AST), γ-glutamyltransferase (GGT) and alkaline phosphatase (AP); (II) morphological and histological changes in the liver; (III) alpha-fetoprotein (AFP) levels in hepatocytes (as a marker of HCC); and (IV) changes in the morphology of hepatocytes cultured with Mf and Mf-M1.

2.1. Body Weight and Blood Biochemical Analyses

Compared with animals subjected to partial hepatectomy alone (PH), those subjected to partial hepatectomy combined with diethylnitrosamine administration (PH/DEN) presented a significantly reduced growth rate relative. At the time of sacrifice, the body weights of the PH/DEN-treated rats were approximately 18% lower than those of the PH-treated rats, and this difference was statistically significant. Additionally, the plasma levels of AST, ALT, ALP, and GGT were significantly elevated in the PH/DEN group compared with those in the PH-only group (Table 1).

2.2. Histological Examination of PH/DEN-Induced Livers

Chronic liver damage and regions exhibiting cellular atypia were characteristic features observed in liver sections from PH/DEN-treated rats (Figure 1). The most frequently identified histopathological changes included lymphocytic infiltration, hepatocytes with enlarged nuclei, and atypical cellular morphology.

2.3. Alpha-Fetoprotein Levels in PH- and PH/DEN-Derived Hepatocytes

The identity of the cultured neoplastic hepatocytes was confirmed by measuring the concentration of AFP, a standard and widely accepted biomarker of HCC. Elevated AFP levels are commonly associated with HCC. In our study, the AFP concentrations in the PH/DEN-derived cell lysates were approximately sixfold greater than those in the PH group, reaching 61 ± 5.7 ng/mg protein versus 10 ± 2.1 ng/mg protein, respectively (p < 0.001).

2.4. Phenotypes of Primary PH- and PH/DEN-Derived Hepatocyte Cultures

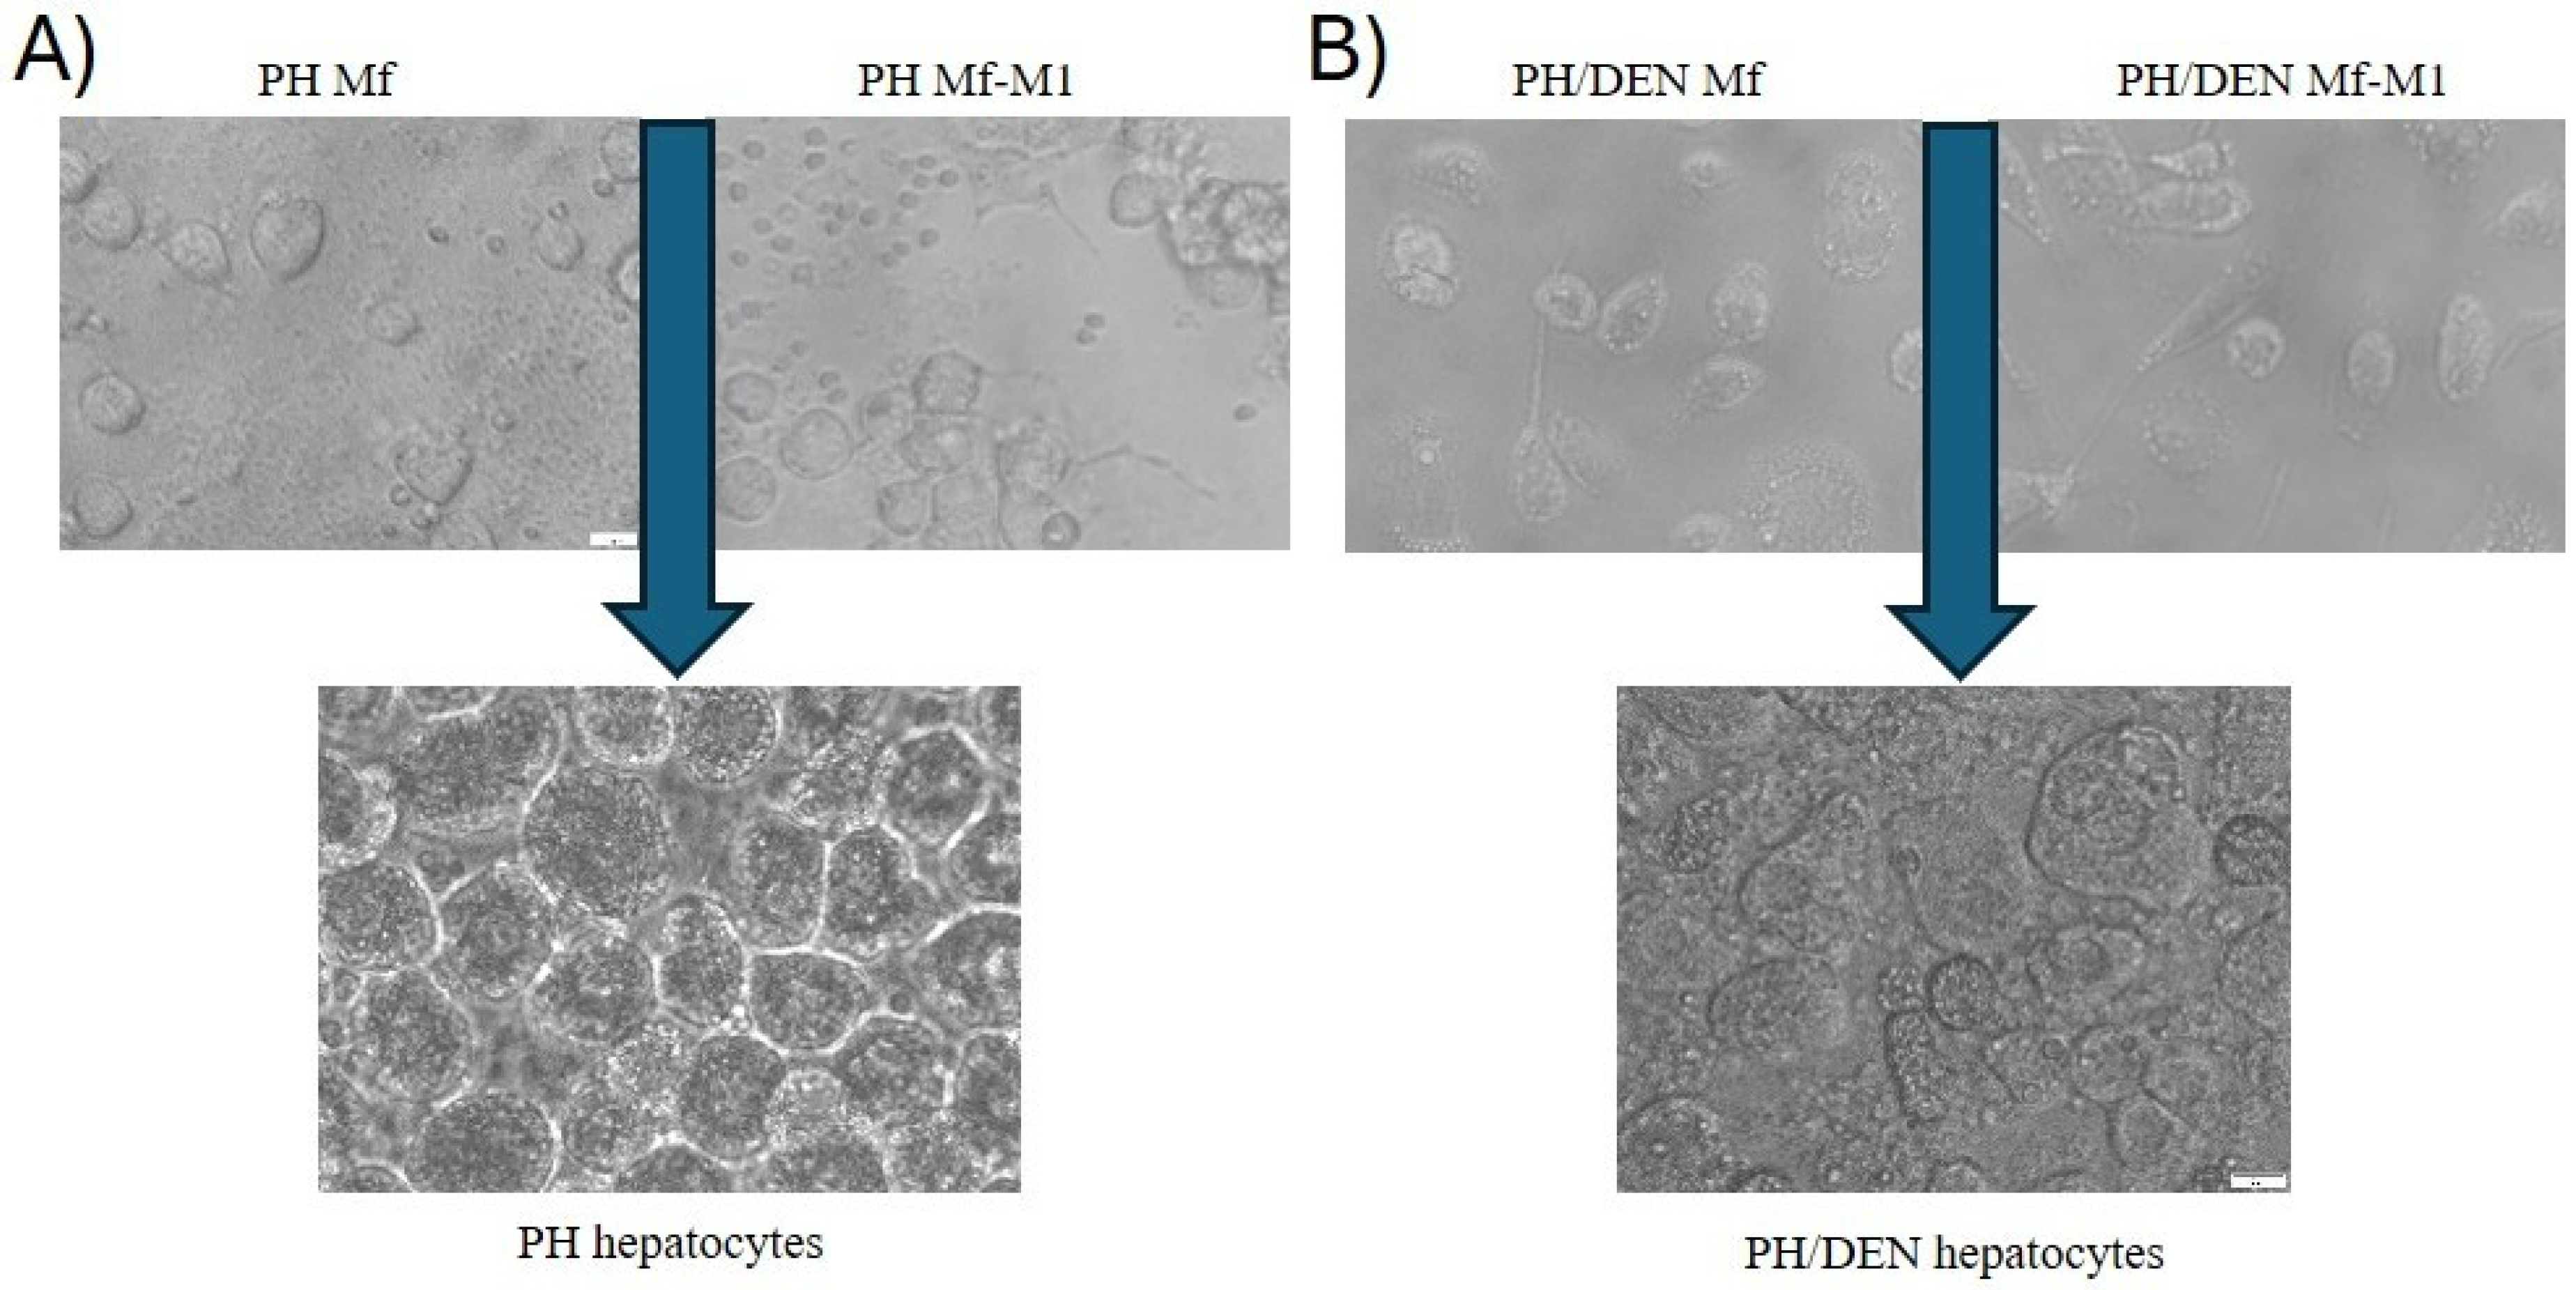
PH-derived hepatocytes adhered to the culture dish within 24 h and, by 72 h, reached confluence, exhibiting the characteristic polygonal morphology of mature hepatocytes (Figure 2A). These cells presented well-defined intercellular boundaries. In contrast, PH/DEN-derived hepatocytes proliferated in culture without forming a regular monolayer (Figure 2B). These cells lacked the typical polygonal morphology of differentiated hepatocytes and displayed a heterogeneous phenotype, with populations of both smaller and larger cells. Furthermore, after 72 h, the PH/DEN hepatocytes began to aggregate and form small colonies.

2.5. CE2 Expression Under Nonneoplastic and Neoplastic Conditions

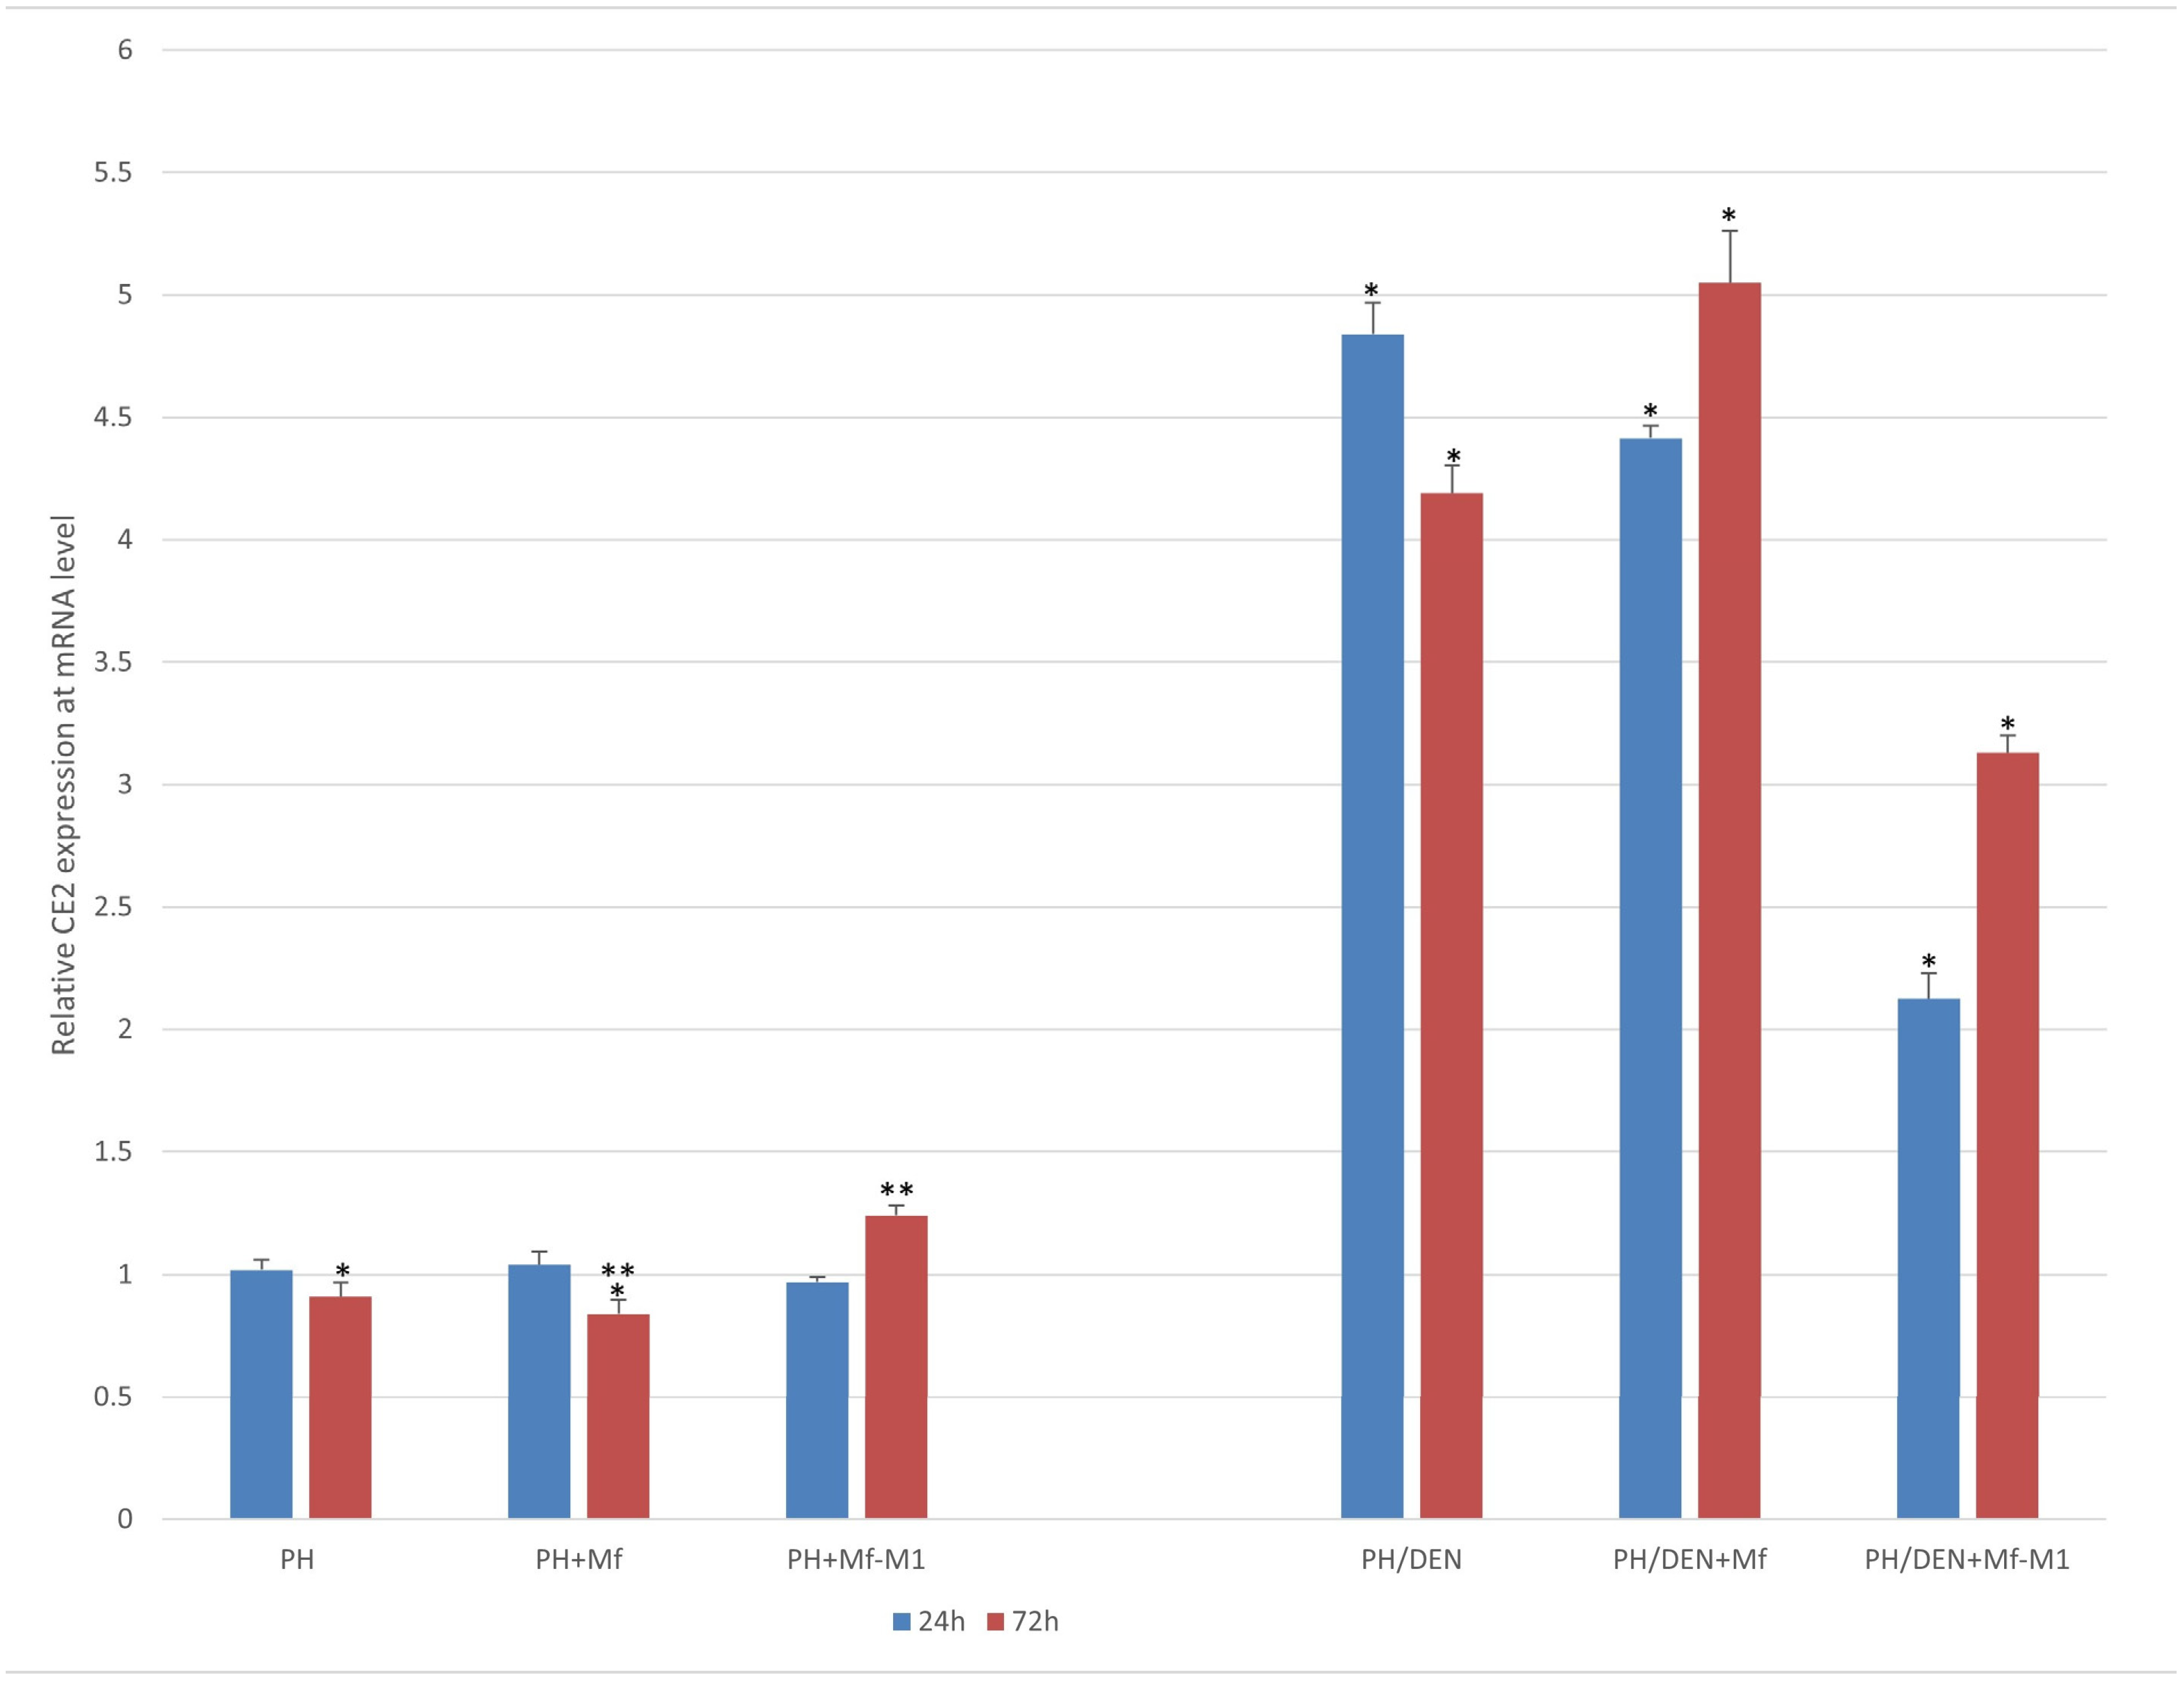
CE2 expression at the mRNA level was detectable in hepatocytes derived from both the PH and PH/DEN models. In PH-derived hepatocytes, CE2 expression remained unchanged after 24 h of culture with mRNA levels close to 1.0, irrespective of coculture with either nonstimulated macrophages (Mf) (p = 0.106) or proinflammatory macrophages (Mf-M1) (p = 0.186) (Figure 3). However, after 72 h, PH hepatocytes cocultured with Mf presented significantly lower CE2 expression than PH hepatocytes alone (p < 0.0001) and PH+Mf-M1 hepatocytes (p < 0.0001) (Figure 3). CE2 was overexpressed in PH/DEN cells after 24 h and 72 h. An increase in CE2 was detected after 24 h and 72 h in PH/DEN-hepatocytes cultured alone or in combination with nonstimulated macrophages (Mf) (Figure 3)—PH/DEN vs. PH/DEN+Mf, p < 0.001 and p < 0.001, respectively. When these cells were exposed to proinflammatory Mf-M1, the expression of CE2 decreased compared with that in the PH/DEN and PH/DEN+Mf groups after 24 h (p < 0.001 and p < 0.001) and 72 h (p = 0.002 and p = 0.01), respectively.

2.6. Mapk4 Expression Under Nonneoplastic and Neoplastic Conditions

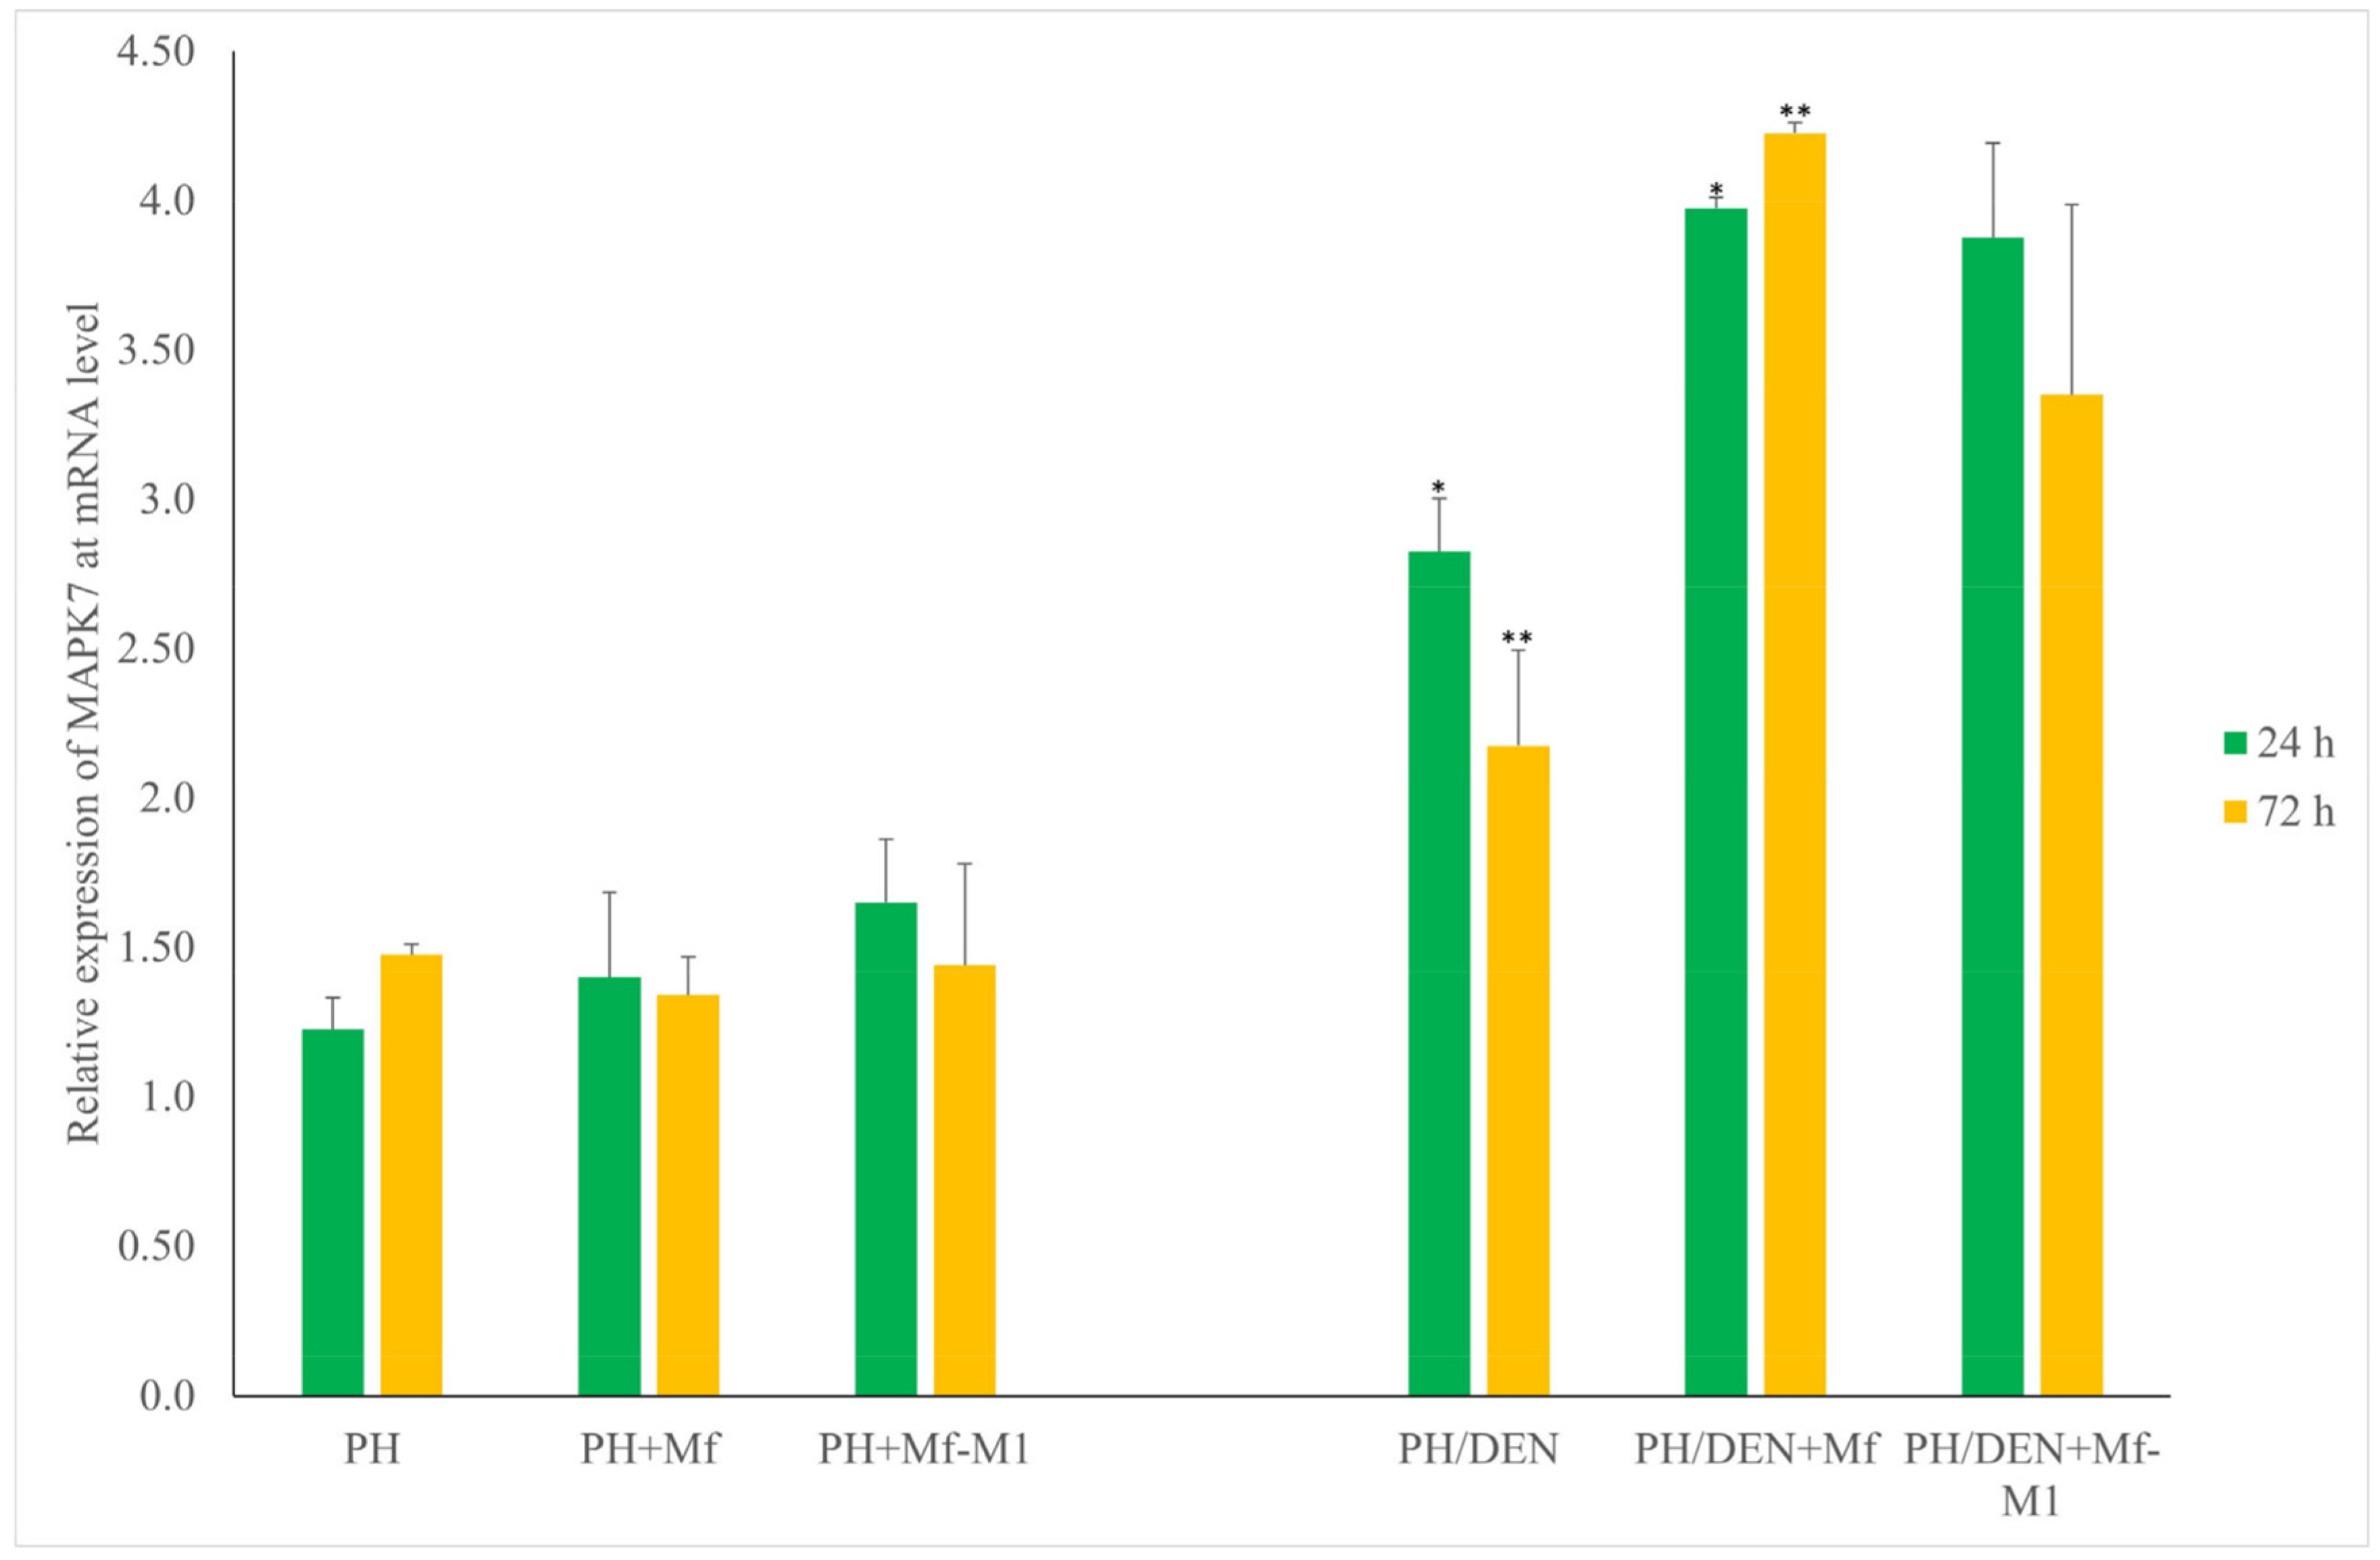
Compared with those of PH and PH/DEN hepatocytes, the presence of M1 macrophages did not significantly alter Mapk4 levels after 24 or 72 h (Figure 4). After 24 h, statistically significant differences in Mapk4 expression were detected between PH and PH+Mf (p = 0.028), as well as between PH+Mf and PH+Mf-M1 (p = 0.045). Comparable statistically significant differences were also noted after 72 h. In the PH/DEN model, significant differences were detected at both 24 and 72 h between PH/DEN and PH/DEN+Mf (p = 0.002 and p = 0.01, respectively), as well as between PH/DEN+Mf and PH/DEN+Mf-M1 (p = 0.01 and p = 0.02, respectively).

2.7. Mapk7 Expression Under Nonneoplastic and Neoplastic Conditions

For Mapk7 expression analysis, significant differences were noted only between the PH/DEN and PH/DEN+Mf groups at 24 h and 72 h (p = 0.01 and p = 0.01, respectively) (Figure 5). No significant differences were found in the other comparisons.

2.8. Hepatocyte Proliferation Analysis

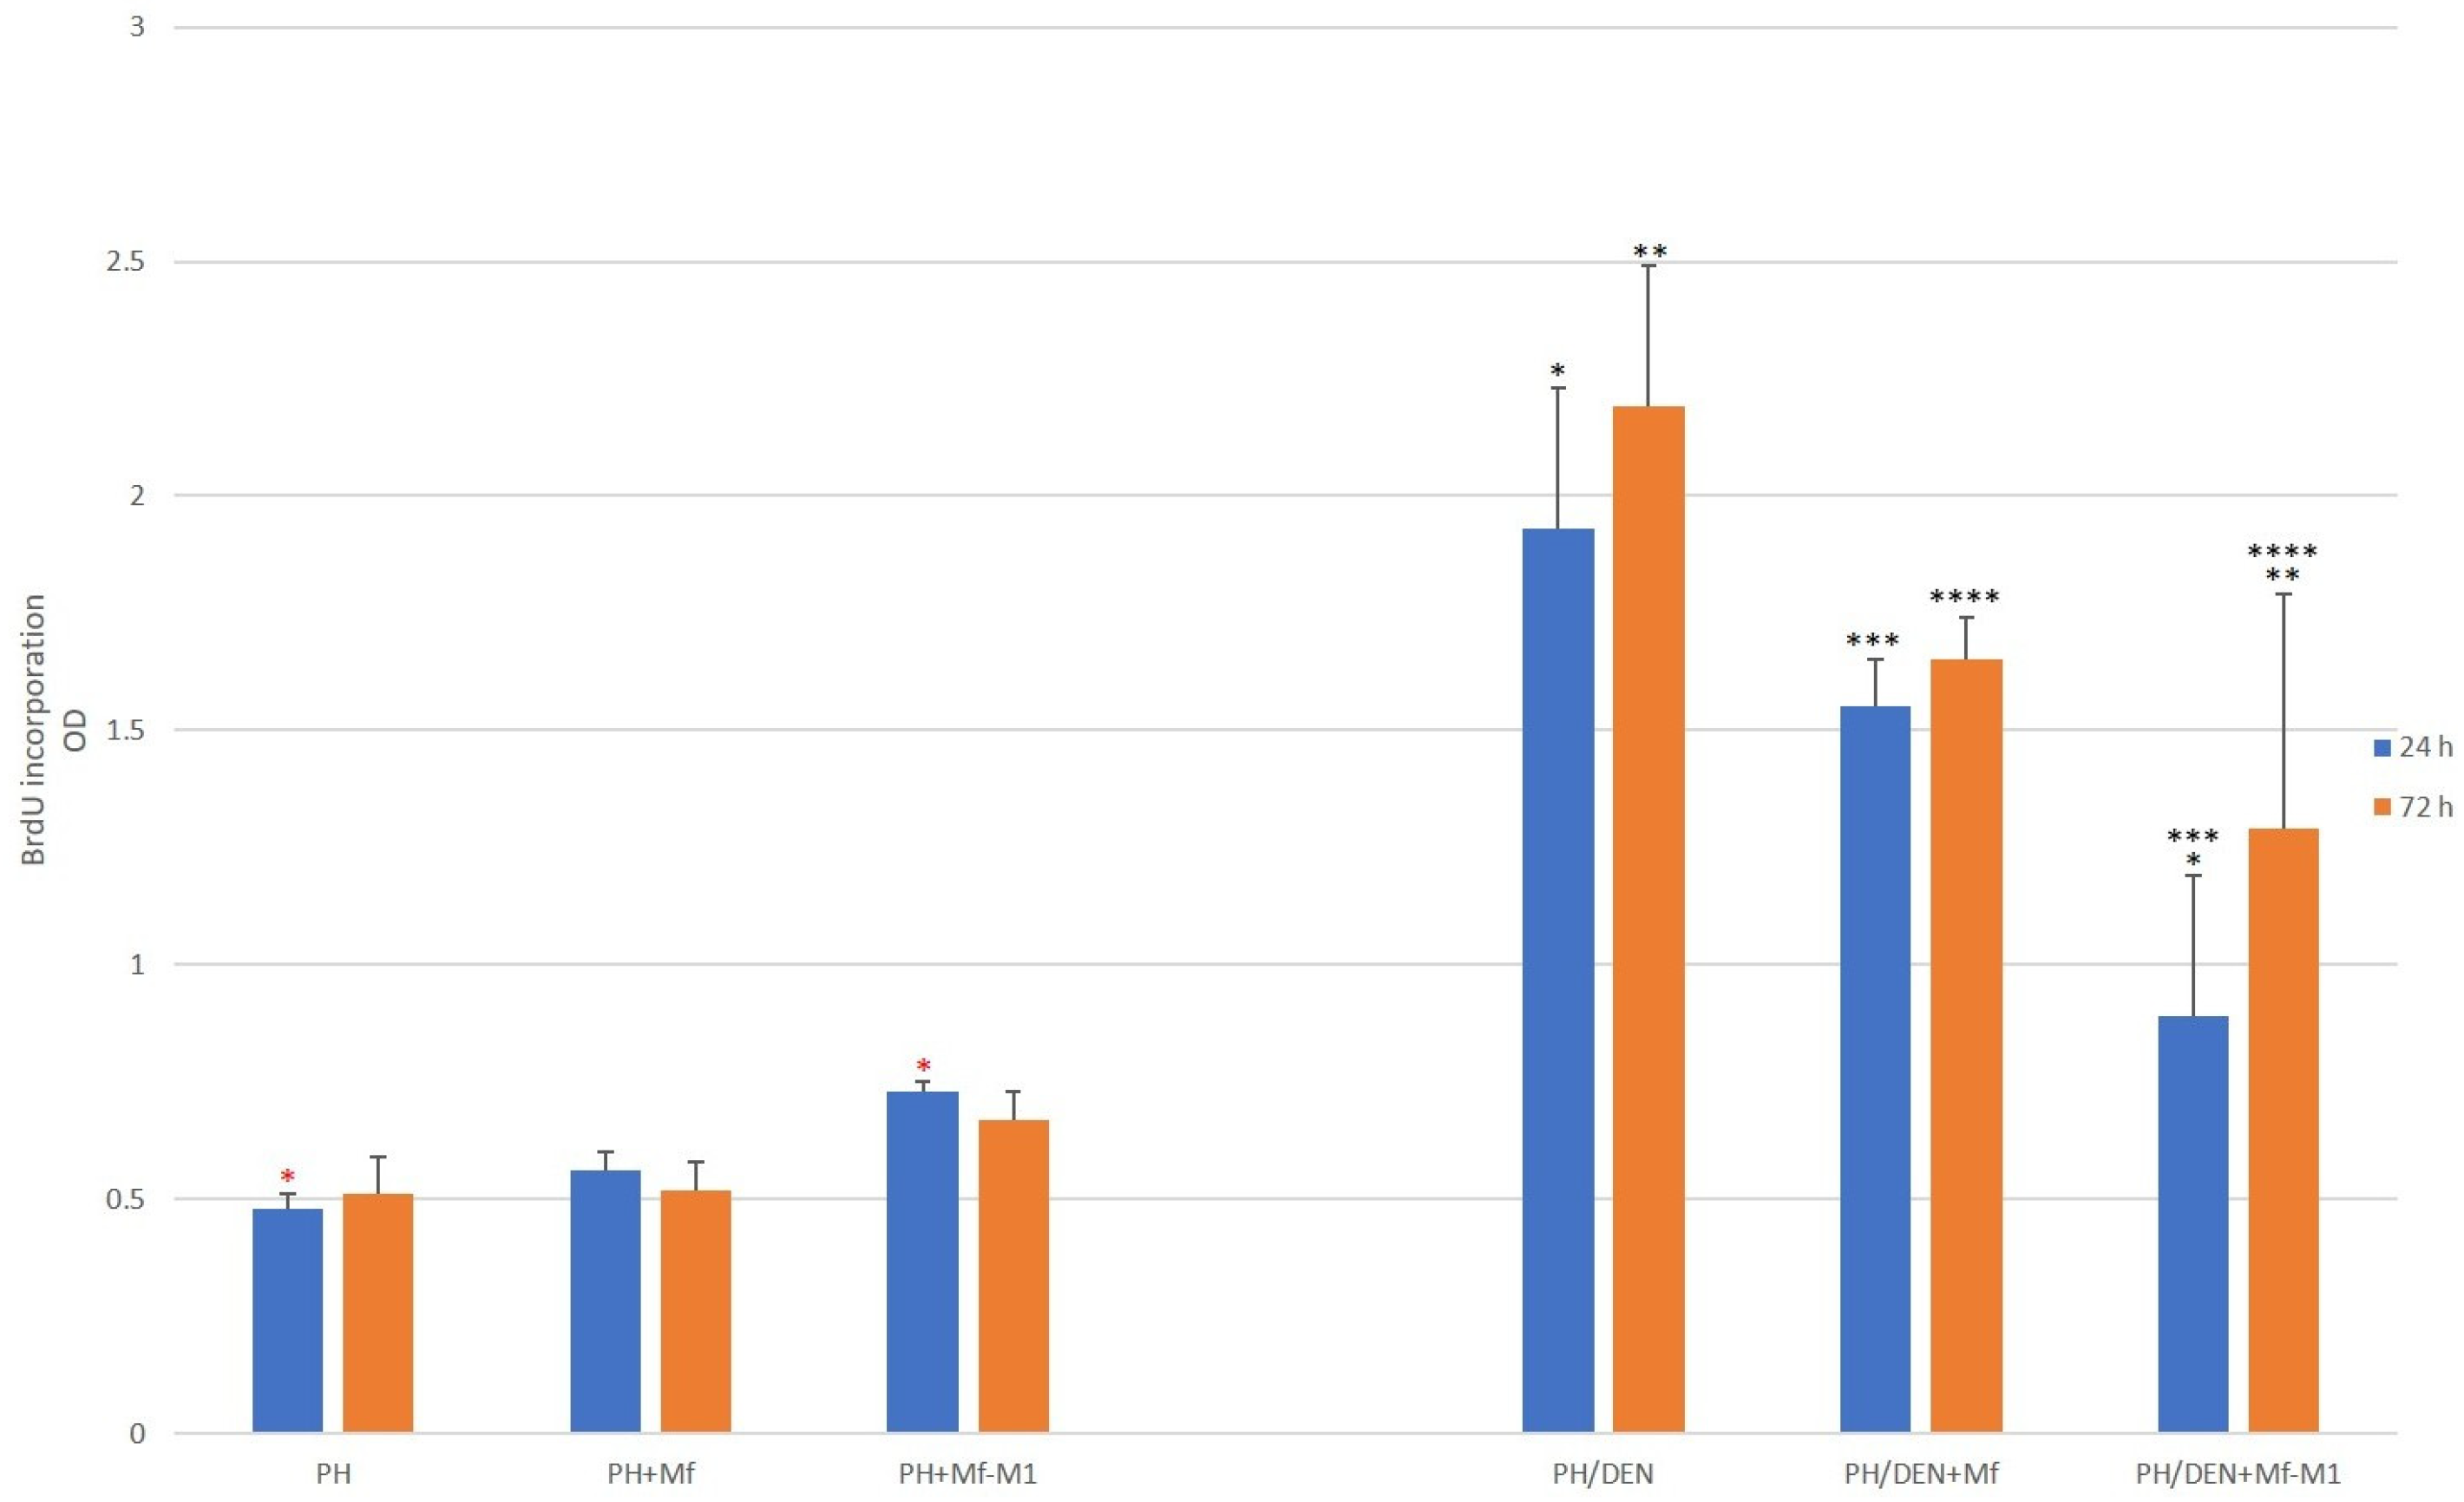
The proliferative activity of PH-obtained hepatocytes increased from 0.48 ± 0.03 (PH alone) to 0.73 ± 0.02 (PH-Mf+M1) after 24 h of culture, p < 0.001 (Figure 6). PH-hepatocyte proliferation, influenced by both Mf and Mf-M1, slightly increased with increasing culture time. However, these results were not statistically significant. In contrast, PH/DEN-hepatocytes showed proliferative activity throughout the entire incubation period, reaching the highest values under conditions without the influence of macrophages after 24 h and 72 h, with values of 1.93 ± 0.03 and 2.19 ± 0.3, respectively. Compared with that of nonstimulated Mf, the exposure of PH/DEN-hepatocytes to activated or nonstimulated Mf resulted in decreased proliferation. When PH/DEN cells were cocultured with proinflammatory Mf-M1 cells, the proliferation of neoplastic liver cells was significantly inhibited (p ≤ 0.05), with values of 0.89 ± 0.3 after 24 h (p = 0.001) and 1.29 ± 0.5 after 72 h (p = 0.01).

2.9. Apoptosis Analysis

After 24 h, the degree of apoptosis in PH-derived hepatocytes was similar between the PH and PH+Mf groups, whereas compared with the PH controls, the PH+Mf-M1 group presented a significant increase in the number of apoptotic cells (Table 2). The presence of M1-polarized macrophages markedly increased the number of apoptotic cells at 24 h in both the PH and PH/DEN models. A similar trend was observed at 72 h; however, the difference between PH and PH+Mf-M1 was not statistically significant. Nonstimulated macrophages (Mf) did not significantly affect apoptosis in PH-hepatocyte cultures at either 24 or 72 h (Table 2). After 24 h, a significant difference (p < 0.001) was observed between the PH+Mf and PH+Mf-M1 groups. However, after 72 h, this difference was not statistically significant (p = 0.067). Significant differences were observed between the PH/DEN+Mf and PH/DEN+Mf-M1 groups at both 24 and 72 h (p < 0.001).

2.10. Correlation Analysis

When PH/DEN-hepatocytes were influenced by nonstimulated Mf, a strong positive correlation between the proliferative activity of PH/DEN-hepatocytes and CE2 expression was observed (r = 0.92, p < 0.001 after 72 h). The exposure of neoplastic hepatocytes to proinflammatory Mf-M1 macrophages was associated with a weakening of this correlation (r = 0.61, p = 0.06 after 72 h). After 24 h, a significant strong negative correlation was observed between apoptosis and CE2 expression (Table 3). Proliferative activity was significantly correlated with apoptosis (p = 0.02) and CE2 expression (p < 0.001). Other correlations, including those between apoptosis and Mapk4 or Mapk7, were not statistically significant (p > 0.05), although Mapk7 showed a positive trend. After 72 h, significant correlations were observed between proliferative activity and apoptosis (p < 0.001), CE2 expression (p < 0.001), and Mapk4 expression (p = 0.04). In the case of the other analyzed parameters, no statistically significant correlations were observed.

3. Discussion

The influence of different factors on liver regeneration and tumorigenesis in rats was investigated via two distinct models: a nonneoplastic model involving partial hepatectomy (PH), and a neoplastic model combining partial hepatectomy with diethylnitrosamine treatment (PH/DEN). Hepatocytes and monocytes derived from rat blood were isolated and cultured, after which they were subjected to macrophage polarization with barley β-glucan (BBG). The cells were cultured under static conditions and in a quasi-vivo perfusion system allowing coculture of hepatocytes and macrophages. We also analyzed CE2 and Mapk4/7 gene expression at the mRNA level, cell proliferation, AFP levels, and biochemical indices of liver function. In addition, histopathological evaluation of liver tissue was performed. The goal was to understand the mechanisms of regenerative and tumorigenic responses in the liver and the influence of the cellular microenvironment on these processes.
The PH/DEN model is commonly used to study hepatocarcinogenesis: it combines chemical DNA damage with the process of liver regeneration after partial hepatectomy, which faithfully reflects the mechanisms of liver cancer development in humans [29]. In our study, the PH/DEN model influenced both body weight and liver function markers. Consistent with our findings, Kirsch et al. and Maciejewska et al. reported reduced weight gain along with elevated liver enzyme activities [30,31]. Chronic lesions and areas showing features of cellular atypia in the PH/DEN model from the analyzed liver specimens were observed. The presence of these features indicates active inflammatory processes and dysplastic changes in hepatic cells, which are consistent with observations in the literature concerning the early stages of HCC [29,32,33,34].
The uncontrolled cell division driven by dysregulated cyclins and kinases, alongside the high rates of recurrence and metastasis, renders HCC one of the most aggressive cancers globally. In our study, proinflammatory M1-type macrophages polarized with BBG were shown to affect hepatocyte proliferation in a DEN-induced liver cancer model. Unregulated cell proliferation plays a central role in the development and progression of hepatocellular carcinoma and serves as a key indicator for assessing the biological aggressiveness of HCC [15]. Our data demonstrated high proliferative activity of neoplastic hepatocytes isolated from a PH/DEN-induced HCC rat model, which is consistent with findings reported in the literature [35,36]. Macrophages are tissue-resident phagocytes and antigen-presenting cells that differentiate from circulating peripheral blood monocytes. Stimulated macrophages of different phenotypes are routinely classified into M1 macrophages and M2 macrophages [37]. Stimulated M1 macrophages are immune effector cells with an acute inflammatory phenotype. M1 activation is triggered by interferon gamma, lipopolysaccharide, TNF-α and ß-glucan and is mediated by several signal transduction pathways involving a signal transducer and activator of transcription (STAT), as well as nuclear factor kappa-light-chain enhancer of activated B cells (NFkB) [38,39]. These transcription factors stimulate the production of microbicidal agents, including ROS and nitric oxide, while simultaneously promoting downstream inflammatory immune responses by increasing antigen presentation capacity and driving the activation of T helper 1 (Th1) cells via cytokines such as IL-12. In addition to their proinflammatory activity, M1 macrophages constitute one of the major populations of tumor-infiltrating immune cells and have well-documented functions in the regulation of the antitumor immune response [40,41]. In line with these findings, our results indicate that the proliferative activity of PH/DEN-derived hepatocytes was effectively inhibited despite exposure to Mf-M1. Conversely, when PH/DEN-hepatocytes were influenced by nonstimulated macrophages (Mf), increased cell proliferation was observed. Our findings are consistent with those reported by numerous researchers, including Zhou et al., 2020 [42] who reported that Mf-M1 exerts antitumor effects by suppressing proliferation and promoting apoptosis in HCC cells [42]. The predominance of M2 macrophages over M1 macrophages within the TME is associated with poor prognosis in patients with HCC [43,44]. Conversely, increasing evidence suggests that M1 macrophages play dual roles in hepatocarcinogenesis, exhibiting not only antitumor but also protumor functions. M1 macrophages can play a prometastatic role since they induce epithelial–mesenchymal transition (EMT) in pancreatic cancer cells and enhance the motility of HCC cells [45,46]. Unfortunately, it is still unknown whether M1 macrophages promote or inhibit hepatocarcinogenesis. A deep understanding of the role of M1 macrophages in HCC is vital for the development of novel targeted immunotherapies.
Tumor cells under conditions of severe inflammation (e.g., those generated by M1 macrophages) can upregulate the expression of cyclins (including CE2) as an escape mechanism from cytotoxic stress through the production of ROS and reactive nitrogen species [47,48,49,50]. M1 macrophages may paradoxically increase cyclin expression in cancer cells as an adaptive response [51]. M1-induced inflammatory stress can lead to tumor reprogramming, including a transient increase in cyclin expression [47,49]. Our results demonstrate that PH/DEN hepatocytes exhibit increased mRNA expression of CE2, which coincides with enhanced proliferative activity. Therefore, our findings support these observations, highlighting the role of CE2 in cell cycle progression. Several lines of evidence have revealed that cyclins, including CE2, drive cell proliferation by initiating DNA replication and activating cell division kinases [52,53]. Many authors also point to a relationship between CE2 overexpression and increased cell proliferation during HCC development [26,54]. A similar relationship was also observed in our research.
In our study changes in the expression of cell cycle-related genes such as CE2, Mapk4 and Mapk7 kinases were observed. Proteins encoded by these genes are important for regulating cancer cell proliferation. Mapk4 and Mapk7 can affect cell proliferation through different pathways and mechanisms of action. There is no direct activation cascade between these kinases—Mapk4 does not activate Mapk7 and vice versa—although they can function in parallel in the cell, regulating different processes [18,55]. Mapk4 is a kinase that can activate the AKT/mTOR signaling cascade, thereby promoting cell cycle progression and proliferation. This cascade plays a key role in regulating the synthesis of cyclins, including CE2, which governs the transition from the G1 phase to the S phase [56]. Mapk4 indirectly modulates the inflammatory functions of macrophages. The literature suggests that Mapk4 may function to suppress excessive proinflammatory signaling [18]. Our results revealed that increased Mapk4 expression in the TME in the presence of M1 macrophages was indicative of a dynamic cellular response to inflammatory stress. Our findings suggest that M1 macrophages, despite their proinflammatory profile, may paradoxically facilitate cancer cell adaptation to stress and increase their survival. After PH, hepatocytes undergo regeneration and are receptive to pro-regenerative cytokines (e.g., IL-6, TNF-α, and IL-1β) secreted by macrophages [57]. These signals can activate the JAK/STAT and NF-κB pathways, which in turn increase the transcription of genes such as Mapk4 that support proliferation and stress adaptation [57]. In contrast, in the PH/DEN group, hepatocytes were exposed to carcinogen-induced genomic stress and chronic inflammation, which reprogrammed macrophages toward a tumor-promoting phenotype [58]. In cells within the tumor microenvironment, Mapk4 can be upregulated as a protective mechanism against the cytotoxic effects of M1 macrophages, for example, by activating prosurvival signaling pathways. Another kinase we studied was Mapk7, also known as Erk5. It is a classical kinase that is activated by various stress and growth factors. Mapk7 plays an important role in the processes of cell proliferation, differentiation and stress response. Its activation occurs as part of the classical signaling cascade. A distinctive feature of Mapk7 is the presence of a unique transcriptional domain, which allows it to also perform functions in the cell nucleus, affecting gene expression [55].
The presence of macrophages in the PH/DEN model may cause an increase in Mapk7 expression due to the role of this kinase in the cellular response to inflammatory factors and environmental stress. Macrophages, especially those with a proinflammatory phenotype (e.g., M1), secrete cytokines and inflammatory mediators that can activate signaling pathways in cancer cells and the TME, including Mapk7 [59]. Its activation in such an environment promotes the adaptation of cancer cells to stress, supports their survival and may promote tumor progression [60]. M1 macrophages, which are characterized by a proinflammatory phenotype, can stimulate the expression of this kinase in target cells. M1 macrophages are activated in response to stress and inflammatory signals, while M1 macrophages produce various proinflammatory cytokines—such as TNF-α, IL-1β, and IL-6—that trigger signaling pathways, resulting in increased expression and activity of these cytokines [59,61]. In our study, no statistically significant increase in Mapk7 expression was detected in the PH/DEN Mf-M1 model. Similarly, a study on a DEN-induced HCC model reported that Kupffer cells (KCs) and monocyte-derived macrophages (Mo-Mφs) presented distinct gene expression profiles, yet no significant alterations in Mapk7 expression were observed in response to tumor-associated inflammation [62]. Notably, these studies did not observe differences in the expression of Mf-M1 markers, such as CD68, compared with Mf-M2 markers, suggesting that macrophage activation in this model does not lead to a marked change in Mapk7 expression [62]. Fan and colleagues reported comparable findings in a rat model of monocrotaline-induced pulmonary arterial hypertension [63]. Therefore, the lack of a statistically significant increase in Mapk7 expression in our study may be consistent with the results of other studies suggesting that the activation of M1 macrophages in the PH/DEN model does not lead to a marked change in the expression of this kinase.
This study has several limitations. First, the expression of CE2 and Mapk4/7 was assessed solely at the mRNA level, without complementary protein-level analysis. Second, the neoplastic hepatocyte phenotype was not validated via flow cytometry. Third, evaluation of the hepatocyte cell cycle via flow cytometry was not performed, which would have enabled correlation analyses between kinase and cytokine expression and cell cycle phases. Fourth, ultrastructural analysis of the hepatocyte phenotype via electron microscopy was not conducted, limiting the assessment of intracellular changes, such as alterations in the nucleus, mitochondria, or cytosol. Fifth, the study relied solely on gene expression data, without complementary functional assays (such as cell cycle analysis, apoptosis markers, macrophage phenotypes, or phagocytic capacity), limiting mechanistic interpretation. Moreover, monocytes isolated from PH and PH/DEN rats may differ significantly, as DEN exposure can alter monocyte activation and differentiation. However, the specific impact of DEN on monocytes and their derived macrophage subsets (M1/M2) has not been addressed, limiting interpretation of the immunological findings. Finally, the relatively small sample size reduces the statistical power of the findings. Despite these limitations, this study represents the first comprehensive analysis of CE2 and Mapk4/7 expression in an HCC model incorporating Mf and Mf-M1 cells.
In summary, we investigated the inhibitory effect of Mf-M1 on the proliferation of neoplastic hepatocytes isolated from experimentally induced HCC in rats. However, we also concluded that the short-term exposure of PH/DEN-hepatocytes to Mf-M1 seems to be insufficient to effectively inhibit the proliferation of these neoplastic cells. Thus, the influence of M1 macrophages during HCC development should be further explored.

4. Materials and Methods

The study used animal experiments (including nonneoplastic and neoplastic groups) and then cell cultures (of hepatocytes and blood-derived monocytes) were conducted. The research was approved by the Ethics Committee for Animal Experimentation at the University of Life Sciences (Lublin, Poland; approval number 81/2015).

4.1. Reagents

BBG, collagenase, DEN, dexamethasone, Dulbecco’s modified Eagle’s medium (DMEM), fetal bovine serum, Ham’s F-12 medium, insulin, Krebs-Ringer buffer, nystatin, phosphate-buffered saline (PBS), penicillin/streptomycin, trypan blue, TRI reagent and nuclease-free water were all supplied by Sigma-Aldrich (Darmstadt, Germany). Other chemicals and materials: RevertAid First Strand cDNA Synthesis Kit, AmpliTaq Gold DNA polymerase, forward and reverse primers and FAM/MGB probes for real-time PCR, 96-well plates with optical covers (Thermo Fischer Scientific, Waltham, MA, USA), Lymphoprep (Nyegaard & Co, AS, Oslo, Norway) and 5-bromo-2′-deoxyuridine (BrdU) (Abcam, Eugene, OR, USA) were used.

4.2. Animal Model

Experimental design: A total of 20 female Wistar rats (weight, 200–220 g) were used in the present study (Figure 7). The rats were obtained from the Centre of Experimental Medicine, The Medical University of Bialystok (Bialystok, Poland). The animals were housed with a 12 h light/dark cycle and had free access to drinking water and standard rat pellet food [64]. After a 1-week acclimatization period, 10-week-old rats were randomly assigned to two groups (10 animals per group): (I) the nonneoplastic PH group, which underwent partial hepatectomy (PH) and received PBS (0.005%) in the drinking water (n = 10); and (II) the neoplastic PH/DEN group, in which a two-step hepatocarcinogenesis model was induced according to the Solt–Farber protocol (n = 10) [65]. Rapid emergence of carcinogen-induced hyperplastic lesions in a new model for the sequential analysis of liver carcinogenesis. Following a 7-day acclimatization period, two-thirds partial hepatectomy (PH) was performed on all the rats in each group via the Higgins and Anderson method, which involved excision of the left lateral (~38%) and right (~30%) lobes, as previously described [66]. Seven days after PH, DEN was added to the drinking water of the neoplastic group of rats which were supplied ad libitum for 10 weeks. An exploratory laparotomy was then performed, and the development of tumors on the liver surface was confirmed. The nonneoplastic group was administered PBS in the drinking water.

4.3. Hepatocyte Isolation and Treatment

After 10 weeks, the rats were anesthetized with a mixture of ketamine and xylazine (90 mg/kg and 10 mg/kg, respectively), subjected to midline laparotomy to cannulate the portal vein, and perfused with Krebs-Ringer buffer, as described previously [67,68]. After filtration and centrifugation, the cell viability was determined via trypan blue exclusion and ranged from 75 to 80%. The cells were dispersed in DMEM/Ham’s F-12 medium (1:1 v/v) containing 39 ng/mL dexamethasone, 0.5 U/mL insulin, 100 U/mL penicillin, 0.1 mg/mL streptomycin, 100 U/mL nystatin and 10% fetal bovine serum. To prepare for Quasi-Vivo system analysis, hepatocytes were cultured at a density of 1 × 10⁶ cells/mL on glass membranes in 24-well plates and incubated under standard conditions (37 °C, 5% CO2) for 48 h to allow complete adhesion.

4.4. Isolation of Rat Blood-Derived Monocytes

Blood was taken from each animal during the experimental procedure but before liver perfusion (Figure 7). The mononuclear cells were isolated via Lymphoprep density-gradient centrifugation [14]. After being counted by an R1 Automated Cell Counter (Olympus, Warsaw, Poland) (cell viability >80%), the cells were plated into wells of a 24-well plate at a density of 2.5 × 10⁵ cells/mL and cultured at 37 °C with 5% CO2 for 24 h in DMEM/Ham’s F-12 (1:1 v/v) medium supplemented with 10% fetal bovine serum. The adherent cells were cultured for an additional 48 h to allow monocytes to mature into functional macrophages. After differentiation, the cells were polarized to the Mf-M1 phenotype with BBG at a concentration of 10 μg/mL. In a previous study, we used different concentrations of BBG (5–20 µg/mL) for polarization of rat monocytes, and we chose 10 μg/mL, which generated the best response of Mf to BBG after 24 h of exposure [14]. Every subsequent day of culture, the morphology of the macrophages was subjected to microscopic analysis as a qualitative assay. All functional assays of nonstimulated (Mf) and polarized (Mf-M1) macrophages were conducted as described previously [14].

4.5. Microenvironment Culture of Hepatocytes and Blood-Derived Monocytes

A commercially available perfusion chamber bioreactor (Quasi-Vivo, QV500, Kirkstall, UK) was used to keep the cells under perfusion. This system allows multiple cell types to be cultured in interconnected chambers under flow while sharing the same culture medium. Adherent hepatocytes and macrophages, previously plated on special glass membranes, were inserted into QV500 simple modular culture chambers. The chambers were subsequently connected in series with a peristaltic pump (ISMATEC, VWR International, Poland LTD., Gdańsk, Poland). The medium was pumped through the chambers at a rate of 150 µL/min. The hepatocytes were removed for analysis after 24 h and 72 h of incubation.

4.6. Biochemical Analysis of Liver Function

Liver function in serum was analyzed via ABX Pentra 400 a biochemical analyser (HORIBA Ltd., Kyoto, Japan) (Figure 7). Serum levels of alanine aminotransferase (ALT), aspartate aminotransferase (AST), γ-glutamyl transferase (GGT) and alkaline phosphatase (AP) were quantified according to the manufacturer’s protocol.

4.7. Histopathological Examination

Liver tissue was examined as described previously and analyzed via light microscopy (Eclipse E-600; Nikon Corporation, Tokyo, Japan) at ×200 magnification. The hepatic injuries were assessed according to the World Health Organization Histological Classification of Tumors [69].

4.8. Isolation of Total RNA from PH and PH/DEN Cells Cultured In Vitro

Total RNA was isolated from the cells via the TRI Reagent procedure according to Chomczyński [70]. The RNA pellet was subsequently resuspended in 75% ethanol. The purity of the total RNA samples was determined as the 260/280 nm OD ratio. The quality of these nucleic acids was checked via 2% agarose gel electrophoresis. The RNA was stored at −80 °C. The 260/280 ratios ranged from 1.95 to 2.06. The final RNA concentration was analyzed via the spectrophotometric method (CE 2021 UV/VIS Spectrophotometer, Cecil Instruments Limited, Cambridge, UK). The RNA samples were stored at −80 °C until further analysis.

4.9. Reverse Transcription

The reverse transcription reaction (RT-PCR) mixture was prepared after RNA isolation. RT-PCR was performed using a T100 Thermal Cycler™ (Bio-Rad, Hercules, CA, USA). Reverse transcription was carried out via a RevertAid First Strand cDNA Synthesis Kit. The cDNA obtained was stored at −20 °C until real-time PCR analysis.

4.10. Analysis of CE2 and Mapk4/7 Expression at the mRNA Level Using Real-Time PCR

The cDNA samples were amplified using AmpliTaq Gold DNA polymerase and the Applied Biosystem 7500 Real Time PCR (Fast System, Waltham, MA, USA). The reaction was carried out in 96-well plates with optical covers. To assess changes in the mRNA levels of the target gene relative to the reference gene Gadph (glyceraldehyde-3-phosphate dehydrogenase) using the relative quantification method, 5 ng of cDNA was amplified with rat-specific forward and reverse primers (each at 500 nM) and a fluorescently labeled probe (FAM/MGB, 200 nM). The assay ID and sources of primers and probes are given in Table 4. Every sample was assayed in duplicate, with expression being calculated according to the 2−ΔΔCt method—normalized expression [71]. The expression values are presented as the logarithm of R to base 2, where R was calculated as follows: R = 2−ΔΔCt, ΔΔCt = ΔCt of the control −ΔCt of the analyzed gene, and every ΔCt = Ct of the analyzed gene—Ct of the endogenous control. The value of the normalized expression (R) in the range of 0.8–1.2 indicated a normal level of gene expression, R < 0.8 indicated low expression, and R > 1.2 indicated high expression [72,73].

4.11. Cell Proliferation Assay

The proliferation rates of PH and PH/DEN cells were assessed via an immunoenzymatic BrdU ELISA kit, following the manufacturer’s instructions. The immune complexes were detected at 450 nm using an ELx800™ ELISA reader (BioTek Instruments, Inc., Winooski, VT, USA).

4.12. Apoptosis Detection

Apoptosis was assessed using an Annexin V/FITC assay kit (Bio-Rad, California, USA) following the manufacturer’s instructions, as described previously [69]. Briefly, the cells were washed, centrifuged, stained with Annexin V-FITC and propidium iodide, and analyzed via a Coulter Epics XL flow cytometer (Beckman Coulter, Inc., Brea, CA, USA).

4.13. Alpha-Fetoprotein (AFP) ELISA

The protein level of AFP in the hepatocyte lysates was determined via an assay kit (Cloud-Clone Corp., Houston, TX, USA) according to the manufacturer’s instructions. The optical density (OD) was determined using a microplate reader (ELx800™ ELISA reader, BioTek Instruments, Inc., Winooski, VT, USA) at 450 nm. The concentration of AFP was analyzed on the basis of a standard curve. According to Wolf and Peschke, normal liver tissue, dysplastic foci and hyperplastic nodules do not express AFP [74].

4.14. Statistical Analysis

All experiments were repeated a minimum of three times with different batches of cell samples. The data are presented as the means ± standard deviations. The data were analyzed via one-way analysis of variance (ANOVA) or Student’s t-test as appropriate. When ANOVA indicated significant differences within groups, comparisons were made via Tukey’s post hoc test. Correlations between variables were assessed using Pearson’s correlation coefficient. We assumed a 5% error of inference and a related level of significance of p < 0.05, indicating the existence of statistically significant differences. Statistical analyses were performed using Statistica version. 13.3 (StatSoft) software.

5. Conclusions

The following conclusions can be drawn from our research: (I) rats subjected to PH/DEN treatment exhibited more pronounced liver damage than those subjected to partial hepatectomy alone; (II) PH/DEN samples presented characteristics of liver injury and neoplastic alterations; (III) significantly elevated AFP levels in PH/DEN cells compared with those in PH cells confirmed neoplastic transformation; (IV) hepatocytes isolated from the PH/DEN group exhibited altered morphology characterized by loss of typical cellular structure, heterogeneity in cell size, inability to form a regular monolayer, and loss of contact inhibition; (V) PH/DEN hepatocytes presented markedly greater overexpression of CE2 than PH cells, reflecting their enhanced proliferative capacity linked to neoplastic transformation; (VI) Mapk4/7 expression was not significantly affected by M1 macrophages; and (VII) PH/DEN hepatocytes exhibited significantly greater proliferation than PH cells, with the greatest proliferation observed in macrophage-free conditions. The presence of proinflammatory M1 macrophages markedly reduced proliferation and appeared to modulate the role of CE2, which strongly correlated with cell growth in the absence of macrophages.
In summary, the PH/DEN model in rats showed neoplastic transformation of hepatocytes, as evidenced by liver damage, dysplasia, elevated AFP, and CE2 overexpression and loss of growth control, with M1 macrophages able to partially limit the proliferation of these cells, suggesting their potential anticancer effects.

Author Contributions

Conceptualization, M.W., L.P., A.V. and V.L.; methodology, M.W., A.Ś., S.Z., I.R.-R. and A.V.; software, M.W.; formal analysis, M.W.; data curation, M.W. and A.C.; writing—original draft preparation, M.W. and S.Z.; writing—review and editing, M.W., S.Z. and J.C.-M.; visualization, M.W. and S.Z.; supervision, M.W. All authors have read and agreed to the published version of the manuscript.

Funding

The present study was supported by (I) a grant from the National Science Centre in Poland (grant no. DEC-2014/15/B/ Nz5/01587) (M.W.) and (II) grant number SUPB.RN.21.234 (J.C.M.).

Institutional Review Board Statement

The animal study protocol was approved by the Ethics Committee for Animal Experimentation at the University of Life Sciences (Lublin, Poland; approval number 81/2015).

Data Availability Statement

The data presented in this study are available upon request from the corresponding author owing to ethical restrictions related to the use of animal experimental data.

Acknowledgments

The authors thank Urszula Kosior-Korzecka from the Sub-Department of Pathophysiology, Department of Preclinical Veterinary Sciences, Faculty of Veterinary Medicine, University of Life Sciences in Lublin, Akademicka 12, 20-033 Lublin, Poland, for the analysis of the CE2, Mapk4/7 expression.

Conflicts of Interest

The authors declare no conflict of interest.

Abbreviations

The following abbreviations are used in this manuscript:
AFPalpha-fetoprotein
ALTalanine aminotransferase
APalkaline phosphatase
BBGbarley β-glucan
BrdU5-Bromo-2′-deoxyuridine
CDK2cyclin-dependent kinase 2
CE2cyclin E2
DENdiethylnitrosamine
DMEMDulbecco’s modified Eagle’s medium
HCChepatocellular carcinoma
MAPKmitogen-activated protein kinase
Mfmacrophages (control macrophages)
Mf-M1M1 macrophages (cells with M1 phenotype)
Mf-M2M2 macrophages (cells with M2 phenotype)
NFkBnuclear factor kappa-light-chain enhancer of activated B cells
PBSphosphate-buffered saline
PHpartial hepatectomy
ROSreactive oxygen species
STATsignal transducer and activator of transcription
TMEtumor microenvironment
TNFtumor necrosis alpha

References

  1. Singal, A.G.; Lampertico, P.; Nahon, P. Epidemiology and Surveillance for Hepatocellular Carcinoma: New Trends. J. Hepatol. 2020, 72, 250–261. [Google Scholar] [CrossRef]
  2. Murray, C.J.L.; Vos, T.; Lozano, R.; Naghavi, M.; Flaxman, A.D.; Michaud, C.; Ezzati, M.; Shibuya, K.; Salomon, J.A.; Abdalla, S.; et al. Disability-Adjusted Life Years (DALYs) for 291 Diseases and Injuries in 21 Regions, 1990–2010: A Systematic Analysis for the Global Burden of Disease Study 2010. Lancet 2012, 380, 2197–2223. [Google Scholar] [CrossRef] [PubMed]
  3. Llovet, J.M.; Zucman-Rossi, J.; Pikarsky, E.; Sangro, B.; Schwartz, M.; Sherman, M.; Gores, G. Hepatocellular Carcinoma. Nat. Rev. Dis. Primers 2016, 2, 16018. [Google Scholar] [CrossRef] [PubMed]
  4. Zheng, J.; Kuk, D.; Gönen, M.; Balachandran, V.P.; Kingham, T.P.; Allen, P.J.; D’Angelica, M.I.; Jarnagin, W.R.; DeMatteo, R.P. Actual 10-Year Survivors After Resection of Hepatocellular Carcinoma. Ann. Surg. Oncol. 2017, 24, 1358–1366. [Google Scholar] [CrossRef] [PubMed]
  5. de Visser, K.E.; Joyce, J.A. The Evolving Tumor Microenvironment: From Cancer Initiation to Metastatic Outgrowth. Cancer Cell 2023, 41, 374–403. [Google Scholar] [CrossRef]
  6. Zhou, Y.; Ren, H.; Dai, B.; Li, J.; Shang, L.; Huang, J.; Shi, X. Hepatocellular Carcinoma-Derived Exosomal MiRNA-21 Contributes to Tumor Progression by Converting Hepatocyte Stellate Cells to Cancer-Associated Fibroblasts. J. Exp. Clin. Cancer Res. 2018, 37, 324. [Google Scholar] [CrossRef]
  7. González-Amaro, R.; García-Monzón, C.; García-Buey, L.; Moreno-Otero, R.; Alonso, J.L.; Yagüe, E.; Pivel, J.P.; López-Cabrera, M.; Fernández-Ruiz, E.; Sánchez-Madrid, F. Induction of Tumor Necrosis Factor Alpha Production by Human Hepatocytes in Chronic Viral Hepatitis. J. Exp. Med. 1994, 179, 841–848. [Google Scholar] [CrossRef]
  8. Reichner, J.S. Interleukin-6 Production by Rat Hepatocellular Carcinoma Cells Is Associated with Metastatic Potential but Not with Tumorigenicity. JAMA Surg. 1996, 131, 360. [Google Scholar] [CrossRef]
  9. DeWaal, D.; Nogueira, V.; Terry, A.R.; Patra, K.C.; Jeon, S.-M.; Guzman, G.; Au, J.; Long, C.P.; Antoniewicz, M.R.; Hay, N. Hexokinase-2 Depletion Inhibits Glycolysis and Induces Oxidative Phosphorylation in Hepatocellular Carcinoma and Sensitizes to Metformin. Nat. Commun. 2018, 9, 446. [Google Scholar] [CrossRef]
  10. Biswas, S.K.; Sica, A.; Lewis, C.E. Plasticity of Macrophage Function during Tumor Progression: Regulation by Distinct Molecular Mechanisms. J. Immunol. 2008, 180, 2011–2017. [Google Scholar] [CrossRef]
  11. Wan, S.; Zhao, E.; Kryczek, I.; Vatan, L.; Sadovskaya, A.; Ludema, G.; Simeone, D.M.; Zou, W.; Welling, T.H. Tumor-Associated Macrophages Produce Interleukin 6 and Signal via STAT3 to Promote Expansion of Human Hepatocellular Carcinoma Stem Cells. Gastroenterology 2014, 147, 1393–1404. [Google Scholar] [CrossRef]
  12. Rey-Giraud, F.; Hafner, M.; Ries, C.H. In Vitro Generation of Monocyte-Derived Macrophages under Serum-Free Conditions Improves Their Tumor Promoting Functions. PLoS ONE 2012, 7, e42656. [Google Scholar] [CrossRef]
  13. Zong, Z.; Zou, J.; Mao, R.; Ma, C.; Li, N.; Wang, J.; Wang, X.; Zhou, H.; Zhang, L.; Shi, Y. M1 Macrophages Induce PD-L1 Expression in Hepatocellular Carcinoma Cells Through IL-1β Signaling. Front. Immunol. 2019, 10, 01643. [Google Scholar] [CrossRef]
  14. Wójcik, M.; Wessely-Szponder, J.; Cichoż-Lach, H.; Celiński, K.; Bobowiec, R. In Vitro Proinflammatory Polarization of Macrophages Isolated from Hepatocarcinogenic Stage in Humans and Rats. In Vivo 2016, 30, 853–862. [Google Scholar] [CrossRef][Green Version]
  15. Huang, Y.; Ge, W.; Zhou, J.; Gao, B.; Qian, X.; Wang, W. The Role of Tumor Associated Macrophages in Hepatocellular Carcinoma. J. Cancer 2021, 12, 1284–1294. [Google Scholar] [CrossRef]
  16. Borbath, I.; Leclercq, I.A.; Abarca-Quinones, J.; Desaeger, C.; Lebrun, V.; Moulin, P.; Sempoux, C.; Horsmans, Y. Inhibition of Early Preneoplastic Events in the Rat Liver by the Somatostatin Analog Lanreotide. Cancer Sci. 2007, 98, 1831–1839. [Google Scholar] [CrossRef]
  17. English, J.M.; Pearson, G.; Hockenberry, T.; Shivakumar, L.; White, M.A.; Cobb, M.H. Contribution of the ERK5/MEK5 Pathway to Ras/Raf Signaling and Growth Control. J. Biol. Chem. 1999, 274, 31588–31592. [Google Scholar] [CrossRef] [PubMed][Green Version]
  18. Wang, W.; Shen, T.; Dong, B.; Creighton, C.J.; Meng, Y.; Zhou, W.; Shi, Q.; Zhou, H.; Zhang, Y.; Moore, D.D.; et al. MAPK4 Overexpression Promotes Tumor Progression via Noncanonical Activation of AKT/MTOR Signaling. J. Biol. Chem. 2019, 129, 1015–1029. [Google Scholar] [CrossRef] [PubMed]
  19. Gudas, J.M.; Payton, M.; Thukral, S.; Chen, E.; Bass, M.; Robinson, M.O.; Coats, S. Cyclin E2, a Novel G 1 Cyclin That Binds Cdk2 and Is Aberrantly Expressed in Human Cancers. Mol. Cell Biol. 1999, 19, 612–622. [Google Scholar] [CrossRef] [PubMed]
  20. Hwang, H.C.; Clurman, B.E. Cyclin E in Normal and Neoplastic Cell Cycles. Oncogene 2005, 24, 2776–2786. [Google Scholar] [CrossRef]
  21. Chiariello, M.; Gomez, E.; Gutkind, J.S. Regulation of Cyclin-Dependent Kinase (Cdk) 2 Thr-160 Phosphorylation and Activity by Mitogen-Activated Protein Kinase in Late G1 Phase. Biochem. J. 2000, 349, 869–876. [Google Scholar] [CrossRef]
  22. Moon, H.; Ro, S.W. MAPK/ERK Signaling Pathway in Hepatocellular Carcinoma. Cancers 2021, 13, 3026. [Google Scholar] [CrossRef]
  23. Jin, J.; Bai, L.; Wang, D.; Ding, W.; Cao, Z.; Yan, P.; Li, Y.; Xi, L.; Wang, Y.; Zheng, X.; et al. SIRT3-dependent Delactylation of Cyclin E2 Prevents Hepatocellular Carcinoma Growth. EMBO Rep. 2023, 24. [Google Scholar] [CrossRef]
  24. Farra, R.; Dapas, B.; Pozzato, G.; Scaggiante, B.; Agostini, F.; Zennaro, C.; Grassi, M.; Rosso, N.; Giansante, C.; Fiotti, N.; et al. Effects of E2F1–Cyclin E1–E2 Circuit down Regulation in Hepatocellular Carcinoma Cells. Dig. Liver Dis. 2011, 43, 1006–1014. [Google Scholar] [CrossRef]
  25. Sonntag, R.; Giebeler, N.; Nevzorova, Y.A.; Bangen, J.-M.; Fahrenkamp, D.; Lambertz, D.; Haas, U.; Hu, W.; Gassler, N.; Cubero, F.J.; et al. Cyclin E1 and Cyclin-Dependent Kinase 2 Are Critical for Initiation, but Not for Progression of Hepatocellular Carcinoma. Proc. Natl. Acad. Sci. USA 2018, 115, 9282–9287. [Google Scholar] [CrossRef] [PubMed]
  26. Geng, Y.; Michowski, W.; Chick, J.M.; Wang, Y.E.; Jecrois, M.E.; Sweeney, K.E.; Liu, L.; Han, R.C.; Ke, N.; Zagozdzon, A.; et al. Kinase-Independent Function of E-Type Cyclins in Liver Cancer. Proc. Natl. Acad. Sci. USA 2018, 115, 1015–1020. [Google Scholar] [CrossRef] [PubMed]
  27. Sotty, J.; Bablon, P.; Weiss, P.-H.; Soussan, P. Diethylnitrosamine Induction of Hepatocarcinogenesis in Mice. Methods Mol. Biol. 2024, 2769, 15–25. [Google Scholar] [CrossRef]
  28. Sánchez-Meza, J.; Campos-Valdez, M.; Domínguez-Rosales, J.A.; Godínez-Rubí, J.M.; Rodríguez-Reyes, S.C.; Martínez-López, E.; Zúñiga-González, G.M.; Sánchez-Orozco, L.V. Chronic Administration of Diethylnitrosamine and 2-Acetylaminofluorene Induces Hepatocellular Carcinoma in Wistar Rats. Int. J. Mol. Sci. 2023, 24, 8387. [Google Scholar] [CrossRef]
  29. Zhang, Q.; Liu, Y.; Ren, L.; Li, J.; Lin, W.; Lou, L.; Wang, M.; Li, C.; Jiang, Y. Proteomic Analysis of DEN and CCl4-Induced Hepatocellular Carcinoma Mouse Model. Sci. Rep. 2024, 14, 8013. [Google Scholar] [CrossRef] [PubMed]
  30. Kirsch, R.; Sijtsema, H.P.; Tlali, M.; Marais, A.D.; Hall, P.d.l.M. Effects of Iron Overload in a Rat Nutritional Model of Non-alcoholic Fatty Liver Disease. Liver Int. 2006, 26, 1258–1267. [Google Scholar] [CrossRef]
  31. Maciejewska, D.; Łukomska, A.; Dec, K.; Skonieczna-Żydecka, K.; Gutowska, I.; Skórka-Majewicz, M.; Styburski, D.; Misiakiewicz-Has, K.; Pilutin, A.; Palma, J.; et al. Diet-Induced Rat Model of Gradual Development of Non-Alcoholic Fatty Liver Disease (NAFLD) with Lipopolysaccharides (LPS) Secretion. Diagnostics 2019, 9, 205. [Google Scholar] [CrossRef] [PubMed]
  32. Aassouani, F.; Lkharrat, F.-Z.; Charifi, Y.; Attar, A.; Lahlali, M.; El Bouardi, N.; Abid, H.; Haloua, M.; Alami, B.; Boubbou, M.; et al. Early Hepatocellular Carcinoma Developed within Dysplastic Nodule as Nodule-within-Nodule Appearance: Case Report with Literature Review. Radiol. Case Rep. 2022, 17, 4087–4090. [Google Scholar] [CrossRef] [PubMed]
  33. Liao, Z.; Tang, C.; Luo, R.; Gu, X.; Zhou, J.; Gao, J. Current Concepts of Precancerous Lesions of Hepatocellular Carcinoma: Recent Progress in Diagnosis. Diagnostics 2023, 13, 1211. [Google Scholar] [CrossRef]
  34. Moreira, A.J.; Rodrigues, G.; Bona, S.; Cerski, C.T.; Marroni, C.A.; Mauriz, J.L.; González-Gallego, J.; Marroni, N.P. Oxidative Stress and Cell Damage in a Model of Precancerous Lesions and Advanced Hepatocellular Carcinoma in Rats. Toxicol. Rep. 2015, 2, 333–340. [Google Scholar] [CrossRef]
  35. Kurma, K.; Manches, O.; Chuffart, F.; Sturm, N.; Gharzeddine, K.; Zhang, J.; Mercey-Ressejac, M.; Rousseaux, S.; Millet, A.; Lerat, H.; et al. DEN-Induced Rat Model Reproduces Key Features of Human Hepatocellular Carcinoma. Cancers 2021, 13, 4981. [Google Scholar] [CrossRef]
  36. Liu, Y.-F.; Zha, B.-S.; Zhang, H.-L.; Zhu, X.-J.; Li, Y.-H.; Zhu, J.; Guan, X.-H.; Feng, Z.-Q.; Zhang, J.-P. Characteristic Gene Expression Profiles in the Progression from Liver Cirrhosis to Carcinoma Induced by Diethylnitrosamine in a Rat Model. J. Exp. Clin. Cancer Res. 2009, 28, 107. [Google Scholar] [CrossRef]
  37. Raggi, F.; Pelassa, S.; Pierobon, D.; Penco, F.; Gattorno, M.; Novelli, F.; Eva, A.; Varesio, L.; Giovarelli, M.; Bosco, M.C. Regulation of Human Macrophage M1–M2 Polarization Balance by Hypoxia and the Triggering Receptor Expressed on Myeloid Cells-1. Front. Immunol. 2017, 8, 01097. [Google Scholar] [CrossRef]
  38. Li, X.; Luo, H.; Ye, Y.; Chen, X.; Zou, Y.; Duan, J.; Xiang, D. Β-glucan, a Dectin-1 Ligand, Promotes Macrophage M1 Polarization via NF-κB/Autophagy Pathway. Int. J. Oncol. 2018, 54, 271–282. [Google Scholar] [CrossRef]
  39. Liu, M.; Luo, F.; Ding, C.; Albeituni, S.; Hu, X.; Ma, Y.; Cai, Y.; McNally, L.; Sanders, M.A.; Jain, D.; et al. Dectin-1 Activation by a Natural Product β-Glucan Converts Immunosuppressive Macrophages into an M1-like Phenotype. J. Immunol. 2015, 195, 5055–5065. [Google Scholar] [CrossRef]
  40. Guerriero, J.L. Macrophages: The Road Less Traveled, Changing Anticancer Therapy. Trends Mol. Med. 2018, 24, 472–489. [Google Scholar] [CrossRef]
  41. Lewis, C.E.; Pollard, J.W. Distinct Role of Macrophages in Different Tumor Microenvironments. Cancer Res. 2006, 66, 605–612. [Google Scholar] [CrossRef]
  42. Zhou, B.; Li, C.; Yang, Y.; Wang, Z. RIG-I Promotes Cell Death in Hepatocellular Carcinoma by Inducing M1 Polarization of Perineal Macrophages Through the RIG-I/MAVS/NF-ΚB Pathway. Onco. Targets. Ther. 2020, 13, 8783–8794. [Google Scholar] [CrossRef]
  43. Shu, Q.; Ge, Y.; Ma, H.; Gao, X.; Pan, J.; Liu, D.; Xu, G.; Ma, J.; Jia, W. Prognostic Value of Polarized Macrophages in Patients with Hepatocellular Carcinoma after Curative Resection. J. Cell Mol. Med. 2016, 20, 1024–1035. [Google Scholar] [CrossRef] [PubMed]
  44. Liu, D.; Li, Y.; Wang, G.; Dahl, E.; Luedde, T.; Neumann, U.P.; Bednarsch, J. The Role of Macrophage Polarization-Associated Gene Expression in the Oncological Prognosis of Hepatocellular Carcinoma. Gastroenterol. Insights 2024, 15, 764–785. [Google Scholar] [CrossRef]
  45. Jiang, Y.; Han, Q.; Zhao, H.; Zhang, J. Promotion of Epithelial-Mesenchymal Transformation by Hepatocellular Carcinoma-Educated Macrophages through Wnt2b/β-Catenin/c-Myc Signaling and Reprogramming Glycolysis. J. Exp. Clin. Cancer Res. 2021, 40, 13. [Google Scholar] [CrossRef] [PubMed]
  46. Wang, H.; Wang, X.; Li, X.; Fan, Y.; Li, G.; Guo, C.; Zhu, F.; Zhang, L.; Shi, Y. CD68+HLA-DR+ M1-like Macrophages Promote Motility of HCC Cells via NF-ΚB/FAK Pathway. Cancer Lett. 2014, 345, 91–99. [Google Scholar] [CrossRef]
  47. Mantovani, A.; Allavena, P. The Interaction of Anticancer Therapies with Tumor-Associated Macrophages. J. Exp. Med. 2015, 212, 435–445. [Google Scholar] [CrossRef]
  48. Mantovani, A.; Allavena, P.; Sica, A.; Balkwill, F. Cancer-Related Inflammation. Nature 2008, 454, 436–444. [Google Scholar] [CrossRef]
  49. Biswas, S.K.; Mantovani, A. Macrophage Plasticity and Interaction with Lymphocyte Subsets: Cancer as a Paradigm. Nat. Immunol. 2010, 11, 889–896. [Google Scholar] [CrossRef]
  50. Nathan, C.; Ding, A. Nonresolving Inflammation. Cell 2010, 140, 871–882. [Google Scholar] [CrossRef]
  51. Wang, Y.; Liu, Y.; Xiang, L.; Han, L.; Yao, X.; Hu, Y.; Wu, F. Cyclin D1b Induces Changes in the Macrophage Phenotype Resulting in Promotion of Tumor Metastasis. Exp. Biol. Med. 2021, 246, 2559–2569. [Google Scholar] [CrossRef]
  52. Jenkinson, F.; Tan, K.W.; Schöpf, B.; Santos, M.M.; Zegerman, P. Dephosphorylation of the Pre-Initiation Complex Is Critical for Origin Firing. Mol. Cell 2023, 83, 12–25.e10. [Google Scholar] [CrossRef] [PubMed]
  53. Fagundes, R.; Teixeira, L.K. Cyclin E/CDK2: DNA Replication, Replication Stress and Genomic Instability. Front. Cell Dev. Biol. 2021, 9, 774845. [Google Scholar] [CrossRef] [PubMed]
  54. Varallo, G.; Gelaleti, G.; Maschio-Signorini, L.; Moschetta, M.; Lopes, J.; De Nardi, A.; Tinucci-Costa, M.; Rocha, R.; de Campos Zuccari, D. Prognostic Phenotypic Classification for Canine Mammary Tumors. Oncol. Lett. 2019. [Google Scholar] [CrossRef] [PubMed]
  55. Pearson, G.; Robinson, F.; Beers Gibson, T.; Xu, B.; Karandikar, M.; Berman, K.; Cobb, M.H. Mitogen-Activated Protein (MAP) Kinase Pathways: Regulation and Physiological Functions. Endocr. Rev. 2001, 22, 153–183. [Google Scholar] [CrossRef]
  56. Mao, L.; Zhou, Y.; Chen, L.; Hu, L.; Liu, S.; Zheng, W.; Zhao, J.; Guo, M.; Chen, C.; He, Z.; et al. Identification of Atypical Mitogen-Activated Protein Kinase MAPK4 as a Novel Regulator in Acute Lung Injury. Cell Biosci. 2020, 10, 121. [Google Scholar] [CrossRef]
  57. Karin, M.; Greten, F.R. NF-ΚB: Linking Inflammation and Immunity to Cancer Development and Progression. Nat. Rev. Immunol. 2005, 5, 749–759. [Google Scholar] [CrossRef]
  58. Pollard, J.W. Tumour-Educated Macrophages Promote Tumour Progression and Metastasis. Nat. Rev. Cancer 2004, 4, 71–78. [Google Scholar] [CrossRef]
  59. Kerneur, C.; Cano, C.E.; Olive, D. Major Pathways Involved in Macrophage Polarization in Cancer. Front. Immunol. 2022, 13, 1026954. [Google Scholar] [CrossRef]
  60. Basak, U.; Sarkar, T.; Mukherjee, S.; Chakraborty, S.; Dutta, A.; Dutta, S.; Nayak, D.; Kaushik, S.; Das, T.; Sa, G. Tumor-Associated Macrophages: An Effective Player of the Tumor Microenvironment. Front. Immunol. 2023, 14, 1295257. [Google Scholar] [CrossRef]
  61. Wisitpongpun, P.; Potup, P.; Usuwanthim, K. Oleamide-Mediated Polarization of M1 Macrophages and IL-1β Production by Regulating NLRP3-Inflammasome Activation in Primary Human Monocyte-Derived Macrophages. Front. Immunol. 2022, 13, 856296. [Google Scholar] [CrossRef] [PubMed]
  62. Degroote, H.; Lefere, S.; Vandierendonck, A.; Vanderborght, B.; Meese, T.; Van Nieuwerburgh, F.; Verhelst, X.; Geerts, A.; Van Vlierberghe, H.; Devisscher, L. Characterization of the Inflammatory Microenvironment and Hepatic Macrophage Subsets in Experimental Hepatocellular Carcinoma Models. Oncotarget 2021, 12, 562–577. [Google Scholar] [CrossRef] [PubMed]
  63. Fan, Y.; Hao, Y.; Gao, D.; Gao, L.; Li, G.; Zhang, Z. Phenotype and Function of Macrophage Polarization in Monocrotaline-Induced Pulmonary Arterial Hypertension Rat Model. Physiol. Res. 2021. [Google Scholar] [CrossRef] [PubMed]
  64. Debnath, A.; Ali, M.A.; Newmai, K.; Madhuri, P.; Azyu, R.Z.; Malsawmsangi. Effective Management of Wistar Rats in Laboratory Research: A Brief Review. Int. J. Adv. Biochem. Res. 2024, 8, 654–659. [Google Scholar] [CrossRef]
  65. Solt, D.B.; Medline, A.; Farber, E. Rapid Emergence of Carcinogen-Induced Hyperplastic Lesions in a New Model for the Sequential Analysis of Liver Carcinogenesis. Am. J. Pathol. 1977, 88, 595–618. [Google Scholar]
  66. Wójcik, M.; Bobowiec, R.; Martelli, F. Effect of Carotenoids on in Vitro Proliferation and Differentiation of Oval Cells during Neoplastic and Non-Neoplastic Liver Injuries in Rats. J. Physiol. Pharmacol. 2008, 59 (Suppl. S2), 203–213. [Google Scholar]
  67. Wójcik, M.; Wessely-Szponder, J.; Kosior-Korzecka, U. Proliferative and Oxidative Response of Hepatocytes (Hep) and Hepatic Stellate Cells (HSC) Isolated from Rats Exposed to Ketogenic Diet. Pol. J. Vet. Sci. 2014, 17, 703–711. [Google Scholar] [CrossRef]
  68. Giacalone, A.G.; Merritt, M.E.; Ragavan, M. &lt;Em&gt;Ex Vivo&lt;/Em&gt; Hepatic Perfusion Through the Portal Vein in Mouse. J. Vis. Exp. 2022. [Google Scholar] [CrossRef]
  69. Wojcik, M.; Bobowiec, R.; Lisiecka, U.; Śmiech, A. Expression of Receptor Interacting Protein 1 and Receptor Interacting Protein 3 Oval Cells in a Rat Model of Hepatocarcinogenesis. Exp. Ther. Med. 2018, 15, 4448–4456. [Google Scholar] [CrossRef]
  70. Chomczynski P A Reagent for the Single-Step Simultaneous Isolation of RNA, DNA and Proteins from Cell and Tissue Samples. Biotechniques 1993, 15, 536–537.
  71. Livak, K.J.; Schmittgen, T.D. Analysis of Relative Gene Expression Data Using Real-Time Quantitative PCR and the 2−ΔΔCT Method. Methods 2001, 25, 402–408. [Google Scholar] [CrossRef]
  72. Lin, B.; Pang, Z. Stability of Methods for Differential Expression Analysis of RNA-Seq Data. BMC Genom. 2019, 20, 35. [Google Scholar] [CrossRef]
  73. Tarazona, S.; García-Alcalde, F.; Dopazo, J.; Ferrer, A.; Conesa, A. Differential Expression in RNA-Seq: A Matter of Depth. Genome Res. 2011, 21, 2213–2223. [Google Scholar] [CrossRef]
  74. Kuhlmann, W.D.; Peschke, P. Hepatic Progenitor Cells, Stem Cells, and AFP Expression in Models of Liver Injury. Int. J. Exp. Pathol. 2006, 87, 343–359. [Google Scholar] [CrossRef]
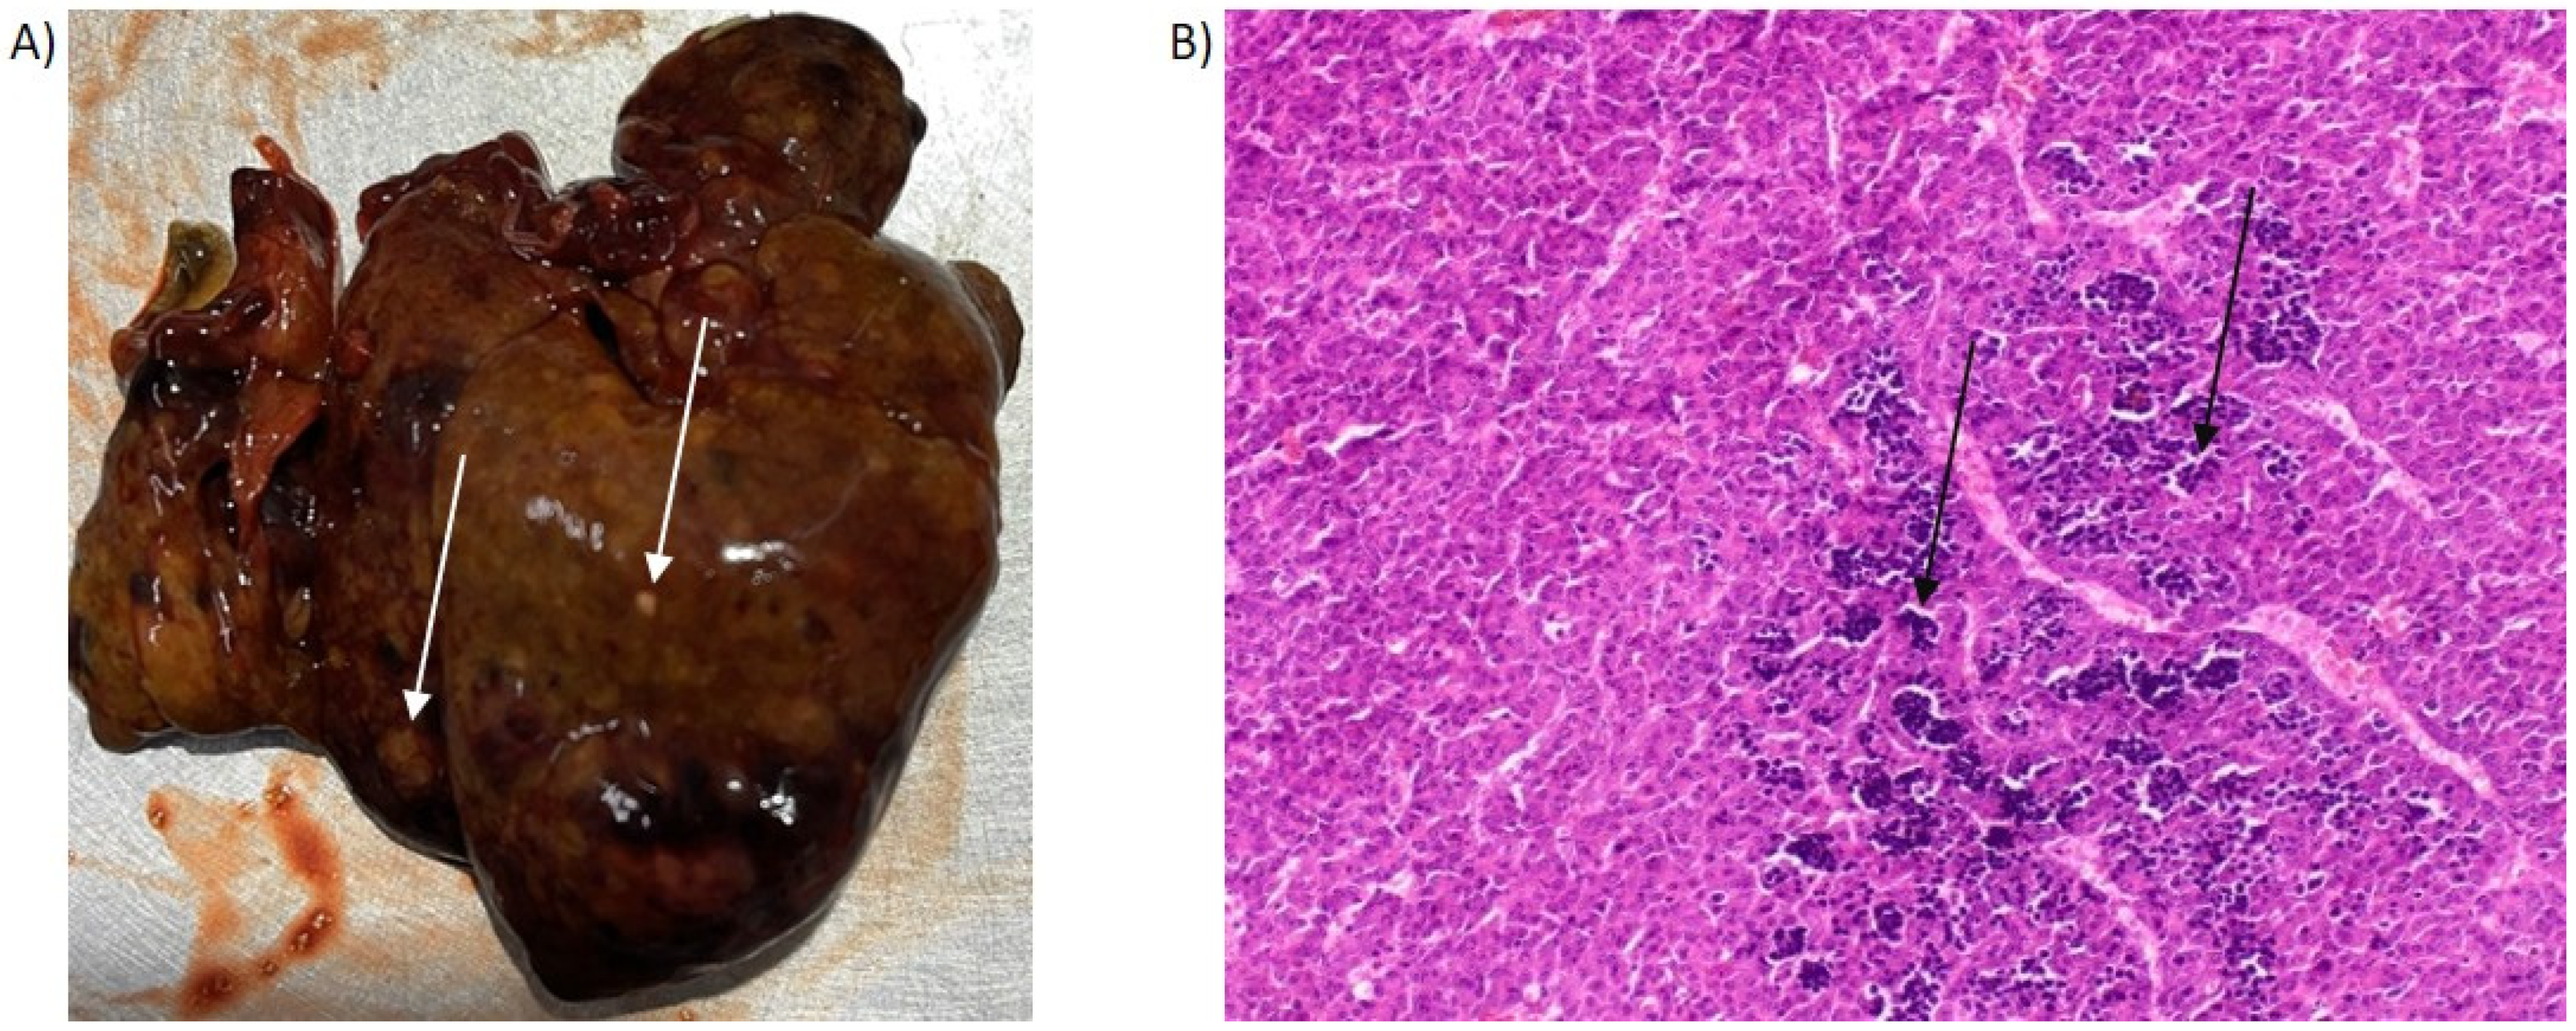
Figure 1. Representative macroscopic and histological features of livers from PH/DEN-treated rats. (A) Multiple white nodules and hemorrhages were macroscopically observed. (B) Histological sections revealed an irregular cellular architecture, nuclear pleomorphism with multinucleation, inflammatory cell infiltration, and mild congestion of the hepatic sinusoids (total magnification ×200). The arrows indicate the affected regions.
Molecules 30 03657 g001
Figure 2. Morphological phase-contrast characteristics of the isolated and cultured macrophages and hepatocytes. (A) Nonstimulated (Mf) and M1 (Mf-M1) macrophages cocultured with PH hepatocytes. Mf: rounded, lightly adherent. Mf-M1: more flattened, more intensely stretched, sometimes with pseudopodia indicative of activation; (B) nonstimulated (Mf) and M1 (Mf-M1) macrophages cocultured with PH/DEN hepatocytes. The above morphological changes in Mf-M1 cells occur together with their proinflammatory polarization, as reflected by the increase in ROS, RNI, and proinflammatory cytokine (TNFα, IL-6) levels. A more significant response to BBG was detected with respect to PH/DEN-derived Mf-M1 (data not published).
Molecules 30 03657 g002
Figure 3. The expression of CE2 taking into account time and the tumor microenvironment. PH—partial hepatectomy, Mf—macrophages, Mf-M1—M1 macrophages, DEN—diethylnitrosamine; *, ** statistically significant differences.
Molecules 30 03657 g003
Figure 4. The expression of Mapk4 taking into account time and the tumor microenvironment. PH—partial hepatectomy, Mf—macrophages, Mf-M1—M1 macrophages, DEN—diethylnitrosamine; *, **, ***, and **** indicate statistically significant differences.
Molecules 30 03657 g004
Figure 5. The expression of Mapk7 taking into account time and the tumor microenvironment. PH—partial hepatectomy, Mf—macrophages, Mf-M1—M1 macrophages, DEN—diethylnitrosamine; *, ** statistically significant differences.
Molecules 30 03657 g005
Figure 6. Proliferative activity of PH- and PH/DEN-hepatocytes assessed by BrdU incorporation; *, *, **, ***, **** statistically significant differences.
Molecules 30 03657 g006
Figure 7. Animal groups (A) and samples(B) used in the experiment.
Molecules 30 03657 g007
Table 1. Effects of partial hepatectomy and PH/DEN-induced hepatocarcinogenesis on body weight, and the serum levels of AST, ALT, AP and GGT.
FeaturePH-Rats
(mean, ±SD)
PH/DEN Rats
(mean, ±SD)
Initial weight (g)203 ± 2.18202 ± 8.2
Final weight (g)312 ± 1.93258 ± 9.2 *
AST (U/L)105 ± 3.88210.25 ± 19.04 *
ALT (U/L)47.15 ± 1.0977.65 ± 5.15 *
AP (U/L)72.85 ± 1.34142.75 ± 2.1 *
GGT (U/L)5.15 ± 0.6561.65 ± 9.08 *
SD—standard deviation; * p ≤ 0.05 vs. PH rats; AST—aspartate aminotransferase; ALT—alanine aminotransferase; AP—alkaline phosphatase; GGT—γ-glutamyl transferase; PH—partial hepatectomy; DEN—diethylnitrosamine.
Table 2. Apoptosis of hepatocytes (% of cells) under various culture conditions.
Hepatocytes24 h
(%, ±SD)
p Value72 h
(%, ±SD)
p Value
PH13.14 ± 1.2-16.86 ± 3.5-
PH and Mf12.7 ± 1.8p = 0.89 *15.44 ± 2.5p = 0.31 *
PH and Mf-M119.2 ± 2.9p < 0.001 **17.9 ± 3.1p = 0.49 **
PH/DEN1.5 ± 0.2-2.9 ± 0.7-
PH/DEN and Mf3.08 ± 0.5p < 0.001 ***5.94 ± 0.8p < 0.001 ***
PH/DEN and Mf-M110.8 ± 1.4p < 0.001 ****15.8 ± 2.1p < 0.001 ****
* PH vs. PH+Mf; ** PH vs. PH+Mf-M1; *** PH/DEN vs. PH+Mf; **** PH/DEN vs. PH+Mf-M1; SD—standard deviation.
Table 3. Correlation matrix between apoptosis and gene expression (CE2, Mapk4, Mapk7) in hepatocyte cultures. The values represent Pearson correlation coefficients (r).
After 24 h
ApoptosisCE2Mapk4Mapk7Proliferative activity
Apoptosis
CE2−0.94 *
Mapk4−0.390.33
Mapk7−0.640.710.36
Proliferative activity−0.88 *0.98 *0.370.36
After 72 h
Apoptosis
CE2−0.71
Mapk4−0.310.32
Mapk7−0.410.800.18
Proliferative activity−0.91 *0.92 *0.68 *0.61
* statistically significant values.
Table 4. Assay IDs of the primer/probe sets for the genes analyzed via real-time PCR.
Gene NameAssay ID of Primer/Probe SetReferences/Source
CE2 (rat)
Primers/probe set
(FAM-MGB)
Rn01442731_m1Life Technologies
Poland LTD (Warszawa, Poland)
Mapk4 (rat)
Primers/probe set
(FAM-MGB)
Rn01461524_m1Life Technologies
Poland LTD (Warszawa, Poland)
Mapk7 (rat)
Primers/probe set
(FAM-MGB)
Rn01403106_m1Life Technologies
Poland LTD (Warszawa, Poland)
Gadph (rat)
Primers/probe set
(FAM-MGB)
Rn01775763_g1Life Technologies
Poland LTD (Warszawa, Poland)
Disclaimer/Publisher’s Note: The statements, opinions and data contained in all publications are solely those of the individual author(s) and contributor(s) and not of MDPI and/or the editor(s). MDPI and/or the editor(s) disclaim responsibility for any injury to people or property resulting from any ideas, methods, instructions or products referred to in the content.