Article

Comparative Study of Ni(II) Complexes with Dithiocarbazate- and Thiosemicarbazone-Based Ligands: Synthesis, Crystal Structures, and Anticancer Activity

Laboratory of Inorganic Synthesis and Crystallography, Institute of Chemistry, University of Brasilia, Brasília 70904-970, DF, Brazil
*
Author to whom correspondence should be addressed.
Molecules 2025, 30(17), 3516; https://doi.org/10.3390/molecules30173516
Submission received: 31 July 2025 / Revised: 22 August 2025 / Accepted: 23 August 2025 / Published: 28 August 2025

Abstract

The present work reports a comparative study of thiosemicarbazone (H2L1) and dithiocarbazate (H2L2) ligands and their Ni(II) complexes; [Ni(L1)(PPh3)] (1); [Ni(L1)(Py)] (2); [Ni(L2)(PPh3)] (3); and [Ni(L2)(Py)] (4). All compounds were characterized by spectroscopy analysis; and the complexes were also characterized by single-crystal X-ray diffraction. The crystal structures of the complexes revealed a distorted square planar geometry with the Ni(II) atoms coordinated to a double-deprotonated and tridentate ligand molecule by the ONS donor system. The coordination sphere is completed by the incorporation of pyridine or triphenylphosphine coligands at the metal center. Biological assays were conducted against the cell lines breast cancer (MCF-7); cisplatin-resistant ovarian cancer (A2780cis); lung cancer (A549); and nontumoral lung (MRC-5). The results show that cytotoxicity was significantly enhanced upon complexation for complexes (2) and (4); whereas it was suppressed for complexes (1) and (3) against the A2780cis and A549 cell lines. Notably; complex (2) exhibited superior cytotoxicity compared to cisplatin against both MCF-7 and A2780cis.

Graphical Abstract

1. Introduction

An ideal drug should treat a disease without causing undesirable side effects, be easy to use, and be affordable. However, many of the available drugs, especially those used to treat cancer, often cause significant discomfort during administration and may have adverse side effects [1,2]. This reality highlights the importance of increasing efforts to develop new drugs and therapeutic alternatives.
In recent decades, Schiff bases have attracted great attention due to their wide range of potential applications in various fields, such as catalysis, chemical sensors, and therapeutic agents [3,4]. Metal complexes with Schiff bases have demonstrated significant biological activity, including anticancer, antibacterial, and antifungal properties [5,6,7]. Among the known Schiff bases, thiosemicarbazones and dithiocarbazates stand out, which are characterized by their imine or azomethine functional group, with significant pharmacological and structural properties (Figure 1).
Several compounds of the thiosemicarbazone class have shown significant antitumor activity, being capable of inhibiting the growth of cancer cells [8]. Recent work demonstrates that thiosemicarbazones can coordinate with essential metal ions, such as copper and iron, disrupting tumor cell metabolism [9,10]. In addition, some thiosemicarbazones exhibit antibacterial and antiviral properties, further expanding their therapeutic potential [11].
Dithiocarbazates have been widely studied due to their structural versatility and physicochemical properties, producing metal complexes with diverse geometries and biological activities [12,13,14,15]. A variety of complexes with different metals have been described in the literature, demonstrating that the pharmacological activity of free dithiocarbazates increased after complexation against several strains of cancer cells and pathogenic microorganisms, including bacteria and fungi [13,14,16,17,18].
Nickel(II) complexes have demonstrated significant potential in medicinal chemistry due to their biological applications. Studies have shown that nickel(II) complexes can act as therapeutic agents against several diseases, including microbial infections, cancer, and leukemia. These complexes can exhibit antioxidant, anti-inflammatory, antimicrobial, and even cytotoxic activities [19,20,21,22]. Notably, nickel(II) complexes have been investigated for their interactions with SARS-CoV-2 and HIV pathogens, suggesting their potential as anti-COVID-19 and anti-HIV agents [23]. Furthermore, these complexes can show cytotoxic effects on tumor and leukemic cells, leading the scientific community to explore the mechanisms involved [24]. Overall, nickel(II) complexes offer a multifaceted approach to disease treatment, providing promising alternatives for combating a wide range of pathologies. Some published studies exploring the trifluoromethyl group on structures have demonstrated that CF3 substitution can influence a compound’s bioactivity. The potential enhancement of biological activity in these molecules can be attributed to increased stability and lipophilicity, making it highly relevant to pharmaceutical chemistry [25,26].
Due to our interest in metal complexes with thiosemicarbazones and dithiocarbazates, we synthesized four new Ni(II) complexes to compare in order to better understand how some structural modifications can influence their physicochemical and pharmacological properties [17,18,27,28]. In this study, we describe the synthesis and characterization by single-crystal X-ray diffraction, Hirshfeld surface, FT-–IR, UV–Vis, mass spectrometry, and 1H, 19F, and 31P nuclear magnetic resonance of thenoyltrifluoroacetone–4–phenyl–3–thiosemicarbazone (H2L1) and thenoyltrifluoroacetone–S–benzyldithiocarbazate (H2L2) ligands and their Ni(II) complexes. Furthermore, the biological activity of the compounds was evaluated against three cancer cell lines and one healthy cell line.

2. Results and Discussion

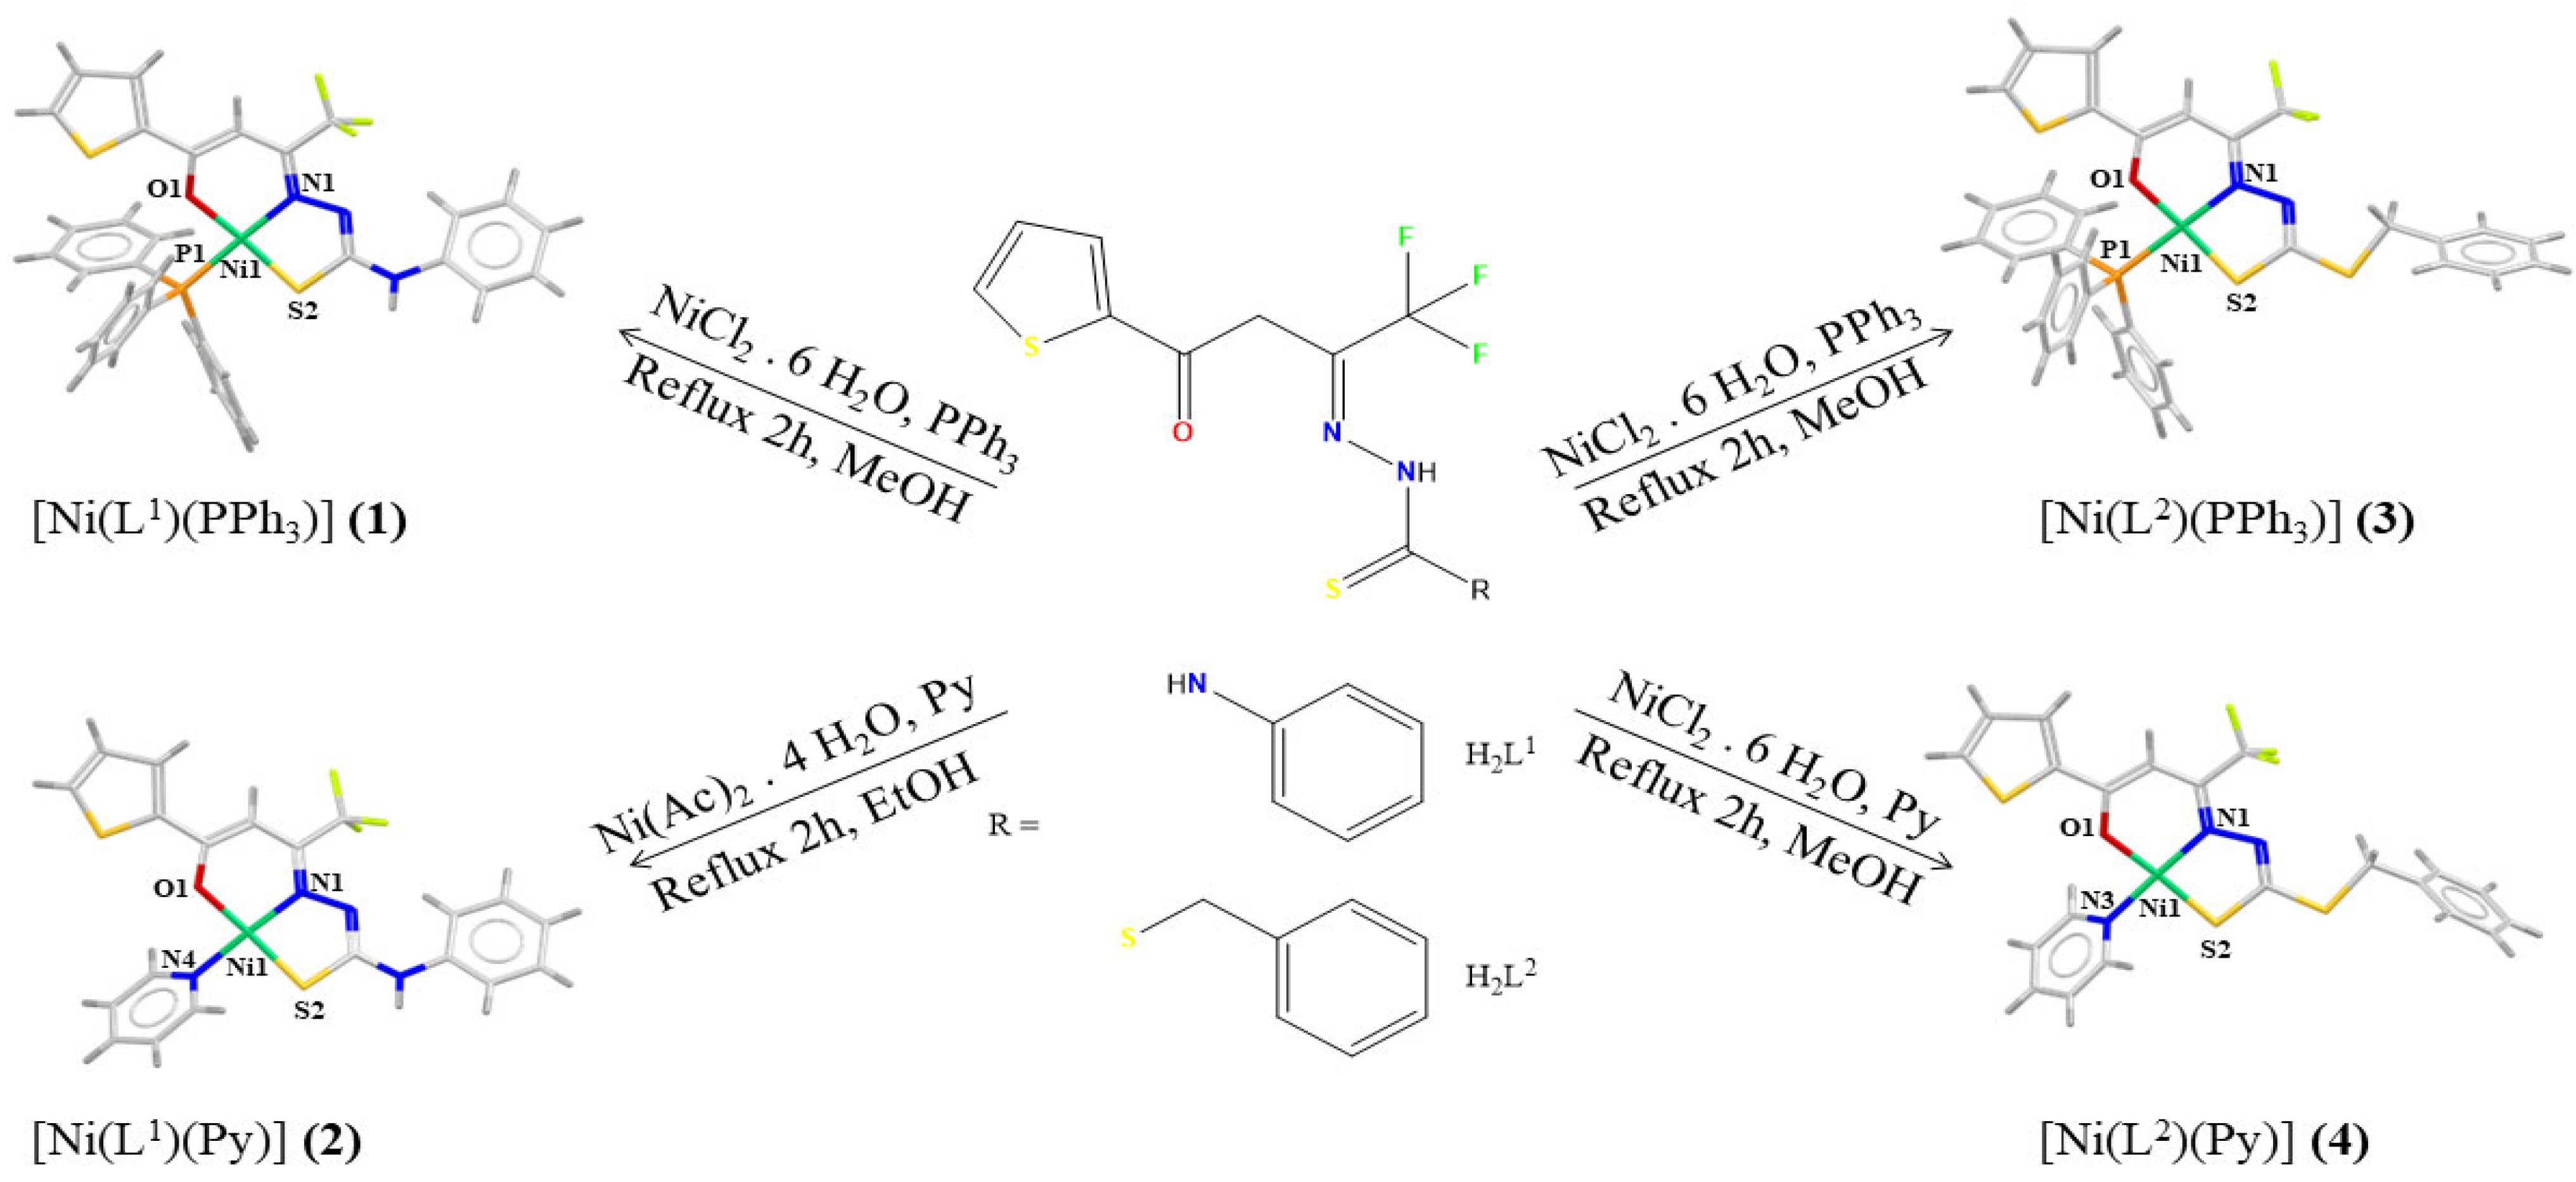
The complexation reactions of the H2L1 and H2L2 ligands with Ni(II) salts yielded the complexes [Ni(L1)(PPh3)] (1), [Ni(L1)(Py)] (2), [Ni(L2)(PPh3)] (3), and [Ni(L2)(Py)] (4), with triphenylphosphine or pyridine as coligand to complete the coordination sphere (Figure 2). Crystal structures of (14) were established by single-crystal X-ray diffraction, and physicochemical and spectroscopic analyses were performed for all compounds.

2.1. Structural Analyses

The structural analysis by single-crystal X-ray diffraction of the complexes (14) revealed the ligand molecules in anionic form coordinated by azomethine nitrogen, carbonyl oxygen, and thiolate sulfur atoms. The coordination sphere for the Ni(II) atoms is completed by triphenylphosphine or pyridine molecules (Figure 3). The coordination geometry proposed for all complexes is a distorted square planar arrangement with trans angles ranging between 174.23(10)° and 178.12(8)°. The Okuniewski parameter [29] (τ4) was used to verify the proposed geometry. When this parameter approaches 0, the geometry is consistent with a square arrangement, whereas values near 1 indicate a tetrahedral configuration. For all complexes, the parameter values ranged between 0.0166 and 0.0221, consistent with the observed distorted square planar geometries and aligning with similar structures [30,31]. Selected bond lengths and angles of the complexes (14) are listed in Table 1.
The bond lengths for the Ni1–O1 coordination were found to range between 1.854(7) and 1.835(4) Å, while Ni1–N1 bond lengths varied from 1.898(3) to 1.854(8) Å. The bond lengths of Ni1–P for triphenylphosphine are 2.204(10) and 2.209(12) Å for (1) and (3), respectively. The bond lengths of Ni1–N for pyridine are 1.925(9) and 1.903(4) Å for (2) and (4), respectively. The thiosemicarbazone and dithiocarbazate ligands are coordinated by their E isomer and thiol tautomer, as suggested by the bond lengths between 2.112(10) and 2.142(3) Å. Bond length values are consistent with those reported for Ni(II) complexes in the literature [17,18,30]. This is evidenced also by the bond lengths of N2–C9, which range between 1.288(5) and 1.307(13) Å, indicating a double-bond character. These values align with those observed in Schiff bases derived from other β-diketones, which exhibit N2–C9 bond lengths between 1.352(2) and 1.337(13) Å. Moreover, the C9–S2 bond lengths, which range from 1.735(6) to 1.733(3) Å, display a single-bond character. Comparatively, free Schiff base ligands derived from β-diketones exhibit shorter C9–S2 bond lengths, typically ranging from 1.677(19) to 1.645(8) Å, as reported in other works. This elongation of the C9–S2 bond in the complexes further supports their thiol tautomeric coordination [17,32,33]. The crystallographic data also revealed several non-classical intra- and intermolecular hydrogen interactions in the complexes (14). These interactions contribute to the stabilization of the crystal arrangement of the synthesized complexes, as shown in Table S1 and Figures S1–S4 in the Supplementary Materials. The most observed interactions present in complexes (14) are non-classical C–H⋯H hydrogen interactions, with distances ranging from 2.381 Å to 2.887 Å. Additionally, classical N⋯H and F⋯H interactions are present in the crystal lattice.

2.2. Hirshfeld Surface

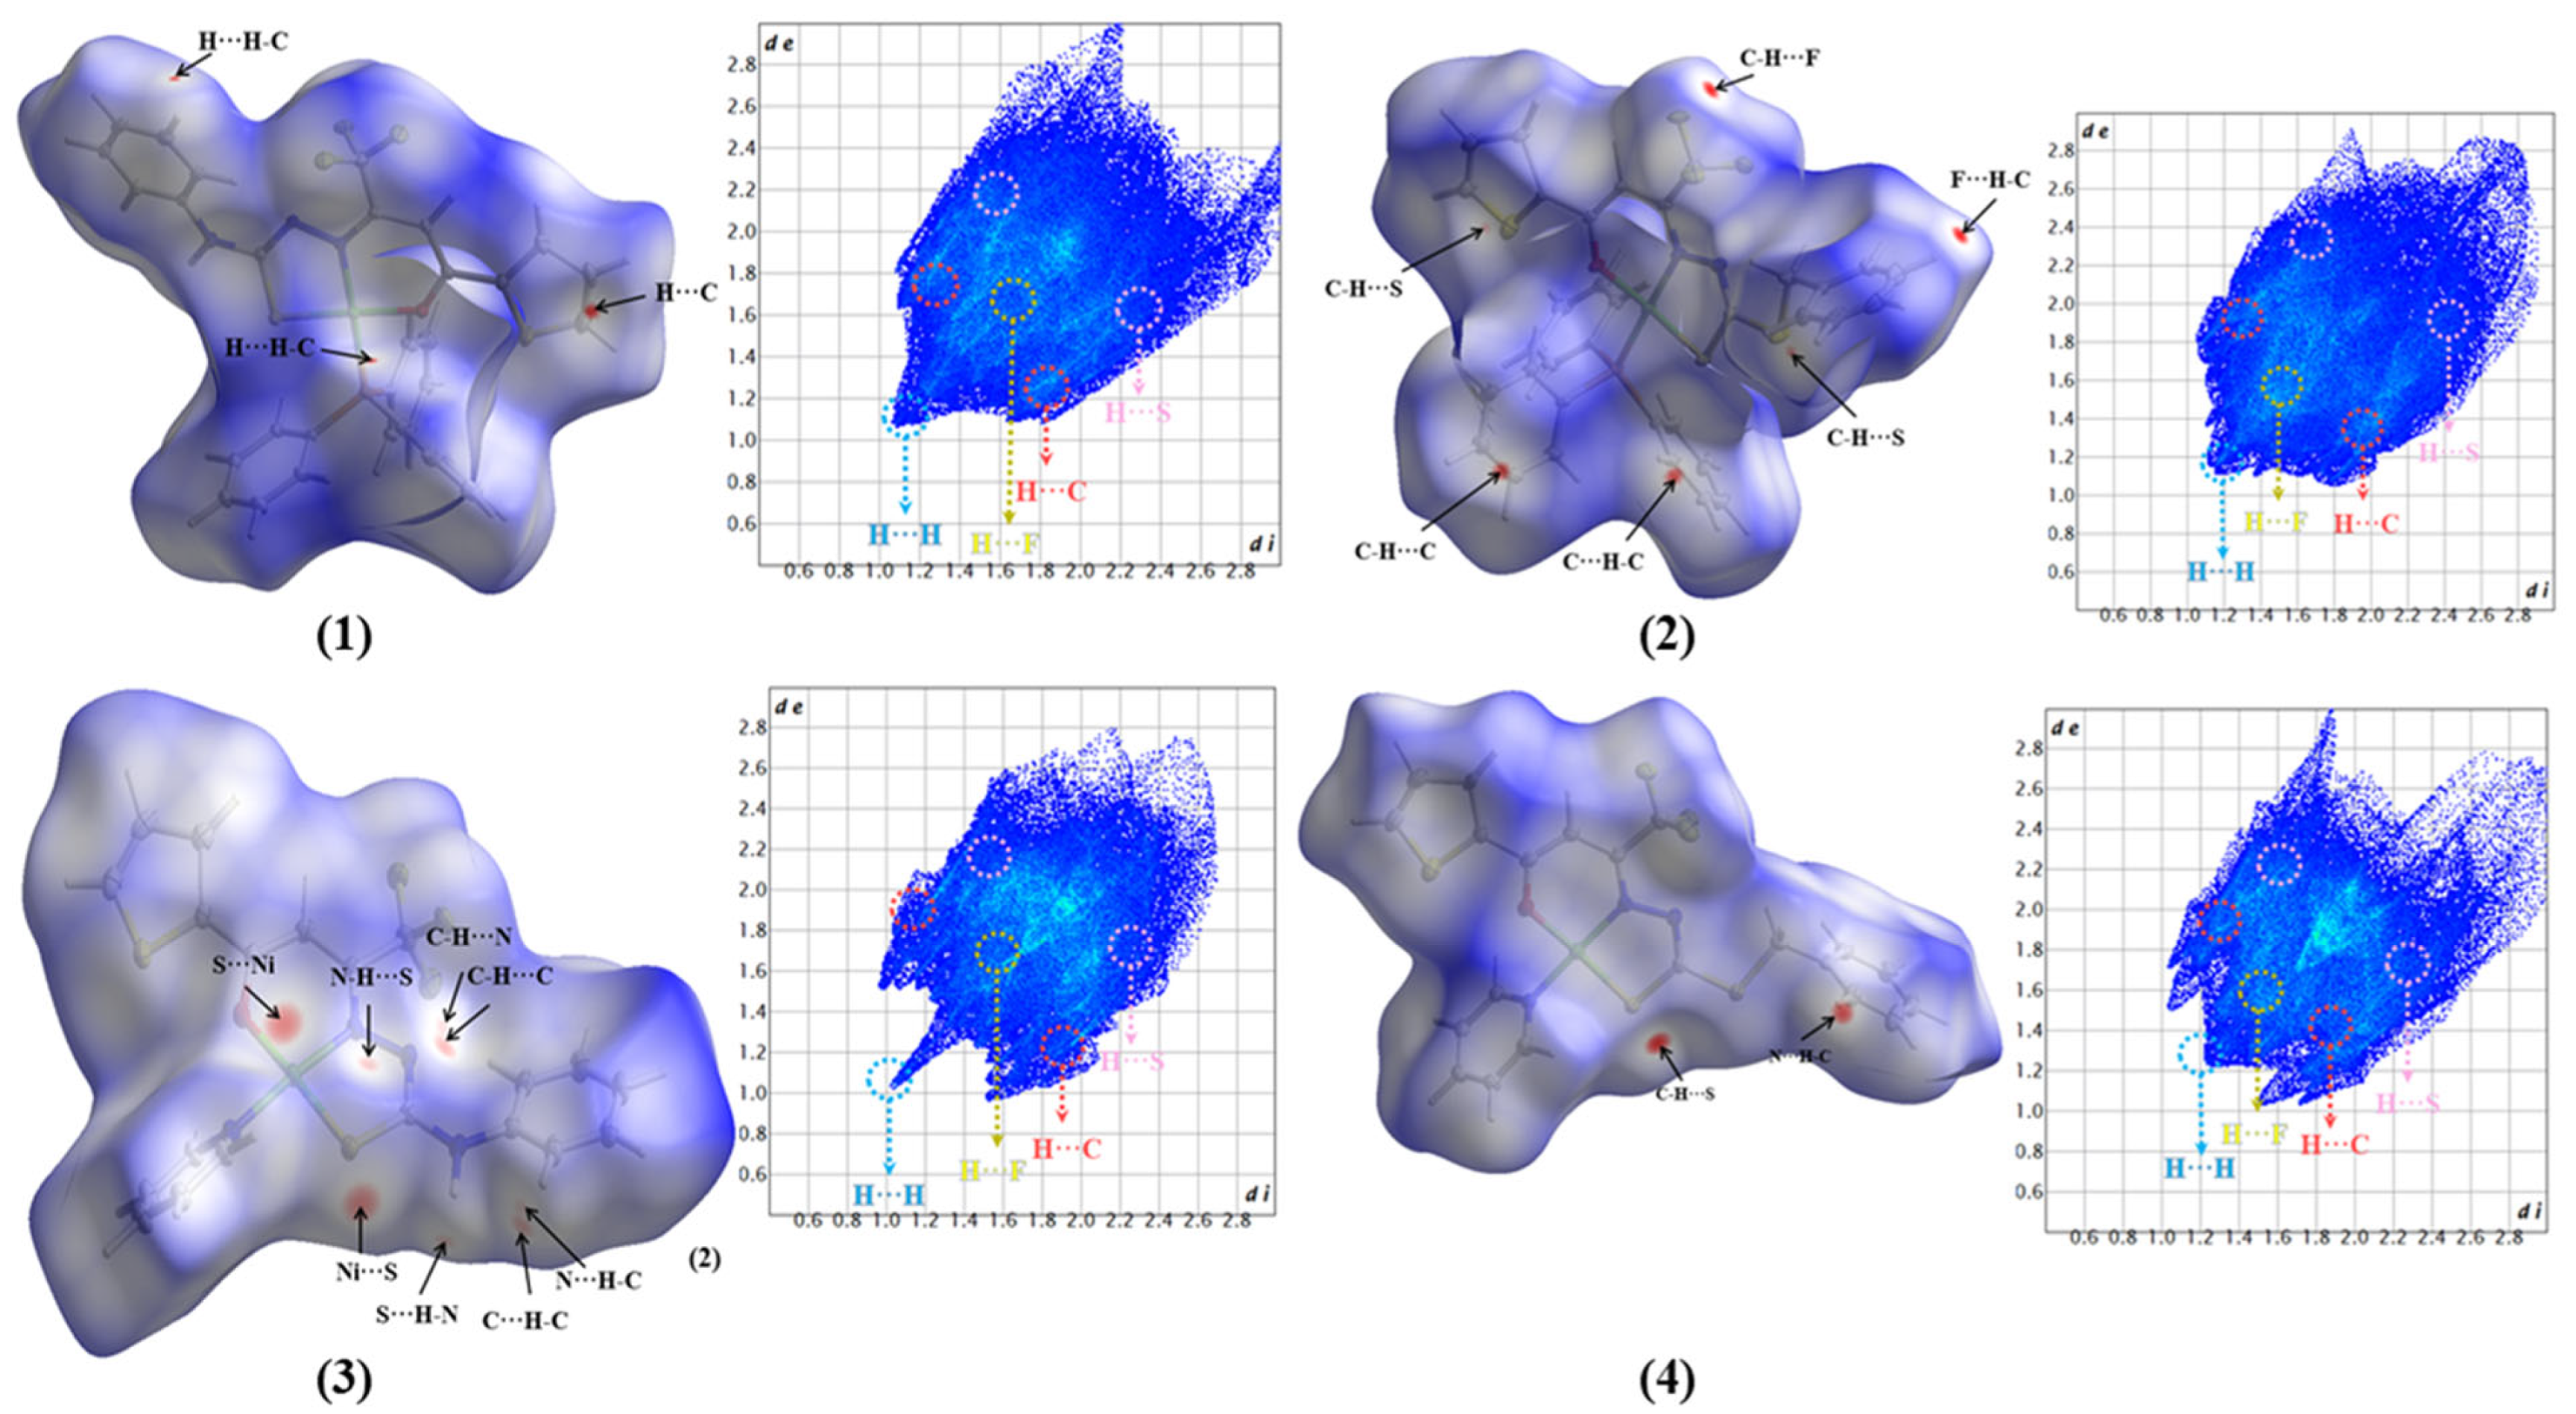
The Hirshfeld surface (HS) was used to understand and quantify the interactions in the crystal lattice packing of the complexes (14). HS in the dnorm function generates a surface that mathematically correlates the distance between an atom within the surface and the closest external atom based on van der Waals radii. This correlation produces a color pattern, ranging from blue to red, which indicates whether the contact distance is bigger, closer, or smaller than the sum of the van der Waals radii of the atoms inside the surface, respectively [34,35]. The contacts observed on the surfaces of all four complexes reveal the presence of non-classical hydrogen bonds between atoms (Figure 4). The most frequent intermolecular interactions found in the crystal structures of the complexes were between C–H⋯H–C, C–H⋯C, C–H⋯F, C–H⋯S, and C–H⋯N.
The fingerprint plots of complexes (14) detail the interactions that most contribute to the formation of the crystal lattice, with the main contact contributions being between H⋯H and C⋯H atoms, presented in the Supplementary Materials (Figures S5–S8) and summarized in Figure 5. The H⋯H interactions contribute at 26% and 26.9% in complexes (2) and (4), respectively, significantly lower than the contributions observed in complexes (1) and (3) at 43% and 43.8%. This difference can be attributed to the presence of triphenylphosphine molecules coordinated to the metal centers. Furthermore, complexes (1) and (2) exhibit a higher contribution of H⋯N interactions, most likely from the terminal thiosemicarbazone portion in the structures, with contributions ranging between 4.2% and 7.1%. Qualitative and quantitative comparisons of the contacts present in complexes (14) with similar structures reported in the literature show that these contacts are frequently observed in the supramolecular arrangement of Schiff base-derived complexes [15,17,18,28,30,36,37].

2.3. Infrared Spectra

Infrared spectra were obtained for the ligands and their complexes, ranging from 4000 to 400 cm−1 (Table 2 and Figures S9–S14).
The IR spectrum of the free ligands showed the ν(N–H) of the nitrogen adjacent to the azomethine group at 3333 and 3304 cm−1 for H2L1 and 3195 cm−1 for H2L2. Additionally, both ligands exhibited a characteristic ν(C=O) at 1651 cm−1 for H2L1 and 1637 cm−1 for H2L2 [17,30,32,33,38]. Comparing the spectra of the free ligands and their Ni(II) complexes, the disappearance of the ν(C=O) and ν(N–H) bands was observed, indicating the formation of the enol tautomer with the complexation. In the absence of water molecules in complexes (2) and (4), the bands observed from 3450 to 3438 cm−1 can be attributed to moisture adsorbed by the KBr pellets during sample preparation. Another significant observation is the absence of the intense ν(C=S) in the complexes. This absence is attributed to the coordination of the sulfur atom with the Ni(II) atoms, which transforms this bond into a single bond, as corroborated by single-crystal X-ray diffraction results. This behavior is in agreement with the literature, where the sulfur atoms of the ligands transfer part of their electron density to the metal upon complexation, weakening the sulfur–carbon bond [15,17,27,30,32,38].
In the free H2L1 ligand, the ν(C=N) is observed at 1597 cm−1, while in both complexes (1) and (2) it is at 1544 cm−1. This shift is justified by the increased electron delocalization in the structures of the metal complexes, as supported by single-crystal X-ray diffraction results, which show the double-bond character of the C=N bond [17,28,39]. For ν(N–N), an increase in the stretching frequency is observed in complexes compared to the free ligand, with values ranging from 1097 to 1066 cm−1 for the complexes and from 1064 cm−1 to 1038 cm−1 for the ligands, respectively [27,28]. Based on the similarity with other nickel(II) complexes with Schiff bases and pyridine or triphenylphosphine reported in the literature, the bands in the 690–694 cm−1 region can be assigned to δ(Py) and ν(Ni–PPh3) vibrations [18,30,31].

2.4. Electronic Spectra

The electronic spectra of the Schiff bases and their complexes (14) were obtained to investigate the possible electronic transitions at concentrations of 2 × 10⁻⁵ mol·L−1 in methanol and dimethylformamide (Figures S15–S18). The wavelengths representing π–π* transitions of the azomethine group, n–π* transitions, and ligand–metal charge transfer (LMCT) transitions are listed in Table 3.
All compounds exhibited bands in high-energy regions, attributed to the π→π* transition of the azomethine function. In the ligands, these values ranged between 283–284 nm for H2L1 and 262–294 nm for H2L2. In the complexes, a decrease in the wavelength of this transition was observed, indicating a hypochromic shift upon complexation, with values between 229–281 nm [40]. For the ligands H2L1 and H2L2 in methanol, n→π* transitions were observed at wavelengths of 415 nm and 445 nm, respectively, while in dimethylformamide, these transitions were found at 431 nm and 451 nm. The complexes exhibited broad bands in the range of 441–501 nm, attributed to charge transfer S→Ni(II), as seen in other studies, suggesting the coordination by the thiolate group [17,30,38,41]. Furthermore, the complexes formed with the thiosemicarbazone ligand exhibited several ligand-to-metal charge transfer transitions, whereas the complexes with the dithiocarbazate ligand exhibited fewer such transitions. The d-d transitions for Ni(II) typically occur in the visible region of the spectrum. Still, distinct d-d transitions were not observed in the complexes, presumably due to their low intensity and overlap with the more intense ligand-based and LMCT bands. Despite the high structural similarity, small variations in the ligands can alter the molecular configuration, affecting the optical properties and intermolecular interactions and causing variations in the number of observable peaks in the UV–visible spectrum.

2.5. Mass Spectrometry

Electrospray ionization mass spectra in positive mode ESI(+)–MS(/MS) were acquired to investigate the actual species present in solution for H2L1, H2L2, and their complexes (14) at a concentration of 50 μM (Figures S19–S28). The ESI(+)–MS/MS spectrum for the ligand H2L1 peaks at m/z = 372.0450, corresponding to the [M+H]+ ion. In contrast, the base peak at m/z = 246.0310 was attributed to the loss of the β-diketone moiety containing the thiophene group. Additional fragment ions were identified at m/z = 219.0198, assigned to the loss of both the thiophene and CF3 groups from the β-diketone, along with signals corresponding to the terminal thiosemicarbazone moiety and half of the β-diketone at m/z = 136.0216 and m/z = 110.99606, respectively. Similarly, H2L2 displayed a peak at m/z = 403.1103, representing the [M+H]+ ion, and a base peak at m/z = 277.0072, corresponding with partial β-diketone loss containing the thiophene group. Fragment peaks at m/z = 110.9906, corresponding to the half β-diketone, and m/z = 91.00561, attributed to the loss of the S-benzyl moiety from the dithiocarbazate, were detected.
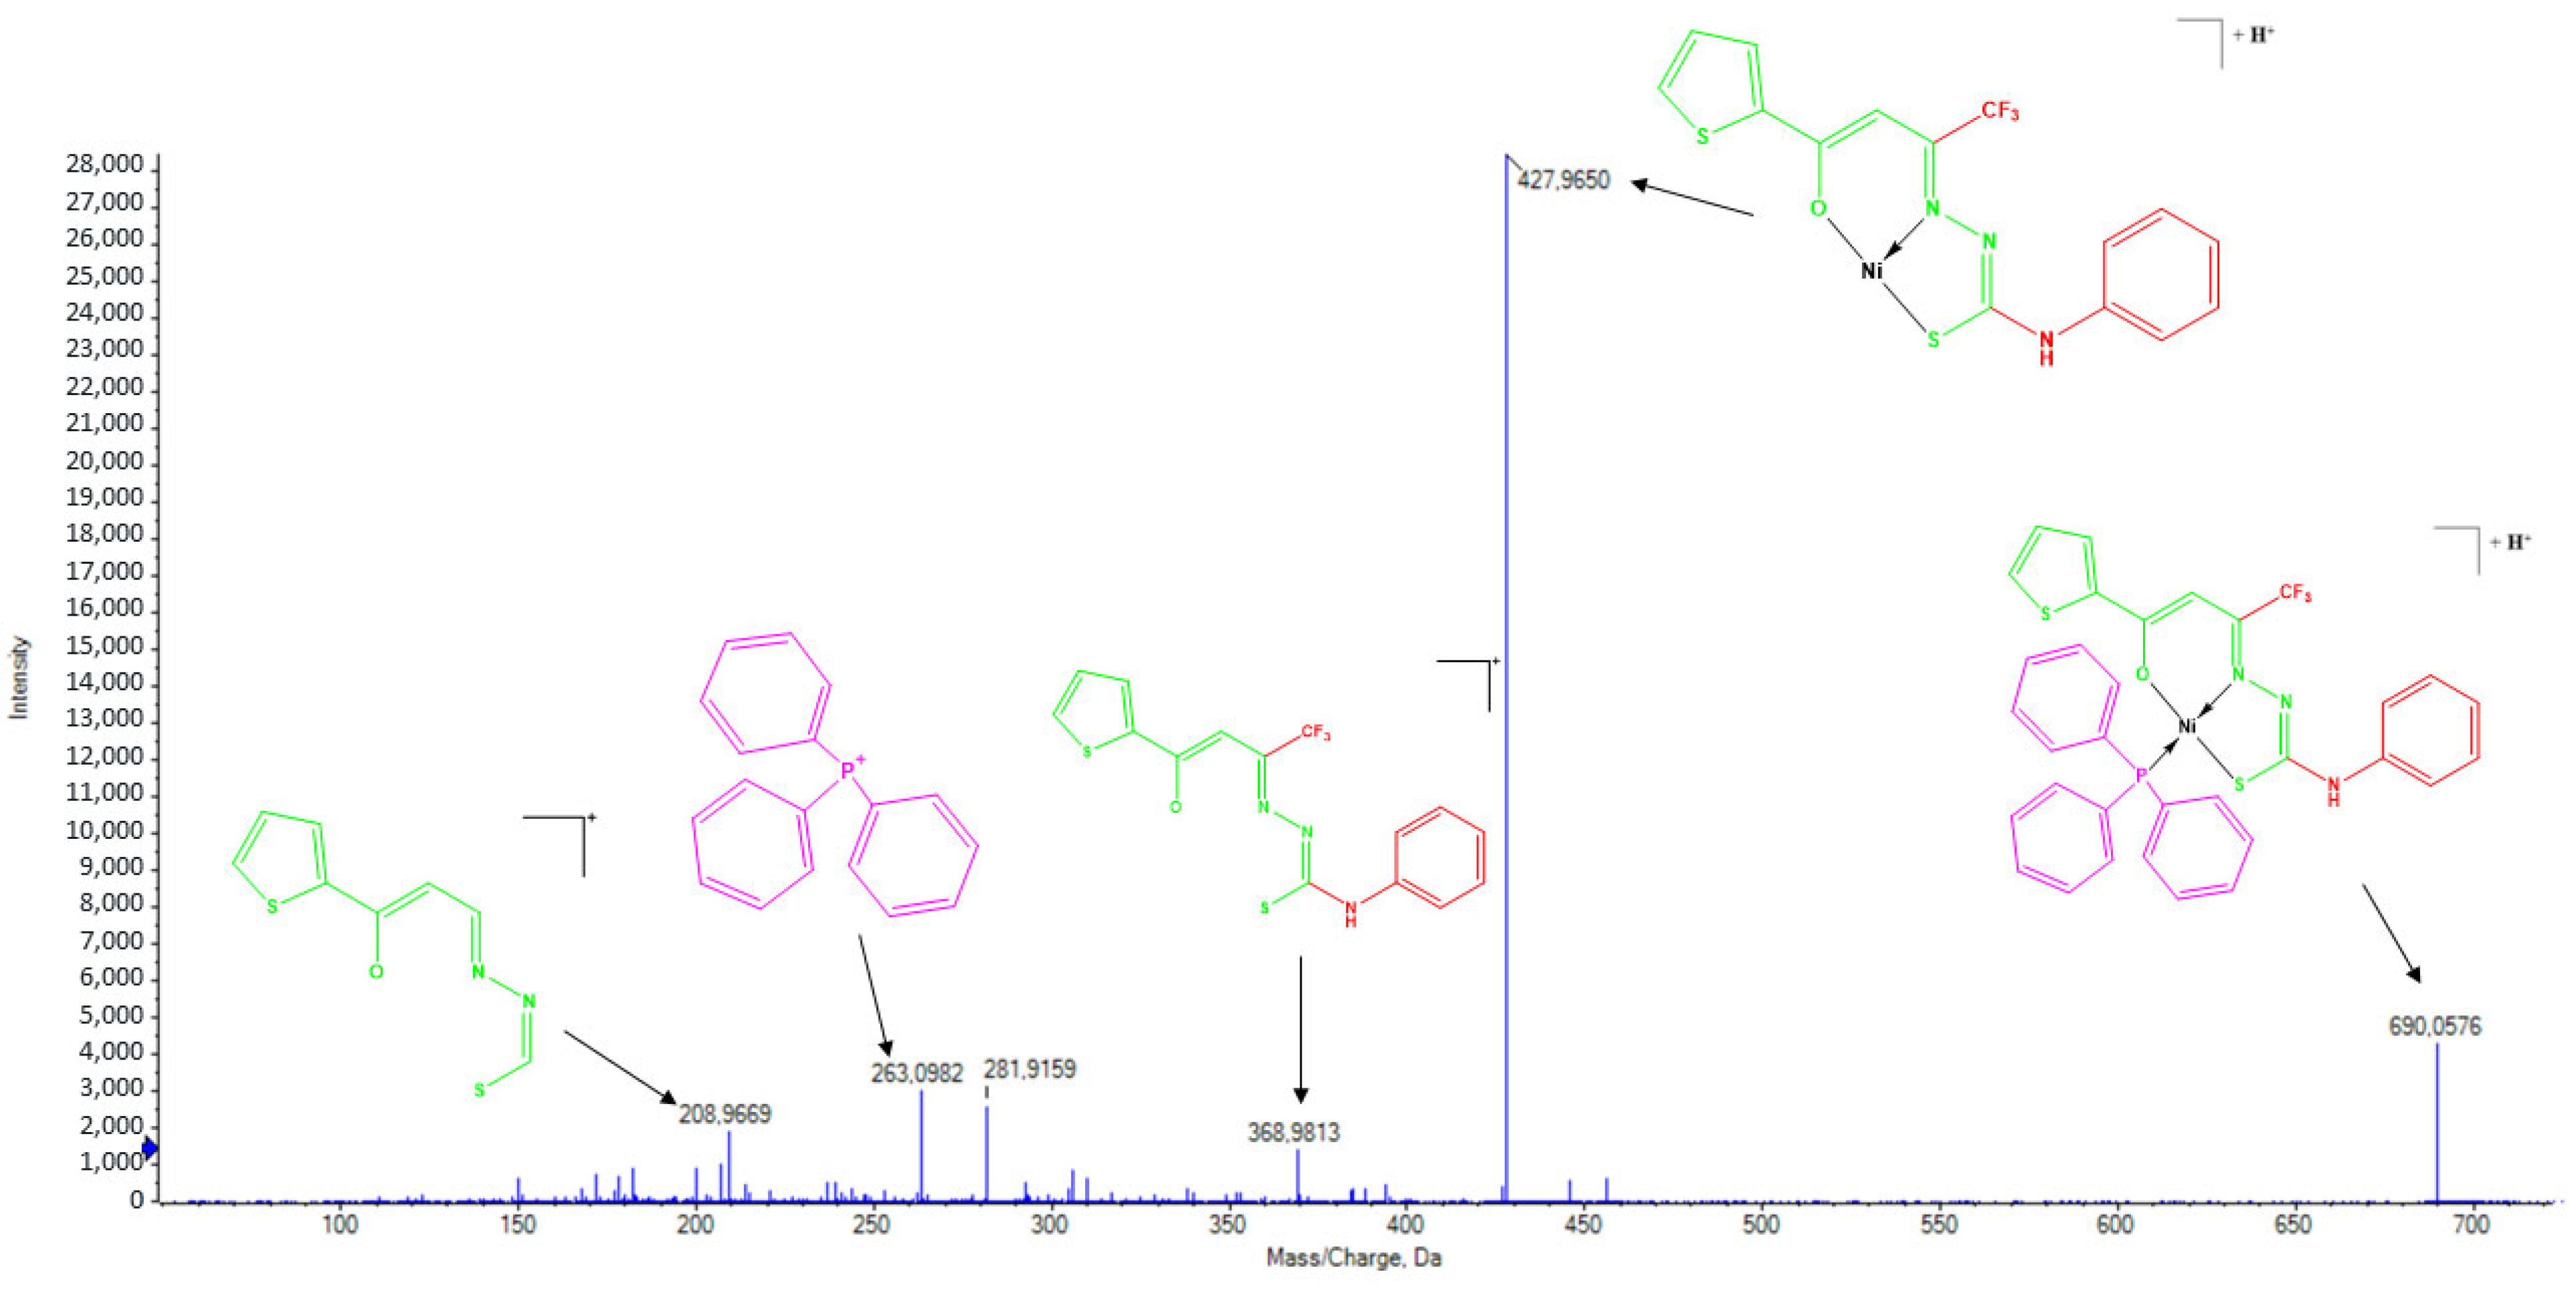
Complexes (1) and (2), due to their structural similarity, exhibited similar fragmentation patterns in their ESI(+)–MS/MS spectra. For (1), a peak at m/z = 690.0576 was observed, corresponding to the [M+H]+ ion, with the base peak at m/z = 427.9650 attributed to the loss of the triphenylphosphine coligand (Figure 6). Complex (2) exhibited a peak at m/z = 507.3280 for the [M+H]+ ion and a base peak at m/z = 427.9645, associated with the loss of the pyridine group. In both spectra, the presence of the deprotonated free ligand was observed at m/z = 368.9810, along with a fragment corresponding to the ligand without the terminal thiosemicarbazone moiety at m/z = 208.9669. Additionally, peaks corresponding to triphenylphosphine at m/z = 263.0982 for complex (1) and pyridine at m/z = 80.0512 for complex (2) were observed [17].
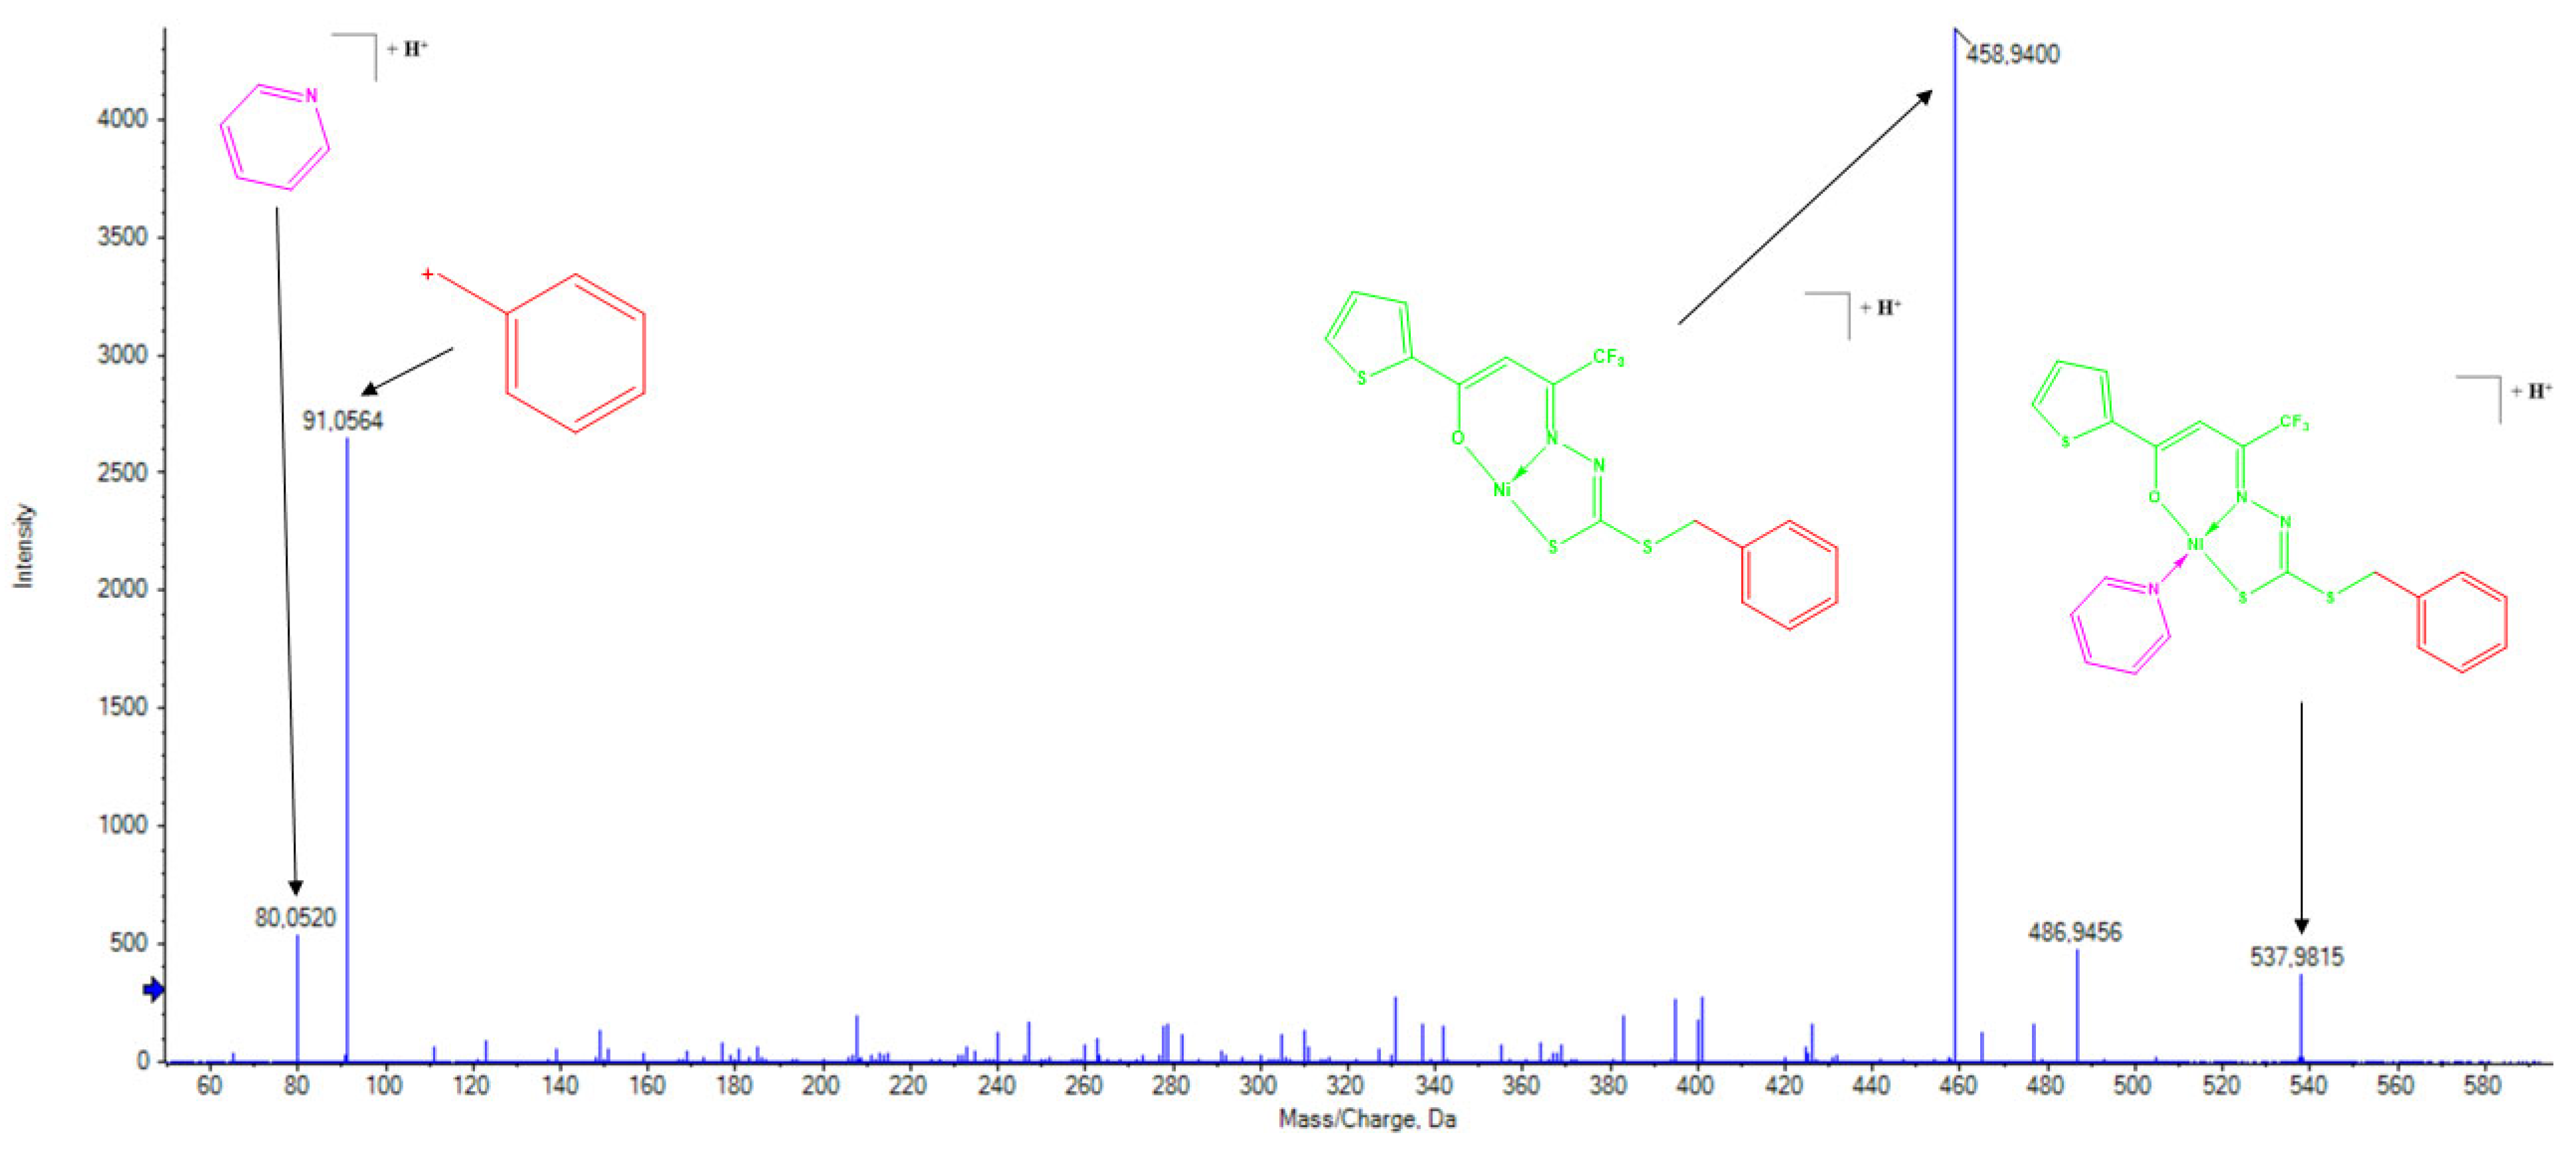
Due to their structural similarity, the complexes with dithiocarbazate ligands exhibited analogous fragmentation patterns. In the ESI(+)–MS/MS spectrum of (3), a peak at m/z = 721.0333 was observed for the [M+H]+ ion, while the base peak at m/z = 458.9412 was attributed to the loss of the triphenylphosphine coligand. The ESI(+)–MS/MS of (4) displayed a peak at m/z = 537.9815 for the [M+H]+ ion, with the base peak at m/z = 458.9400 corresponding to the loss of the pyridine group (Figure 7). Both spectra showed a fragment peak at m/z = 91.0552, assigned to the terminal dithiocarbazate moiety, along with triphenylphosphine at m/z = 263.0984 for (3) and pyridine at m/z = 80.0520 for (4) [17]. The isotopic distribution patterns observed in the ESI(+)–MS spectra strongly support the proposed structures of the synthesized compounds, as the experimental data demonstrated excellent agreement with theoretical values [42].

2.6. 1H, 19F, and 31P NMR Spectra

The 1H NMR spectra of the synthesized ligands and complexes (14) are presented in Figures S28–S33, while the corresponding chemical shift values and coupling constants (J) are summarized in Table 4 and Table S2–S7. In all compounds, the most shielded signals in the spectra correspond to singlets attributed to CH2 groups, with chemical shifts ranging from 4.46 ppm to 4.67 ppm in the ligands and from 4.10 ppm to 4.33 ppm in the complexes (3) and (4), associated with the terminal dithiocarbazate moiety. Upon complex formation, deprotonation of the C6 carbon occurs, leading to electronic delocalization throughout the structure due to coordination with the metal center [27,41,43]. This delocalization reduces the electron density on the remaining hydrogen atom bound to this carbon, increasing its unshielding effect and shifting the signal to higher chemical shift values [27,41,43]. In complexes (1) and (2), this shift was observed at 6.26 ppm and 6.17 ppm, respectively, whereas in complexes (3) and (4), these signals overlapped with the aromatic region. Regarding the most unshielded chemical environments, the hydrogen atoms were attributed to the amino groups in the ligands, with chemical shifts at 11.19 ppm and 13.20 ppm for H2L1 and H2L2, respectively [22,28,33]. The remaining signals were attributed to aromatic hydrogen atoms. Although some of these aromatic hydrogens are chemically non-equivalent, their signals appeared in the same regions. The 19F NMR spectra of all compounds are presented in Figure S35; the spectra display characteristic chemical shifts for the trifluoromethyl group in the range of −62.04 to −68.40 ppm, consistent with values reported for analogous CF3-containing compounds in the literature [44,45]. The 31P NMR spectra of the free PPh3 and the ligands and complexes (1) and (3), shown in Figure S36, exhibit a downfield-shifted singlet at 22.92 and 22.30 ppm, respectively, for (1) and (3), consistent with the presence of a single coordinated triphenylphosphine ligand in the nickel(II) complexes. These chemical shifts align with those reported for analogous Ni(II)-PPh3 systems, confirming the expected coordination environment [46,47].

2.7. Biological Activity Analysis

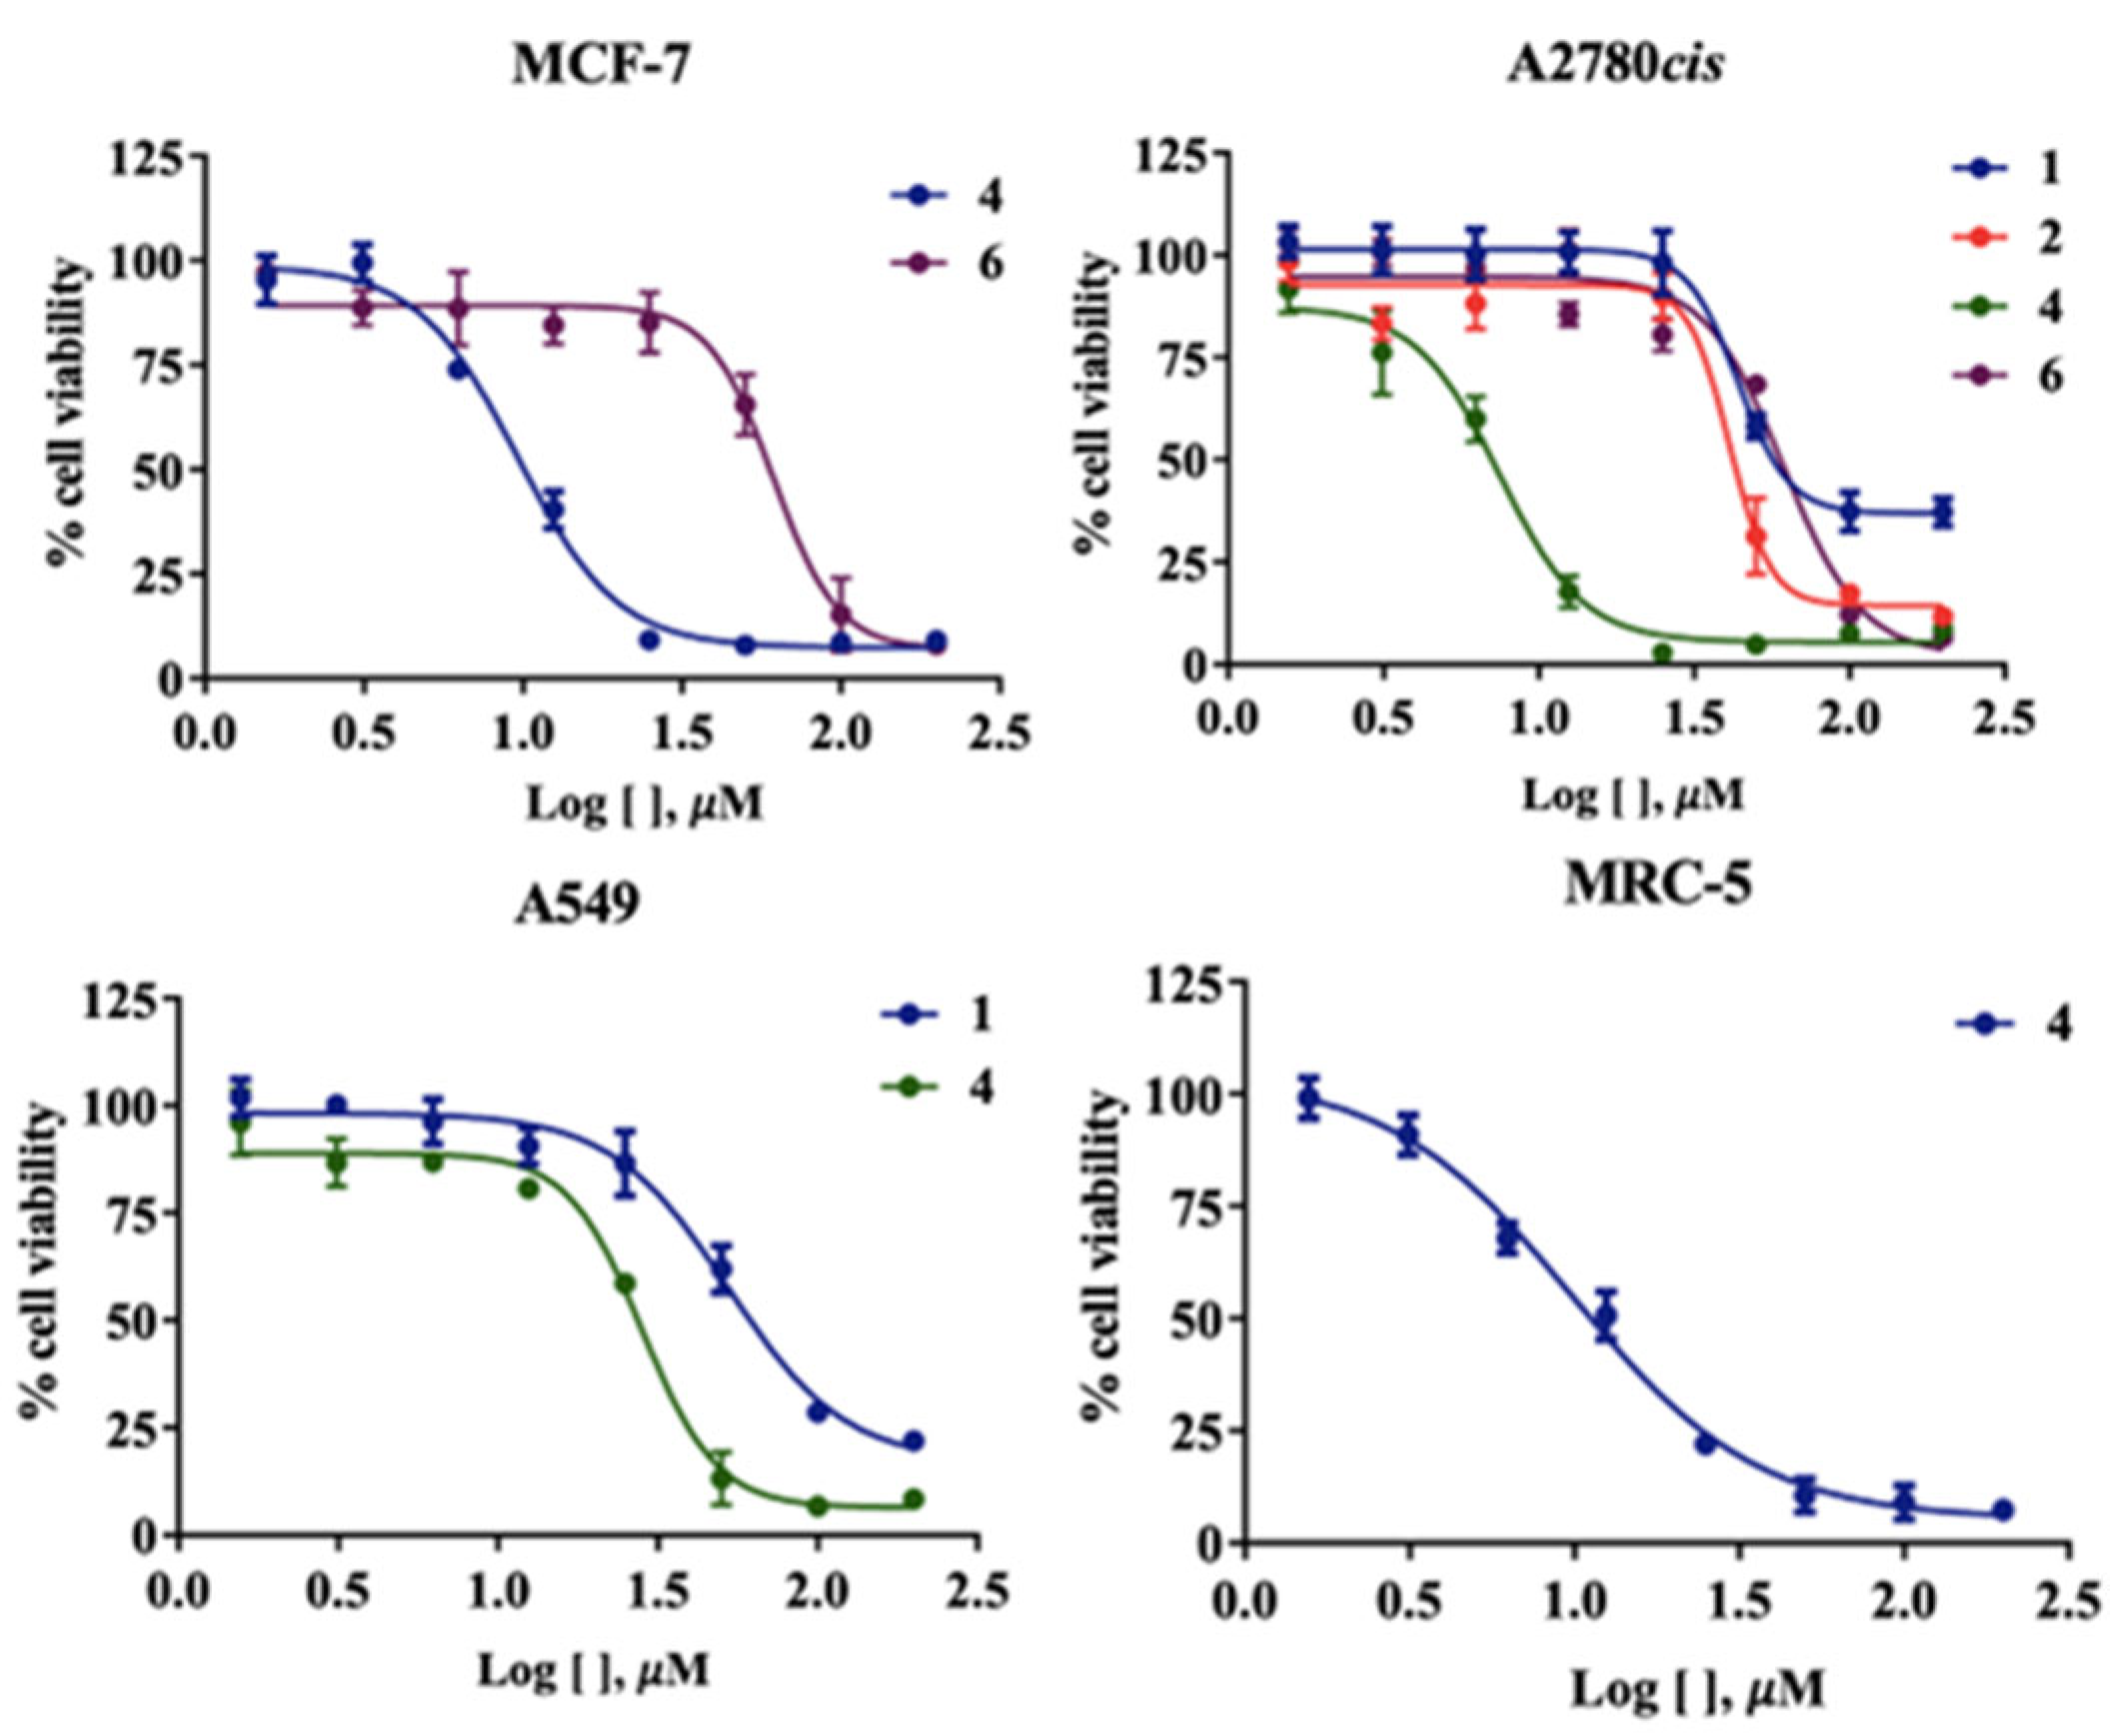
DMSO solutions (10−3 M) of the complexes (14) were subjected to molar conductance measurements at room temperature over 48 h, and the observed values are presented in Table S8. The complexes showed low molar conductance values, which indicates that they are present in their neutral form. A comparative cytotoxicity assay explored the differences between nickel(II) complexes derived from thiosemicarbazone and dithiocarbazate ligands. Additionally, we investigated the influence of the coligands triphenylphosphine and pyridine in the complexes. The effectiveness of the compounds in inhibiting cell viability was concentration- and time-dependent. The analysis involved varying concentrations between 1.56 and 200 µM over 48 h using an MTT assay, with untreated cells serving as the control. Table 5 presents the IC50 values for the free ligands, synthesized complexes, and cisplatin, which served as reference compounds in this study [48]. The compounds’ proliferative ability in 48 h was significantly reduced with increasing concentration (Figure 8).
For the MCF-7 breast cancer cell line, no cytotoxic activity was observed for the free ligands at concentrations below 100 µM. In contrast, only the complexes containing pyridine as a coligand exhibited cytotoxic activity, with IC50 values of 8.48 µM for complex (2) and 56.54 µM for complex (4). In the cisplatin-resistant ovarian cancer cell line A2780cis, both free ligands demonstrated cytotoxic activity with IC50 values of 42.78 µM and 78.93 µM for H2L1 and H2L2, respectively. Upon complexation, an increase in cytotoxic activity was observed when pyridine was used as the coligand, whereas the use of triphenylphosphine resulted in reduced cytotoxicity. For the A549 lung cancer cell line, cytotoxic activity was observed only for the thiosemicarbazone ligand and complex (2) with IC50 values of 51.38 µM and 27.18 µM, respectively, indicating enhanced cytotoxicity upon coordination. For the nontumoral lung cell line MRC-5, only complex (2) showed an IC50 value of 9.89 µM.
The results demonstrate that Ni(II) complexes containing pyridine groups exhibited greater cytotoxic activity than those with triphenylphosphine, similar to related complexes [17,30]. This indicates that bulky groups coordinated to the metal centers may increase lipophilicity by reducing their bioavailability [17,31]. In addition, the cytotoxicity of the synthesized compounds against the A2780cis cell line is particularly noteworthy, as this cell line has demonstrated resistance to cisplatin-based treatments [49]. The synthesized compounds H2L1, H2L2, and complexes (2) and (4) may represent promising candidates for alternative therapies, as they exhibit cytotoxic activity against this cisplatin-resistant cell line while demonstrating lower toxicity to healthy cells, such as MRC-5. Although MRC-5 represents a different tissue type, the results suggest a degree of selectivity of these compounds towards tumor cells, except for complex (2), which was the only compound with an IC50 value below 100 µM. While complex (2) demonstrates prominent cytotoxicity against MCF-7 and A2780cis cell lines, its comparable toxicity toward nontumoral MRC-5 lung cells indicates limited therapeutic selectivity. In contrast, complex 4 shows moderate tumor cell inhibition with no observable toxicity to MRC-5 cells at ≤100 μM, suggesting a potentially safer pharmacological profile despite reduced potency. This contrast highlights the balance between efficacy and selectivity in drug development.

3. Materials and Methods

3.1. Materials, Methods, and Instruments

The reagents and solvents were obtained from Merck-Brazil and used without further purification. The complexation studies were performed using fresh pyridine. The FT–IR spectra of the compounds were obtained from KBr pellets using an FT–IR Varian 640 spectrometer (Agilent Technologies, Santa Clara, CA, USA) in the range of 4000–400 cm−1, with 32 scans at a resolution of 4 cm−1. Electrospray ionization–mass spectrometry analysis (ESI–MS) was performed on an AB Sciex Triple TOF 5600+ mass spectrometer (SCIEX, Marlborough, MA, USA) in positive mode, with a voltage of 5500 V and source temperature of 200 °C. 1H, 19F, and 31P nuclear magnetic resonance spectra were collected on a Bruker Ascend 600 MHz (UC Davis RMN Facility, Davis, CA, USA), with TMS as internal reference and DMSO–d6 as solvent for 1H experiments and PF6 as intermetal reference and D2O as solvent for 19F and 31P experiments. Elemental analysis of CHN was performed with a Perkin Elmer/Series II 2400 analyzer (Perkin Elmer, Shelton, CT, USA). The reported elemental analysis values are from a single measurement, even though the analysis was performed in triplicate. Electronic spectra were obtained using a UV–Vis–NIR Varian Cary 5000 spectrophotometer (Agilent Technologies, Santa Clara, CA, USA) using 20 μM solutions prepared in methanol and dimethylformamide. Complexes (14) were synthesized based on procedures previously described for similar compounds [17,18,30].

3.2. Synthesis of Thiosemicarbazone Ligand (H2L1)

H2L1 was synthesized based on a patterning procedure [50]. An amount of 666.57 mg (3 mmol) of thenoyltrifluoroacetone was added to an ethanolic solution (40 mL) of 501.69 mg (3 mmol) of 4–phenyl–thiosemicarbazide and was stirred under reflux for 4 h with a few drops of H2SO4. Yellow crystals suitable for X-ray diffraction were obtained and filtered after slow evaporation of the solvent of the mother solution. Yield: 1017 mg (91.4%). Melting point: 186–187 °C. Elemental analysis calculated for C15H12F3N3OS2 (%): C. 48.51; H. 3.26; N. 11.31. Found (%): C. 48.82; H. 3.69; N. 11.56. IR bands (KBr, ν/cm−1): ν(N–H) 3333 and 3304; ν(C=N) 1597; ν(C=S) 1307; ν(N–N) 1038; ν(C–S) 728. 1H NMR (DMSO–d6, ppm): 11.72 (s, 1H, N–H), 10.19 (s, 1H, N–H), 8.12–8.10 (m, 1H, –CH), 8.10–8.08 (m, 1H, –CH), 7.53 (d, 1H, Ar), 7.39 (dd, 1H, Ar), 7.33 (dd, 1H, Ar), 7.25 (t, 1H, Ar), 4.67 (s, 2H, CH2). 19F NMR (D2O, ppm): −67.57 (s, CF3). 31P NMR (D2O, ppm): −6.50 (s, PPh3-free). UV–vis (MeOH): λmax = 284 nm and 415 nm. UV–vis (DMF): λmax = 283 nm and 431 nm. ESI–MS [M+H]+ (calcd, found, m/z) = 372.0447/372.0449.

3.3. Synthesis of Dithiocarbazate Ligand (H2L2)

H2L2 was obtained following the procedures in the related literature [33,51]. A mixture of 0.194 mL (1 mmol) of hydrazine hydrate and 56.1 mg (1 mmol) of KOH in 15 mL of ethanol was cooled to 5 °C and refluxed for 1 h. In this solution, 0.06 mL (1 mmol) of carbon disulfide is used. The mixture was kept in an ice bath, and 0.12 mL of benzyl bromide was added dropwise with vigorous stirring. After 1 h, 222.19 mg of thenoyltrifluoroacetone was added, and the final mixture was refluxed and heated for 1 h. Yellow crystals were obtained after some days with the evaporation of the mother solution at room temperature. Yield: 56.2 mg (14%). Melting point: 101 °C. Elemental analysis calculated for C16H13F3N2OS3 (%): C. 47.75; H. 3.26; N. 6.96. Found (%): C. 47.43; H. 3.26; N. 7.27. IR bands (KBr, ν/cm−1): ν(N–H) 3108; ν(C=N) 1594; ν(C=S) 1306; ν(N–N) 1064; ν(C–S) 732. 1H NMR (DMSO–d6, ppm): 13.20 (s, 1H, N–H), 8.10 (d, 1H, –CH), 8.07 (d, 1H, –CH), 7.42 (d, 1H, Ar), 7.36–7.27 (m, 4H, Ar), 4.65 (s, 2H, –CH2), 4.46 (s, 2H, CH2). 19F NMR (D2O, ppm): −68.40 (s, CF3). 31P NMR (D2O, ppm): −6.50 (s, PPh3-free). UV–vis (MeOH): λmax = 262 nm, 295 nm, and 445 nm. UV–vis (DMF): λmax = 294 nm and 451 nm. ESI–MS [M+H]+ (calcd, found, m/z) = 403.0215/403.0213.

3.4. Synthesis of [Ni(L1)(PPh3)] (1)

Initially, 52 mg (0.2 mmol) of triphenylphosphine was dissolved in 5 mL of methanol and added to a solution of 23.7 mg (0.1 mmol) of NiCl2·6H2O in 5 mL of methanol, and the mixture was refluxed for 10 min. Subsequently, a solution of H2L1 (37.1 mg, 0.1 mmol) in 5 mL of methanol was added, and the reaction was continued under reflux for 2 h. Red crystals appropriate for single-crystal X-ray diffraction analysis were filtered off from the mother solution. Yield: 47.1 mg (68.3%). Melting point: 204–205 °C. Elemental analysis calculated for C33H25F3N3OS2PNi (%): C. 57.41; H. 3.65; N. 6.09. Found (%): C. 57.42; H. 3.34; N. 6.07. IR bands (KBr, ν/cm−1): ν(C=N) 1544; ν(C=C) 1506 and 1434; ν(N–N) 1097; ν(C–S) 746; ν(PPh3) 692. 1H NMR (DMSO–d6, ppm): 9.40 (s, 1H, N–H), 7.78 (t, 6H, PPh3), 7.64–7.51 (m, 13H, Ar and PPh3), 7.20 (t, 2H, Ar), 6.92–6.89 (m, 1H, –CH), 6.87 (t, 1H, Ar), 6.26 (s, 1H, –CH). 19F NMR (D2O, ppm): −63.63 (s, CF3). 31P NMR (D2O, ppm): 22.92 (s, PPh3). UV–vis (MeOH): λmax = 229 nm, 273 nm, 361 nm, 464 nm, and 494 nm. UV–vis (DMF): λmax = 445 nm, 469 nm, and 500 nm. ESI–MS [M+H]+ (calcd, found, m/z) = 690.0555/690.0563.

3.5. Synthesis of [Ni(L1)(Py)] (2)

The complex was synthesized by reaction of pyridine (16 μL, 0.2 mmol) in ethanol (5 mL) with Ni(Ac)2·4H2O (24.8 mg, 0.1 mmol) in ethanol (5 mL). The mixture was refluxed for 10 min, followed by the addition of H2L1 (37.1 mg, 0.1 mmol) in ethanol (5 mL). The resulting solution was then refluxed for 2 h. Red crystals appropriate for single-crystal X-ray diffraction analysis were obtained in the refrigerator and filtered from the mother solution. Yield: 34.3 mg (67.8%). Melting point: 149–150 °C. Elemental analysis calculated for C20H15F3N4OS2Ni (%): C. 47.36; H. 2.98; N. 11.05. Found (%): C. 47.20; H. 2.68; N. 10.83. IR bands (KBr, ν/cm−1): ν(C=N) 1544; ν(C=C) 1510 and 1413; ν(N–N) 1066; ν(C–S) 746; δ(Py) 694. 1H NMR (DMSO–d6, ppm): 9.40 (s, 1H, N–H), 9.06 (s, 2H, –CH Py), 8.04 (s, 1H, –CH Py), 7.72–7.51 (m, 6H, Ar and Py), 7.21 (t, 2H, Ar), 7.14–7.07 (m, 1H, –CH), 6.88 (t, 1H, Ar), 6.17 (s, 1H, –CH). 19F NMR (D2O, ppm): −63.13 (s, CF3). UV–vis (MeOH): λmax = 257 nm, 333 nm, 441 nm, 444 nm, and 499 nm. UV–vis (DMF): λmax = 281, nm, 444 nm, 469 nm, and 501 nm. ESI–MS [M+H]+ (calcd, found, m/z) = 507.0065/507.0064.

3.6. Synthesis of [Ni(L2)(PPh3)] (3)

Triphenylphosphine (52 mg, 0.2 mmol) was dissolved in methanol (5 mL) and added to a solution of NiCl2·6H2O (23.7 mg, 0.1 mmol) in methanol (5 mL). The mixture was refluxed for 10 min. Subsequently, H2L2 (40.4 mg, 0.1 mmol) in methanol (5 mL) was added directly to the reaction mixture, and reflux was continued for 2 h. Red crystals appropriate for single-crystal X-ray diffraction analysis were obtained in the refrigerator and filtered off from the mother solution. Yield: 54.1 mg (75.1%). Melting point: 182–183 °C. Elemental analysis calculated for C34H26F3N2OPS3Ni (%): C. 56.61; H. 3.63; N. 3.88. Found (%): C. 56.88; H. 3.59; N. 4.02. IR bands (KBr, ν/cm−1): ν(C=N) 1527; ν(C=C) 1400; ν(N–N) 1095; ν(CSS) 991; ν(C–S) 746; ν(PPh3) 692. 1H NMR (DMSO–d6, ppm): 7.80–7.65 (m, 6H, PPh3), 7.65–7.42 (m, 13H, Ar and PPh3), 7.34–7.29 (m, 4H, Ar), 7.29–7.22 (m, 1H, Ar), 4.33 (s, 2H, –CH2). 19F NMR (D2O, ppm): −62.04 (s, CF3). 31P NMR (D2O, ppm): 22.30 (s, PPh3). UV–vis (MeOH): λmax = 251 nm, 275 nm, and 449 nm. UV–vis (DMF): λmax = 445 nm. ESI–MS [M+H]+ (calcd, found, m/z) = 721,0323/721,0316.

3.7. Synthesis of [Ni(L2)(Py)] (4)

Complex 4 was synthesized by reacting pyridine (16 μL, 0.2 mmol) in methanol (5 mL) with NiCl2·6H2O (23.7 mg, 0.1 mmol) in methanol (5 mL). The mixture was refluxed for 10 min, followed by the addition of H2L2 (40.4 mg, 0.1 mmol) in methanol (5 mL). The resulting solution was then refluxed for 2 h. Red crystals appropriate for single-crystal X-ray diffraction analysis were filtered from the mother solution. Yield: 37.9 mg (70.7%). Melting point: 152–154 °C. Elemental analysis calculated for C21H15F3N3OS3Ni (%): C. 46.95; H. 2.81; N. 7.82. Found (%): C. 46.51; H. 3.02; N. 7.73. IR bands (KBr, ν/cm−1): ν(C=N) 1529; ν(C=C) 1405; ν(CSS) 991; ν(C–S) 759; δ(Py) 694. 1H NMR (DMSO–d6, ppm): 10.39 (s, 2H, Py), 8.16–7.79 (m, 13H, Ar and Py), 7.46–7.37 (m, 1H, Ar), 7.37–7.26 (m, 4H, Ar), 7.26–7.15 (m, 1H, Ar), 4.10 (s, 2H, –CH2). 19F NMR (D2O, ppm): −62.33 (s, CF3). UV–vis (MeOH): λmax = 257 nm and 454 nm. UV–vis (DMF): λmax = 455 nm. ESI–MS [M+H]+ (calcd, found, m/z) = 537.9833/537.9813.

3.8. Crystal Structure Determination

The X-ray data collection was performed on a Bruker CCD SMART APEX II single-crystal diffractometer with Mo Kα radiation (0.71073 Å) at room temperature (296 K). The collected data were processed with SAINT [52], and SADABS [53] was used for absorption correction. The structures were solved with direct methods using the SHELXS program [54], and the positions of the nonhydrogen atoms were determined with subsequent Fourier difference map analyses. The refinement was accomplished with SHELXL–2018 using least squares minimization [55]. The Olex2 program [56] was used for the solution and refinement of the structures. Molecular graphics were generated via MERCURY 2024.2.0 software [57]. Table S9 summarizes the crystal data, experimental details, and refinement results.

3.9. Hirshfeld Surface

The Hirshfeld surfaces (HS) and the 2D fingerprint plots (FP) of the complexes (14) were generated using the software CrystalExplorer 21.5 [35]. The crystallographic information files (CIFs) obtained from the single-crystal X-ray diffraction analysis were used as input files. The normalized contact distance (dnorm) is defined in terms of functions of distance di and de and the van der Waals radii of the atoms. Once the surface has been calculated and the distance between the nearest nucleus inside the surface (di) and the nearest nucleus outside the surface (de) is lower, closer, or bigger than the sum of the van der Waals radii of them, the surface will indicate the presence or absence of contacts. Two-dimensional fingerprint plots were obtained with the combination of di and de distances, on the scale of 0.4 to 2.6 Å, to summarize the contacts present in the crystal structure of the complexes.

3.10. Anticancer Activity

3.10.1. Cell Culture

The cytotoxic activity of the synthesized compounds was evaluated against human cell lines, including breast cancer (MCF–7), cisplatin-resistant ovarian cancer (A2780cis), lung cancer (A549), and nontumor lung cells (MRC–5). The A549 and MRC-5 cell lines were cultured in Dulbecco’s Modified Eagle’s Medium (DMEM), while the MCF-7 and A2780cis cell lines were cultured in Roswell Park Memorial Institute (RPMI–1640). Both cultures were supplemented with 10% fetal bovine serum (FBS), penicillin (100 IU/mL), streptomycin (100 mg/mL), and L-glutamine (2 mM). The cells were grown as monolayers in disposable 25 cm2 flasks and incubated at 37 °C in a humidified atmosphere containing 5% CO2.

3.10.2. Cell Viability Analysis

The cytotoxicity activity of the compounds was assessed using a colorimetric MTT (3-(4,5-dimethylthiazol-2-yl)-2,5-diphenyltetrazolium bromide) assay [48]. The cells were trypsinized, counted, and adjusted to the appropriate concentration and were seeded into 96-well plates at a density of 1.5 × 10⁴ cells/well. The plates were incubated at 37 °C in a 5% CO2 atmosphere for 24 h to allow cell adhesion. Subsequently, the compounds, solubilized in dimethyl sulfoxide (DMSO) at varying concentrations (200—1.56 µM), were added to the wells, and the plates were incubated for 48 h. Cells treated with 0.5% DMSO served as the control. After the 48-h treatment period, 50 µL of MTT solution (0.6 mg/mL in phosphate-buffered saline, PBS) was added to each well, followed by incubation for 4 h. The formazan crystals formed from the wells were separated from the solution and then solubilized by the addition of 100 µL of DMSO per well. The absorbance was measured at 570 nm using a Varioskan LUX Multimode Microplate Reader (VL000D0, Waltham, MA 02451, USA). All experiments were performed in triplicate. The half-maximal inhibitory concentration (IC50) values were determined from dose–response curves using GraphPad Prism version 8 software [48].

4. Conclusions

Four new Ni(II) complexes with thiosemicarbazone and dithiocarbazate were successfully synthesized. The crystal structures were elucidated through single-crystal X-ray diffraction, which was consistent with the data obtained from spectroscopic and spectrometric analyses. All complexes exhibited a square planar geometry, with the ligands displaying double deprotonation and coordinated by tridentate mode through an ONS donor system. The coordination sphere was completed by a triphenylphosphine or pyridine coligand. Hirshfeld surface analysis was employed to estimate the topography of intermolecular interactions, while fingerprint plots provided quantitative insights into the most significant contributions to the crystal packing, primarily attributed to H⋯H and C⋯H interactions across all complexes. Biological assays show interesting results, particularly for the compounds containing pyridine as a substituent in their coordination sphere. Complex (2) exhibits potent cytotoxicity against breast and ovarian cancer cell lines compared to cisplatin; however, its lack of selectivity for nontumor cells raises concerns about its therapeutic potential. In contrast, complex (4) demonstrates a more promising profile, with moderate tumor cell inhibition and no observable toxicity to normal cells at concentrations up to 100 μM, highlighting the importance of balancing efficacy and selectivity in the development of cancer treatments.

Supplementary Materials

The following supporting information can be downloaded at: https://www.mdpi.com/article/10.3390/molecules30173516/s1. Supplementary tables, figures, NMR, UV-vis, ESI(+)-MS, and IR spectra are as detailed in the text (PDF). Crystallographic data are in CIF files.

Author Contributions

G.S.P.: conceptualization; data curation; formal analysis; investigation; methodology; resources; validation. M.P.V.: conceptualization; data curation; formal analysis; investigation; methodology; resources; validation. K.M.O.: conceptualization; data curation; formal analysis; investigation; methodology; resources; validation. C.C.G.: conceptualization; data curation; formal analysis; funding acquisition; investigation; methodology; project administration; resources; software; supervision; validation. All authors have read and agreed to the published version of the manuscript.

Funding

This work was supported by FAPDF (process: 00193-00001849/2023-49 and 00193-00000837/2024-88), CNPq (PQ process: 305038/2022-2), CAPES, and UnB. The authors thank the funding foundations FAPDF, CNPq, CAPES, FINEP, and UnB for providing the equipment, reagents, and scholarships.

Institutional Review Board Statement

Not applicable.

Informed Consent Statement

Not applicable.

Data Availability Statement

The datasets generated for this study can be found in the Supplementary Materials.

Acknowledgments

All funding agencies are acknowledged for their financial support.

Conflicts of Interest

The authors declare that there were no conflicts of interest regarding the publication of this manuscript.

References

  1. Edwards, I.R.; Aronson, J.K. Adverse Drug Reactions: Definitions, Diagnosis, and Management. Lancet 2000, 356, 1255–1259. [Google Scholar] [CrossRef]
  2. Due, A. What Are Side Effects? Eur. J. Philos. Sci. 2023, 13, 16. [Google Scholar] [CrossRef] [PubMed]
  3. Martinez, A.; Hemmert, C.; Loup, C.; Barré, G.; Meunier, B. Synthesis of New Macrocyclic Chiral Manganese(III) Schiff Bases as Catalysts for Asymmetric Epoxidation. J. Org. Chem. 2006, 71, 1449–1457. [Google Scholar] [CrossRef] [PubMed]
  4. Berhanu, A.L.; Gaurav; Mohiuddin, I.; Malik, A.K.; Aulakh, J.S.; Kumar, V.; Kim, K.-H. A Review of the Applications of Schiff Bases as Optical Chemical Sensors. TrAC Trends Anal. Chem. 2019, 116, 74–91. [Google Scholar] [CrossRef]
  5. Catalano, A.; Sinicropi, M.S.; Iacopetta, D.; Ceramella, J.; Mariconda, A.; Rosano, C.; Scali, E.; Saturnino, C.; Longo, P. A Review on the Advancements in the Field of Metal Complexes with Schiff Bases as Antiproliferative Agents. Appl. Sci. 2021, 11, 6027. [Google Scholar] [CrossRef]
  6. Ceramella, J.; Iacopetta, D.; Catalano, A.; Cirillo, F.; Lappano, R.; Sinicropi, M.S. A Review on the Antimicrobial Activity of Schiff Bases: Data Collection and Recent Studies. Antibiotics 2022, 11, 191. [Google Scholar] [CrossRef]
  7. Ejidike, I.P.; Ajibade, P.A. Transition Metal Complexes of Symmetrical and Asymmetrical Schiff Bases as Antibacterial, Antifungal, Antioxidant, and Anticancer Agents: Progress and Prospects. Rev. Inorg. Chem. 2015, 35, 191–224. [Google Scholar] [CrossRef]
  8. Hu, W.; Zhou, W.; Xia, C.; Wen, X. Synthesis and Anticancer Activity of Thiosemicarbazones. Bioorg. Med. Chem. Lett. 2006, 16, 2213–2218. [Google Scholar] [CrossRef]
  9. Heffeter, P.; Pape, V.F.S.; Enyedy, É.A.; Keppler, B.K.; Szakacs, G.; Kowol, C.R. Anticancer Thiosemicarbazones: Chemical Properties, Interaction with Iron Metabolism, and Resistance Development. Antioxid. Redox Signal. 2019, 30, 1062–1082. [Google Scholar] [CrossRef]
  10. Singh, N.K.; Kumbhar, A.A.; Pokharel, Y.R.; Yadav, P.N. Anticancer Potency of Copper(II) Complexes of Thiosemicarbazones. J. Inorg. Biochem. 2020, 210, 111134. [Google Scholar] [CrossRef]
  11. Chang, E.L.; Simmers, C.; Knight, D.A. Cobalt Complexes as Antiviral and Antibacterial Agents. Pharmaceuticals 2010, 3, 1711–1728. [Google Scholar] [CrossRef]
  12. de Andrade Danin Barbosa, G.; Palermo de Aguiar, A. Synthesis of 1,3,4-Thiadiazole Derivatives and Microbiological Activities: A Review. Rev. Virtual Química 2019, 11, 806–848. [Google Scholar] [CrossRef]
  13. Gou, Y.; Chen, M.; Li, S.; Deng, J.; Li, J.; Fang, G.; Yang, F.; Huang, G. Dithiocarbazate-Copper Complexes for Bioimaging and Treatment of Pancreatic Cancer. J. Med. Chem. 2021, 64, 5485–5499. [Google Scholar] [CrossRef]
  14. Gou, Y.; Jia, X.; Hou, L.X.; Deng, J.G.; Huang, G.J.; Jiang, H.W.; Yang, F. Dithiocarbazate–Fe III, –Co III, –Ni II, and –Zn II Complexes: Design, Synthesis, Structure, and Anticancer Evaluation. J. Med. Chem. 2022, 65, 6677–6689. [Google Scholar] [CrossRef]
  15. Leite, T.S.O.; Magalhães, I.O.M.; Machado, D.F.S.; Martins, J.B.L.; Gatto, C.C. Experimental and Theoretical Investigation of New Mono and Binuclear Cu(II) and Zn(II) Complexes with Dithiocarbazate Ligand. Struct. Chem. 2025, 1–20. [Google Scholar] [CrossRef]
  16. Nanjundan, N.; Selvakumar, P.; Narayanasamy, R.; Haque, R.A.; Velmurugan, K.; Nandhakumar, R.; Silambarasan, T.; Dhandapani, R. Synthesis, Structure, DNA/BSA Interaction and in Vitro Cytotoxic Activity of Nickel(II) Complexes Derived from S-Allyldithiocarbazate. J. Photochem. Photobiol. B Biol. 2014, 141, 176–185. [Google Scholar] [CrossRef] [PubMed]
  17. Cavalcante, C.d.Q.O.; da Mota, T.H.A.; de Oliveira, D.M.; Nascimento, É.C.M.; Martins, J.B.L.; Pittella-Silva, F.; Gatto, C.C. Dithiocarbazate Ligands and Their Ni(II) Complexes with Potential Biological Activity: Structural, Antitumor and Molecular Docking Study. Front. Mol. Biosci. 2023, 10, 6677–6689. [Google Scholar] [CrossRef]
  18. Gatto, C.C.; Cavalcante, C.d.Q.O.; Lima, F.C.; Nascimento, É.C.M.; Martins, J.B.L.; Santana, B.L.O.; Gualberto, A.C.M.; Pittella-Silva, F. Structural Design, Anticancer Evaluation, and Molecular Docking of Newly Synthesized Ni(II) Complexes with ONS-Donor Dithiocarbazate Ligands. Molecules 2024, 29, 2759. [Google Scholar] [CrossRef]
  19. Abd El-Lateef, H.M.; Khalaf, M.M.; Gouda, M.; Amer, A.A.; Abdelhamid, A.A.; Abdou, A. Synthesis, Characterization, and Therapeutic Potential of Novel Schiff Base Metal Complexes: Nickel(II) and Copper(II) Complexes Based 2-[(2-Chloroquinolin-3-yl)Methylidene]Aminobenzenethiol (CQAT). Appl. Organomet. Chem. 2025, 39, e7843. [Google Scholar] [CrossRef]
  20. Özbağcı, D.İ.; Erdağı, S.İ.; Aydın, İ.; Aydın, R.; Arı, F.; Zorlu, Y. Crystal Structures and Biological Profiles of Novel Tridentate Schiff Bases Nickel (II) Complexes. Appl. Organomet. Chem. 2025, 39, e7860. [Google Scholar] [CrossRef]
  21. Tewari, B.B. Metal Complexes in Biology and Medicine (Part- Mercury(II) / Nickel(II) /Lead(II)–Isoleucine). In Novel Aspects on Chemistry and Biochemistry; Mohamadpour, D.F., Ed.; B P International (a part of SCIENCEDOMAIN International): Kolkata, India, 2023; Volume 3, pp. 111–127. ISBN 9788119315451. [Google Scholar]
  22. Kumar, B.; Devi, J.; Dubey, A.; Tufail, A.; Antil, N. Biological and Computational Investigation of Transition Metal(II) Complexes of 2-Phenoxyaniline-Based Ligands. Future Med. Chem. 2023, 15, 1919–1942. [Google Scholar] [CrossRef] [PubMed]
  23. Kumar, S.; Choudhary, M. An In Silico Design of Antivirus Nickel (II) Complexes as Therapeutic Drug Candidates. Indian J. Chem. 2023, 62, 586–599. [Google Scholar] [CrossRef]
  24. Ma, B.N.; Baecker, D.; Descher, H.; Brandstaetter, P.; Hermann, M.; Kircher, B.; Gust, R. Synthesis and Biological Evaluation of Salophen Nickel(II) and Cobalt(III) Complexes as Potential Anticancer Compounds. Arch. Pharm. 2023, 356, 2200655. [Google Scholar] [CrossRef]
  25. Abula, A.; Xu, Z.; Zhu, Z.; Peng, C.; Chen, Z.; Zhu, W.; Aisa, H.A. Substitution Effect of the Trifluoromethyl Group on the Bioactivity in Medicinal Chemistry: Statistical Analysis and Energy Calculations. J. Chem. Inf. Model. 2020, 60, 6242–6250. [Google Scholar] [CrossRef]
  26. Novás, M.; Matos, M.J. The Role of Trifluoromethyl and Trifluoromethoxy Groups in Medicinal Chemistry: Implications for Drug Design. Molecules 2025, 30, 3009. [Google Scholar] [CrossRef]
  27. Almeida, C.M.; Nascimento, É.C.M.; Martins, J.B.L.; da Mota, T.H.A.; de Oliveira, D.M.; Gatto, C.C. Crystal Design, Antitumor Activity and Molecular Docking of Novel Palladium(II) and Gold(III) Complexes with a Thiosemicarbazone Ligand. Int. J. Mol. Sci. 2023, 24, 11442. [Google Scholar] [CrossRef]
  28. Almeida, C.M.; Marcon, P.H.S.; Nascimento, É.C.M.; Martins, J.B.L.; Chagas, M.A.S.; Fujimori, M.; De Marchi, P.G.F.; França, E.L.; Honorio-França, A.C.; Gatto, C.C. Organometallic Gold (III) and Platinum (II) Complexes with Thiosemicarbazone: Structural Behavior, Anticancer Activity, and Molecular Docking. Appl. Organomet. Chem. 2022, 36, e6761. [Google Scholar] [CrossRef]
  29. Okuniewski, A.; Rosiak, D.; Chojnacki, J.; Becker, B. Coordination Polymers and Molecular Structures among Complexes of Mercury(II) Halides with Selected 1-Benzoylthioureas. Polyhedron 2015, 90, 47–57. [Google Scholar] [CrossRef]
  30. Lima, F.C.; Só, Y.A.O.; Gargano, R.; de Oliveira, D.M.; Gatto, C.C. Structural, Theoretical and Biological Activity of Mono and Binuclear Nickel(II) Complexes with Symmetrical and Asymmetrical 4,6-Diacetylresorcinol-Dithiocarbazate Ligands. J. Inorg. Biochem. 2021, 224, 111559. [Google Scholar] [CrossRef] [PubMed]
  31. Datta, S.; Seth, D.K.; Gangopadhyay, S.; Karmakar, P.; Bhattacharya, S. Nickel Complexes of Some Thiosemicarbazones: Synthesis, Structure, Catalytic Properties and Cytotoxicity Studies. Inorganica Chim. Acta 2012, 392, 118–130. [Google Scholar] [CrossRef]
  32. De Sousa, G.F.; Marques, D.R.; Resck, I.S.; Sabino, J.R. Synthesis and Crystal Structures of the Five-Coordinate Diorganotin(IV) Complex [Ph2Sn(L)]·DMF and Its 5-Hydroxypyrazoline Ligand (H2L). J. Chem. Crystallogr. 2011, 41, 528–532. [Google Scholar] [CrossRef]
  33. Ali, M.A.; Mirza, A.H.; Butcher, R.J.; Chowdhury, A.K. Synthesis, Spectroscopy, and X-Ray Crystal Structures of Copper(II) Complexes of the Tridentate ONS Ligand Formed by Condensation of 4,4,4-Trifluoro-1-(2-Thienyl)-2,4-Butanedione with S-Benzyldithiocarbazate. Transit. Met. Chem. 2011, 36, 471–479. [Google Scholar] [CrossRef]
  34. McKinnon, J.J.; Spackman, M.A.; Mitchell, A.S. Novel Tools for Visualizing and Exploring Intermolecular Interactions in Molecular Crystals. Struct. Sci. 2004, 60, 627–668. [Google Scholar] [CrossRef]
  35. Spackman, P.R.; Turner, M.J.; McKinnon, J.J.; Wolff, S.K.; Grimwood, D.J.; Jayatilaka, D.; Spackman, M.A. CrystalExplorer: A Program for Hirshfeld Surface Analysis, Visualization and Quantitative Analysis of Molecular Crystals. J. Appl. Crystallogr. 2021, 54, 1006–1011. [Google Scholar] [CrossRef]
  36. Lakshmanan, P.; Gayathri, E.; Thirumaran, S.; Ciattini, S. Synthesis, Crystal Structure, DFT and Hirshfeld Surface Analysis of Ni(II) Complexes: Precursor for Nickel Sulfide Nanoparticles. J. Mol. Struct. 2023, 1273, 134306. [Google Scholar] [CrossRef]
  37. Hussain Dar, S.; Hasan, N.; Rana, M.; Fatima, A.; Noorul Sabah Andrabi, S.; Ahmedi, S.; Manzoor, N.; Javed, S.; Rahisuddin. Synthesis and Spectral Studies of Ni(II) Complexes Involving Functionalized Dithiocarbamates and Triphenylphosphine: X-Ray Crystal Structure, Thermal Stability, Hirshfeld Surface Analysis, DFT and Biological Evaluation. Inorganica Chim. Acta 2023, 545, 121271. [Google Scholar] [CrossRef]
  38. Almeida, C.M.; de Carvalho, J.G.M.; Fujimori, M.; França, E.L.; Honorio-França, A.C.; Parreira, R.L.T.; Orenha, R.P.; Gatto, C.C. Structural Investigation of Group 10 Metal Complexes with Thiosemicarbazone: Crystal Structure, Mass Spectrometry, Hirshfeld Surface and in Vitro Antitumor Activity. Struct. Chem. 2020, 31, 2093–2103. [Google Scholar] [CrossRef]
  39. Lima, D.J.B.; Almeida, R.G.; Jardim, G.A.M.; Barbosa, B.P.A.; Santos, A.C.C.; Valença, W.O.; Scheide, M.R.; Gatto, C.C.; de Carvalho, G.G.C.; Costa, P.M.S.; et al. It Takes Two to Tango: Synthesis of Cytotoxic Quinones Containing Two Redox Active Centers with Potential Antitumor Activity. RSC Med. Chem. 2021, 12, 1709–1721. [Google Scholar] [CrossRef]
  40. Leovac, V.M.; Češljević, V.I.; Nešić, S.M. Transition Metal Complexes with the Thiosemicarbazide-based Ligands. XII. Complexes of Nickel(II) with Benzoylacetone S-methylisothiosemicarbazone and N(1)-2-butylidene-4-oxo-4-phenyl-N(4)-salicylidene-S-methylisothiosemicarbazide. Zeitschrift für Anorg. und Allg. Chemie 1991, 592, 217–223. [Google Scholar] [CrossRef]
  41. Almeida, C.M.; Nascimento, G.P.; Magalhães, K.G.; Iglesias, B.A.; Gatto, C.C. Crystal Structures, DNA-Binding Ability and Influence on Cellular Viability of Gold(I) Complexes of Thiosemicarbazones. J. Coord. Chem. 2018, 71, 502–519. [Google Scholar] [CrossRef]
  42. Cavalcante, C.D.Q.O.; Arcanjo, D.D.S.; Silva, G.G.D.; Oliveira, D.M.D.; Gatto, C.C. Solution and Solid Behavior of Mono and Binuclear Zinc(Ii) and Nickel(Ii) Complexes with Dithiocarbazates: X-Ray Analysis, Mass Spectrometry and Cytotoxicity against Cancer Cell Lines. New J. Chem. 2019, 43, 11209–11221. [Google Scholar] [CrossRef]
  43. Lima, F.C.; Silva, T.S.; Martins, C.H.G.; Gatto, C.C. Synthesis, Crystal Structures and Antimicrobial Activity of Dimeric Copper(II) Complexes with 2-Hydroxyphenyl-Ethylidene-Dithiocarbazates. Inorganica Chim. Acta 2018, 483, 464–472. [Google Scholar] [CrossRef]
  44. Haas, A.; Lieb, M.; Schelvis, M. Trifluoromethyl-Substituted Heteroolefins (Schiffs Bases): Syntheses and Chemical Properties. J. Fluor. Chem. 1997, 83, 133–143. [Google Scholar] [CrossRef]
  45. Colmenares, L.U.; Liu, R.S.H. 1H NMR and 19F NMR Chemical Shifts of Fluorinated Retinals, Schiff Bases and Protonated Schiff Bases. Magn. Reson. Chem. 1992, 30, 490–496. [Google Scholar] [CrossRef]
  46. Gokulnath, G.; Manikandan, R.; Anitha, P.; Umarani, C. Synthesis, characterization and antibacterial studies of CO(II), NI(II) and CU(II) complexes containing triphenylphosphine and schiff base ligand based on salicylaldehyde. Rasayan J. Chem. 2022, 14, 2692–2697. [Google Scholar] [CrossRef]
  47. Muthu Tamizh, M.; Mereiter, K.; Kirchner, K.; Ramachandra Bhat, B.; Karvembu, R. Synthesis, Crystal Structures and Spectral Studies of Square Planar Nickel(II) Complexes Containing an ONS Donor Schiff Base and Triphenylphosphine. Polyhedron 2009, 28, 2157–2164. [Google Scholar] [CrossRef]
  48. Mosmann, T. Rapid Colorimetric Assay for Cellular Growth and Survival: Application to Proliferation and Cytotoxicity Assays. J. Immunol. Methods 1983, 65, 55–63. [Google Scholar] [CrossRef]
  49. Jiang, C.; Shen, C.; Ni, M.; Huang, L.; Hu, H.; Dai, Q.; Zhao, H.; Zhu, Z. Molecular Mechanisms of Cisplatin Resistance in Ovarian Cancer. Genes Dis. 2024, 11, 101063. [Google Scholar] [CrossRef] [PubMed]
  50. West, D.X.; Ives, J.S.; Bain, G.A.; Liberta, A.E.; Valdés-Martínez, J.; Ebert, K.H.; Hernández-Ortega, S. Copper(II) and Nickel(II) Complexes of 2,3-Butanedione Bis(N(3)-Substituted Thiosemicarbazones). Polyhedron 1997, 16, 1895–1905. [Google Scholar] [CrossRef]
  51. Akbar Ali, M.; Tarafdar, M.T.H. Metal Complexes of Sulphur and Nitrogen-Containing Ligands: Complexes of s-Benzyldithiocarbazate and a Schiff Base Formed by Its Condensation with Pyridine-2-Carboxaldehyde. J. Inorg. Nucl. Chem. 1977, 39, 1785–1791. [Google Scholar] [CrossRef]
  52. SMART and SAINT. Area Detector Control Integration Software; Bruker AXS: Karlsruhe, Germany, 1999. [Google Scholar]
  53. Sheldrick, G.M. SADABS, Program for Empirical Absorption Correction of Area Detector Data; University of Göttingen: Göttingen, Germany, 1997. [Google Scholar]
  54. Sheldrick, G.M. A Short History of SHELX. Acta Crystallogr. Sect. A 2008, 64, 112–122. [Google Scholar] [CrossRef]
  55. Sheldrick, G.M. Crystal Structure Refinement with SHELXL. Acta Crystallogr. Sect. C 2015, 71, 3–8. [Google Scholar] [CrossRef] [PubMed]
  56. Dolomanov, O.V.; Bourhis, L.J.; Gildea, R.J.; Howard, J.A.K.; Puschmann, H. OLEX2: A Complete Structure Solution, Refinement and Analysis Program. J. Appl. Crystallogr. 2009, 42, 339–341. [Google Scholar] [CrossRef]
  57. MacRae, C.F.; Sovago, I.; Cottrell, S.J.; Galek, P.T.A.; McCabe, P.; Pidcock, E.; Platings, M.; Shields, G.P.; Stevens, J.S.; Towler, M.; et al. Mercury 4.0: From Visualization to Analysis, Design and Prediction. J. Appl. Crystallogr. 2020, 53, 226–235. [Google Scholar] [CrossRef] [PubMed]
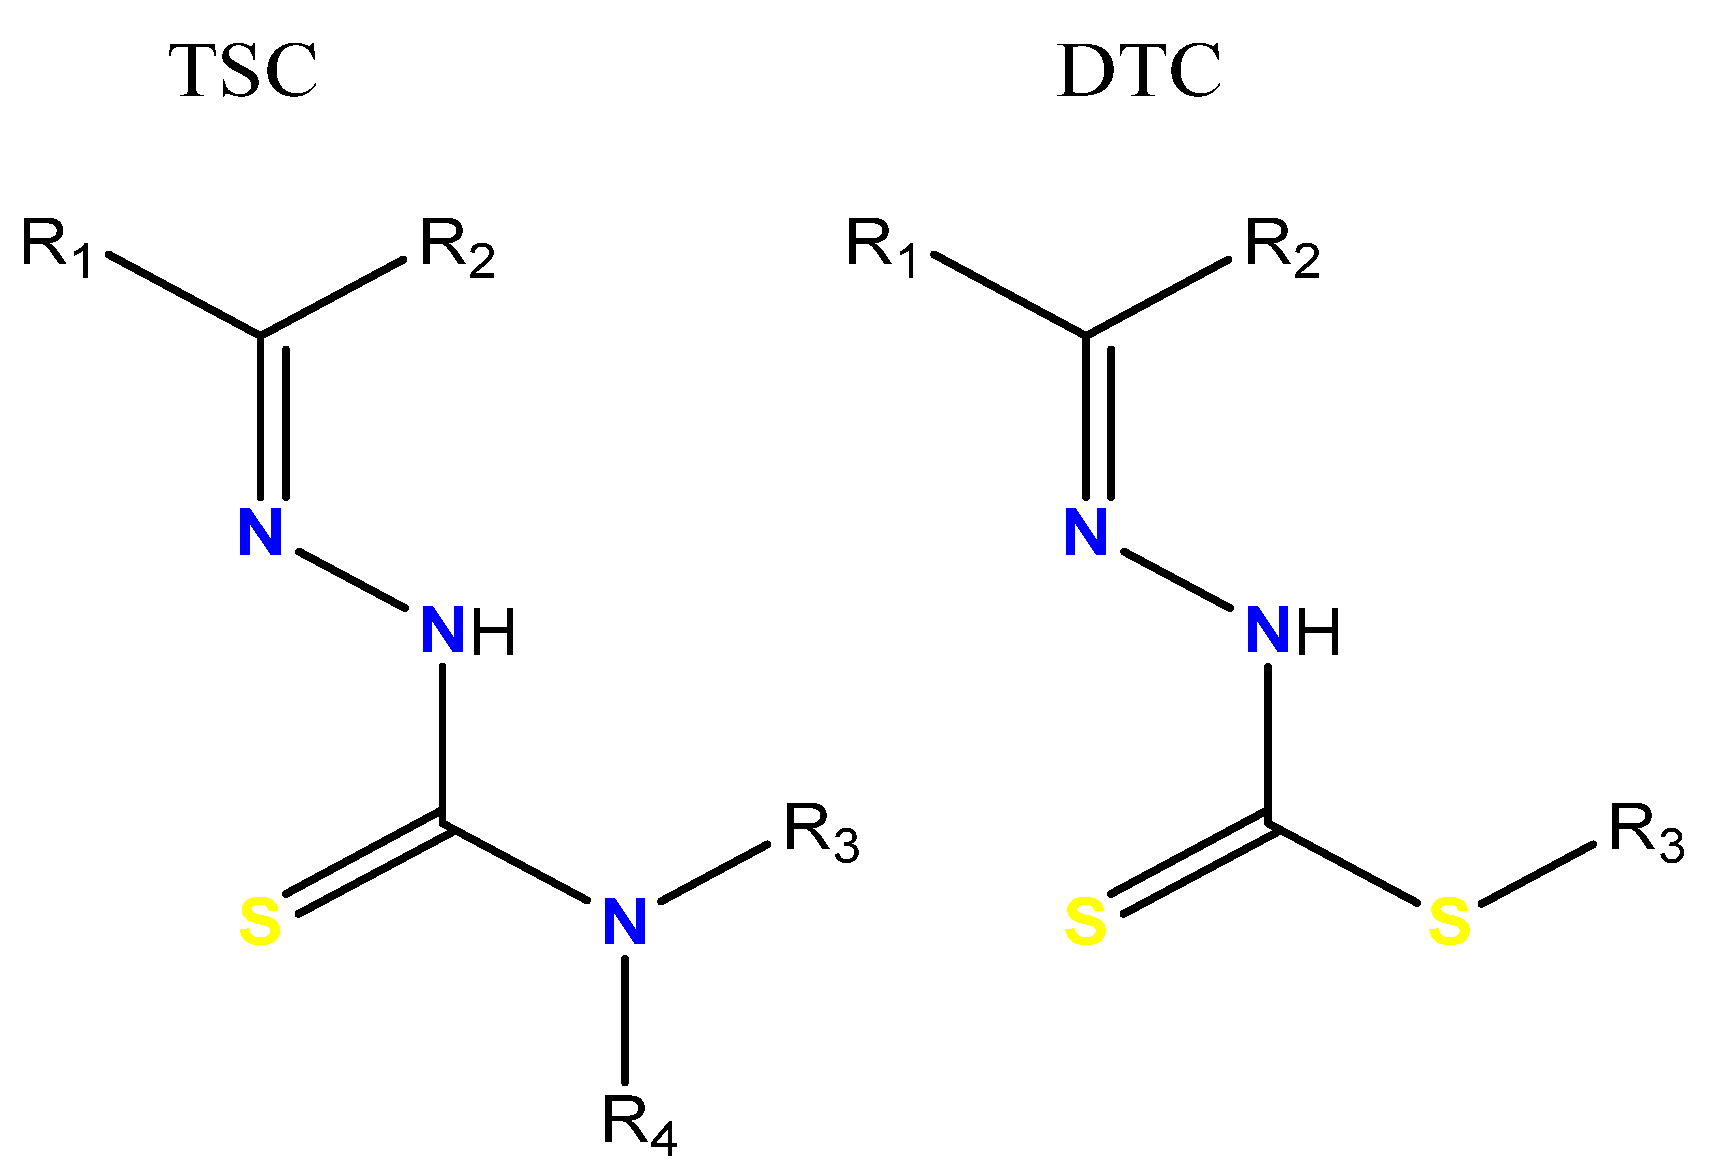
Figure 1. General structures of a thiosemicarbazone (TSC) and a dithiocarbazate (DTC); R = alkyl or aryl groups.
Molecules 30 03516 g001
Figure 2. Synthesis of the complexes (14) obtained from the reactions between Ni(II), coligands (PPh3 or Py), and the ligands H2L1 and H2L2.
Molecules 30 03516 g002
Figure 3. Molecular structures of the complexes (14) with crystallographic labeling. Thermal ellipsoids with 30% probability.
Molecules 30 03516 g003
Figure 4. Hirshfeld surface in the dnorm function and a full two-dimensional fingerprint plot showing the non-covalent interactions for the complexes (14).
Molecules 30 03516 g004
Figure 5. Percentage contribution of close contacts of the complexes (14).
Molecules 30 03516 g005
Figure 6. ESI(+)–MS/MS spectrum of the complex (1).
Molecules 30 03516 g006
Figure 7. ESI(+)–MS/MS spectrum of the complex (4).
Molecules 30 03516 g007
Figure 8. Evaluation of cytotoxic effects by MTT assay in 48 h. DMSO at 0.5% did not affect the cell viability of the cell lines.
Molecules 30 03516 g008
Table 1. Selected bond lengths (Å) and bond angles (°) for the complexes (14).
Bond Lengths (Å)
(1)(2)(3)(4)
C5–O11.295(4)1.280(11)1.297(4)1.299(7)
C7–N11.324(4)1.312(10)1.321(5)1.325(7)
N1–N21.392(3)1.408(10)1.396(4)1.406(5)
N2–C91.293(4)1.309(11)1.291(5)1.292(7)
C9–S21.732(3)1.745(9)1.732(4)1.735(6)
Ni1–O11.841(2)1.857(6)1.849(3)1.835(4)
Ni1–N11.898(3)1.863(7)1.874(3)1.859(4)
Ni1–S22.112(10)2.143(3)2.137(12)2.128(16)
Ni1–PPh32.204(10)2.210(12)
Ni–Py1.919(8)1.903(5)
Bond Angles (°)
(1)(2)(3)(4)
N1–Ni1–S287.28(8)86.7(2)87.46(10)88.04(14)
O1–Ni1–N195.98(10)95.6(3)93.99(13)95.82(19)
O1–Ni–S2175.94(8)177.6(19)174.23(10)175.39(14)
O1–Ni1–PPh385.87(7)86.50(9)
S2–Ni1–PPh390.85(4)92.24(5)
N1–Ni1–PPh3178.12(8)178.07(10)
O1–Ni1–Py86.7(3)86.11(18)
S2–Ni1–Py91.0(2)90.00(13)
N1–Ni1–Py174.6(3)177.96(19)
Table 2. Angular strain and strain (cm−1) frequencies of the normal vibration modes selected for H2L1, H2L2, and the complexes (14).
H2L1H2L2(1)(2)(3)(4)
ν(C=S)13071306
ν(C–S)728732746746746759
ν(N–N)10381064109710661095
ν(C=O)16511637
ν(C=N)15971544154415441544
ν(N–H)3333/3304319534013343
δ(Py)690694
ν(Ni–PPh3)692692
Table 3. Absorption values of the ligands and complexes (14).
π–π*Log εn–π*Log εLMCTLog ε
H2L1MeOH2844.094153.59
DMF2834.26431
H2L2MeOH262 and 2954.03 and 4.10445
DMF2944.19451
(1)MeOH230 and 2734.13 and 4.144413.88461 and 4903.87 and 3.79
DMF4454.36465 and 4984.34 and 4.25
(2)MeOH2574.243363.89462 and 4933.87 and 3.70
DMF2794.244464.15468 and 4974.13 and 4.04
(3)MeOH254 and 2754.18 and 4.164494.08
DMF4554.294884.10
(4)MeOH2574.183013.974544.10
DMF4554.354884.16
Table 4. 1H, 19F, and 31P NMR spectral data of the ligands H2L1 and H2L2 and the complexes (14).
Compound1H (ppm)19F (ppm)31P (ppm)
H2L111.72 (s, 1H, N–H), 10.19 (s, 1H, N–H), 8.12–8.10 (m, 1H, –CH), 8.10–8.08 (m, 1H, –CH), 7.53 (d, J = 7.20 Hz, 1H, Ar), 7.39 (dd, J = 7.40 and 7.20 Hz, 1H, Ar), 7.33 (dd, J = 3.89 and 3.74 Hz, 1H, Ar), 7.25 (t, J = 7.40 Hz, 1H, Ar), 4.67 (s, 2H, CH2)−67.57 (s, CF3)−6.50 (s, PPh3-free)
H2L213.20 (s, 1H, N–H), 8.10 (m, J = 4.92 Hz, 1H, –CH), 8.07 (m, J = 3.80 Hz, 1H, –CH), 7.42 (d, J = 7.50 Hz, 1H, Ar), 7.36–7.27 (m, 4H, Ar), 4.65 (s, 2H, –CH2), 4.46 (s, 2H, CH2)−68.40 (s, CF3)−6.50 (s, PPh3-free)
(1)9.40 (s, 1H, N–H), 7.78 (t, 6H, PPh3), 7.64–7.51 (m, 13H, Ar and PPh3), 7.20 (t, 2H, Ar), 6.92–6.89 (m, 1H, –CH), 6.87 (t, J = 7.35 Hz, 1H, Ar), 6.26 (s, 1H, –CH)−63.63 (s, CF3)22.92 (s, PPh3)
(2)9.40 (s, 1H, N–H), 9.06 (s, 2H, –CH Py), 8.04 (s, 1H, –CH Py), 7.72–7.51 (m, 6H, Ar and Py), 7.21 (t, J = 7.31 Hz, 2H, Ar), 7.14–7.07 (m, 1H, –CH), 6.88 (t, J = 7.31 Hz, 1H, Ar), 6.17 (s, 1H, –CH)−63.13 (s, CF3)
(3)7.80–7.65 (m, 6H, PPh3), 7.65–7.42 (m, 13H, Ar and PPh3), 7.34–7.29 (m, 4H, Ar), 7.29–7.22 (m, 1H, Ar), 4.33 (s, 2H, –CH2)−62.04 (s, CF3)22.30 (s, PPh3)
(4)10.39 (s, 2H, Py), 8.16–7.79 (m, 13H, Ar and Py), 7.46–7.37 (m, 1H, Ar), 7.37–7.26 (m, 4H, Ar), 7.26–7.15 (m, 1H, Ar), 4.10 (s, 2H, –CH2)−62.33 (s, CF3)
Table 5. Cytotoxic activity of H2L1, H2L2, and the complexes (14). Results are presented as IC50 values (µM) ± SD in 48 h (values estimated by non-linear regression of data from viability assessment).
CompoundsIC50 (µM)
MCF-7A2780cisA549MRC-5
H2L1>100(42.78 ± 0.66)(51.38 ± 4.37)>100
H2L2>100(78.93 ± 1.96)>100>100
(1)>100>100>100>100
(2)(8.48 ± 1.37)(7.20 ± 0.73)(27.18 ± 2.91)(9.89 ± 0.17)
(3)>100>100>100>100
(4)(56.54 ± 1.52)(65.92 ± 3.52)>100>100
Cisplatin(13.98 ± 2.02)(37.03 ± 5.11)(11.54 ± 1.19)(29.09 ± 0.78)
Disclaimer/Publisher’s Note: The statements, opinions and data contained in all publications are solely those of the individual author(s) and contributor(s) and not of MDPI and/or the editor(s). MDPI and/or the editor(s) disclaim responsibility for any injury to people or property resulting from any ideas, methods, instructions or products referred to in the content.