
Geographical Origin Authentication of Leaves and Drupes from Olea europaea via 1H NMR and Excitation–Emission Fluorescence Spectroscopy: A Data Fusion Approach

 ,
,  , , , , , , and
Abstract

1. Introduction
2. Results and Discussion
2.1. Olive Leaves—1H NMR and EEM Fluorescence Spectroscopy—Single-Technique Approach
2.2. Drupes—1H NMR and EEM Fluorescence Spectroscopy—Single-Technique Approach
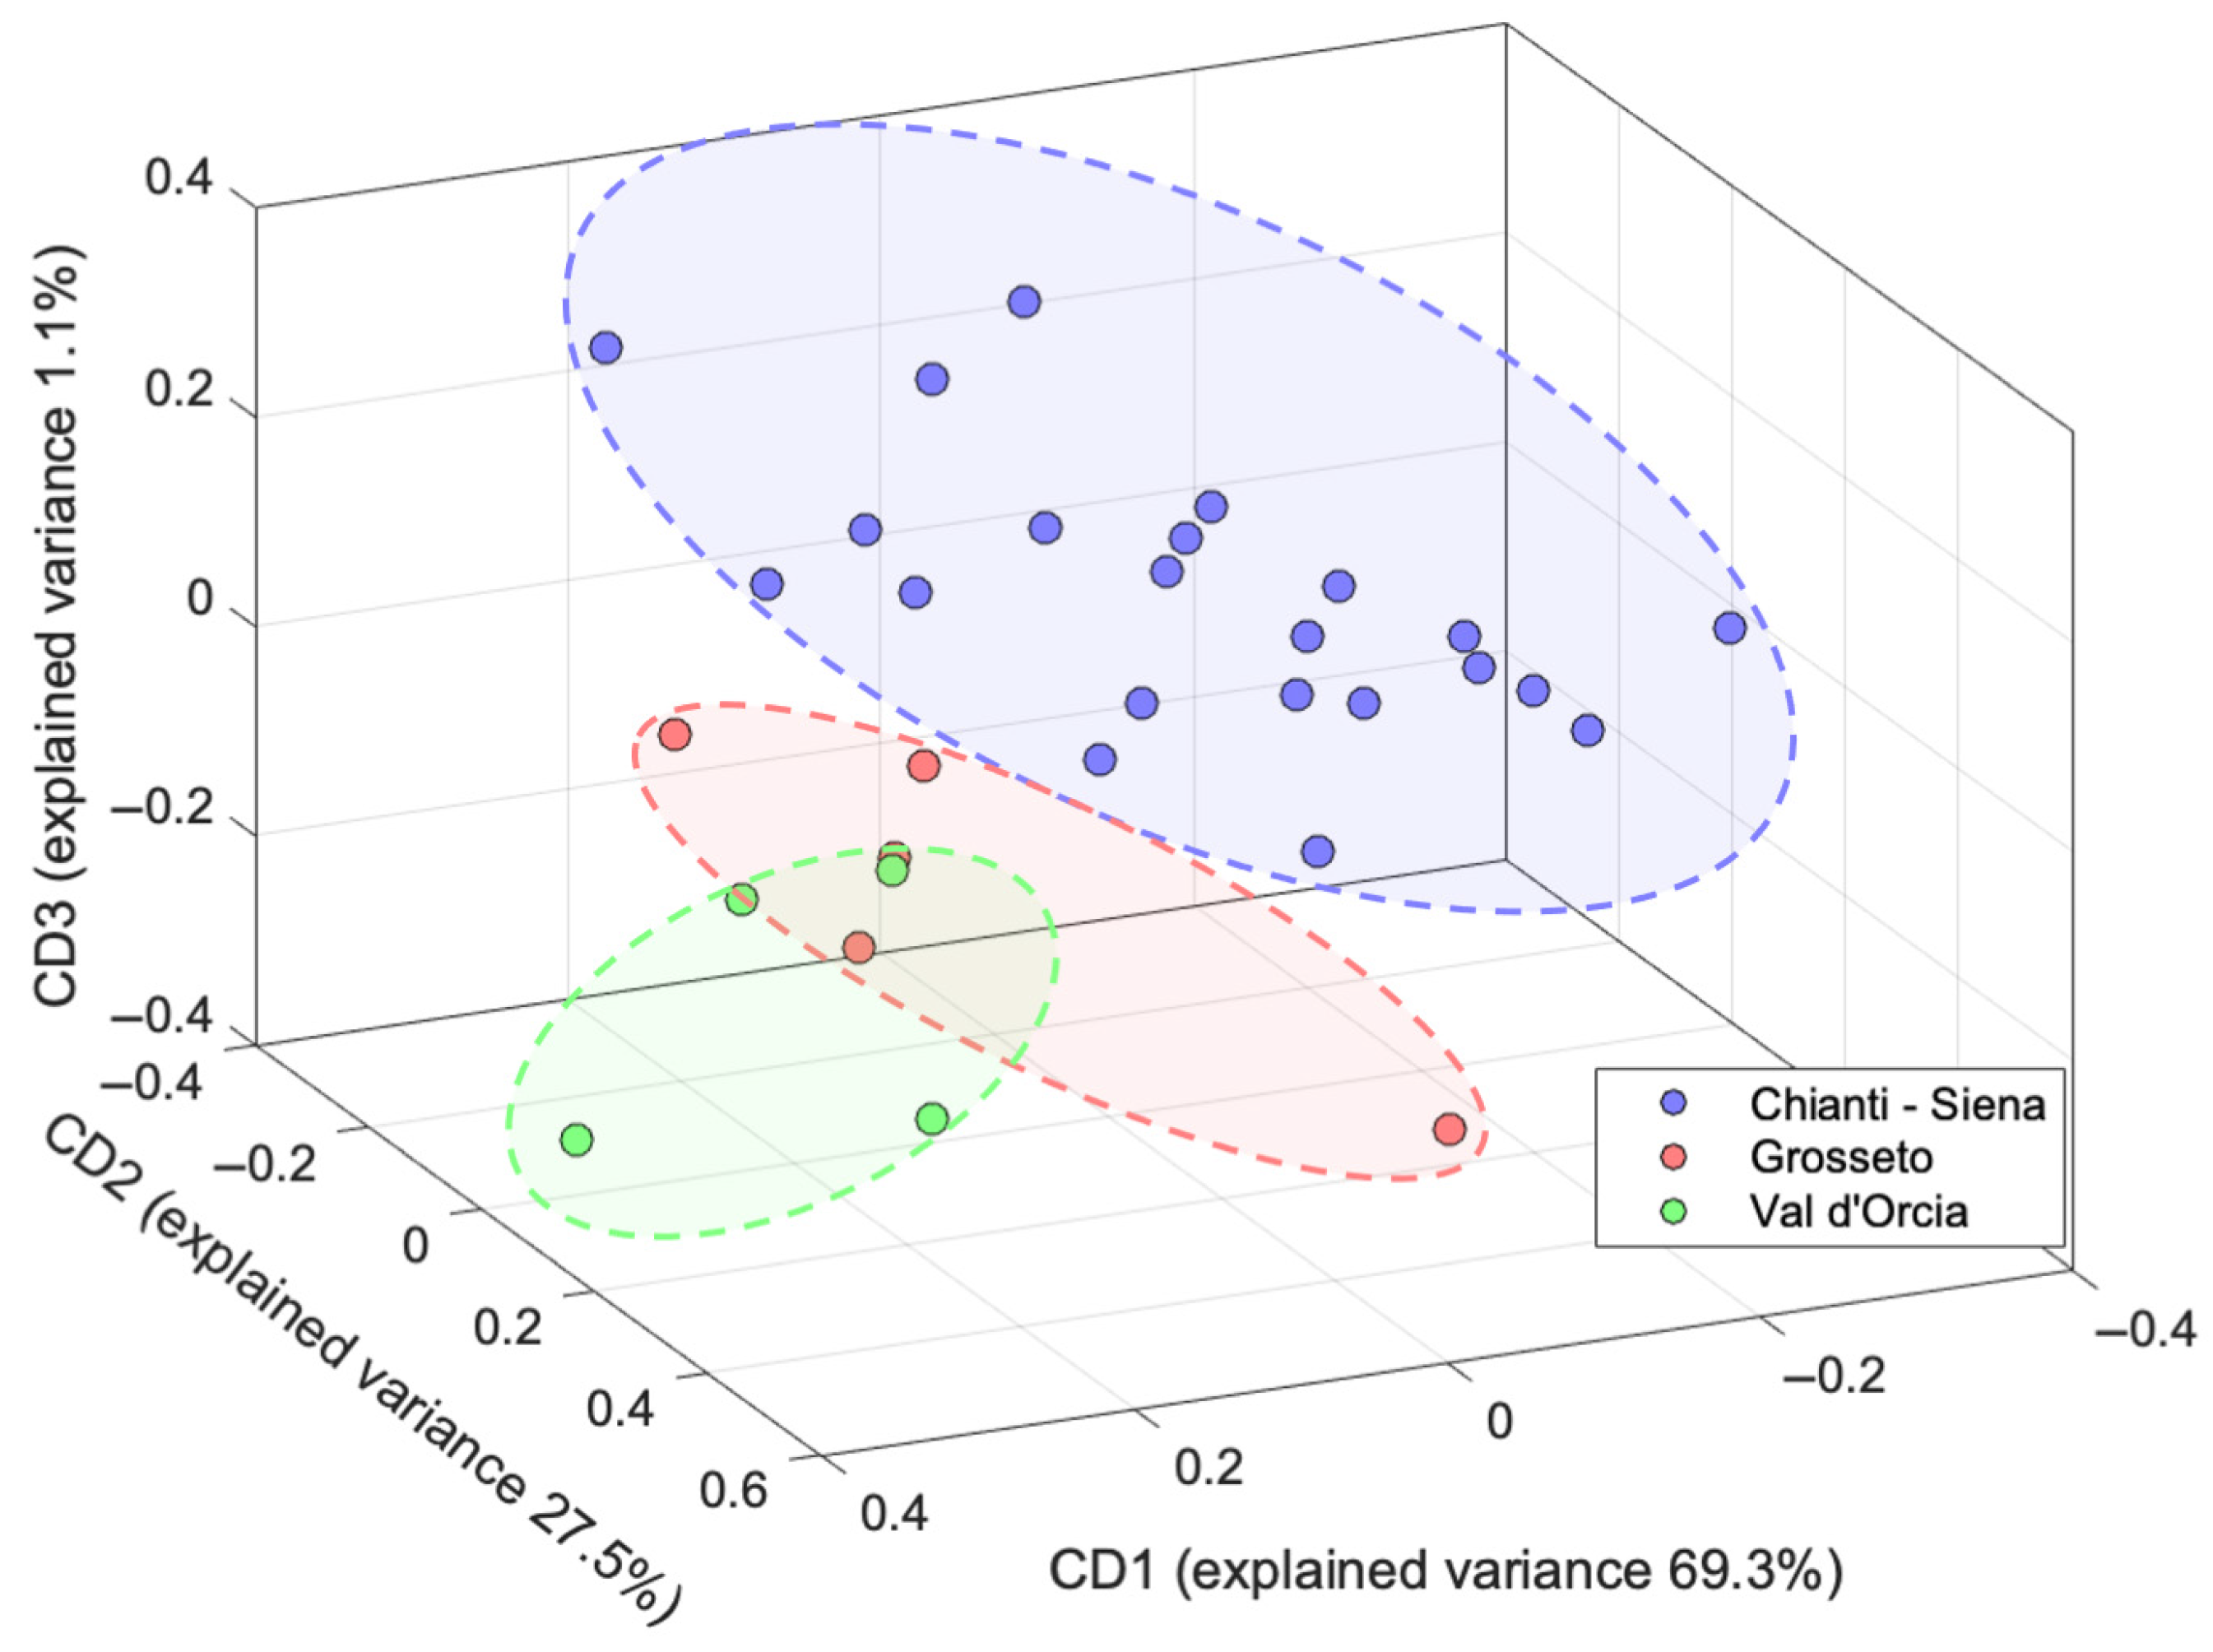
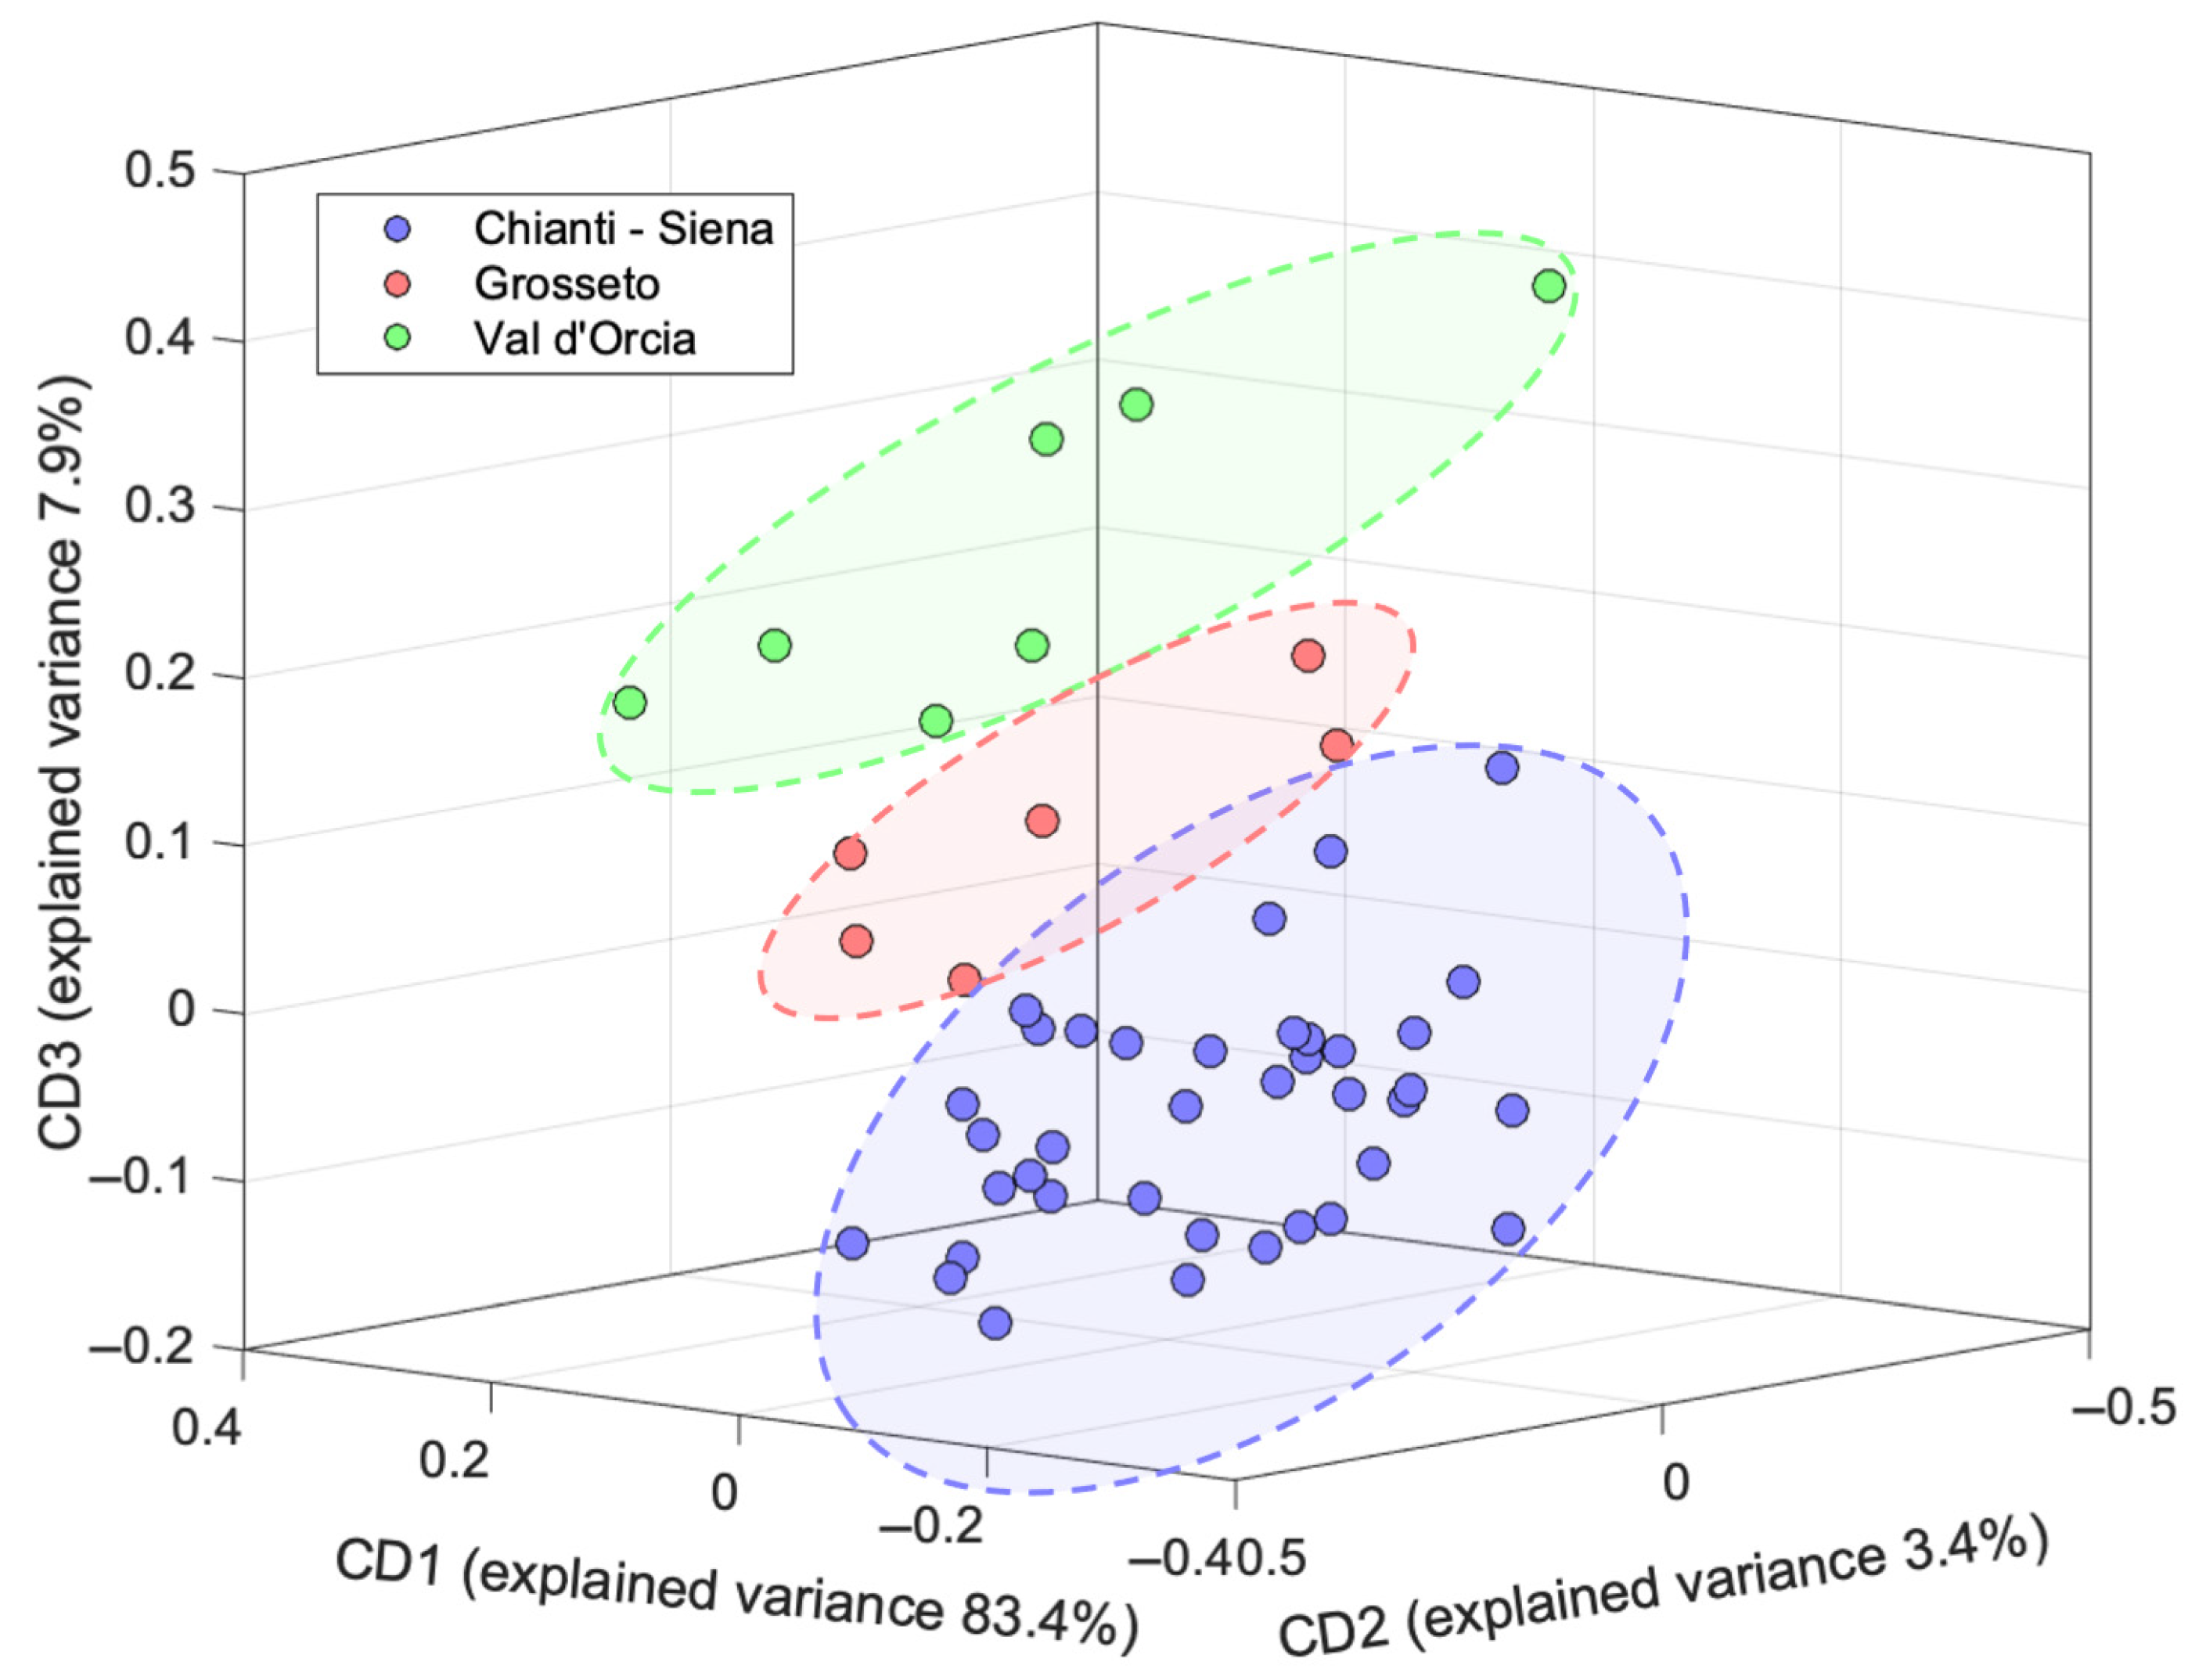
2.3. Data Fusion
3. Materials and Methods
3.1. Reagents
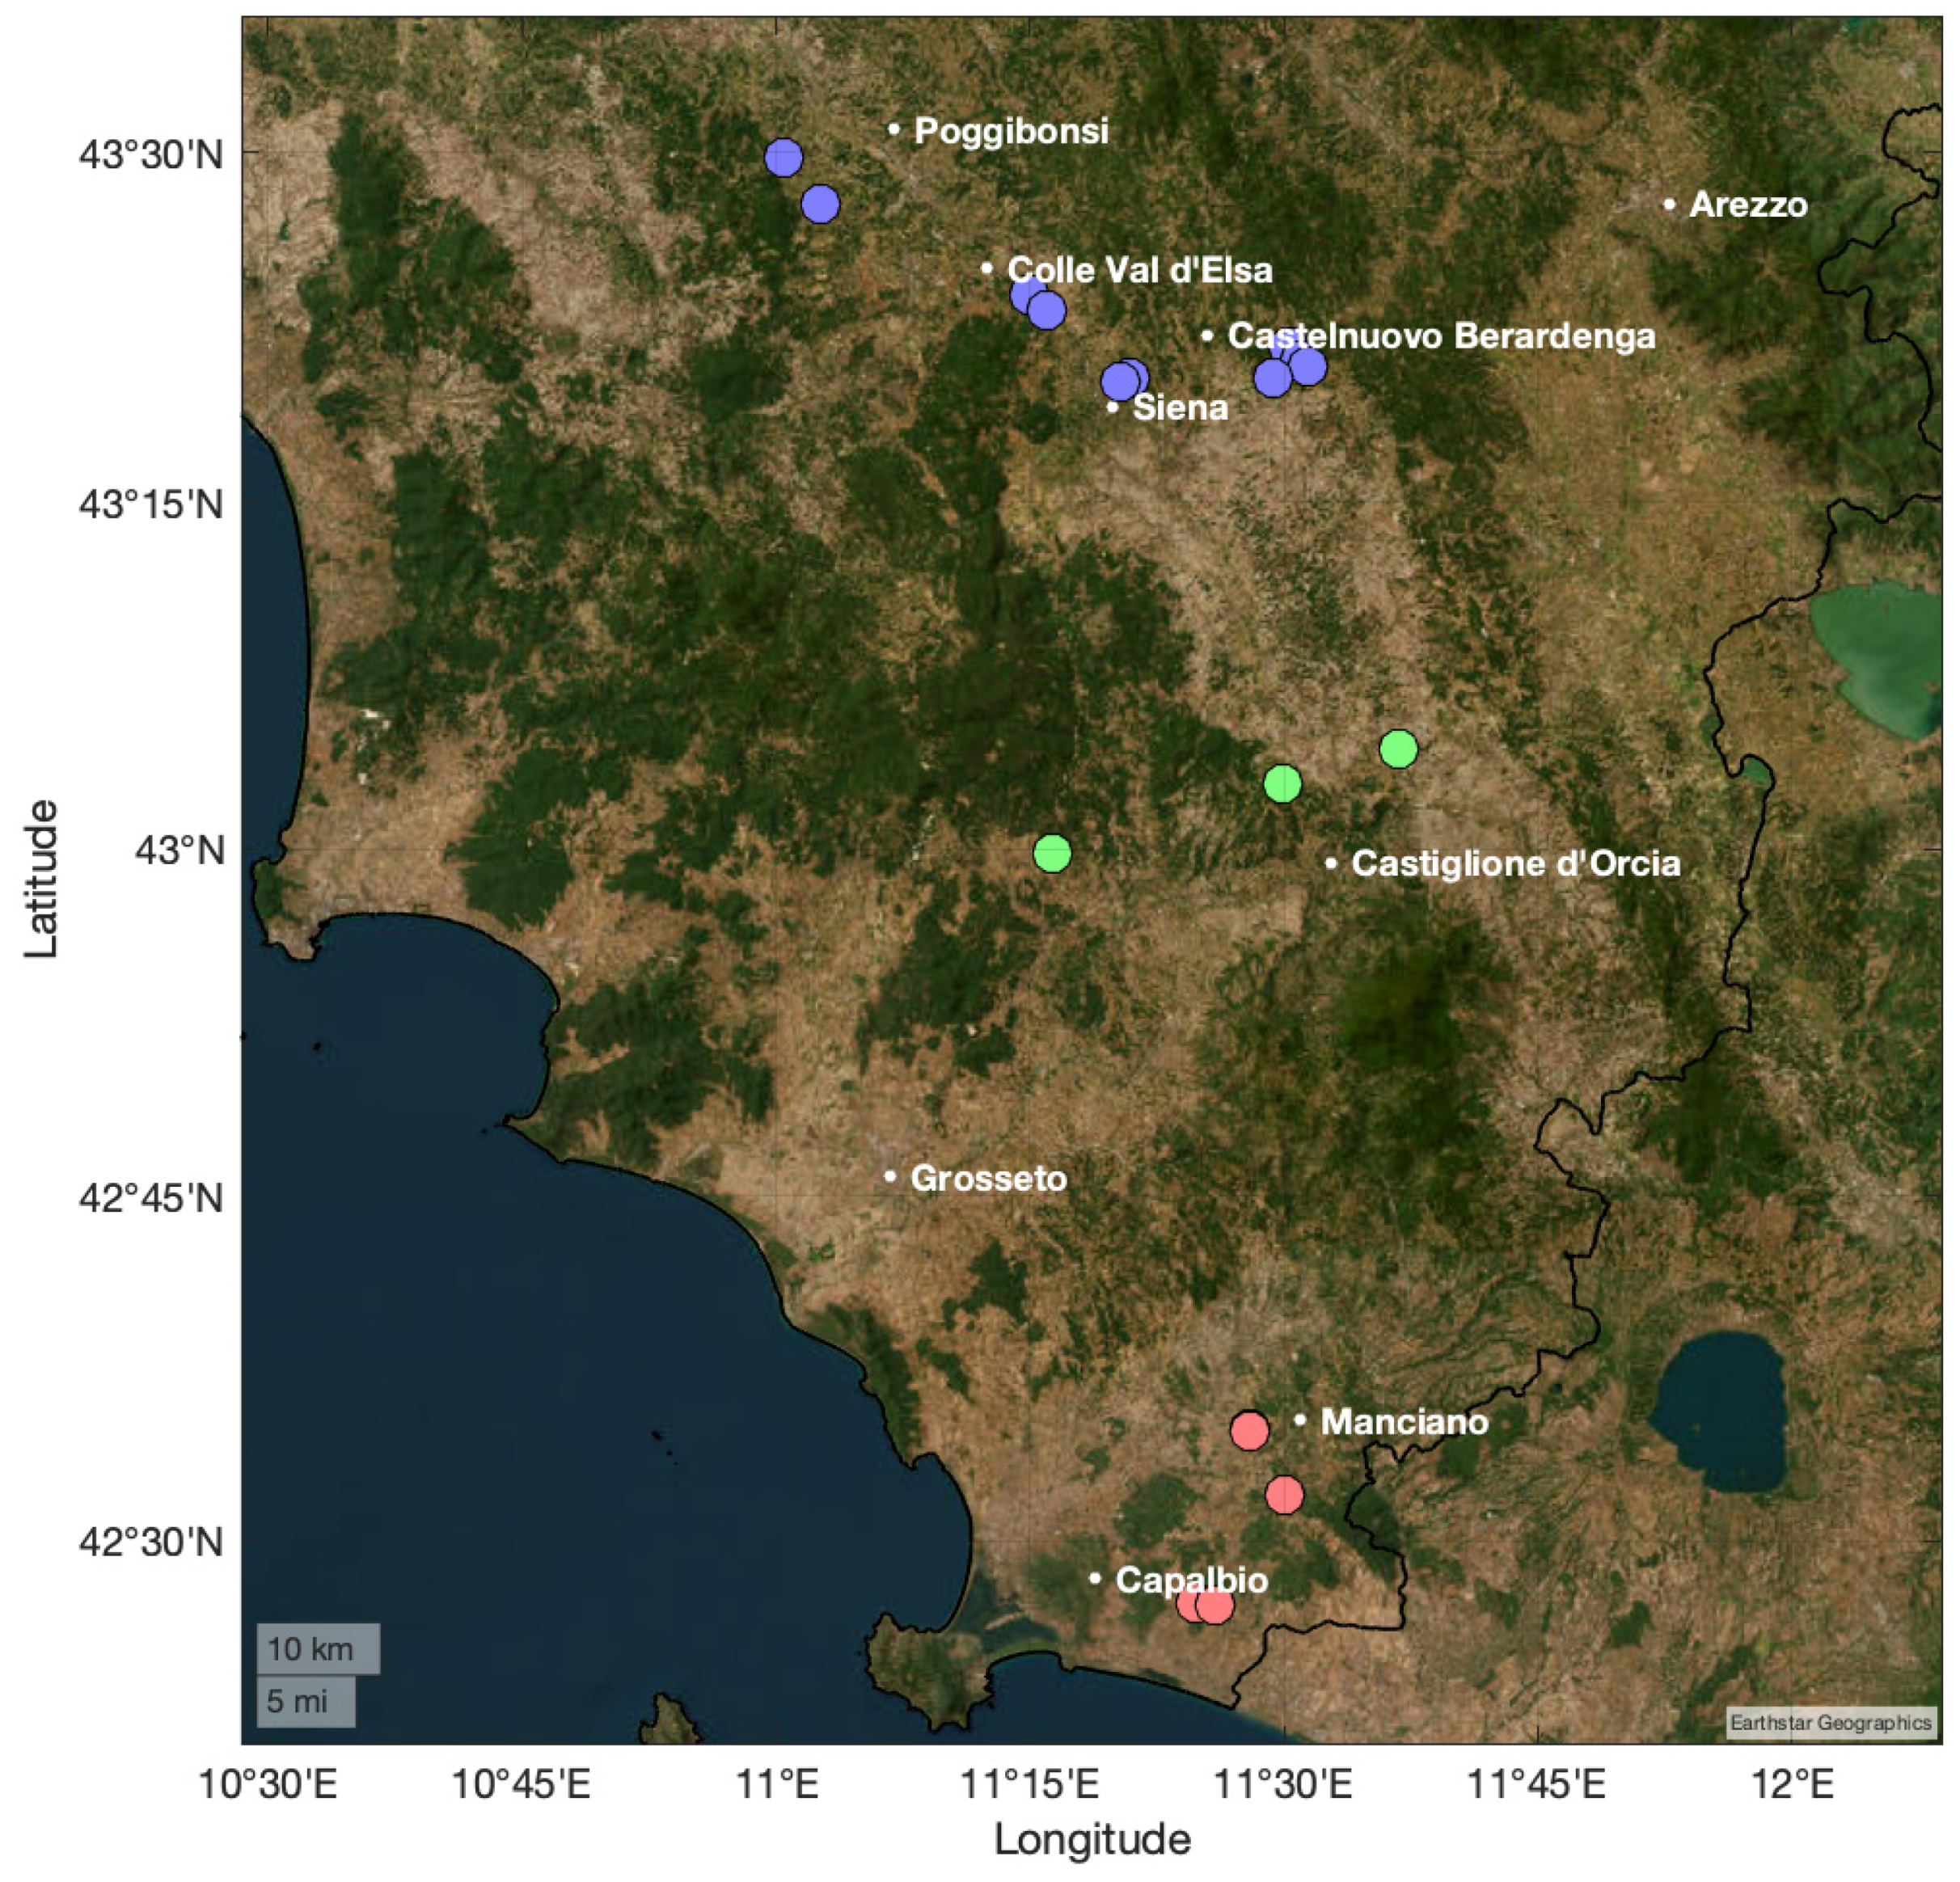
3.2. Sampling and Extraction Protocol
3.3. Fluorescence Excitation Emission Matrix (EEM) Experiments
3.4. 1H-NMR Spectroscopy
3.5. Chemometric Methods
3.6. Data Fusion
4. Conclusions
Supplementary Materials
Author Contributions
Funding
Institutional Review Board Statement
Informed Consent Statement
Data Availability Statement
Acknowledgments
Conflicts of Interest
Abbreviations
| 1H NMR | Proton Nuclear Magnetic Resonance |
| CCSWA | Common Components and Specific Weights Analysis |
| CD | Common Dimension |
| ComDim | Common Dimensions algorithm |
| CORCONDIA | Core Consistency Diagnostic |
| DA | Discriminant Analysis |
| EEM | Excitation–Emission Matrix |
| FID | Fourier Transformation of the Free Induction Decay |
| FN | False Negative |
| FP | False Positive |
| HPLC-HRMS | High-Performance Liquid Chromatography-High Resolution Mass Spectrometry |
| LDA | Linear Discriminant Analysis |
| OD | Orthogonal Distance |
| PARAFAC | Parallel Factor Analysis |
| PCA | Principal Component Analysis |
| PDO | Protected Designation Of Origin |
| RMSECV | Minimum of Root Mean Squared Error in Cross-Validation |
| SD | Score Distance |
| SIMCA | Soft Independent Modeling of Class Analogy |
| TP | True Positive |
| TSP-D4 | 3-(trimethylsilyl)propionic-2,2,3,3-d4 acid sodium salt |
| UV-Vis | UV–Visible |
References
- Available online: https://www.internationaloliveoil.org/wp-content/uploads/2023/12/IOC-Olive-Oil-Dashboard.html (accessed on 28 July 2025).
- Gagour, J.; Hallouch, O.; Asbbane, A.; Bijla, L.; Laknifli, A.; Lee, L.; Zengin, G.; Bouyahya, A.; Sakar, E.H.; Gharby, S. A Review of Recent Progresses on Olive Oil Chemical Profiling, Extraction Technology, Shelf-life, and Quality Control. Chem. Biodivers. 2024, 21, e202301697. [Google Scholar] [CrossRef]
- Lazzerini, C.; Domenici, V. Pigments in Extra-Virgin Olive Oils Produced in Tuscany (Italy) in Different Years. Foods 2017, 6, 25. [Google Scholar] [CrossRef]
- Blasi, F.; Ianni, F.; Cossignani, L. Phenolic Profiling for Geographical and Varietal Authentication of Extra Virgin Olive Oil. Trends Food Sci. Technol. 2024, 147, 104444. [Google Scholar] [CrossRef]
- Lozano-Castellón, J.; López-Yerena, A.; Domínguez-López, I.; Siscart-Serra, A.; Fraga, N.; Sámano, S.; López-Sabater, C.; Lamuela-Raventós, R.M.; Vallverdú-Queralt, A.; Pérez, M. Extra Virgin Olive Oil: A Comprehensive Review of Efforts to Ensure Its Authenticity, Traceability, and Safety. Compr. Rev. Food Sci. Food Saf. 2022, 21, 2639–2664. [Google Scholar] [CrossRef]
- Nardin, R.; Tamasi, G.; Baglioni, M.; Fattori, G.; Boldrini, A.; Esposito, R.; Rossi, C. Combining Metal(Loid) and Secondary Metabolite Levels in Olea europaea L. Samples for Geographical Identification. Foods 2024, 13, 4017. [Google Scholar] [CrossRef]
- Di Vaio, C.; Nocerino, S.; Paduano, A.; Sacchi, R. Influence of Some Environmental Factors on Drupe Maturation and Olive Oil Composition. J. Sci. Food Agric. 2013, 93, 1134–1139. [Google Scholar] [CrossRef] [PubMed]
- Morelló, J.-R.; Romero, M.-P.; Motilva, M.-J. Effect of the Maturation Process of the Olive Fruit on the Phenolic Fraction of Drupes and Oils from Arbequina, Farga, and Morrut Cultivars. J. Agric. Food Chem. 2004, 52, 6002–6009. [Google Scholar] [CrossRef]
- Borghini, F.; Tamasi, G.; Loiselle, S.A.; Baglioni, M.; Ferrari, S.; Bisozzi, F.; Costantini, S.; Tozzi, C.; Riccaboni, A.; Rossi, C. Phenolic Profiles in Olive Leaves from Different Cultivars in Tuscany and Their Use as a Marker of Varietal and Geographical Origin on a Small Scale. Molecules 2024, 29, 3617. [Google Scholar] [CrossRef]
- Nardin, R.; Tamasi, G.; Baglioni, M.; Bisozzi, F.; Consumi, M.; Costa, J.; Fattori, G.; Tozzi, C.; Riccaboni, A.; Rossi, C. Determination of Elemental Content in Vineyard Soil, Leaves, and Grapes of Sangiovese Grapes from the Chianti Region Using ICP-MS for Geographical Identification. ACS Food Sci. Technol. 2024, 4, 2585–2599. [Google Scholar] [CrossRef]
- Pucci, E.; Palumbo, D.; Puiu, A.; Lai, A.; Fiorani, L.; Zoani, C. Characterization and Discrimination of Italian Olive (Olea europaea Sativa) Cultivars by Production Area Using Different Analytical Methods Combined with Chemometric Analysis. Foods 2022, 11, 1085. [Google Scholar] [CrossRef]
- Meenu, M.; Cai, Q.; Xu, B. A Critical Review on Analytical Techniques to Detect Adulteration of Extra Virgin Olive Oil. Trends Food Sci. Technol. 2019, 91, 391–408. [Google Scholar] [CrossRef]
- Gómez-Caravaca, A.M.; Maggio, R.M.; Cerretani, L. Chemometric Applications to Assess Quality and Critical Parameters of Virgin and Extra-Virgin Olive Oil. A Review. Anal. Chim. Acta 2016, 913, 1–21. [Google Scholar] [CrossRef]
- Varzakas, T.; Tarapoulouzi, M.; Agriopoulou, S. Chemometrics and Authenticity of Foods of Plant Origin, 1st ed.; CRC Press: Boca Raton, FL, USA, 2022; ISBN 978-1-00-326616-7. [Google Scholar]
- Cappelli, A.; Cividino, S.; Redaelli, V.; Tripodi, G.; Aiello, G.; Velotto, S.; Zaninelli, M. Applying Spectroscopies, Imaging Analyses, and Other Non-Destructive Techniques to Olives and Extra Virgin Olive Oil: A Systematic Review of Current Knowledge and Future Applications. Agriculture 2024, 14, 1160. [Google Scholar] [CrossRef]
- Kalogiouri, N.P.; Aalizadeh, R.; Dasenaki, M.E.; Thomaidis, N.S. Authentication of Greek PDO Kalamata Table Olives: A Novel Non-Target High Resolution Mass Spectrometric Approach. Molecules 2020, 25, 2919. [Google Scholar] [CrossRef]
- Tamasi, G.; Baratto, M.C.; Bonechi, C.; Byelyakova, A.; Pardini, A.; Donati, A.; Leone, G.; Consumi, M.; Lamponi, S.; Magnani, A.; et al. Chemical Characterization and Antioxidant Properties of Products and By-Products from Olea europaea L. Food Sci. Nutr. 2019, 7, 2907–2920. [Google Scholar] [CrossRef]
- Cangeloni, L.; Bonechi, C.; Leone, G.; Consumi, M.; Andreassi, M.; Magnani, A.; Rossi, C.; Tamasi, G. Characterization of Extracts of Coffee Leaves (Coffea arabica L.) by Spectroscopic and Chromatographic/Spectrometric Techniques. Foods 2022, 11, 2495. [Google Scholar] [CrossRef]
- Girelli, C.R.; Del Coco, L.; Zelasco, S.; Salimonti, A.; Conforti, F.L.; Biagianti, A.; Barbini, D.; Fanizzi, F.P. Traceability of “Tuscan PGI” Extra Virgin Olive Oils by 1H NMR Metabolic Profiles Collection and Analysis. Metabolites 2018, 8, 60. [Google Scholar] [CrossRef] [PubMed]
- Beteinakis, S.; Papachristodoulou, A.; Gogou, G.; Katsikis, S.; Mikros, E.; Halabalaki, M. NMR-Based Metabolic Profiling of Edible Olives—Determination of Quality Parameters. Molecules 2020, 25, 3339. [Google Scholar] [CrossRef]
- Dais, P.; Hatzakis, E. Analysis of Bioactive Microconstituents in Olives, Olive Oil and Olive Leaves by NMR Spectroscopy: An Overview of the Last Decade. In Olive and Olive Oil Bioactive Constituents; Elsevier: Amsterdam, The Netherlands, 2015; pp. 299–332. ISBN 978-1-63067-041-2. [Google Scholar]
- Mannina, L.; Sobolev, A.P. High Resolution NMR Characterization of Olive Oils in Terms of Quality, Authenticity and Geographical Origin. Magn. Reson. Chem. 2011, 49, S3–S11. [Google Scholar] [CrossRef] [PubMed]
- Beteinakis, S.; Papachristodoulou, A.; Kolb, P.; Rösch, P.; Schwarzinger, S.; Mikros, E.; Halabalaki, M. NMR-Based Metabolite Profiling and the Application of STOCSY toward the Quality and Authentication Assessment of European EVOOs. Molecules 2023, 28, 1738. [Google Scholar] [CrossRef]
- Calò, F.; Girelli, C.R.; Wang, S.C.; Fanizzi, F.P. Geographical Origin Assessment of Extra Virgin Olive Oil via NMR and MS Combined with Chemometrics as Analytical Approaches. Foods 2022, 11, 113. [Google Scholar] [CrossRef] [PubMed]
- Maestrello, V.; Solovyev, P.; Bontempo, L.; Mannina, L.; Camin, F. Nuclear Magnetic Resonance Spectroscopy in Extra Virgin Olive Oil Authentication. Compr. Rev. Food Sci. Food Saf. 2022, 21, 4056–4075. [Google Scholar] [CrossRef]
- Dais, P.; Hatzakis, E. Quality Assessment and Authentication of Virgin Olive Oil by NMR Spectroscopy: A Critical Review. Anal. Chim. Acta 2013, 765, 1–27. [Google Scholar] [CrossRef]
- Tamasi, G.; Bonechi, C.; Leone, G.; Andreassi, M.; Consumi, M.; Sangiorgio, P.; Verardi, A.; Rossi, C.; Magnani, A. Varietal and Geographical Origin Characterization of Peaches and Nectarines by Combining Analytical Techniques and Statistical Approach. Molecules 2021, 26, 4128. [Google Scholar] [CrossRef]
- Sikorska, E.; Khmelinskii, I.; Sikorski, M. Fluorescence Spectroscopy and Imaging Instruments for Food Quality Evaluation. In Evaluation Technologies for Food Quality; Elsevier: Amsterdam, The Netherlands, 2019; pp. 491–533. ISBN 978-0-12-814217-2. [Google Scholar]
- Ranaweera, R.K.R.; Gilmore, A.M.; Capone, D.L.; Bastian, S.E.P.; Jeffery, D.W. Authentication of the Geographical Origin of Australian Cabernet Sauvignon Wines Using Spectrofluorometric and Multi-Element Analyses with Multivariate Statistical Modelling. Food Chem. 2021, 335, 127592. [Google Scholar] [CrossRef]
- Sádecká, J.; Uríčková, V.; Jakubíková, M. Fluorescence Spectroscopy for the Analysis of Spirit Drinks. In Applications of Molecular Spectroscopy to Current Research in the Chemical and Biological Sciences; Stauffer, M.T., Ed.; InTech: Rijeka, Croatia, 2016; ISBN 978-953-51-2680-5. [Google Scholar]
- Sikorska, E.; Gliszczyńska-Świgło, A.; Khmelinskii, I.; Sikorski, M. Synchronous Fluorescence Spectroscopy of Edible Vegetable Oils. Quantification of Tocopherols. J. Agric. Food Chem. 2005, 53, 6988–6994. [Google Scholar] [CrossRef]
- Latchoumane, L.; Alary, K.; Minier, J.; Davrieux, F.; Lugan, R.; Chillet, M.; Roger, J.-M. Front-Face Fluorescence Spectroscopy and Feature Selection for Fruit Classification Based on N-CovSel Method. Front. Anal. Sci. 2022, 2, 867527. [Google Scholar] [CrossRef]
- Lenhardt, L.; Zeković, I.; Dramićanin, T.; Milićević, B.; Burojević, J.; Dramićanin, M.D. Characterization of Cereal Flours by Fluorescence Spectroscopy Coupled with PARAFAC. Food Chem. 2017, 229, 165–171. [Google Scholar] [CrossRef]
- Kulmyrzaev, A.A.; Levieux, D.; Dufour, É. Front-Face Fluorescence Spectroscopy Allows the Characterization of Mild Heat Treatments Applied to Milk. Relations with the Denaturation of Milk Proteins. J. Agric. Food Chem. 2005, 53, 502–507. [Google Scholar] [CrossRef] [PubMed]
- Abbas, K.; Karoui, R.; Aït-Kaddour, A. Application of Synchronous Fluorescence Spectroscopy for the Determination of Some Chemical Parameters in PDO French Blue Cheeses. Eur. Food Res. Technol. 2012, 234, 457–465. [Google Scholar] [CrossRef]
- Sikorska, E.; Khmelinskii, I.; Sikorski, M. Analysis of Olive Oils by Fluorescence Spectroscopy: Methods and Applications. In Olive Oil—Constituents, Quality, Health Properties and Bioconversions; Boskou, D., Ed.; InTech: Rijeka, Croatia, 2012; ISBN 978-953-307-921-9. [Google Scholar]
- Murphy, K.R.; Stedmon, C.A.; Graeber, D.; Bro, R. Fluorescence Spectroscopy and Multi-Way Techniques. PARAFAC. Anal. Methods 2013, 5, 6557. [Google Scholar] [CrossRef]
- Amigo, J.M.; Marini, F. Multiway Methods. In Data Handling in Science and Technology; Elsevier: Amsterdam, The Netherlands, 2013; Volume 28, pp. 265–313. ISBN 978-0-444-59528-7. [Google Scholar]
- Morais, C.L.M.; Lima, K.M.G. Comparing Unfolded and Two-Dimensional Discriminant Analysis and Support Vector Machines for Classification of EEM Data. Chemom. Intell. Lab. Syst. 2017, 170, 1–12. [Google Scholar] [CrossRef]
- Al Riza, D.F.; Kondo, N.; Rotich, V.K.; Perone, C.; Giametta, F. Cultivar and Geographical Origin Authentication of Italian Extra Virgin Olive Oil Using Front-Face Fluorescence Spectroscopy and Chemometrics. Food Control 2021, 121, 107604. [Google Scholar] [CrossRef]
- De Paulo, E.H.; Magalhães, G.B.; Moreira, M.P.B.; Nascimento, M.H.C.; Heringer, O.A.; Filgueiras, P.R.; Ferrão, M.F. Classification of Water by Bacterial Presence Using Chemometrics Associated with Excitation-Emission Matrix Fluorescence Spectroscopy. Microchem. J. 2024, 197, 109804. [Google Scholar] [CrossRef]
- Suciu, R.-C.; Zarbo, L.; Guyon, F.; Magdas, D.A. Application of Fluorescence Spectroscopy Using Classical Right Angle Technique in White Wines Classification. Sci. Rep. 2019, 9, 18250. [Google Scholar] [CrossRef]
- Katerinopoulou, K.; Kontogeorgos, A.; Salmas, C.E.; Patakas, A.; Ladavos, A. Geographical Origin Authentication of Agri-Food Products: A Review. Foods 2020, 9, 489. [Google Scholar] [CrossRef] [PubMed]
- Cozzolino, D. Recent Trends on the Use of Infrared Spectroscopy to Trace and Authenticate Natural and Agricultural Food Products. Appl. Spectrosc. Rev. 2012, 47, 518–530. [Google Scholar] [CrossRef]
- Garrido-Cuevas, M.-M.; Garrido-Varo, A.-M.; Marini, F.; Sánchez, M.-T.; Pérez-Marín, D. Enhancing Virgin Olive Oil Authentication with Bayesian Probabilistic Models and near Infrared Spectroscopy. J. Food Eng. 2025, 391, 112443. [Google Scholar] [CrossRef]
- Biancolillo, A.; Boqué, R.; Cocchi, M.; Marini, F. Data Fusion Strategies in Food Analysis. In Data Handling in Science and Technology; Elsevier: Amsterdam, The Netherlands, 2019; Volume 31, pp. 271–310. ISBN 978-0-444-63984-4. [Google Scholar]
- El Ghaziri, A.; Cariou, V.; Rutledge, D.N.; Qannari, E.M. Analysis of Multiblock Datasets Using ComDim: Overview and Extension to the Analysis of (K + 1) Datasets. J. Chemom. 2016, 30, 420–429. [Google Scholar] [CrossRef]
- Rosa, L.N.; De Figueiredo, L.C.; Bonafé, E.G.; Coqueiro, A.; Visentainer, J.V.; Março, P.H.; Rutledge, D.N.; Valderrama, P. Multi-Block Data Analysis Using ComDim for the Evaluation of Complex Samples: Characterization of Edible Oils. Anal. Chim. Acta 2017, 961, 42–48. [Google Scholar] [CrossRef] [PubMed]
- Costantini, E.A.C.; Barbetti, R.; Bucelli, P.; L’Abate, G.; Lelli, L.; Pellegrini, S.; Storchi, P. Land Peculiarities of the Vine Cultivation Areas in the Province of Siena (Italy), with Reference to the Viticultural and Oenological Results of Sangiovese Vine. Boll. Della Soc. Geol. Ital. Suppl. 2006, 6, 147–159. [Google Scholar]
- Rahmanian, N.; Jafari, S.M.; Wani, T.A. Bioactive Profile, Dehydration, Extraction and Application of the Bioactive Components of Olive Leaves. Trends Food Sci. Technol. 2015, 42, 150–172. [Google Scholar] [CrossRef]
- Girelli, C.R.; Angilè, F.; Del Coco, L.; Migoni, D.; Zampella, L.; Marcelletti, S.; Cristella, N.; Marangi, P.; Scortichini, M.; Fanizzi, F.P. 1H-NMR Metabolite Fingerprinting Analysis Reveals a Disease Biomarker and a Field Treatment Response in Xylella Fastidiosa Subsp. Pauca-Infected Olive Trees. Plants 2019, 8, 115. [Google Scholar] [CrossRef] [PubMed]
- Girelli, C.R.; Hussain, M.; Verweire, D.; Oehl, M.C.; Massana-Codina, J.; Avendaño, M.S.; Migoni, D.; Scortichini, M.; Fanizzi, F.P. Agro-Active Endo-Therapy Treated Xylella Fastidiosa Subsp. Pauca-Infected Olive Trees Assessed by the First 1H-NMR-Based Metabolomic Study. Sci. Rep. 2022, 12, 5973. [Google Scholar] [CrossRef] [PubMed]
- Benavente-García, O.; Castillo, J.; Lorente, J.; Ortuño, A.; Del Rio, J.A. Antioxidant Activity of Phenolics Extracted from Olea europaea L. Leaves. Food Chem. 2000, 68, 457–462. [Google Scholar] [CrossRef]
- Huertas-Alonso, A.J.; Gavahian, M.; González-Serrano, D.J.; Hadidi, M.; Salgado-Ramos, M.; Sánchez-Verdú, M.P.; Simirgiotis, M.J.; Barba, F.J.; Franco, D.; Lorenzo, J.M.; et al. Valorization of Wastewater from Table Olives: NMR Identification of Antioxidant Phenolic Fraction and Microwave Single-Phase Reaction of Sugary Fraction. Antioxidants 2021, 10, 1652. [Google Scholar] [CrossRef]
- Goulas, V.; Exarchou, V.; Troganis, A.N.; Psomiadou, E.; Fotsis, T.; Briasoulis, E.; Gerothanassis, I.P. Phytochemicals in Olive-leaf Extracts and Their Antiproliferative Activity against Cancer and Endothelial Cells. Mol. Nutr. Food Res. 2009, 53, 600–608. [Google Scholar] [CrossRef] [PubMed]
- Karkoula, E.; Skantzari, A.; Melliou, E.; Magiatis, P. Direct Measurement of Oleocanthal and Oleacein Levels in Olive Oil by Quantitative1 H NMR. Establishment of a New Index for the Characterization of Extra Virgin Olive Oils. J. Agric. Food Chem. 2012, 60, 11696–11703. [Google Scholar] [CrossRef]
- Filardo, S.; Roberto, M.; Di Risola, D.; Mosca, L.; Di Pietro, M.; Sessa, R. Olea europaea L-Derived Secoiridoids: Beneficial Health Effects and Potential Therapeutic Approaches. Pharmacol. Ther. 2024, 254, 108595. [Google Scholar] [CrossRef]
- Kalampaliki, A.D.; Giannouli, V.; Skaltsounis, A.-L.; Kostakis, I.K. A Three-Step, Gram-Scale Synthesis of Hydroxytyrosol, Hydroxytyrosol Acetate, and 3,4-Dihydroxyphenylglycol. Molecules 2019, 24, 3239. [Google Scholar] [CrossRef]
- Wishart, D.S.; Knox, C.; Guo, A.C.; Eisner, R.; Young, N.; Gautam, B.; Hau, D.D.; Psychogios, N.; Dong, E.; Bouatra, S.; et al. HMDB: A Knowledgebase for the Human Metabolome. Nucleic Acids Res. 2009, 37, D603–D610. [Google Scholar] [CrossRef]
- Agatonovic-Kustrin, S.; Gegechkori, V.; Morton, D.W.; Tucci, J.; Mohammed, E.U.R.; Ku, H. The Bioprofiling of Antibacterials in Olive Leaf Extracts via Thin Layer Chromatography-Effect Directed Analysis (TLC-EDA). J. Pharm. Biomed. Anal. 2022, 219, 114916. [Google Scholar] [CrossRef]
- Guimet, F.; Ferré, J.; Boqué, R.; Vidal, M.; Garcia, J. Excitation–Emission Fluorescence Spectroscopy Combined with Three-Way Methods of Analysis as a Complementary Technique for Olive Oil Characterization. J. Agric. Food Chem. 2005, 53, 9319–9328. [Google Scholar] [CrossRef]
- Lia, F.; Formosa, J.P.; Zammit-Mangion, M.; Farrugia, C. The First Identification of the Uniqueness and Authentication of Maltese Extra Virgin Olive Oil Using 3D-Fluorescence Spectroscopy Coupled with Multi-Way Data Analysis. Foods 2020, 9, 498. [Google Scholar] [CrossRef] [PubMed]
- Guimet, F.; Boqué, R.; Ferré, J. Cluster Analysis Applied to the Exploratory Analysis of Commercial Spanish Olive Oils by Means of Excitation−Emission Fluorescence Spectroscopy. J. Agric. Food Chem. 2004, 52, 6673–6679. [Google Scholar] [CrossRef]
- Martín-Tornero, E.; Durán Martín-Merás, I.; Espinosa Mansilla, A.; Almeida Lopes, J.; Nuno Mendes De Jorge Páscoa, R. Geographical Discrimination of Grapevine Leaves Using Fibre Optic Fluorescence Data and Chemometrics. Determination of Total Polyphenols and Chlorophylls along Different Vegetative Stages. Microchem. J. 2022, 181, 107647. [Google Scholar] [CrossRef]
- Guimet, F.; Ferré, J.; Boqué, R.; Rius, F.X. Application of Unfold Principal Component Analysis and Parallel Factor Analysis to the Exploratory Analysis of Olive Oils by Means of Excitation–Emission Matrix Fluorescence Spectroscopy. Anal. Chim. Acta 2004, 515, 75–85. [Google Scholar] [CrossRef]
- Giuliani, A.; Cerretani, L.; Cichelli, A. Chlorophylls in Olive and in Olive Oil: Chemistry and Occurrences. Crit. Rev. Food Sci. Nutr. 2011, 51, 678–690. [Google Scholar] [CrossRef] [PubMed]
- Galeano Díaz, T.; Durán Merás, I.; Correa, C.A.; Roldán, B.; Rodríguez Cáceres, M.I. Simultaneous Fluorometric Determination of Chlorophylls a and b and Pheophytins a and b in Olive Oil by Partial Least-Squares Calibration. J. Agric. Food Chem. 2003, 51, 6934–6940. [Google Scholar] [CrossRef]
- Navarro-Orcajada, S.; Matencio, A.; Vicente-Herrero, C.; García-Carmona, F.; López-Nicolás, J.M. Study of the Fluorescence and Interaction between Cyclodextrins and Neochlorogenic Acid, in Comparison with Chlorogenic Acid. Sci. Rep. 2021, 11, 3275. [Google Scholar] [CrossRef]
- Hernández-Sánchez, N.; Lleó, L.; Diezma, B.; Correa, E.C.; Sastre, B.; Roger, J.-M. Multiblock Analysis Applied to Fluorescence and Absorbance Spectra to Estimate Total Polyphenol Content in Extra Virgin Olive Oil. Foods 2021, 10, 2556. [Google Scholar] [CrossRef] [PubMed]
- Zandomeneghi, M.; Carbonaro, L.; Caffarata, C. Fluorescence of Vegetable Oils: Olive Oils. J. Agric. Food Chem. 2005, 53, 759–766. [Google Scholar] [CrossRef] [PubMed]
- Quintanilla-Casas, B.; Rinnan, Å.; Romero, A.; Guardiola, F.; Tres, A.; Vichi, S.; Bro, R. Using Fluorescence Excitation-Emission Matrices to Predict Bitterness and Pungency of Virgin Olive Oil: A Feasibility Study. Food Chem. 2022, 395, 133602. [Google Scholar] [CrossRef]
- Tasnuva, S.T.; Qamar, U.A.; Ghafoor, K.; Sahena, F.; Jahurul, M.H.A.; Rukshana, A.H.; Juliana, M.J.; Al-Juhaimi, F.Y.; Jalifah, L.; Jalal, K.C.A.; et al. α-Glucosidase Inhibitors Isolated from Mimosa pudica L. Nat. Prod. Res. 2019, 33, 1495–1499. [Google Scholar] [CrossRef] [PubMed]
- Wang, L.; Li, X.; Zhang, S.; Lu, W.; Liao, S.; Liu, X.; Shan, L.; Shen, X.; Jiang, H.; Zhang, W.; et al. Natural Products as a Gold Mine for Selective Matrix Metalloproteinases Inhibitors. Bioorg. Med. Chem. 2012, 20, 4164–4171. [Google Scholar] [CrossRef]
- Esposito, A.; De Luca, P.F.; Graziani, V.; D’Abrosca, B.; Fiorentino, A.; Scognamiglio, M. Phytochemical Characterization of Olea Europaea L. Cultivars of Cilento National Park (South Italy) through NMR-Based Metabolomics. Molecules 2021, 26, 3845. [Google Scholar] [CrossRef]
- De Cássia Lemos Lima, R.; Kongstad, K.T.; Kato, L.; José das Silva, M.; Franzyk, H.; Staerk, D. High-Resolution PTP1B Inhibition Profiling Combined with HPLC-HRMS-SPE-NMR for Identification of PTP1B Inhibitors from Miconia Albicans. Molecules 2018, 23, 1755. [Google Scholar] [CrossRef]
- Beteinakis, S.; Papachristodoulou, A.; Stathopoulos, P.; Mikros, E.; Halabalaki, M. A Multilevel LC-HRMS and NMR Correlation Workflow towards Foodomics Advancement: Application in Table Olives. Talanta 2024, 280, 126641. [Google Scholar] [CrossRef]
- Du, C.; Ma, C.; Gu, J.; Li, L.; Zhu, C.; Chen, L.; Wang, T.; Chen, G. Rapid Determination of Catechin Content in Black Tea by Fluorescence Spectroscopy. J. Spectrosc. 2020, 2020, 2479612. [Google Scholar] [CrossRef]
- Gonçalves, T.R.; Teixeira, G.G.; Santos, P.M.; Matsushita, M.; Valderrama, P. Excitation-Emission Matrices and PARAFAC in the Investigation of the Bioactive Compound Effects from the Flavoring Process in Olive Oils. Microchem. J. 2023, 187, 108360. [Google Scholar] [CrossRef]
- Andersson, C.A.; Bro, R. The N-Way Toolbox for MATLAB. Chemom. Intell. Lab. Syst. 2000, 52, 1–4. [Google Scholar] [CrossRef]
- Jacob, D.; Deborde, C.; Lefebvre, M.; Maucourt, M.; Moing, A. NMRProcFlow: A Graphical and Interactive Tool Dedicated to 1D Spectra Processing for NMR-Based Metabolomics. Metabolomics 2017, 13, 36. [Google Scholar] [CrossRef]
- Wold, S. Pattern Recognition by Means of Disjoint Principal Components Models. Pattern Recognit. 1976, 8, 127–139. [Google Scholar] [CrossRef]
- Wold, S.; Sjöström, M. SIMCA: A Method for Analyzing Chemical Data in Terms of Similarity and Analogy. In Chemometrics: Theory and Application; ACS Symposium Series; American Chemical Society: Washington, DC, USA, 1977; Volume 52, pp. 243–282. ISBN 978-0-8412-0379-2. [Google Scholar]
- Tahir, H.E.; Arslan, M.; Komla Mahunu, G.; Adam Mariod, A.; Hashim, S.B.H.; Xiaobo, Z.; Jiyong, S.; El-Seedi, H.R.; Musa, T.H. The Use of Analytical Techniques Coupled with Chemometrics for Tracing the Geographical Origin of Oils: A Systematic Review (2013–2020). Food Chem. 2022, 366, 130633. [Google Scholar] [CrossRef] [PubMed]
- Marini, F.; Bucci, R.; Magrì, A.L.; Magrì, A.D. An Overview of the Chemometric Methods for the Authentication of the Geographical and Varietal Origin of Olive Oils. In Olives and Olive Oil in Health and Disease Prevention; Elsevier: Amsterdam, The Netherlands, 2010; pp. 569–579. ISBN 978-0-12-374420-3. [Google Scholar]
- Masetti, O.; Sorbo, A.; Nisini, L. NMR Tracing of Food Geographical Origin: The Impact of Seasonality, Cultivar and Production Year on Data Analysis. Separations 2021, 8, 230. [Google Scholar] [CrossRef]
- Marini, F.; Biancolillo, A. Application of Spectroscopy in Food Analysis: Volume II. Appl. Sci. 2023, 13, 5633. [Google Scholar] [CrossRef]
- Zaldarriaga Heredia, J.; Wagner, M.; Jofré, F.C.; Savio, M.; Azcarate, S.M.; Camiña, J.M. An Overview on Multi-Elemental Profile Integrated with Chemometrics for Food Quality Assessment: Toward New Challenges. Crit. Rev. Food Sci. Nutr. 2023, 63, 8173–8193. [Google Scholar] [CrossRef]
- De Angelis, D.; Summo, C.; Pasqualone, A.; Faccia, M.; Squeo, G. Advancements in Food Authentication Using Soft Independent Modelling of Class Analogy (SIMCA): A Review. Food Qual. Saf. 2024, 8, fyae032. [Google Scholar] [CrossRef]
- Biancolillo, A.; Marini, F.; Ruckebusch, C.; Vitale, R. Chemometric Strategies for Spectroscopy-Based Food Authentication. Appl. Sci. 2020, 10, 6544. [Google Scholar] [CrossRef]
- Rodionova, O.Y.; Pomerantsev, A.L. Chemometric Tools for Food Fraud Detection: The Role of Target Class in Non-Targeted Analysis. Food Chem. 2020, 317, 126448. [Google Scholar] [CrossRef]
- Vitale, R.; Cocchi, M.; Biancolillo, A.; Ruckebusch, C.; Marini, F. Class Modelling by Soft Independent Modelling of Class Analogy: Why, When, How? A Tutorial. Anal. Chim. Acta 2023, 1270, 341304. [Google Scholar] [CrossRef] [PubMed]
- Vitale, R.; Marini, F.; Ruckebusch, C. SIMCA Modeling for Overlapping Classes: Fixed or Optimized Decision Threshold? Anal. Chem. 2018, 90, 10738–10747. [Google Scholar] [CrossRef] [PubMed]
- Li Vigni, M.; Durante, C.; Michelini, S.; Nocetti, M.; Cocchi, M. Preliminary Assessment of Parmigiano Reggiano Authenticity by Handheld Raman Spectroscopy. Foods 2020, 9, 1563. [Google Scholar] [CrossRef] [PubMed]
- Snee, R.D. Validation of Regression Models: Methods and Examples. Technometrics 1977, 19, 415–428. [Google Scholar] [CrossRef]
- Bro, R. PARAFAC. Tutorial and Applications. Chemom. Intell. Lab. Syst. 1997, 38, 149–171. [Google Scholar] [CrossRef]
- Durán Merás, I.; Domínguez Manzano, J.; Airado Rodríguez, D.; Muñoz De La Peña, A. Detection and Quantification of Extra Virgin Olive Oil Adulteration by Means of Autofluorescence Excitation-Emission Profiles Combined with Multi-Way Classification. Talanta 2018, 178, 751–762. [Google Scholar] [CrossRef]
- Ríos-Reina, R.; Salatti-Dorado, J.Á.; Ortiz-Romero, C.; Cardador, M.J.; Arce, L.; Callejón, R. A Comparative Study of Fluorescence and Raman Spectroscopy for Discrimination of Virgin Olive Oil Categories: Chemometric Approaches and Evaluation against Other Techniques. Food Control 2024, 158, 110250. [Google Scholar] [CrossRef]
- Ballabio, D. A MATLAB Toolbox for Principal Component Analysis and Unsupervised Exploration of Data Structure. Chemom. Intell. Lab. Syst. 2015, 149, 1–9. [Google Scholar] [CrossRef]
- Ballabio, D.; Consonni, V. Classification Tools in Chemistry. Part 1: Linear Models. PLS-DA. Anal. Methods 2013, 5, 3790. [Google Scholar] [CrossRef]
- Qannari, E.M.; Wakeling, I.; MacFie, H.J.H. A Hierarchy of Models for Analysing Sensory Data. Food Qual. Prefer. 1995, 6, 309–314. [Google Scholar] [CrossRef]
- Zeaiter, M.; Rutledge, D. Preprocessing Methods. In Comprehensive Chemometrics; Elsevier: Amsterdam, The Netherlands, 2009; pp. 121–231. ISBN 978-0-444-52701-1. [Google Scholar]
- Rocha Baqueta, M.; Coqueiro, A.; Henrique Março, P.; Mandrone, M.; Poli, F.; Valderrama, P. Integrated 1H NMR Fingerprint with NIR Spectroscopy, Sensory Properties, and Quality Parameters in a Multi-Block Data Analysis Using ComDim to Evaluate Coffee Blends. Food Chem. 2021, 355, 129618. [Google Scholar] [CrossRef] [PubMed]
- Jouan-Rimbaud Bouveresse, D.; Pinto, R.C.; Schmidtke, L.M.; Locquet, N.; Rutledge, D.N. Identification of Significant Factors by an Extension of ANOVA–PCA Based on Multi-Block Analysis. Chemom. Intell. Lab. Syst. 2011, 106, 173–182. [Google Scholar] [CrossRef]
- Makimori, G.Y.F.; Bona, E. Commercial Instant Coffee Classification Using an Electronic Nose in Tandem with the ComDim-LDA Approach. Food Anal. Methods 2019, 12, 1067–1076. [Google Scholar] [CrossRef]
- Galvan, D.; de Andrade, J.C.; Conte-Junior, C.A.; Killner, M.H.M.; Bona, E. DD-ComDim: A Data-Driven Multiblock Approach for One-Class Classifiers. Chemom. Intell. Lab. Syst. 2023, 233, 104748. [Google Scholar] [CrossRef]
- Mishra, P.; Roger, J.M.; Rutledge, D.N.; Biancolillo, A.; Marini, F.; Nordon, A.; Jouan-Rimbaud-Bouveresse, D. MBA-GUI: A Chemometric Graphical User Interface for Multi-Block Data Visualisation, Regression, Classification, Variable Selection and Automated Pre-Processing. Chemom. Intell. Lab. Syst. 2020, 205, 104139. [Google Scholar] [CrossRef]


| SIMCA Model for Chianti–Siena Region | |||||||
|---|---|---|---|---|---|---|---|
| Training | Test | ||||||
| Accuracy (%) | Sensitivity (%) | Specificity (%) | Accuracy (%) | Sensitivity (%) | Specificity (%) | Explained Variance (%) | |
| Leaves 1H NMR | 100 | 100 | 100 | 83 | 100 | 50 | 97 |
| Leaves EEM | 84 | 100 | 43 | 83 | 100 | 50 | 94 |
| Drupes 1H NMR | 88 | 90 | 82 | 70 | 75 | 50 | 95 |
| Drupes EEM | 76 | 77 | 73 | 50 | 50 | 50 | 90 |
| Analyzed Matrix | Fluorescence Region | Compound | Excitation Wavelength (nm) | Emission Wavelength (nm) |
|---|---|---|---|---|
| Leaves | Region A | Chlorophyll a | 430, 670 | 675 |
| Pheophytin a | 410, 660 | 670 | ||
| Chlorophyll b | 460, 650 | 665 | ||
| Region B | Chlorogenic acid | 320 | 435 | |
| Phenolic compounds | 280 | <370 | ||
| Tocopherols | 360 | 465 | ||
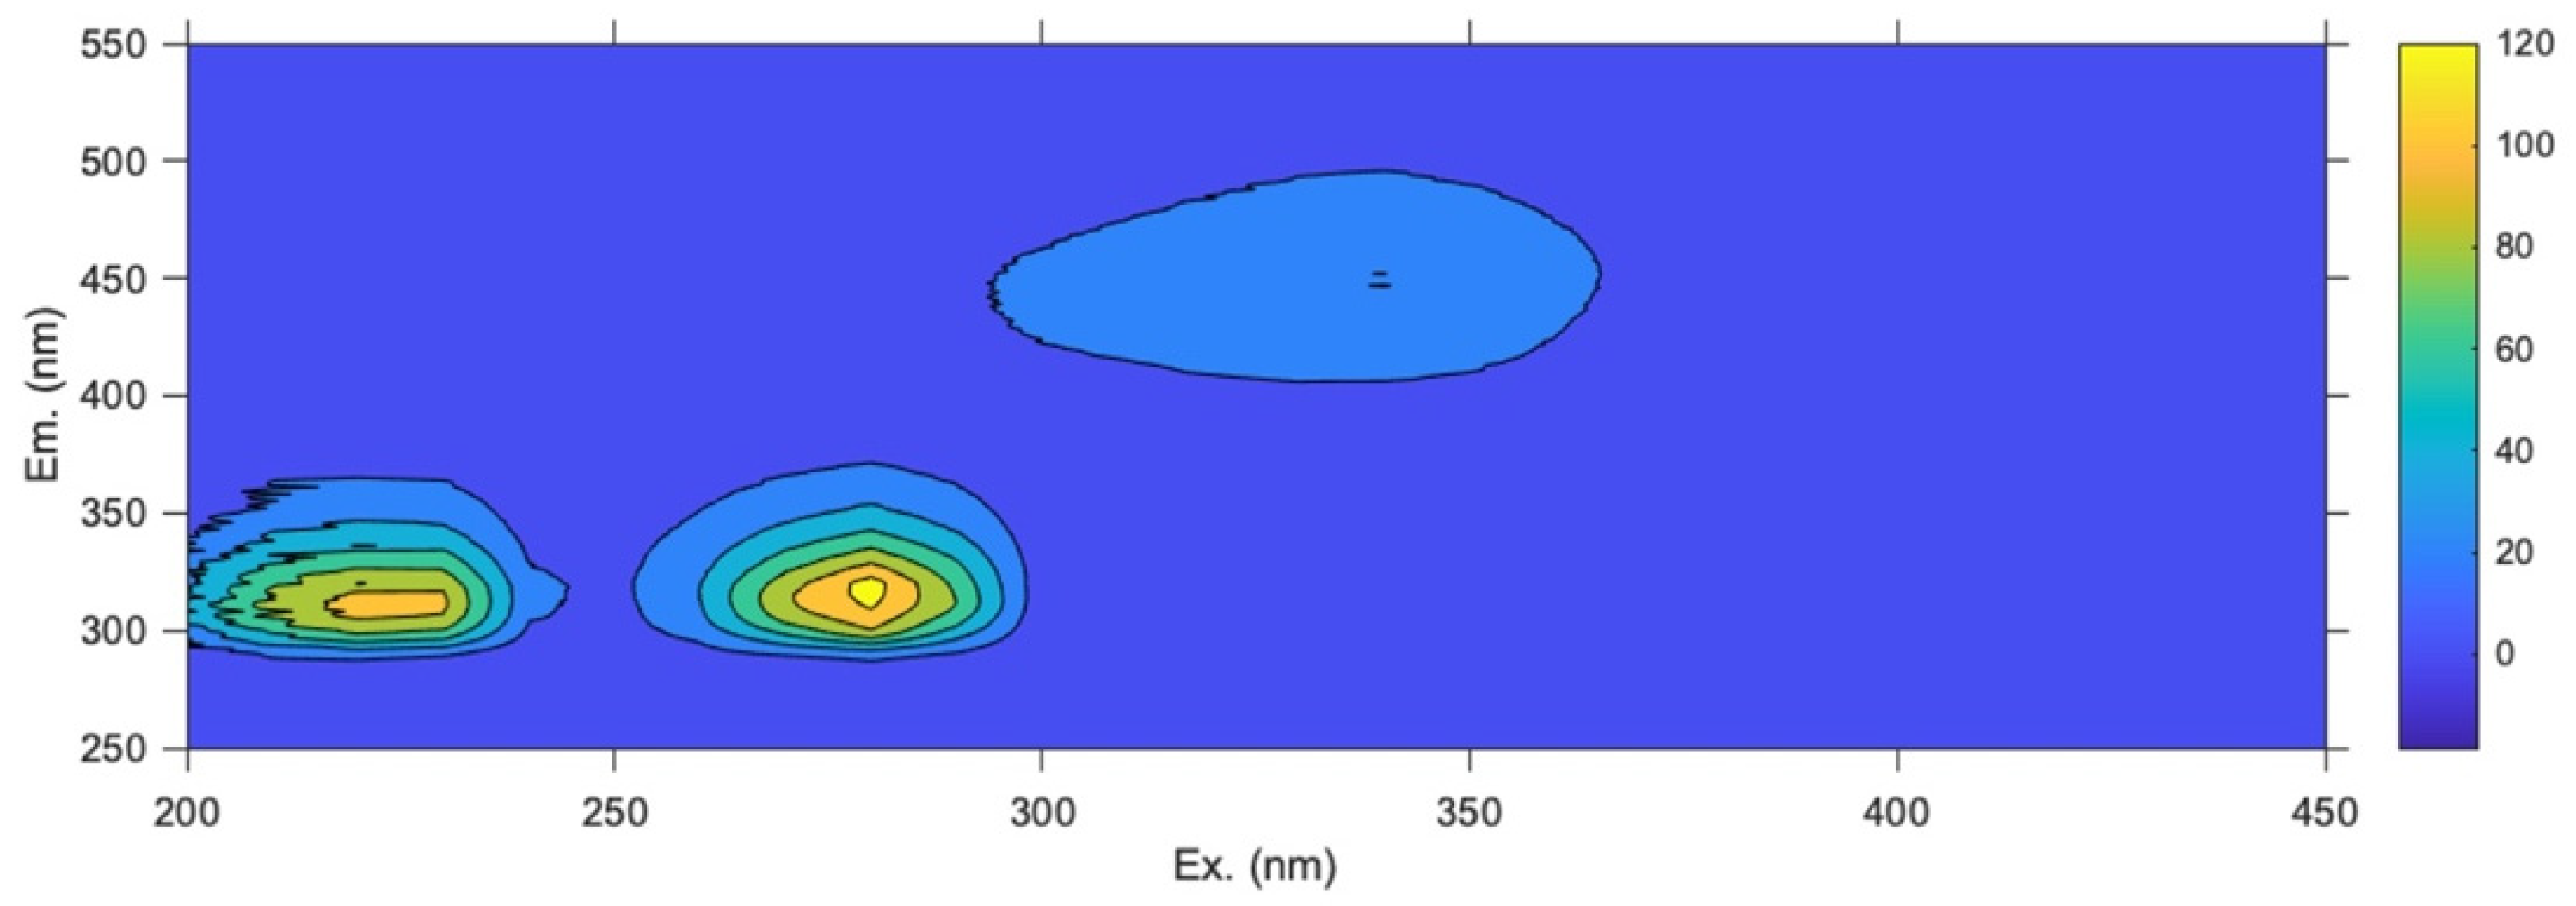
| Drupes | Full map | Catechin/epicatechin | 280 | 315 |
| Tocopherols | 340 | 450 | ||
| Phenolic compounds | 230 | 310 |
| ComDim-Based SIMCA Multiblock Model for Chianti–Siena Region | |||||||
|---|---|---|---|---|---|---|---|
| Training | Test | ||||||
| Accuracy (%) | Sensitivity (%) | Specificity (%) | Accuracy (%) | Sensitivity (%) | Specificity (%) | Explained Variance (%) | |
| Leaves | 84 | 83 | 86 | 83 | 100 | 50 | 95 |
| Drupes | 86 | 90 | 73 | 90 | 100 | 50 | 93 |
Disclaimer/Publisher’s Note: The statements, opinions and data contained in all publications are solely those of the individual author(s) and contributor(s) and not of MDPI and/or the editor(s). MDPI and/or the editor(s) disclaim responsibility for any injury to people or property resulting from any ideas, methods, instructions or products referred to in the content. |
© 2025 by the authors. Licensee MDPI, Basel, Switzerland. This article is an open access article distributed under the terms and conditions of the Creative Commons Attribution (CC BY) license (https://creativecommons.org/licenses/by/4.0/).
Share and Cite
Tatini, D.; Bisozzi, F.; Costantini, S.; Fattori, G.; Boldrini, A.; Baglioni, M.; Bonechi, C.; Donati, A.; Tozzi, C.; Riccaboni, A.; et al. Geographical Origin Authentication of Leaves and Drupes from Olea europaea via 1H NMR and Excitation–Emission Fluorescence Spectroscopy: A Data Fusion Approach. Molecules 2025, 30, 3208. https://doi.org/10.3390/molecules30153208
Tatini D, Bisozzi F, Costantini S, Fattori G, Boldrini A, Baglioni M, Bonechi C, Donati A, Tozzi C, Riccaboni A, et al. Geographical Origin Authentication of Leaves and Drupes from Olea europaea via 1H NMR and Excitation–Emission Fluorescence Spectroscopy: A Data Fusion Approach. Molecules. 2025; 30(15):3208. https://doi.org/10.3390/molecules30153208
Chicago/Turabian StyleTatini, Duccio, Flavia Bisozzi, Sara Costantini, Giacomo Fattori, Amedeo Boldrini, Michele Baglioni, Claudia Bonechi, Alessandro Donati, Cristiana Tozzi, Angelo Riccaboni, and et al. 2025. "Geographical Origin Authentication of Leaves and Drupes from Olea europaea via 1H NMR and Excitation–Emission Fluorescence Spectroscopy: A Data Fusion Approach" Molecules 30, no. 15: 3208. https://doi.org/10.3390/molecules30153208
APA StyleTatini, D., Bisozzi, F., Costantini, S., Fattori, G., Boldrini, A., Baglioni, M., Bonechi, C., Donati, A., Tozzi, C., Riccaboni, A., Tamasi, G., & Rossi, C. (2025). Geographical Origin Authentication of Leaves and Drupes from Olea europaea via 1H NMR and Excitation–Emission Fluorescence Spectroscopy: A Data Fusion Approach. Molecules, 30(15), 3208. https://doi.org/10.3390/molecules30153208