


Studies on the Emission of Volatile Organic Compounds from Selected Forest Mushrooms of the Genus Lactarius Using Proton-Transfer Reaction Mass Spectrometry


Abstract
1. Introduction
2. Results and Discussions
3. Materials and Methods
3.1. Mushroom Samples
3.2. VOC Measurements
3.3. Statistical Methods
4. Summary and Conclusions
Author Contributions
Funding
Institutional Review Board Statement
Informed Consent Statement
Data Availability Statement
Conflicts of Interest
References
- Islam, T.; Ganesan, K.; Xu, B. New insight into mycochemical profiles and antioxidant potential of edible and medicinal mushrooms: A review. Int. J. Med. Mushrooms 2019, 21, 237–251. [Google Scholar] [CrossRef] [PubMed]
- Martínez-Medina, G.A.; Chávez-González, M.L.; Verma, D.K.; Prado-Barragán, L.A.; Martínez-Hernández, J.L.; Flores-Gallegos, A.C.; Thakur, M.; Srivastav, P.P.; Aguilar, C.N. Bio-functional components in mushrooms, a health opportunity: Ergothionine and huitlacoche as recent trends. J. Funct. Foods 2021, 77, 104326. [Google Scholar] [CrossRef]
- Peintner, U.; Schwarz, S.; Mešić, A.; Moreau, P.-A.; Moreno, G.; Saviuc, P. Mycophilic or mycophobic? Legislation and guidelines on wild mushroom commerce reveal different consumption behaviours in European countries. PLoS ONE 2013, 8, e63926. [Google Scholar] [CrossRef] [PubMed]
- Boa, E.R. Wild Edible Fungi: A Global Overview of Their Use and Importance to People, Publishing Management Service; FAO: Rome, Italy, 2004. [Google Scholar]
- De Román, M.; Boa, E. The marketing of Lactarius deliciosus in Northern Spain. Econ. Bot. 2006, 60, 284–290. [Google Scholar] [CrossRef]
- Muszyńska, B.; Sułkowska-Ziaja, K.; Łojewski, M.; Opoka, W.; Zając, M.; Rojowski, J. Edible mushrooms in prophylaxis and treatment of human diseases. Med. Inter. Rev. 2013, 101, 170–183. [Google Scholar]
- Taofiq, O.; Calhelha, R.C.; Heleno, S.; Barros, L.; Martins, A.; Santos-Buelga, C.; Queiroz, J.M.; Ferreira, C.F.R.I. The contribution of phenolic acids to the anti-inflammatory activity of mushrooms: Screening in phenolic extracts, individual parent molecules and synthesized glucuronated and methylated derivatives. Food Res. Int. 2015, 76, 821–827. [Google Scholar] [CrossRef] [PubMed]
- Nowacka-Jechalke, N.; Olech, M.; Nowak, R. Mushroom polyphenols as chemopreventive agents. In Polyphenols: Prevention and Treatment of Human Disease; Watson, R.R., Preedy, V.R., Zibadi, S., Eds.; Academic Press: London, UK, 2018; pp. 137–150. [Google Scholar] [CrossRef]
- Novaković, S.; Đekic, I.; Klaus, A.; Vunduk, J.; Đorđević, V.; Tomovic, V.; Šojić, B.; Kocić-Tanackov, S.; Tomašević, I. Antioxidant activity of mushrooms in vitro and in frankfurters. Sci. J. Meat Technol. 2020, 61, 62–69. [Google Scholar] [CrossRef]
- Karlson-Stiber, C.; Persson, H. Cytotoxic fungi—An overview. Toxicon 2003, 42, 339–349. [Google Scholar] [CrossRef] [PubMed]
- Wang, B.; Wan, A.H.; Xu, Y.; Zhang, R.-X.; Zhao, B.-C.; Zhao, X.-Y.; Shi, Y.-C.; Zhang, X.; Xue, Y.; Luo, Y.; et al. Identification of indocyanine green as a STT3B inhibitor against mushroom α-amanitin cytotoxicity. Nat. Commun. 2023, 14, 2241. [Google Scholar] [CrossRef] [PubMed]
- Köppel, C. Clinical symptomatology and management of mushroom poisoning. Toxicon 1993, 31, 1513–1540. [Google Scholar] [CrossRef] [PubMed]
- Dart, R.C. Mushrooms. Medical Toxicology; Williams & Wilkins: Philadelphia, PA, USA, 2004; pp. 1719–1735. ISBN 0-7817-2845-2. [Google Scholar]
- Benjamin, D.R. Mushrooms: Poisons and Panaceas—A Handbook for Naturalists, Mycologists and Physicians; WH Freeman: New York, NY, USA, 1995; ISBN 978-0-7167-2600-5. [Google Scholar]
- Beluhan, S.; Ranogajec, A. Chemical composition and non-volatile components of Croatian wild edible mushrooms. Food Chem. 2011, 124, 1076–1082. [Google Scholar] [CrossRef]
- Rotzoll, N.; Dunkel, A.; Hofmann, T. Quantitative studies, taste reconstitution, and omission experiments on the key taste compounds in morel mushrooms (Morchella deliciosa Fr.). J. Agric. Food Chem. 2006, 54, 2705–2711. [Google Scholar] [CrossRef] [PubMed]
- Spakowicz, D.J.; Strobel, S.A. Biosynthesis of hydrocarbons and volatile organic compounds by fungi: Bioengineering potential. Appl. Microbiol. Biotechnol. 2015, 99, 4943–4951. [Google Scholar] [CrossRef] [PubMed]
- Karlshøj, K.; Larsen, T.O. Differentiation of Species from the Penicillium roqueforti Group by Volatile Metabolite Profiling. J. Agric. Food Chem. 2005, 53, 708–715. [Google Scholar] [CrossRef] [PubMed]
- Pyysalo, H. Identification of volatile compounds in seven edible fresh mushrooms. Acta Chem. Scand. 1976, 30, 235–244. [Google Scholar] [CrossRef]
- Cho, I.H.; Lee, S.M.; Kim, S.Y.; Choi, H.-K.; Kim, K.-O.; Kim, S.-Y. Differentiation of aroma characteristics of pine-mushrooms (Tricholoma matsutake Sing.) of different grades using gas chromatography–olfactometry and sensory analysis. J. Agric. Food Chem. 2007, 55, 2323–2328. [Google Scholar] [CrossRef] [PubMed]
- Grosshauser, S.; Schieberle, P. Characterization of the key odorants in pan-fried white mushrooms (Agaricus bisporus L.) by means of molecular sensory science: Comparison with the raw mushroom tissue. J. Agric. Food Chem. 2013, 61, 3804–3813. [Google Scholar] [CrossRef] [PubMed]
- Zhang, H.; Pu, D.; Sun, B.; Ren, F.; Zhang, Y.; Chen, H. Characterization and comparison of key aroma compounds in raw and dry porcini mushroom (Boletus edulis) by aroma extract dilution analysis, quantitation and aroma recombination experiments. Food Chem. 2018, 258, 260–268. [Google Scholar] [CrossRef] [PubMed]
- Aisala, H.; Sola, J.; Hopia, A.; Linderborg, K.M.; Sandell, M. Odor-contributing volatile compounds of wild edible Nordic mushrooms analyzed with HS–SPME–GC–MS and HS–SPME–GC–O/FID. Food Chem. 2019, 283, 566–578. [Google Scholar] [CrossRef] [PubMed]
- Liu, H.; Liu, H.; Li, J.; Wang, Y. Review of Recent Modern Analytical Technology Combined with Chemometrics Approach Researches on Mushroom Discrimination and Evaluation. Crit. Rev. Anal. Chem. 2024, 54, 1560–1583. [Google Scholar] [CrossRef] [PubMed]
- Zhou, J.J.; Feng, T.; Ye, R. Differentiation of Eight Commercial Mushrooms by Electronic Nose and Gas Chromatography-Mass Spectrometry. J. Sens. 2015, 2015, 374013. [Google Scholar] [CrossRef]
- Guo, Q.Y.; Adelina, N.M.; Hu, J.T.; Zhang, L.G.; Zhao, Y.H. Comparative Analysis of Volatile Profiles in Four pine-mushrooms using HS-SPME/GC-MS and E-Nose. Food Control 2022, 134, 10871. [Google Scholar] [CrossRef]
- Hansel, A.; Jordan, A.; Holzinger, R.; Prazeller, P.; Vogel, W.; Lindinger, W. Proton transfer reaction mass spectrometry: On-line trace gas analysis at the ppb level. Int. J. Mass Spectrom. Ion Process. 1995, 149–150, 609–619. [Google Scholar] [CrossRef]
- Blake, R.S.; Monks, P.S.; Ellis, A.M. Proton-Transfer Reaction Mass Spectrometry. Chem. Rev. 2009, 109, 861–896. [Google Scholar] [CrossRef] [PubMed]
- Roslund, K.; Lehto, M.; Pussinena, P.; Hartonen, K.; Groop, P.-H.; Halonen, L.; Metsälä, M. Identifying volatile in vitro biomarkers for oral bacteria with proton-transfer-reaction mass spectrometry and gas chromatography–mass spectrometry. Sci. Rep. 2021, 11, 16897. [Google Scholar] [CrossRef] [PubMed]
- Ciesa, F.; Höller, I.; Guerra, W.; Berger, J.; Dalla Via, J.; Oberhuber, M. Chemodiversity in the Fingerprint Analysis of Volatile Organic Compounds (VOCs) of 35 Old and 7 Modern Apple Cultivars Determined by Proton-Transfer-Reaction Mass Spectrometry (PTR-MS) in Two Different Seasons. Chem. Biodivers. 2015, 12, 800–812. [Google Scholar] [CrossRef] [PubMed]
- Korpi, A.; Järnberg, J.; Pasanen, A.L. Microbial Volatile Organic Compounds. Crit. Rev. Toxicol. 2009, 39, 139–193. [Google Scholar] [CrossRef] [PubMed]
- Škubla, P. Wielki Atlas Grzybów; Elipsa: Poznań, Poland, 2007. [Google Scholar]
- Wróblewski, T.; Kaminska, A.; Włodarkiewicz, A.; Ushakou, D. Studies of volatile organic compounds emission from fragaria vesca and fragaria ananassa using proton transfer reaction mass spectrometry. Acta Phys. Pol. B 2020, 13, 899–907. [Google Scholar] [CrossRef]
- Biasioli, F.; Gasperi, F.; Aprea, E.; Mott, D.; Boscaini, E.; Mayr, D.; Märk, T.D. Coupling Proton Transfer Reaction−Mass Spectrometry with Linear Discriminant Analysis: a Case Study. J. Agric. Food Chem. 2003, 51, 7227–7233. [Google Scholar] [CrossRef] [PubMed]
- Berbegal, C.; Khomenko, I.; Russo, P.; Spano, G.; Fragasso, M.; Biasioli, F.; Capozzi, V. PTR-ToF-MS for the Online Monitoring of Alcoholic Fermentation in Wine: Assessment of VOCs Variability Associated with Different Combinations of Saccharomyces/Non-Saccharomyces as a Case-Study. Fermentation 2020, 6, 55. [Google Scholar] [CrossRef]
- Bruce, P.; Bruce, A.; Gedeck, P. Practical Statistics for Data Scientists; O’Reilly Media, Inc.: Sebastopol, CA, USA, 2020; ISBN-13 978-1492072942. [Google Scholar]

| m/z | Important Differences |
|---|---|
| 57 | A-C, B-C |
| 59 | A-C, B-C |
| 61 | A-C, B-C |
| 63 | A-C, B-C, A-B |
| 69 | A-C, B-C, A-B |
| 71 | A-C, B-C |
| 73 | A-C, B-C |
| 81 | A-C, B-C |
| 83 | A-C, B-C |
| 95 | A-C, B-C, A-B |
| 101 | A-C, B-C, A-B |
| 109 | A-C, B-C, A-B |
| 111 | A-C, B-C, A-B |
| 121 | A-C, B-C, A-B |
| 123 | A-C, B-C, A-B |
| 127 | A-C, B-C, A-B |
| 129 | A-C, B-C, A-B |
| 137 | A-C, B-C, A-B |
| 155 | A-C, B-C, A-B |
| 205 | A-C, B-C |
| N = 535 | Wilks’ Lambda | Partial Wilks’ Lambda | F-Value (2.513) | p | Tolerance | 1-Tolerance (R-Squared) |
|---|---|---|---|---|---|---|
| m/z 57 | 0.014 | 0.715 | 102.245 | 0.000 | 0.229 | 0.771 |
| m/z 59 | 0.013 | 0.764 | 79.313 | 0.000 | 0.544 | 0.456 |
| m/z 61 | 0.010 | 0.997 | 0.850 | 0.428 | 0.719 | 0.281 |
| m/z 63 | 0.010 | 0.937 | 17.276 | 0.000 | 0.520 | 0.480 |
| m/z 69 | 0.011 | 0.877 | 35.885 | 0.000 | 0.019 | 0.981 |
| m/z 71 | 0.011 | 0.885 | 33.346 | 0.000 | 0.240 | 0.760 |
| m/z 73 | 0.012 | 0.847 | 46.488 | 0.000 | 0.283 | 0.717 |
| m/z 81 | 0.012 | 0.840 | 48.875 | 0.000 | 0.236 | 0.764 |
| m/z 83 | 0.011 | 0.869 | 38.632 | 0.000 | 0.061 | 0.939 |
| m/z 95 | 0.012 | 0.845 | 46.987 | 0.000 | 0.389 | 0.611 |
| m/z 101 | 0.010 | 0.972 | 7.365 | 0.001 | 0.482 | 0.518 |
| m/z 109 | 0.012 | 0.787 | 69.225 | 0.000 | 0.497 | 0.503 |
| m/z 111 | 0.011 | 0.929 | 19.530 | 0.000 | 0.021 | 0.979 |
| m/z 121 | 0.010 | 0.999 | 0.341 | 0.712 | 0.821 | 0.179 |
| m/z 123 | 0.010 | 0.946 | 14.518 | 0.000 | 0.324 | 0.676 |
| m/z 127 | 0.010 | 0.997 | 0.777 | 0.461 | 0.160 | 0.840 |
| m/z 129 | 0.010 | 0.968 | 8.539 | 0.000 | 0.442 | 0.558 |
| m/z 137 | 0.010 | 0.968 | 8.393 | 0.000 | 0.433 | 0.567 |
| m/z 155 | 0.010 | 0.994 | 1.658 | 0.191 | 0.466 | 0.534 |
| m/z 205 | 0.010 | 0.945 | 14.832 | 0.000 | 0.312 | 0.688 |
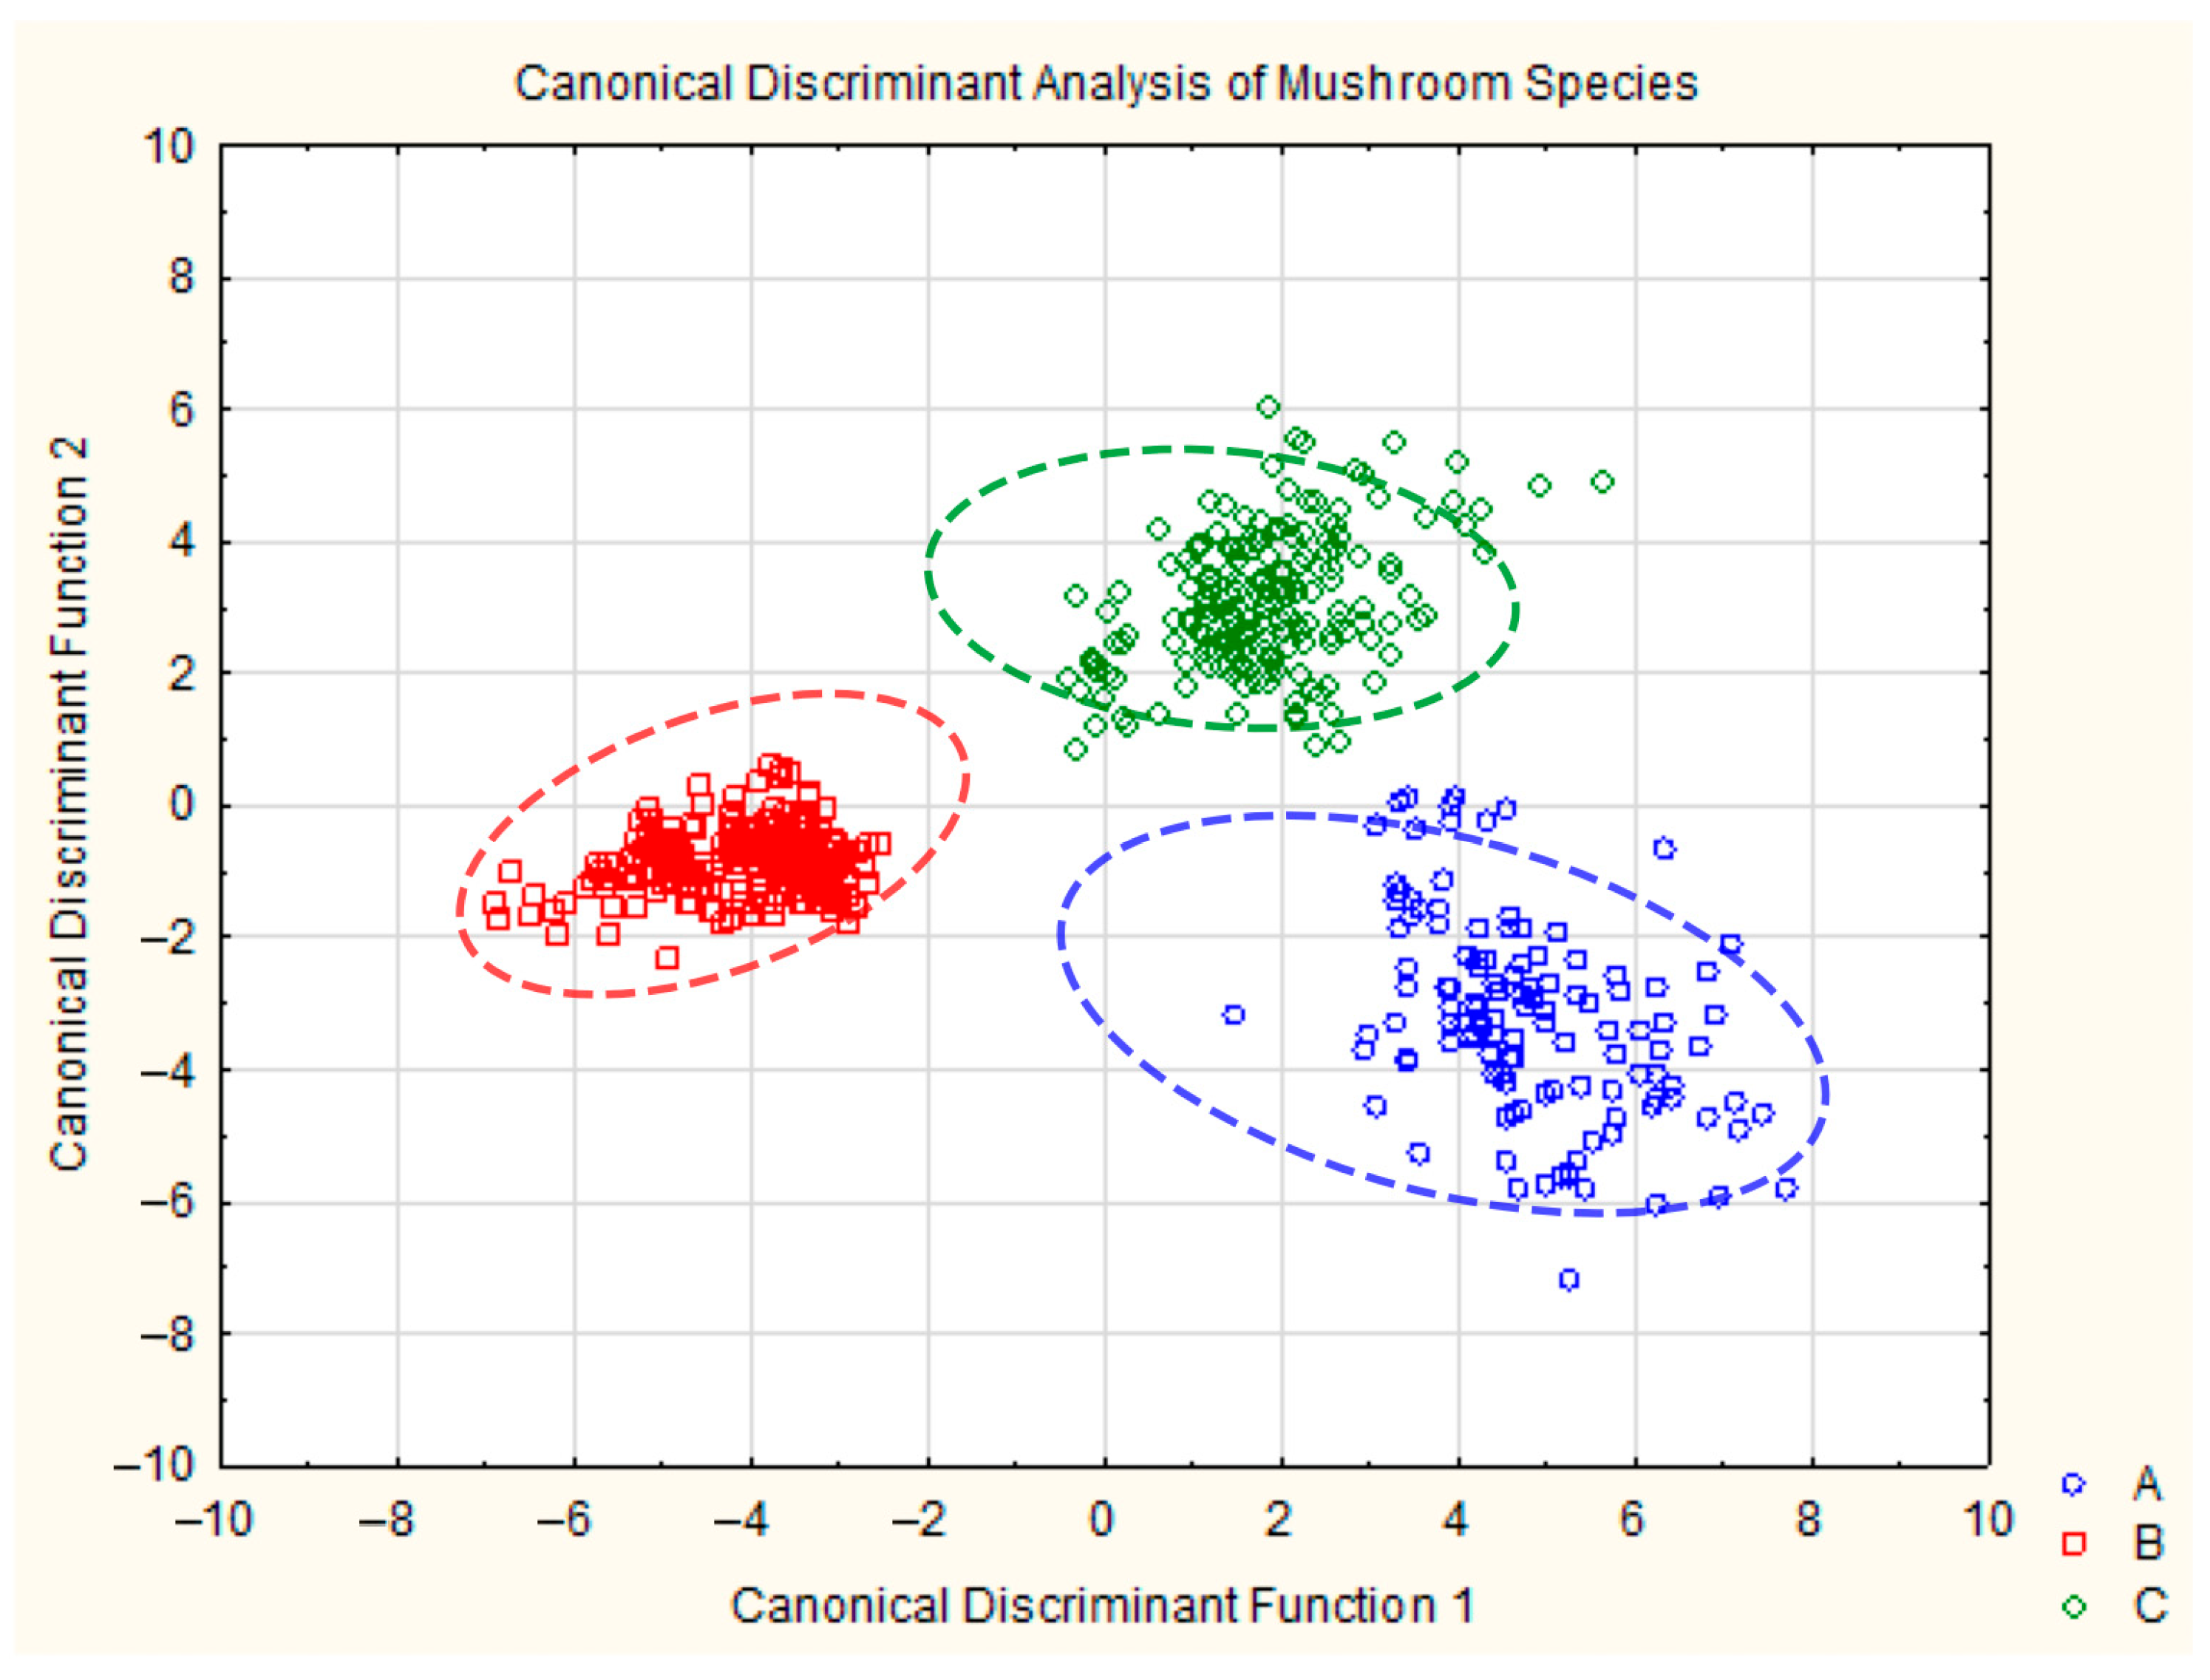
| Group | p-Value | Correct Percent | A | B | C |
|---|---|---|---|---|---|
| A | p = 0.22430 | 98.33 | 118 | 0 | 2 |
| B | p = 0.42243 | 100.00 | 0 | 226 | 0 |
| C | p = 0.35327 | 100.00 | 0 | 0 | 189 |
| total | 99.63 | 118 | 226 | 191 |
Disclaimer/Publisher’s Note: The statements, opinions and data contained in all publications are solely those of the individual author(s) and contributor(s) and not of MDPI and/or the editor(s). MDPI and/or the editor(s) disclaim responsibility for any injury to people or property resulting from any ideas, methods, instructions or products referred to in the content. |
© 2025 by the authors. Licensee MDPI, Basel, Switzerland. This article is an open access article distributed under the terms and conditions of the Creative Commons Attribution (CC BY) license (https://creativecommons.org/licenses/by/4.0/).
Share and Cite
Wróblewski, T.; Kamińska, A.; Włodarkiewicz, A. Studies on the Emission of Volatile Organic Compounds from Selected Forest Mushrooms of the Genus Lactarius Using Proton-Transfer Reaction Mass Spectrometry. Molecules 2025, 30, 3000. https://doi.org/10.3390/molecules30143000
Wróblewski T, Kamińska A, Włodarkiewicz A. Studies on the Emission of Volatile Organic Compounds from Selected Forest Mushrooms of the Genus Lactarius Using Proton-Transfer Reaction Mass Spectrometry. Molecules. 2025; 30(14):3000. https://doi.org/10.3390/molecules30143000
Chicago/Turabian StyleWróblewski, Tomasz, Anna Kamińska, and Agnieszka Włodarkiewicz. 2025. "Studies on the Emission of Volatile Organic Compounds from Selected Forest Mushrooms of the Genus Lactarius Using Proton-Transfer Reaction Mass Spectrometry" Molecules 30, no. 14: 3000. https://doi.org/10.3390/molecules30143000
APA StyleWróblewski, T., Kamińska, A., & Włodarkiewicz, A. (2025). Studies on the Emission of Volatile Organic Compounds from Selected Forest Mushrooms of the Genus Lactarius Using Proton-Transfer Reaction Mass Spectrometry. Molecules, 30(14), 3000. https://doi.org/10.3390/molecules30143000