
Geographic Influence and Metabolomics-Driven Discovery of 5-Alpha Reductase Inhibitors in Tectona grandis L.f. (Teak) Leaves

 ,
,  , , , , , and
Abstract
1. Introduction
2. Results and Discussion
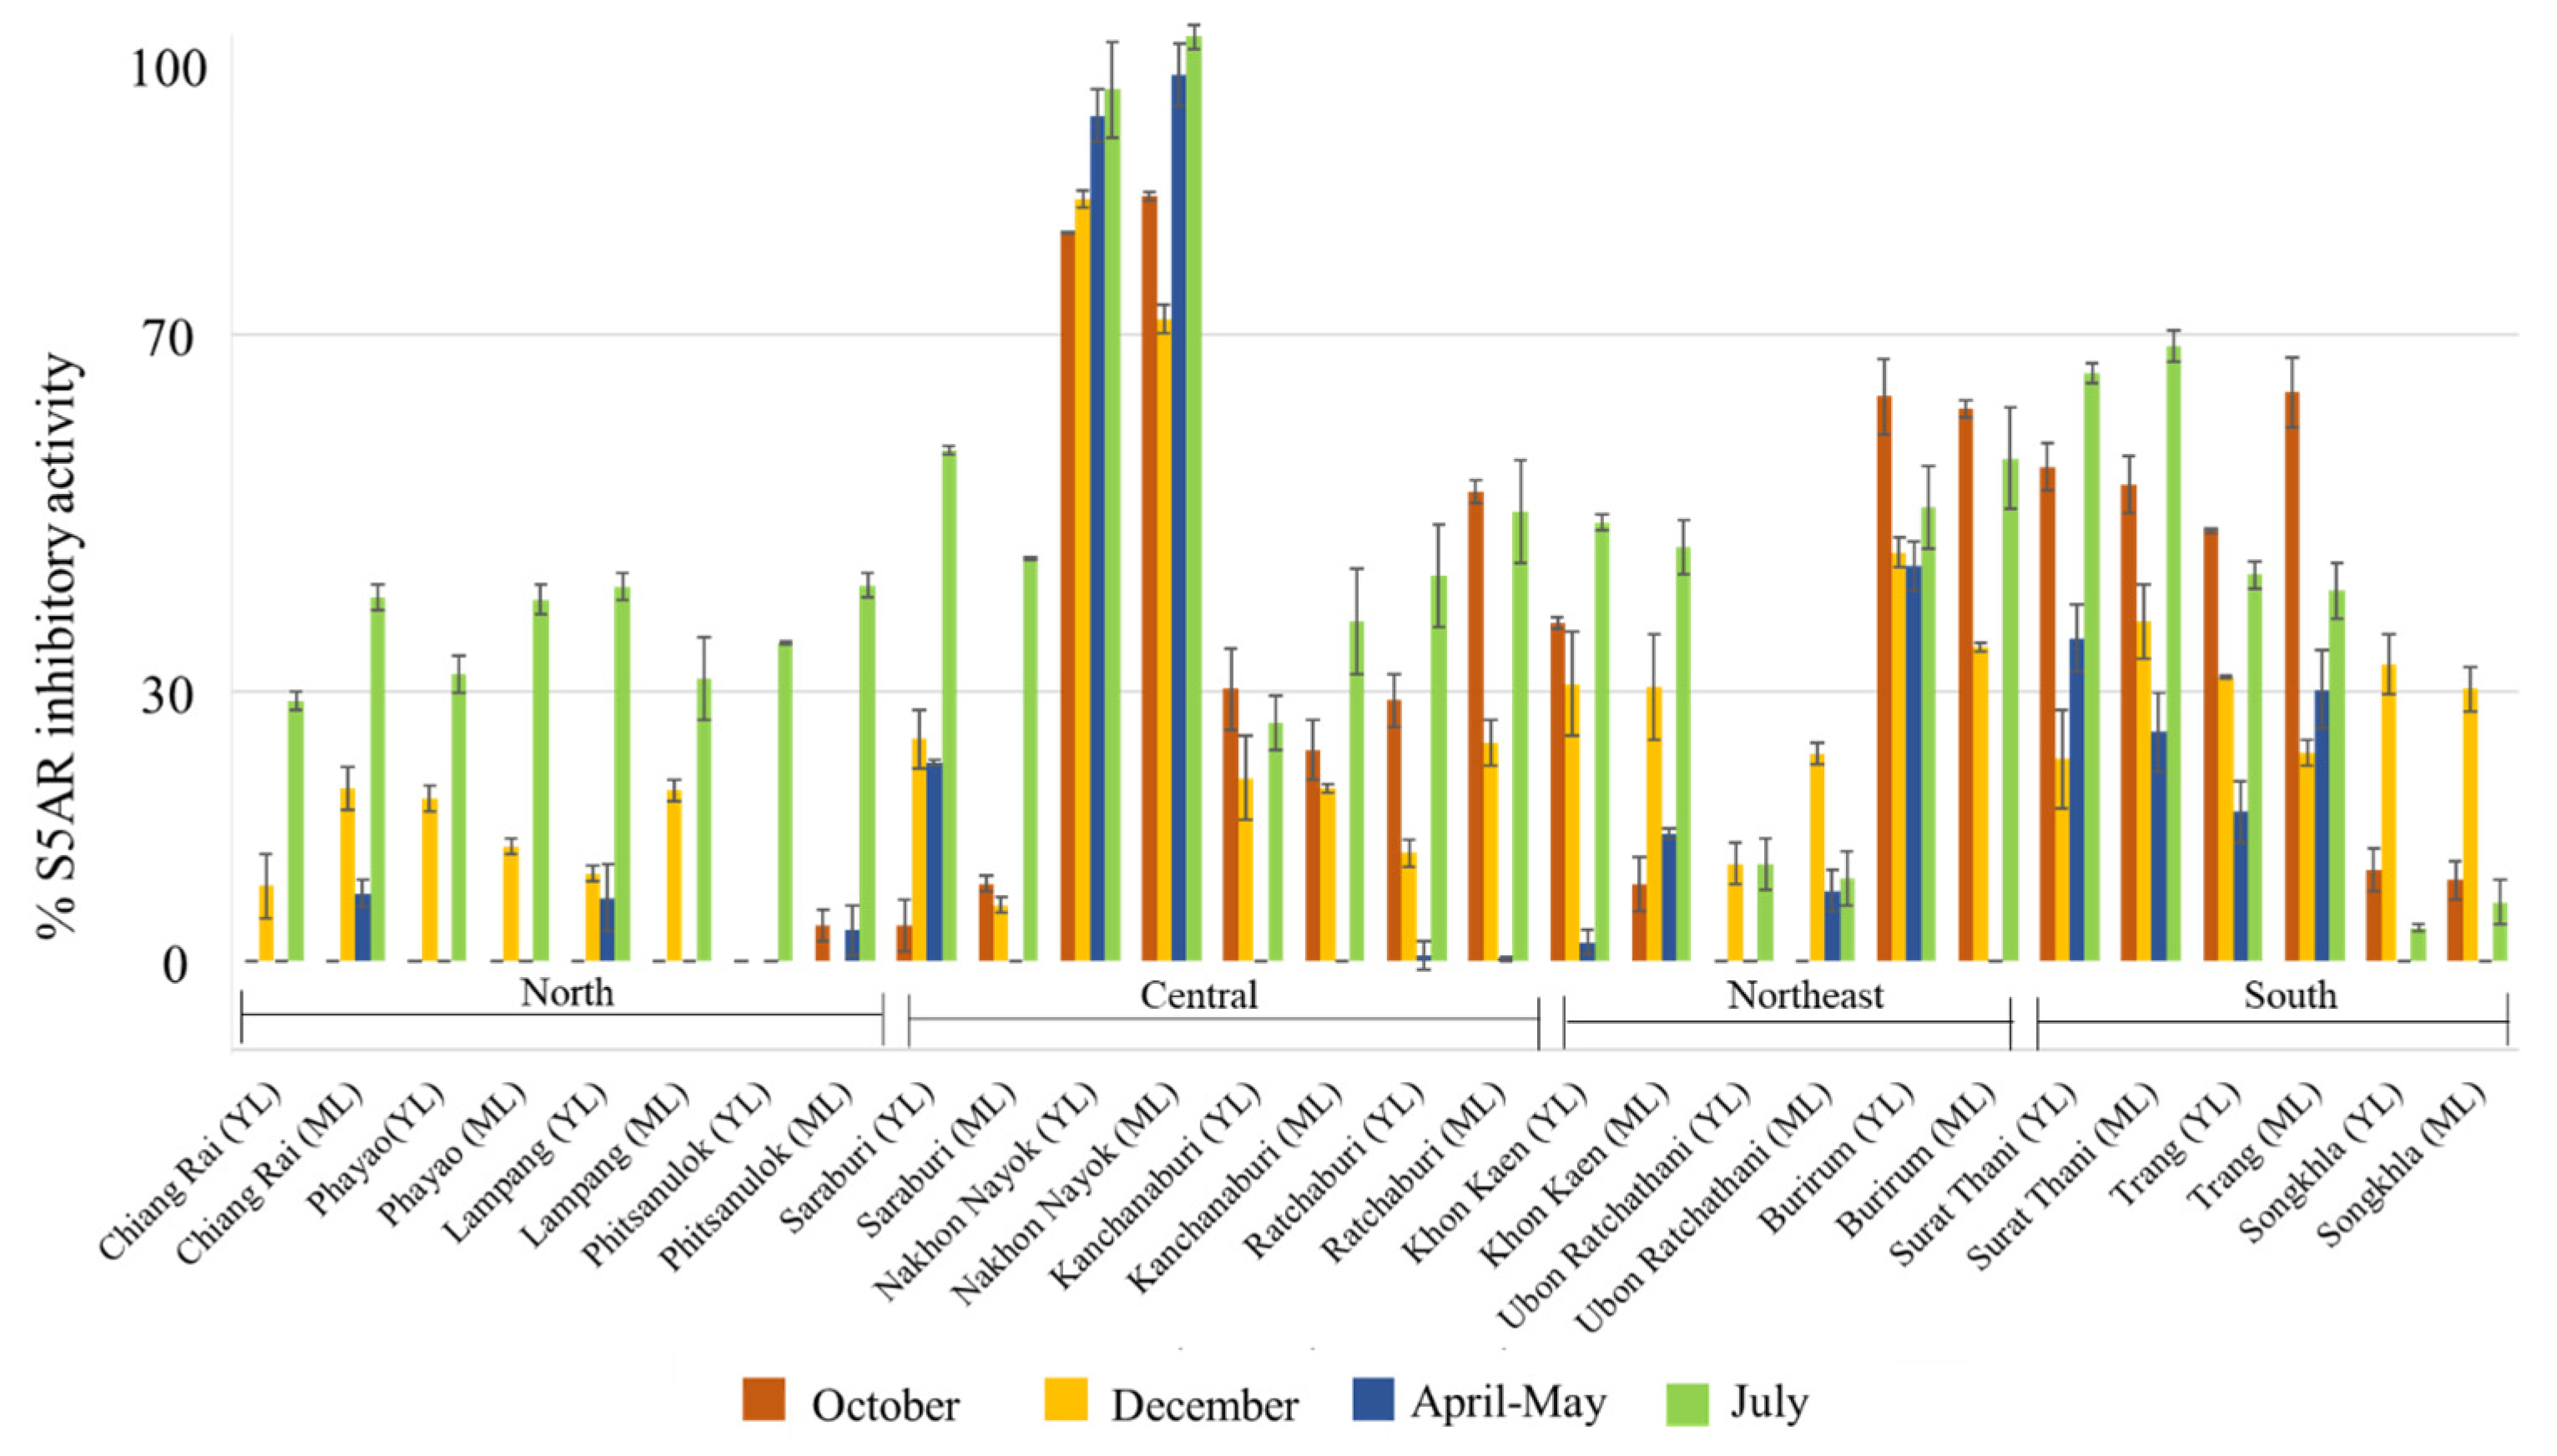
2.1. Investigation of Steroid 5-Alpha Reductase Inhibitory Activity of Samples
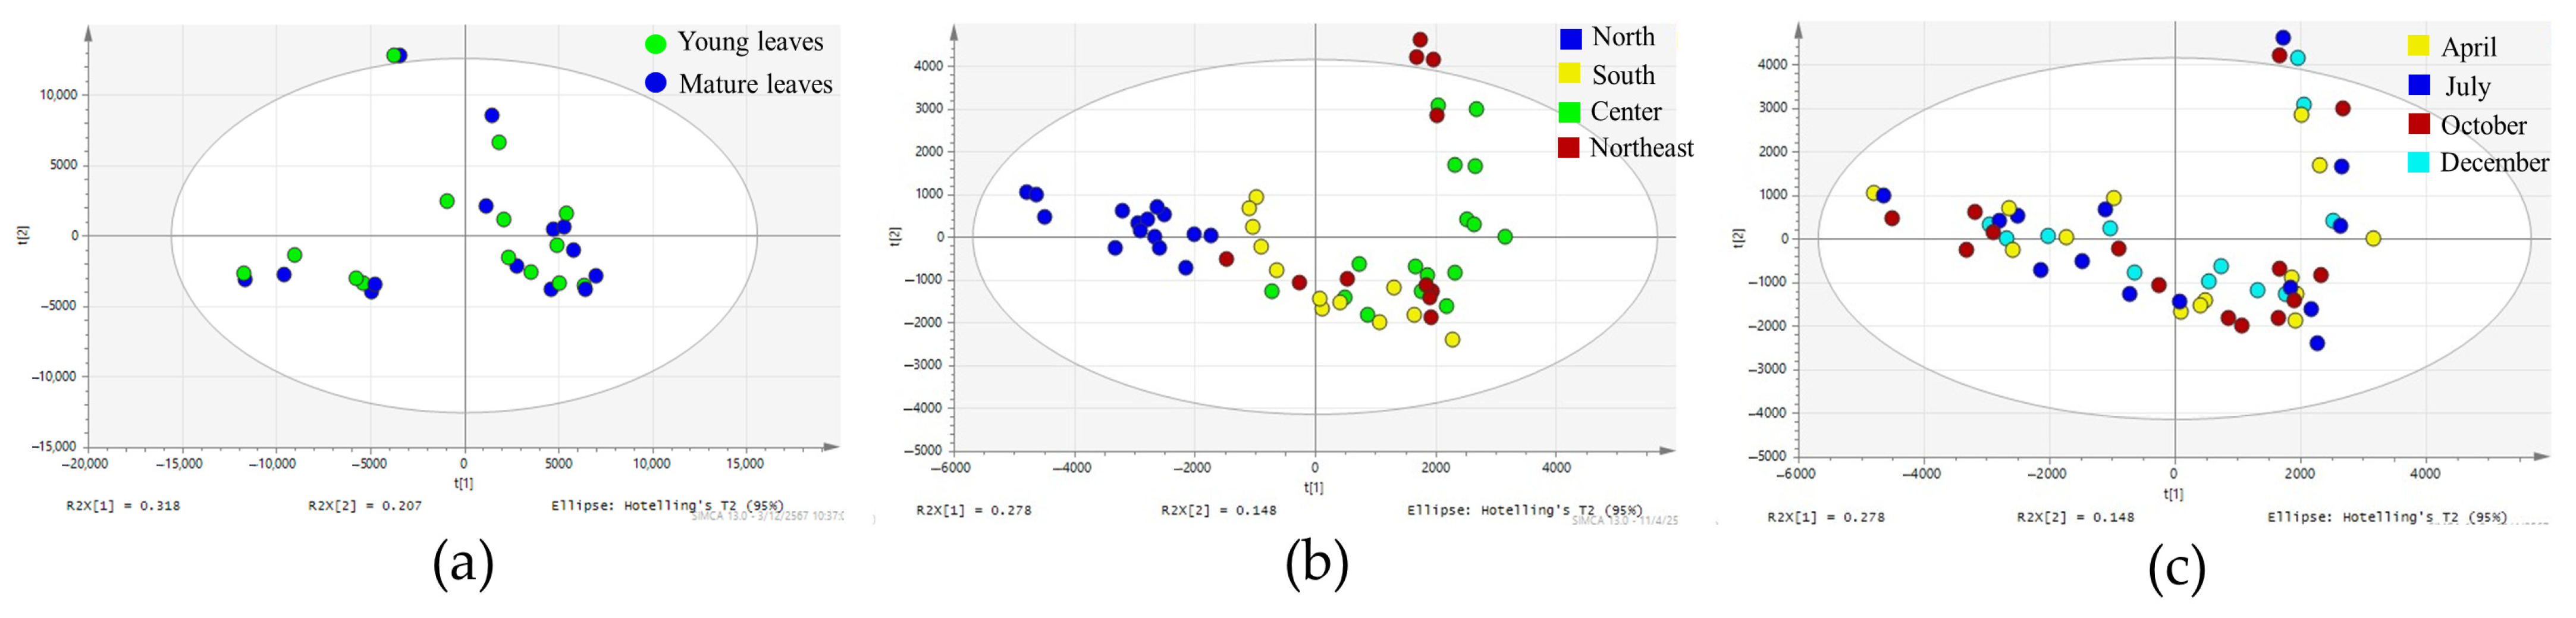
2.2. Investigation of Influence of Different Leaf Ages, Regions, and Harvesting Periods on Chemical Profiles of Teak Leaves Using Principal Component Analysis
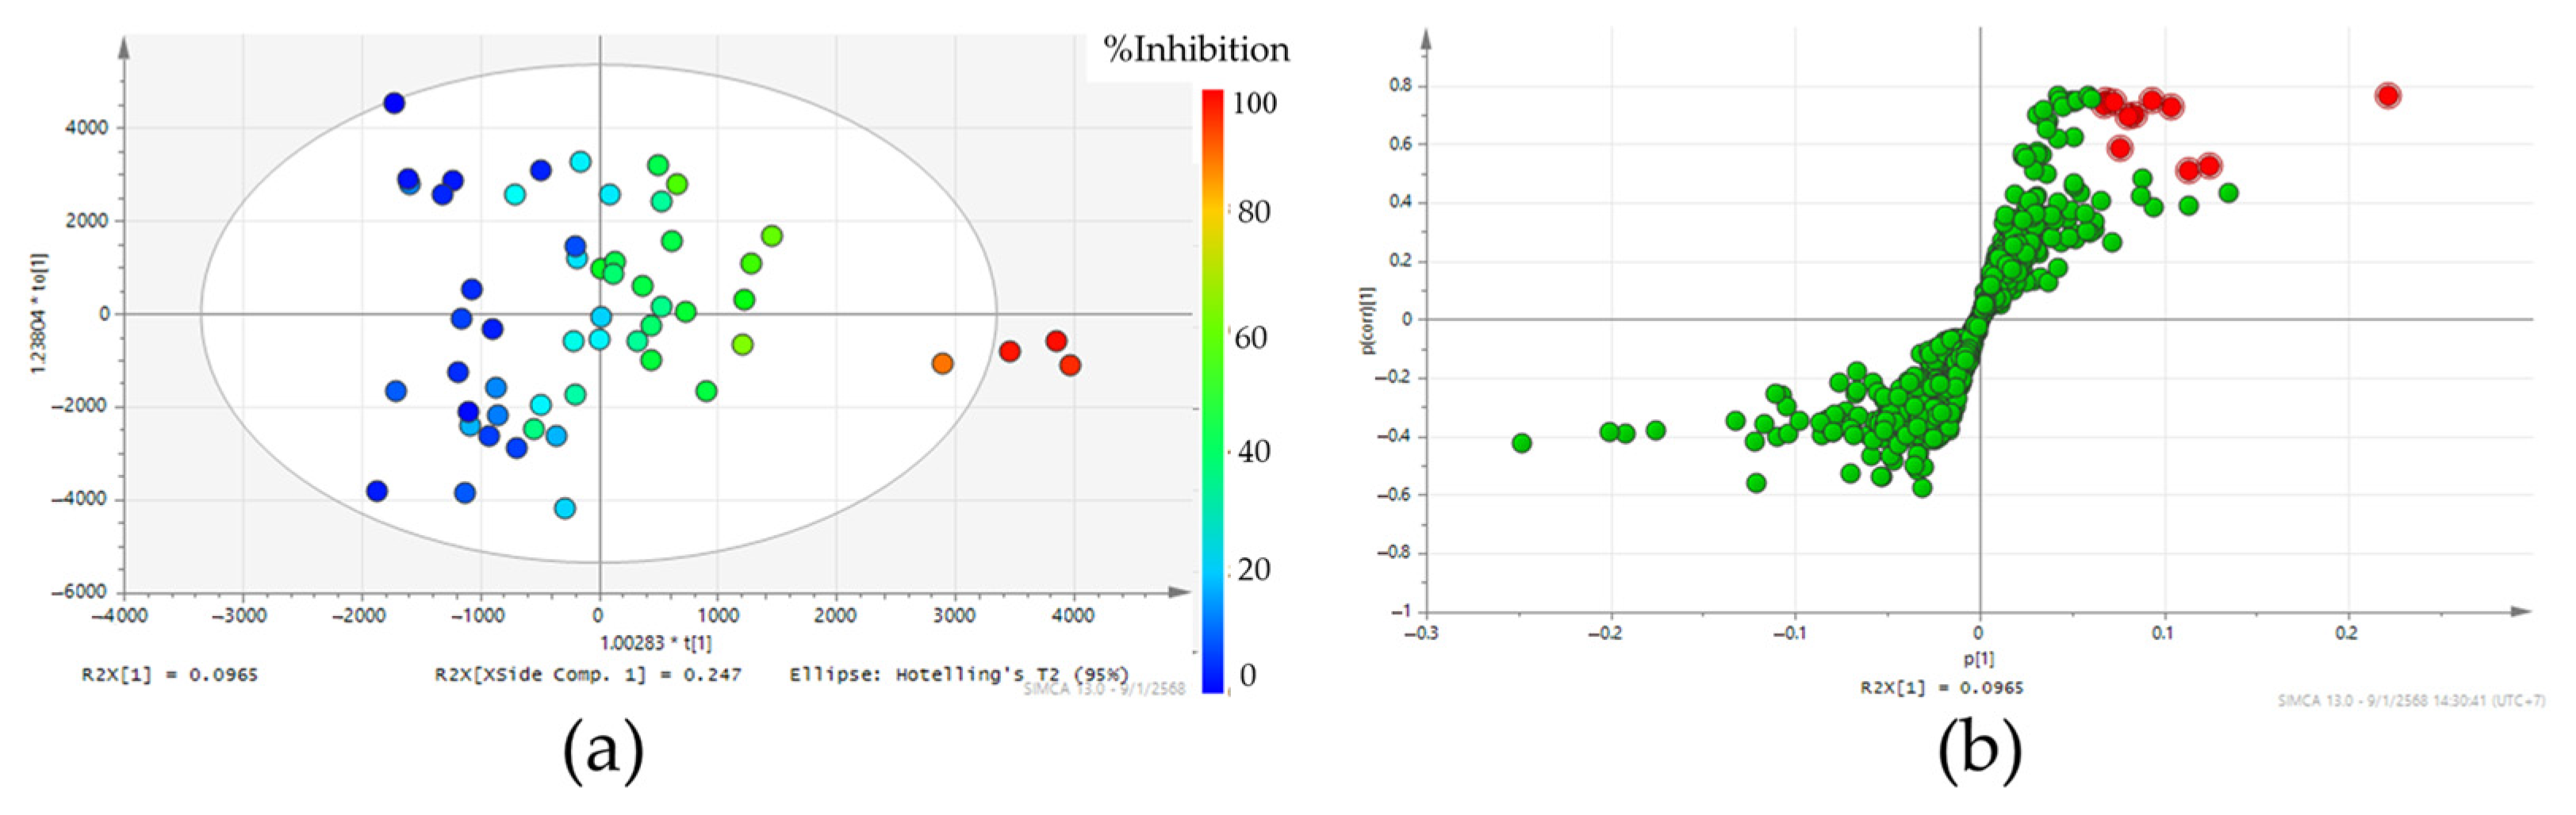
2.3. The Navigation of Steroid 5 Alpha-Reductase Inhibitors in Teak Leaf Extract Using the Orthogonal Partial Least Squares Model
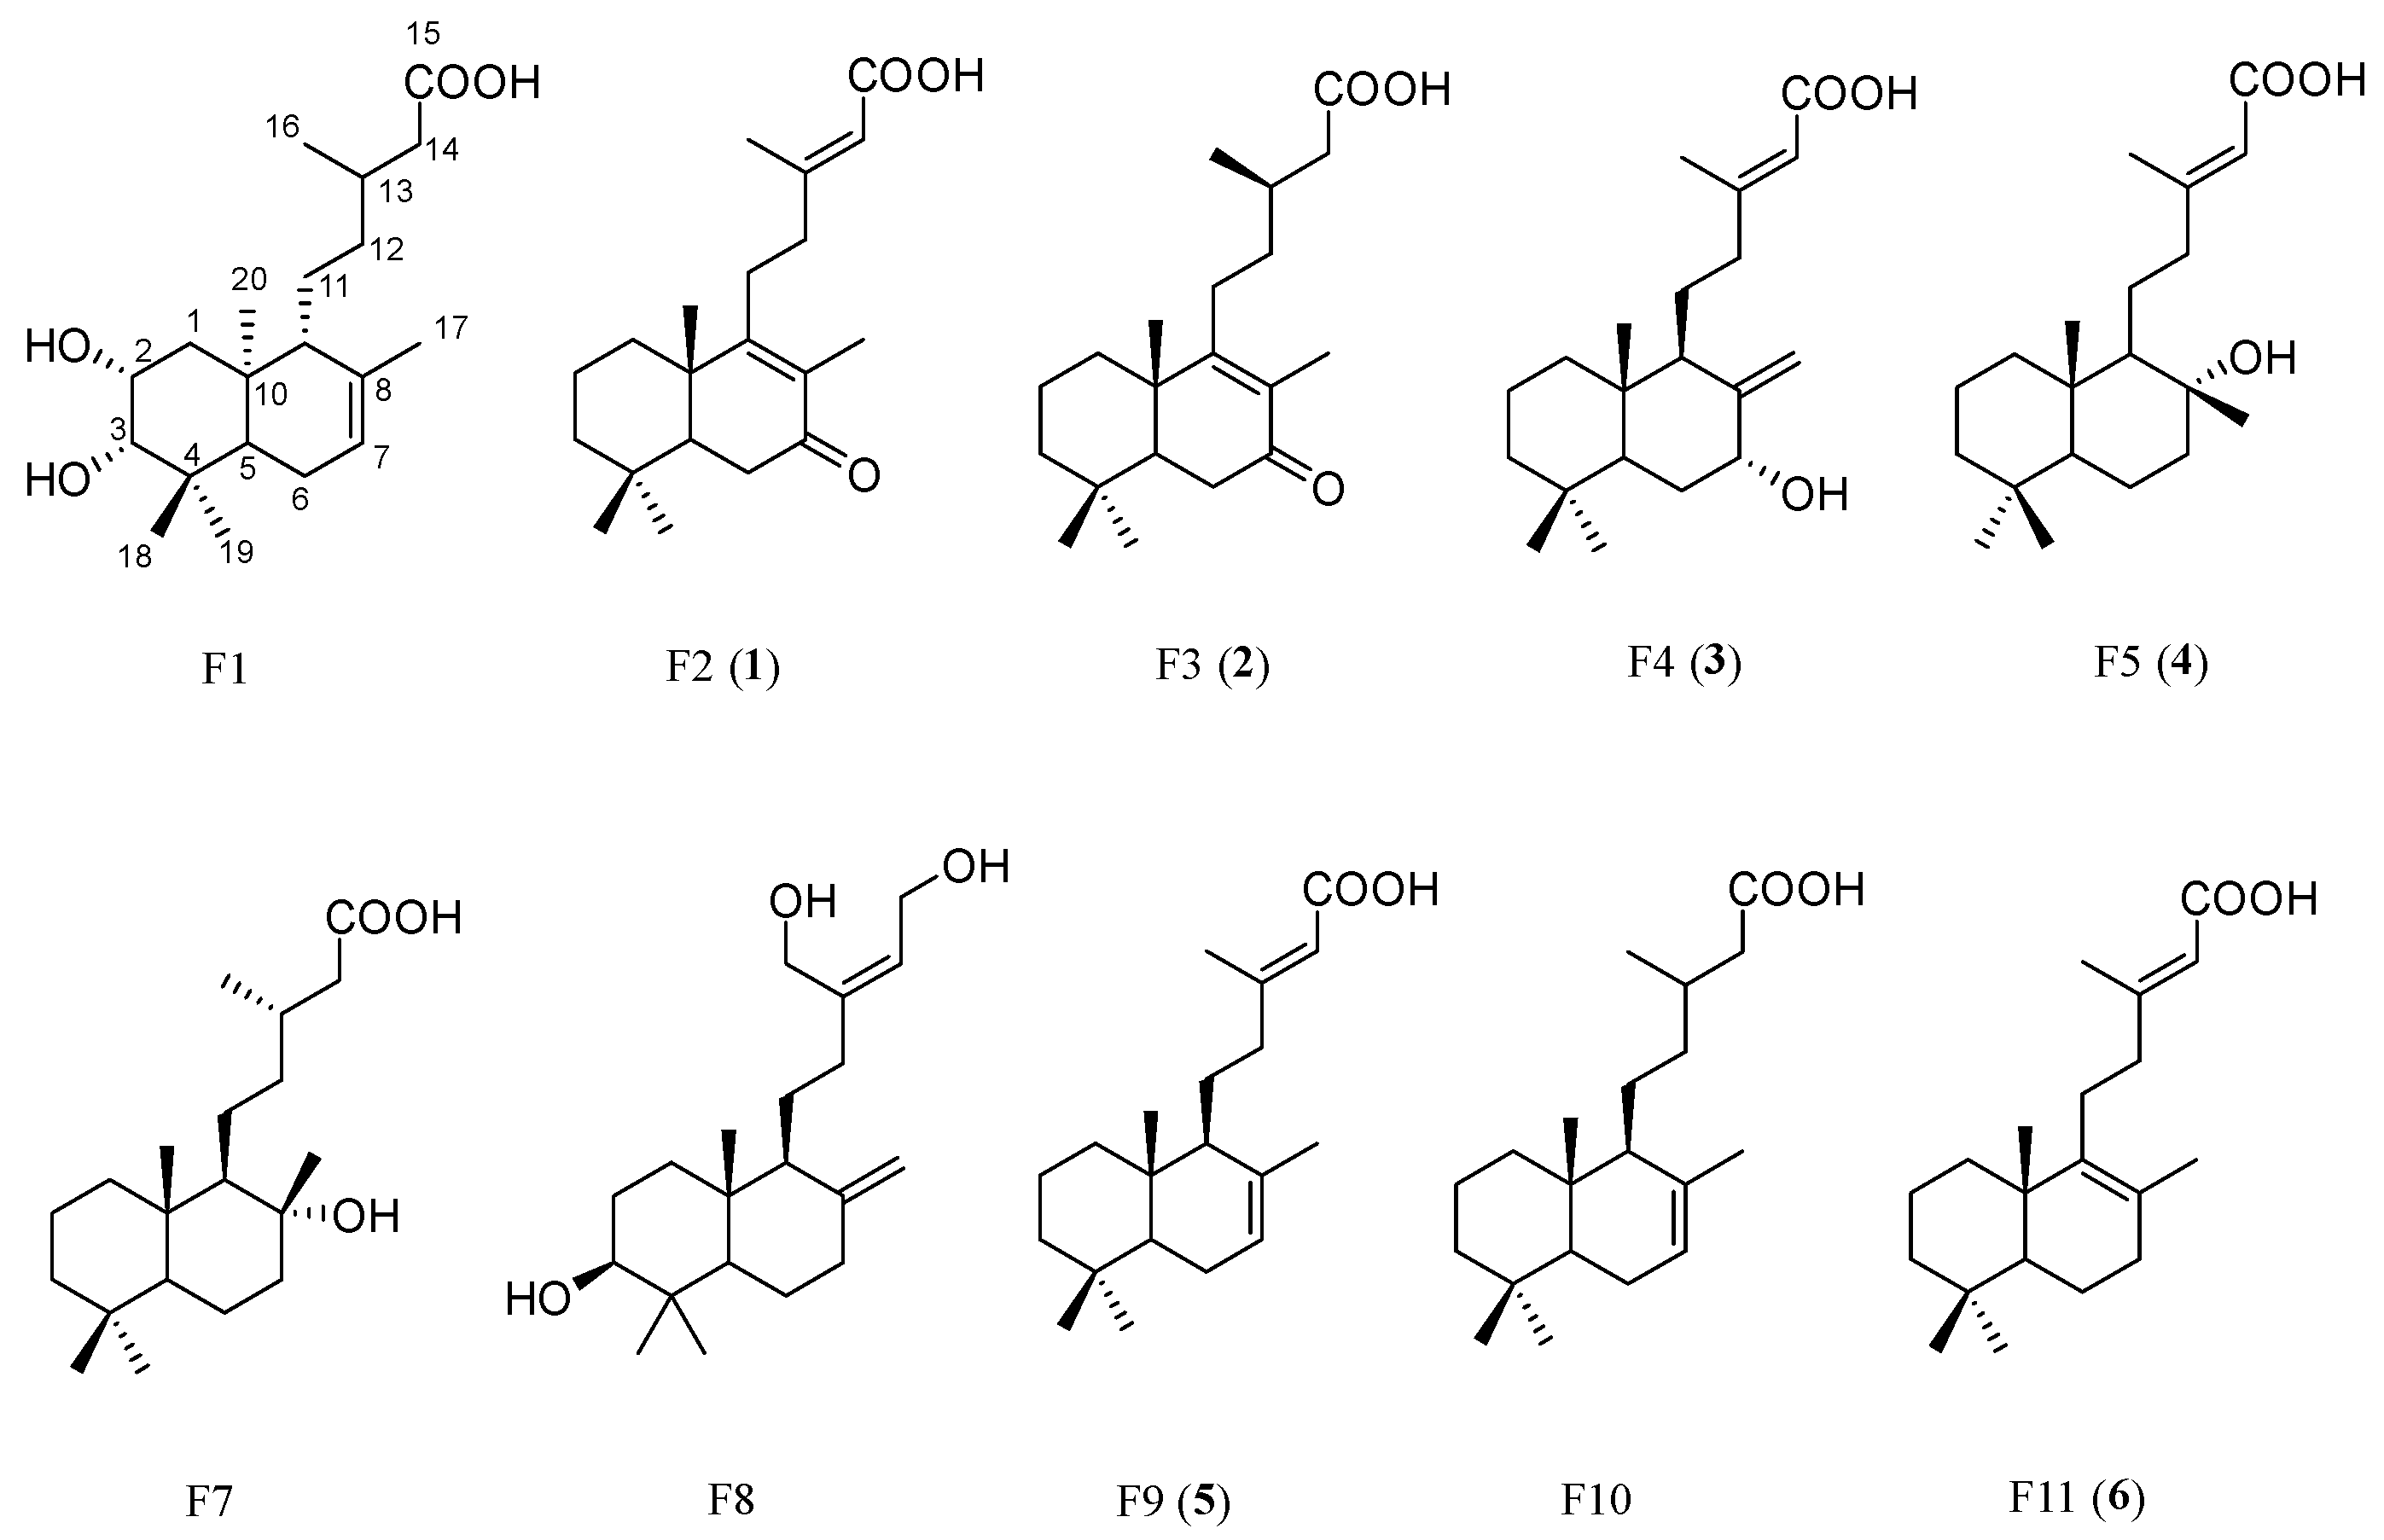
2.4. Identification of Candidate Compounds

| Feature | m/z | RT (min) | P[1] Value | P(corr)[1] Value | Proposed Molecular Formula | ∆ppm | Proposed Compound Identification by MSMS | S5AR Inhibitory Activity (IC50, µM) |
|---|---|---|---|---|---|---|---|---|
| F1 | 337.2391 | 6.83 | 0.104 | 0.728 | C20H34O4 | −1.98 | 2,3-Dihydroxy-labd-7-en-15-oic-acid [17] | ND |
| F2 | 317.2142 | 7.80 | 0.076 | 0.586 | C20H30O3 | −6.25 | Rhinocerotinoic acid (1) | 54.16 ± 1.73 |
| F3 | 319.2290 | 8.14 | 0.084 | 0.697 | C20H32O3 | −3.54 | 7-Oxo-8-labden-15-oic acid (2) | >300 * |
| F4 | 319.2290 | 8.86 | 0.067 | 0.732 | C20H32O3 | −3.54 | 7-Hydroxy-labd-8,13-dien-15-oic acid (3) | 21.93 ± 0.67 |
| F5 | 321.2445 | 9.47 | 0.080 | 0.695 | C20H34O3 | −3.06 | 8-Hydroxy-labd-13-en-15-oic acid (4) | 58.17 ± 0.62 |
| F6 | 359.2362 | 10.2 | 0.093 | 0.750 | C20H36O3 [H + Cl]− | 0.98 | Labdanolic acid (Cl adduct of F.7) | ND |
| F7 | 323.2601 | 10.2 | 0.227 | 0.766 | C20H36O3 | −2.88 | Labdanolic acid [19] | ND |
| F8 | 321.2449 | 10.9 | 0.072 | 0.744 | C20H34O3 | −3.06 | Tectograndiol [21] | ND |
| F9 | 303.2340 | 15.2 | 0.114 | 0.511 | C20H32O2 | −3.44 | (+)-Eperua-7,13-dien-15-oic acid (5) [7] | 14.65 ± 0.31 [7] |
| F10 | 305.2498 | 15.5 | 0.125 | 0.524 | C20H34O2 | −3.92 | Labd-7-en-15-oic acid [24] | ND |
| F11 | 303.2341 | 15.5 | 0.069 | 0.748 | C20H32O2 | −3.45 | (+)-Eperua-8,13-dien-15-oic acid (6) [7] | 14.19 ± 2.87 [7] |
| Curcumin | 92.73 ± 0.14% ** 13.4 ± 0.40 [26] *** | |||||||
| Finasteride | 0.76 ± 0.03 [26] *** | |||||||
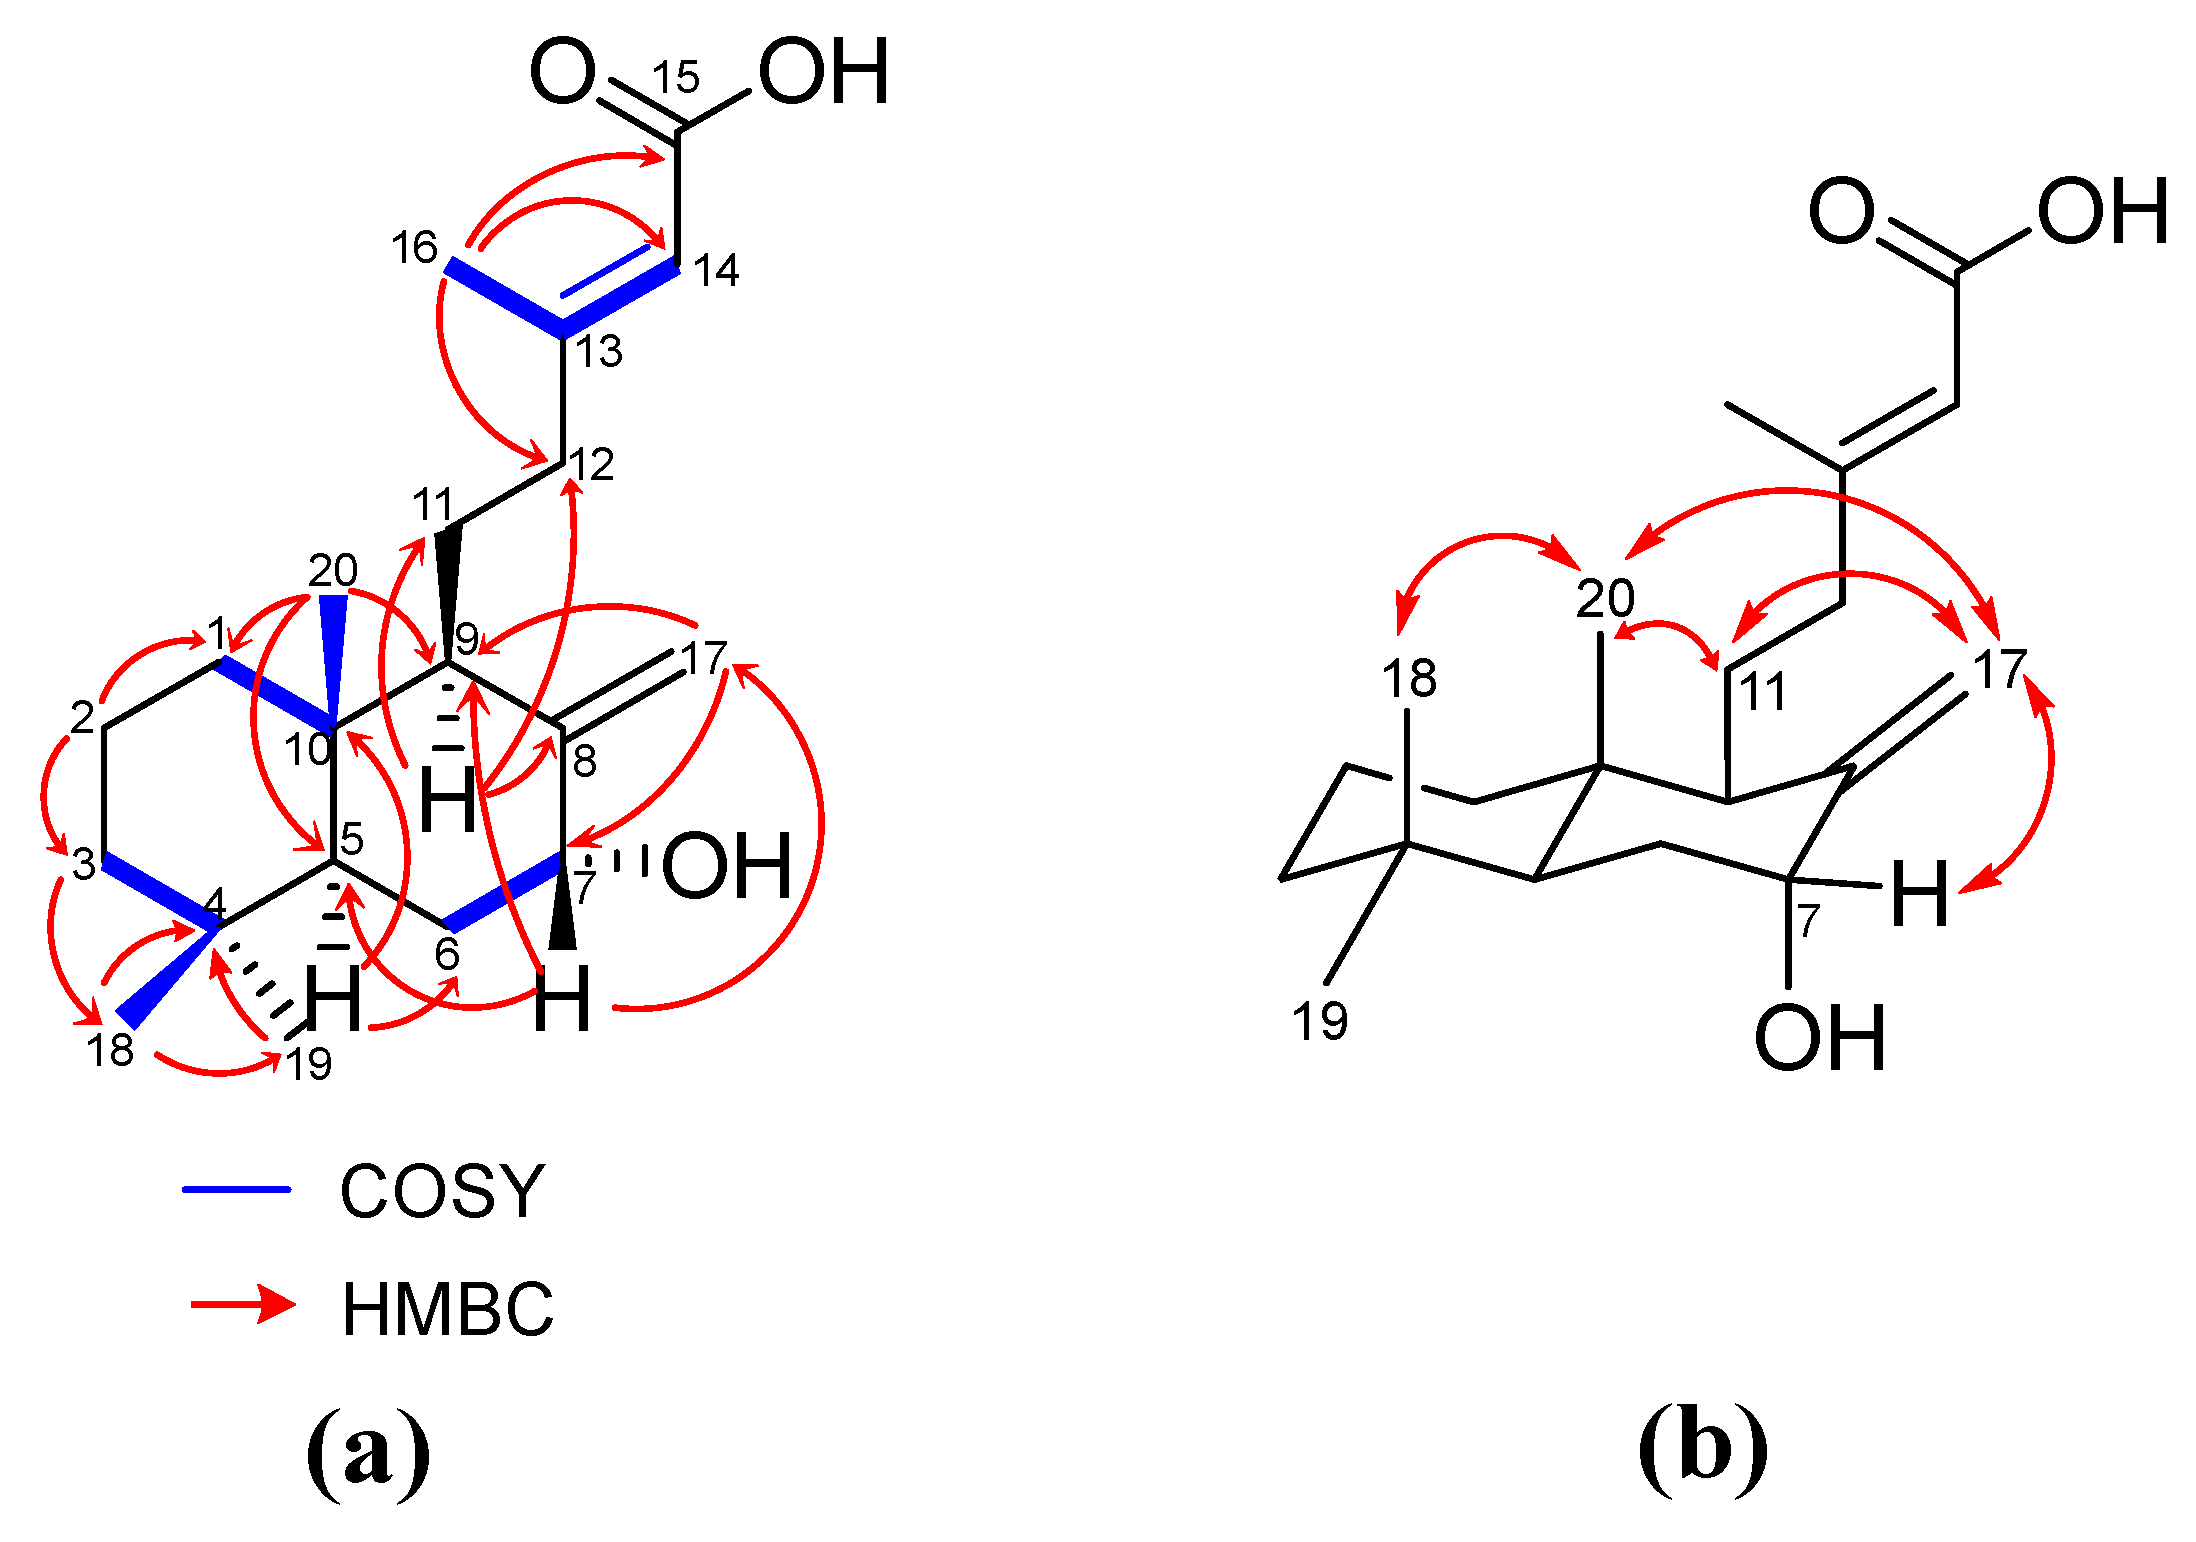
Isolation and Structure Elucidation of Compounds 1–4
2.5. Evaluation of Steroid 5-Alpha Reductase Inhibitory Activity of Identified Compounds
3. Materials and Methods
3.1. General Experiment Procedures
3.2. Plant Materials
3.3. Bioactive Compound Extraction
3.4. Investigation of Chemical Profiles Using LC-MS
3.5. Determination of Steroid 5-Alpha Reductase Inhibitory Activity
3.6. Multivariate Analysis
3.7. Targeted Purification of Candidate S5AR Inhibitors
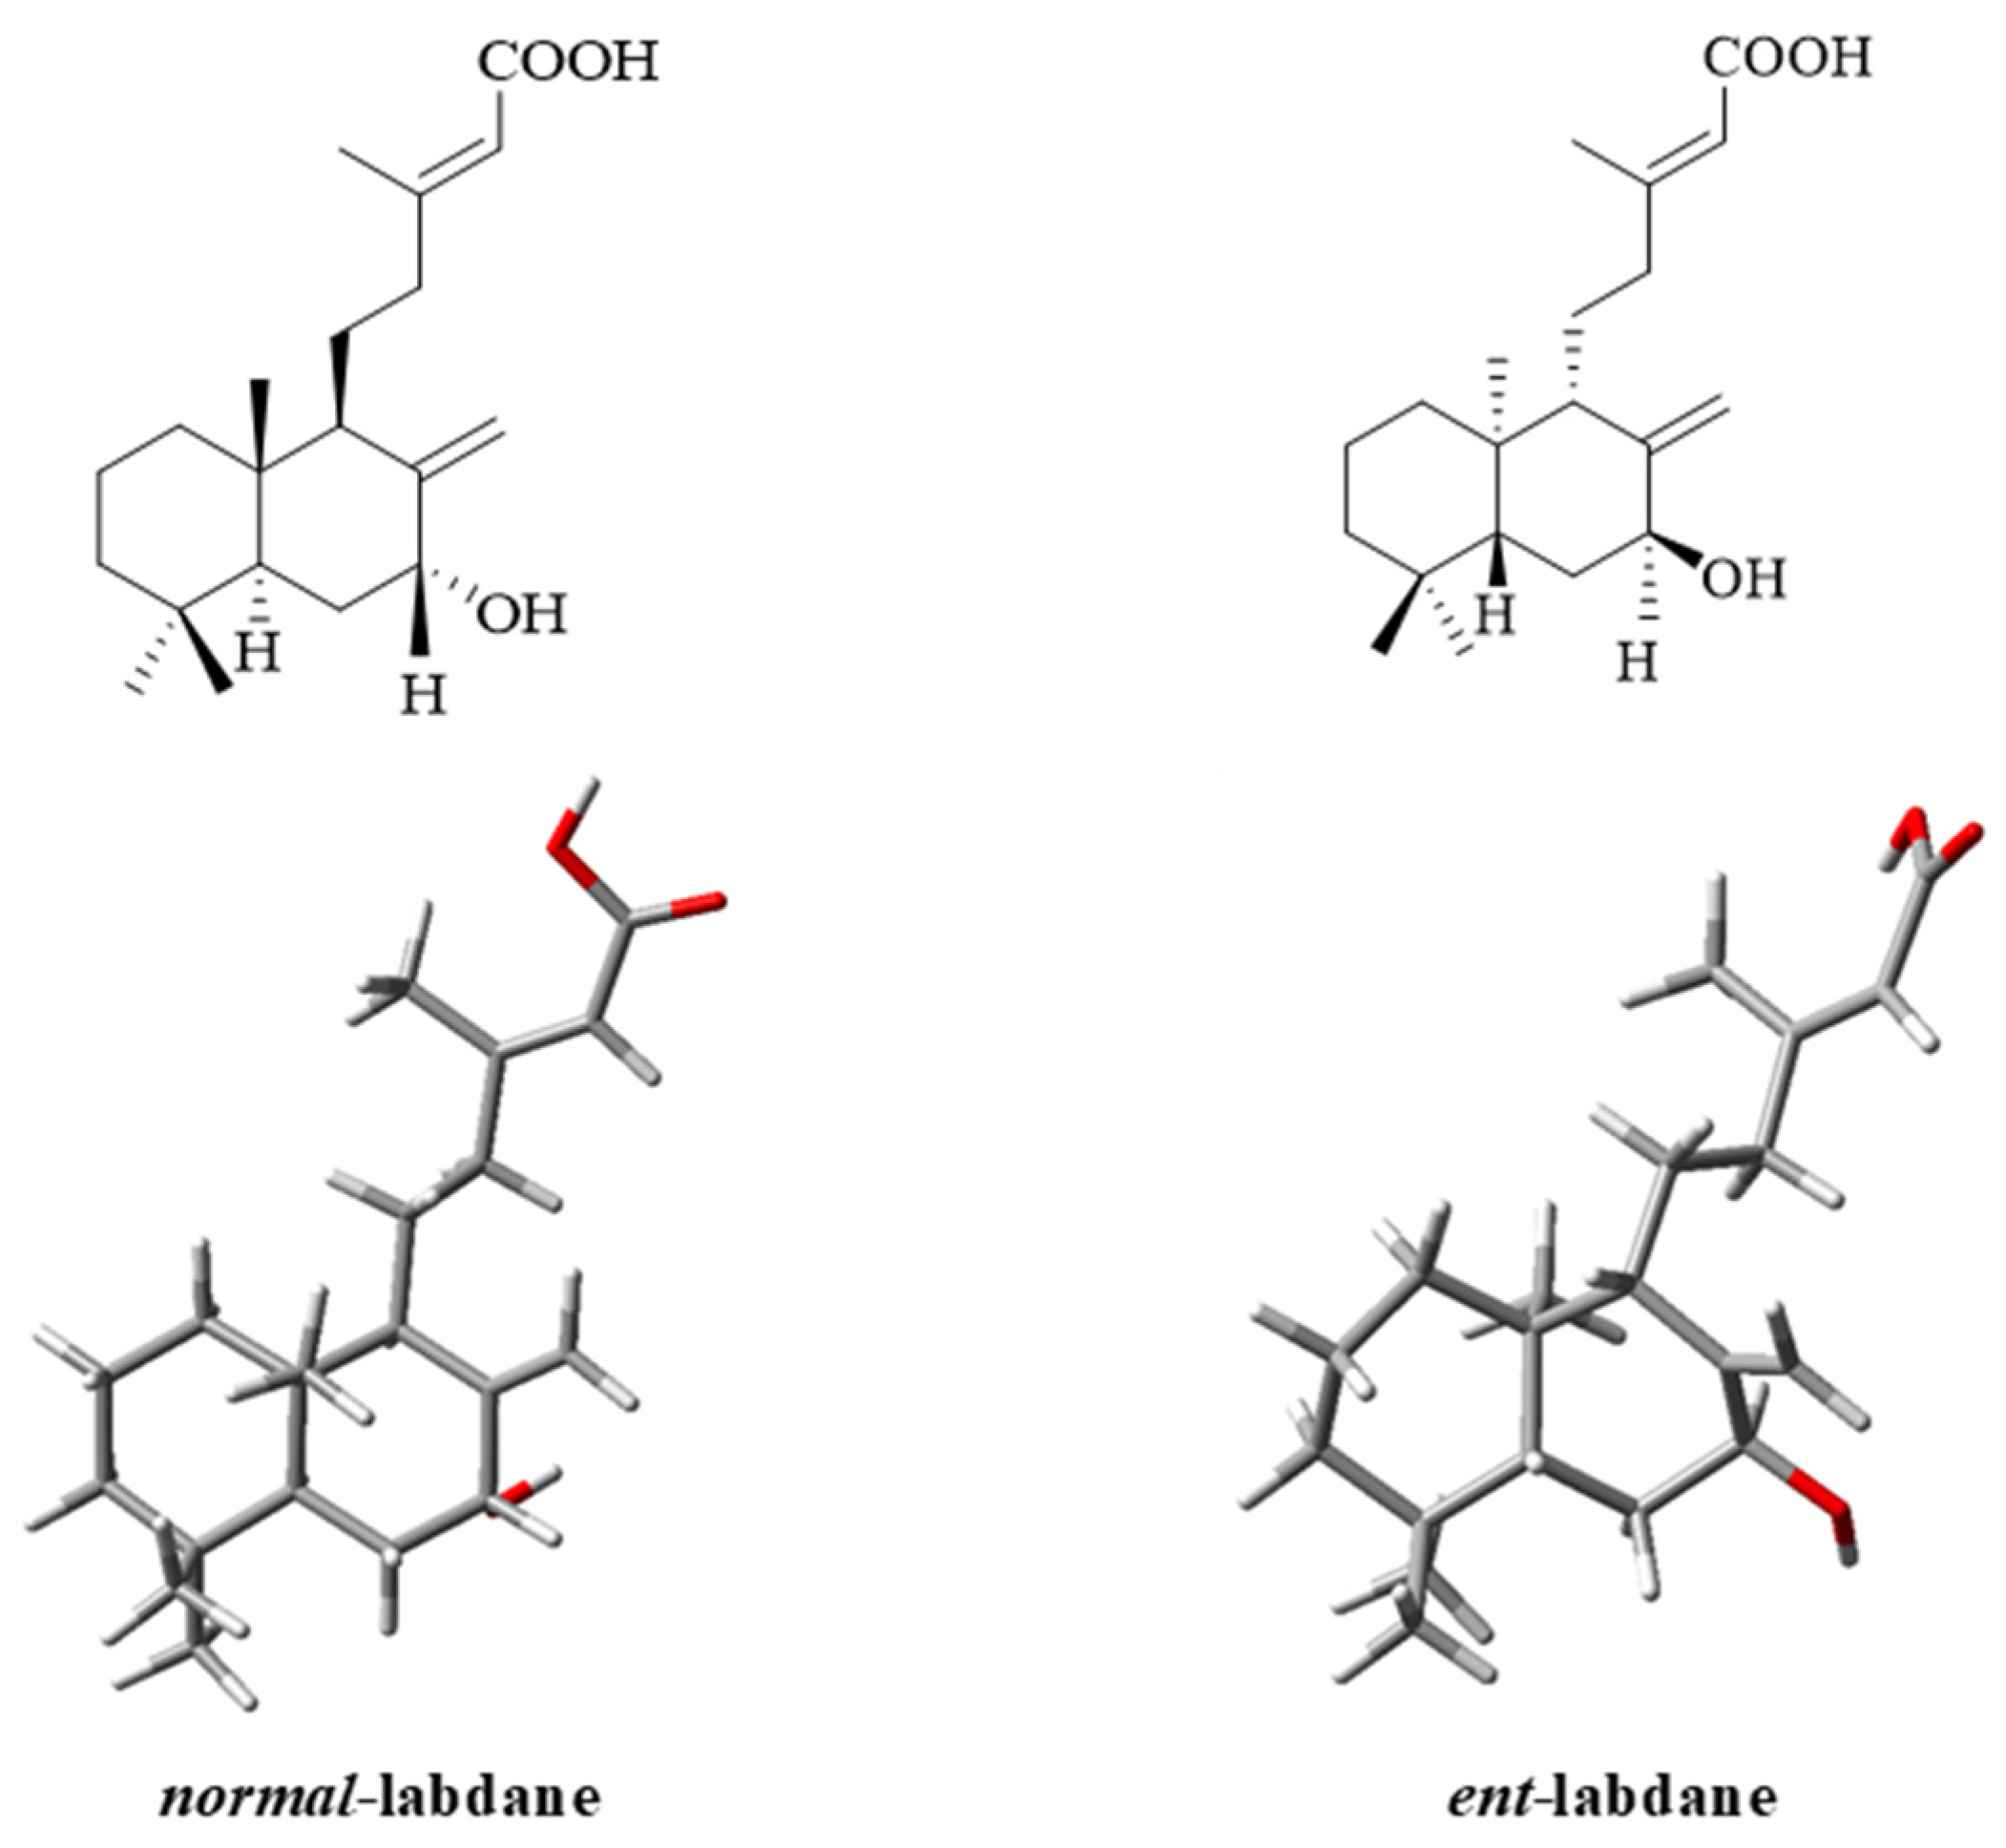
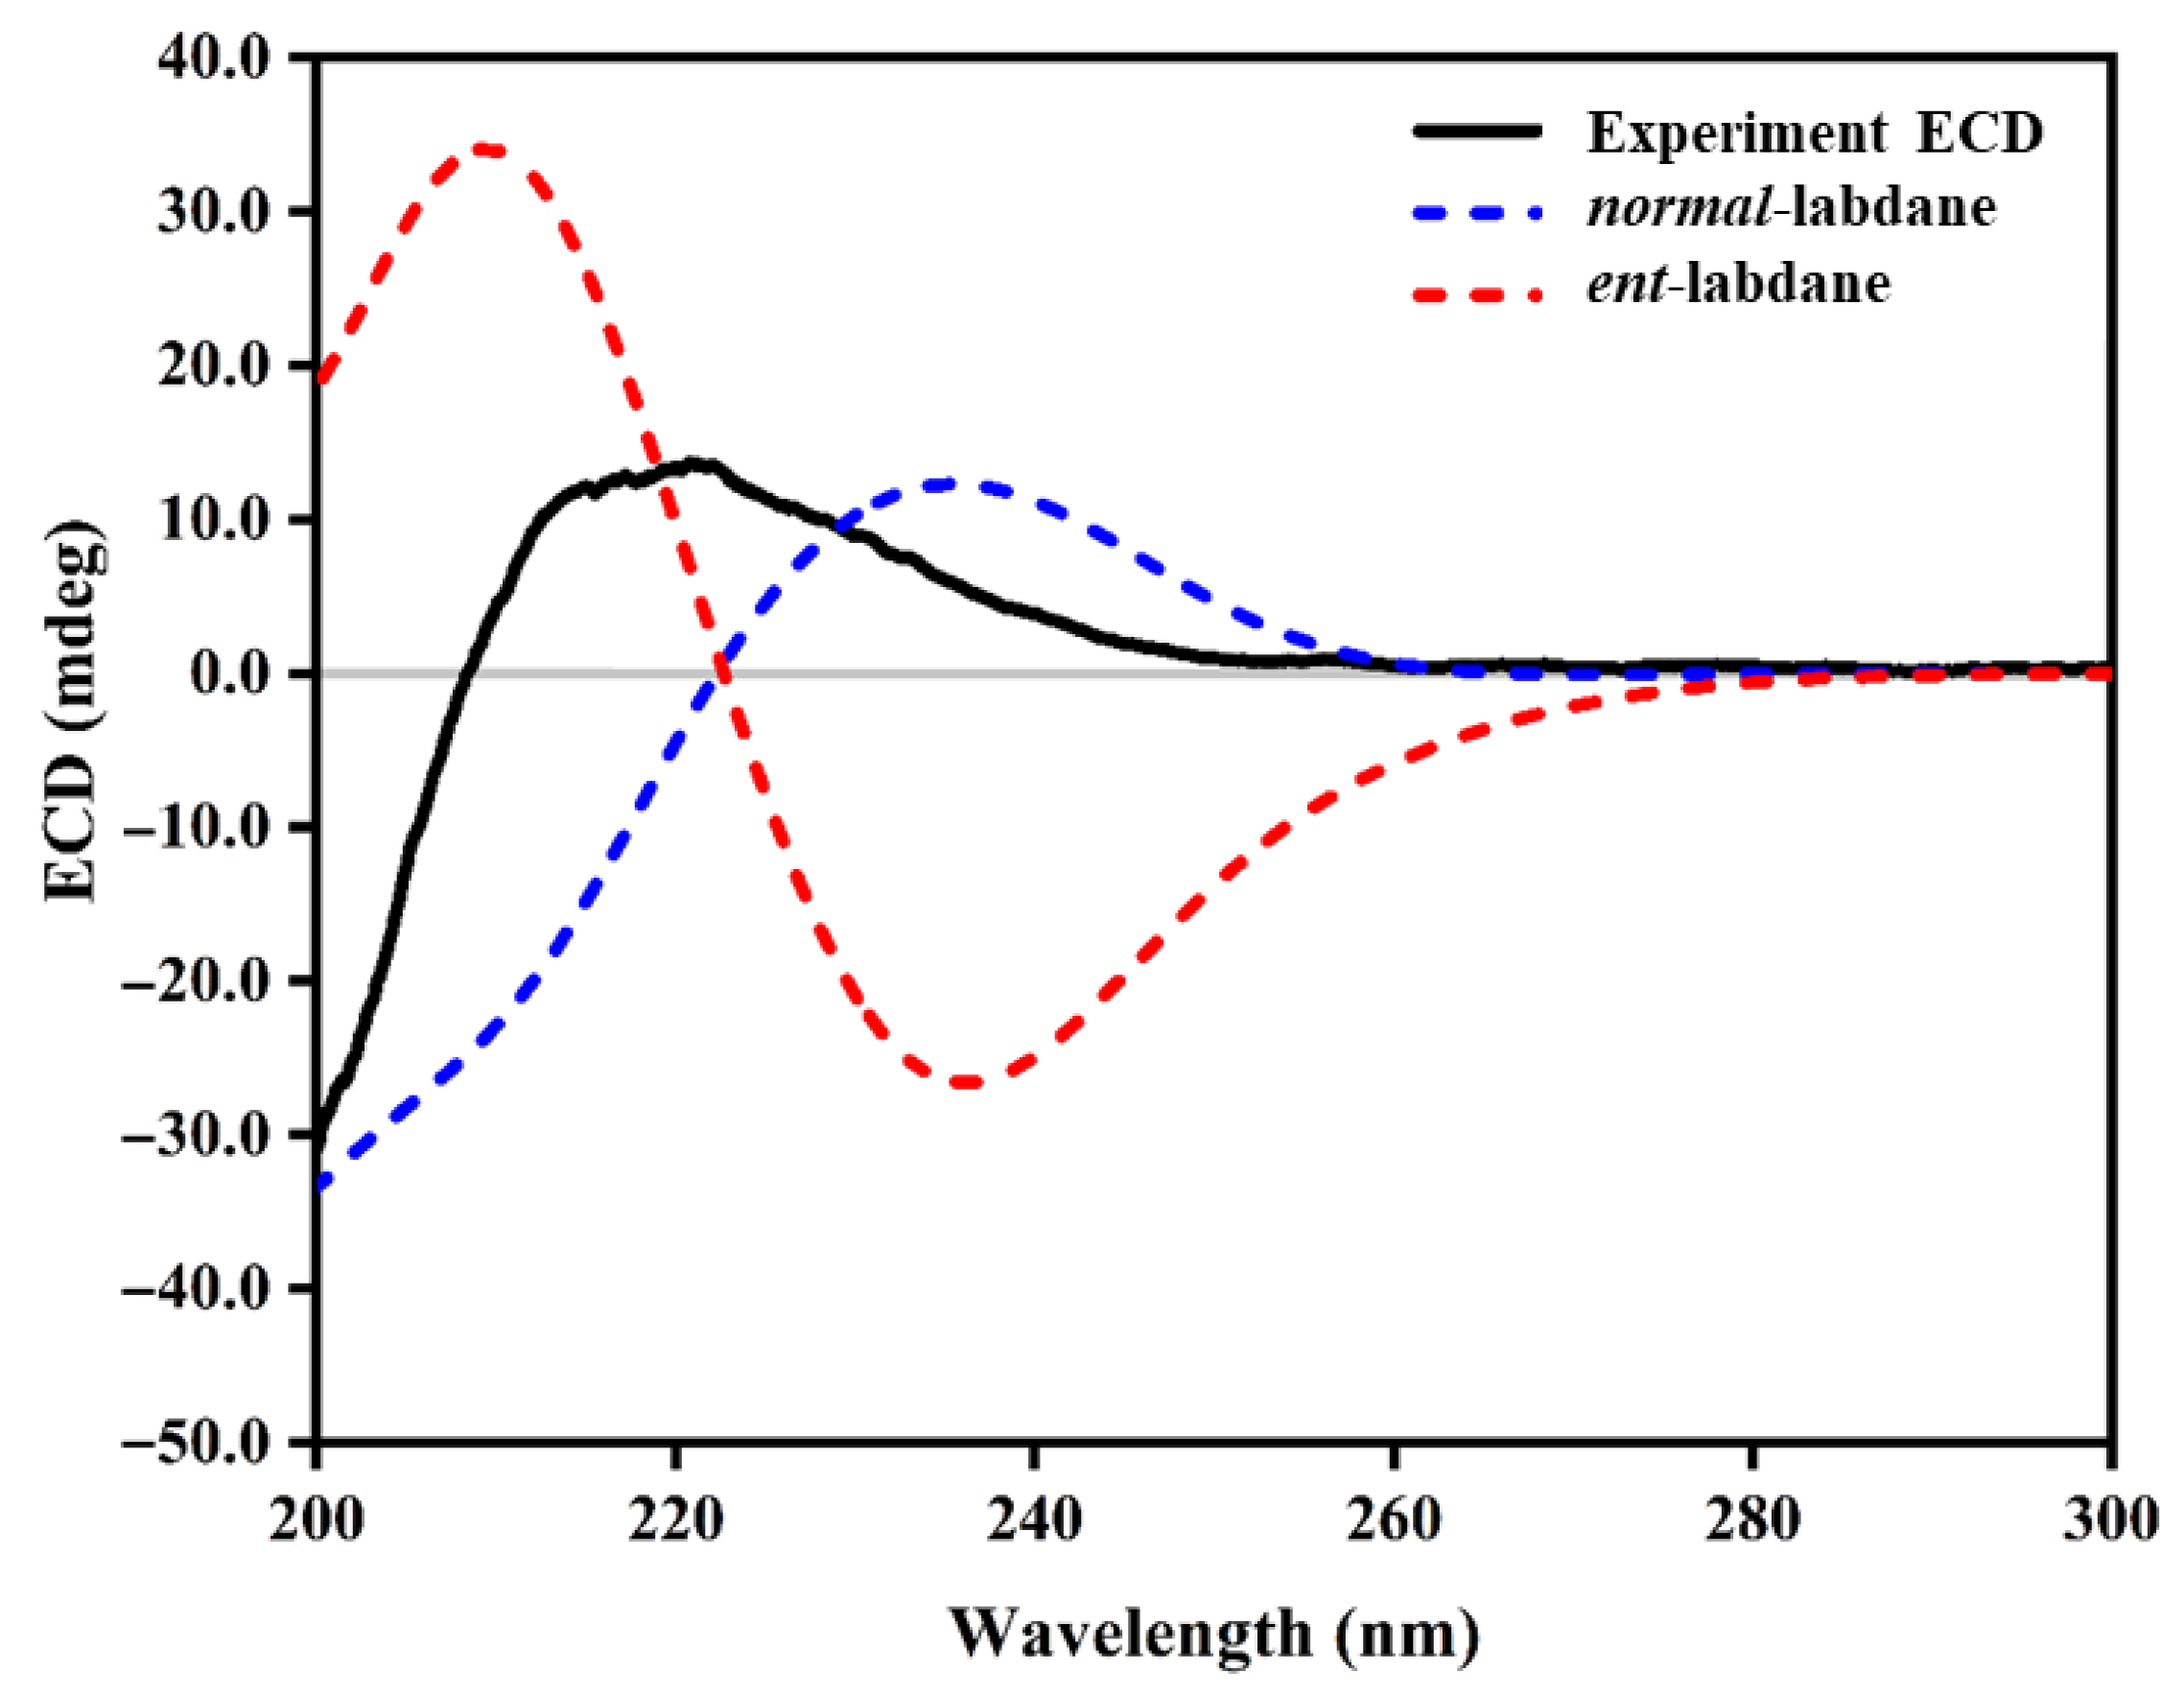
- 7-hydroxy-labd-8,13-dien-15-oic acid (3): an amorphous light-yellow solid; [] −71.4 (c 0.7, MeOH); UV (ACN) λmax (log ε) 219.05 nm. (3.92); FT-IR (CH2Cl2) νmax: 3401, 2927, 1692, 1648 cm−1; 1H-NMR (CDCl3, 400 MHz) 5.68 (1H, s, H-14), 5.08 (1H, s, H-17b), 4.63 (1H, s, H-17a), 4.39 (1H, br s, H-7), 2.17 (3H, d, J = 1.3 Hz, H-16), 2.29 (1H, m, H-12b), 2.10 (1H, dd, J = 12.1, 1.3, H-9), 2.01 (1H, m, H-12a), 1.88 (1H, dd, J = 11.8, 2.5 Hz, H-6b), 1.75 (1H, m, H-11b), 1.72 (1H, m, H-1b), 1.63 (1H, m, H-6a), 1.60 (1H, m, H-5), 1.56 (2H, m, H-2), 1.49 (1H, m, H-11a), 1.43 (1H, m, H-3b), 1.22 (1H, m, H-3a), 1.07 (1H, m, H-1a), 0.88 (3H, s, H-19), 0.80 (3H, s, H-18), 0.67 (3H, s, H-20); 13C NMR (100 MHz, CDCl3) 170.7 (C, C-15), 163.7 (C, C-13), 149.5 (C, C-8), 114.7 (CH, C-14), 109.9 (CH2, C-17), 74.2 (CH, C-7), 50.4 (CH, C-9), 47.8 (CH, C-5), 42.2 (CH2, C-3), 40.0 (C, C-10), 39.7 (CH2, C-12), 38.9 (CH2, C-1), 33.4 (CH3, C-19), 33.3 (C, C-4), 31.1 (CH2, C-6), 21.7 (CH3, C-18), 21.1 (CH2, C-11), 19.3 (CH3, C-16), 19.5 (CH2, C-2), 13.6 (CH3, C-20); HRESI-MS: m/z 343.2248 [M + Na]+ (calcd C20H32NaO3+, 343.2244).
3.8. Computational Details
4. Conclusions
Supplementary Materials
Author Contributions
Funding
Institutional Review Board Statement
Informed Consent Statement
Data Availability Statement
Acknowledgments
Conflicts of Interest
References
- English, R.S., Jr. A hypothetical pathogenesis model for androgenic alopecia: Clarifying the dihydrotestosterone paradox and rate-limiting recovery factors. Med. Hypotheses 2018, 111, 73–81. [Google Scholar] [CrossRef] [PubMed]
- Dhurat, R.; Sharma, A.; Rudnicka, L.; Kroumpouzos, G.; Kassir, M.; Galadari, H.; Wollina, U.; Lotti, T.; Golubovic, M.; Binic, I. 5-Alpha reductase inhibitors in androgenetic alopecia: Shifting paradigms, current concepts, comparative efficacy, and safety. Dermatol. Ther. 2020, 33, e13379. [Google Scholar] [CrossRef] [PubMed]
- Asdaq, S.M.B.; Nayeem, N.; Abida; Alam, M.T.; Alaqel, S.I.; Imran, M.; Hassan, E.-W.E.; Rabbani, S.I. Tectona grandis Lf: A comprehensive review on its patents, chemical constituents, and biological activities. Saudi J. Biol. Sci. 2022, 29, 1456–1464. [Google Scholar] [CrossRef] [PubMed]
- Vyas, P.; Yadav, D.K.; Khandelwal, P. Tectona grandis (teak)—A review on its phytochemical and therapeutic potential. Nat. Prod. Res. 2019, 33, 2338–2354. [Google Scholar] [CrossRef]
- Fachrunniza, Y.; Srivilai, J.; Wisuitiprot, V.; Wisuitiprot, W.; Suphrom, N.; Temkitthawon, P.; Waranuch, N.; Ingkaninan, K. Tectona grandis, a potential active ingredient for hair growth promotion. Songklanakarin J. Sci. Technol. 2020, 42, 1352–1359. [Google Scholar] [CrossRef]
- Tanuphol, N.; Waranuch, N.; Wisuitiprot, V.; Wisuitiprot, W.; Insumrong, K.; Temkitthawon, P.; Suphrom, N.; Jampachaisri, K.; Girard, C.; Ingkaninan, K. Effectiveness and Safety of Hair Growth Formulation Containing Tectona grandis L.f (Teak) Leaf Extract: A Randomized, Double-Blind, Placebo-Controlled Study on Males with Androgenic Alopecia. J. Evid. Based Integr. Med. 2024, 29, 2515690X241291141. [Google Scholar] [CrossRef]
- Insumrong, K.; Ingkaninan, K.; Waranuch, N.; Tanuphol, N.; Wisuitiprot, W.; Promgool, T.; Suphrom, N. Isolation and HPLC quantitative determination of 5α-reductase inhibitors from Tectona grandis L.f leaf extract. Molecules 2022, 27, 2893. [Google Scholar] [CrossRef]
- Li, Y.; Kong, D.; Fu, Y.; Sussman, M.R.; Wu, H. The effect of developmental and environmental factors on secondary metabolites in medicinal plants. Plant Physiol. Biochem. 2020, 148, 80–89. [Google Scholar] [CrossRef]
- Manickam, S.; Rajagopalan, V.R.; Kambale, R.; Rajasekaran, R.; Kanagarajan, S.; Muthurajan, R. Plant metabolomics: Current initiatives and future prospects. Curr. Issues Mol. Biol. 2023, 45, 8894–8906. [Google Scholar] [CrossRef]
- Saesong, T.; Allard, P.-M.; Ferreira Queiroz, E.; Marcourt, L.; Nuengchamnong, N.; Temkitthawon, P.; Khorana, N.; Wolfender, J.-L.; Ingkaninan, K. Discovery of lipid peroxidation inhibitors from Bacopa species prioritized through multivariate data analysis and multi-informative molecular networking. Molecules 2019, 24, 2989. [Google Scholar] [CrossRef]
- Zhou, J.; Gao, S.; Du, Z.; Jin, S.; Yang, Z.; Xu, T.; Zheng, C.; Liu, Y. Seasonal variations and sensory profiles of oolong tea: Insights from metabolic analysis of Tieguanyin cultivar. Food Chem. 2025, 462, 140977. [Google Scholar] [CrossRef] [PubMed]
- Sehlakgwe, P.F.; Lall, N.; Prinsloo, G. 1H-NMR Metabolomics and LC-MS Analysis to Determine Seasonal Variation in a Cosmeceutical Plant Leucosidea sericea. Front. Pharmacol. 2020, 11, 219. [Google Scholar] [CrossRef] [PubMed]
- Koffi, E.N.; Meudec, E.; Adjé, F.A.; Lozano, P.R.; Lozano, Y.F.; Bekro, Y.-A. Effect of reverse osmosis concentration coupled with drying processes on polyphenols and antioxidant activity obtained from Tectona grandis leaf aqueous extracts. J. Appl. Res. Med. Aromat. Plants 2015, 2, 54–59. [Google Scholar] [CrossRef]
- Tibkawin, N.; Suphrom, N.; Nuengchamnong, N.; Khorana, N.; Charoensit, P. Utilisation of Tectona grandis (teak) leaf extracts as natural hair dyes. Color. Technol. 2022, 138, 355–367. [Google Scholar] [CrossRef]
- Nayeem, N.; Karvekar, M. Comparative phytochemical and pharmacological screening of the methanolic extracts of the frontal and mature leaves of Tectona grandis. Int. J. Pharma Bio Sci. 2010, 1, PS27. [Google Scholar]
- Xiao, C.; Dai, H.; Liu, H.; Wang, Y.; Tang, H. Revealing the metabonomic variation of rosemary extracts using 1H NMR spectroscopy and multivariate data analysis. J. Agric. Food Chem. 2008, 56, 10142–10153. [Google Scholar] [CrossRef]
- Favier, L.S.; Nieto, M.; Giordano, O.S.; Tonn, C.E. Diterpenoids and flavonoids from Ophryosporus charrua. Phytochemistry 1997, 45, 1469–1474. [Google Scholar] [CrossRef]
- Martins, A.N.; Simeonov, S.P.; Frija, L.M.; Viveiros, R.; Lourenço, A.; da Silva, M.S.; Casimiro, T.; Afonso, C.A. Isolation, analytical quantification and seasonal variation of labdanolic acid from the Portuguese-grown Cistus ladaniferus. Ind. Crops Prod. 2014, 60, 226–232. [Google Scholar] [CrossRef]
- Urones, J.G.; Basabe, P.; Marcos, I.S.; González, J.L.; Jiménez, V.; Sexmero, M.J.; Lithgow, A.M. Ambergis compounds from labdanolic acid. Tetrahedron 1992, 48, 9991–9998. [Google Scholar] [CrossRef]
- Bolster, M.G.; Jansen, B.J.; de Groot, A. The synthesis of (−)-Ambrox® starting from labdanolic acid. Tetrahedron 2001, 57, 5657–5662. [Google Scholar] [CrossRef]
- Rimpler, H.; Christiansen, I. Tectograndinol, ein neues Diterpen aus Tectona grandis L. fil./Tectograndinol, a New Diterpene from Tectona grandis L. fil. Z. Naturforsch. C 1977, 32, 724–730. [Google Scholar] [CrossRef]
- Aoki, W.; Ohtsuki, T.; Sadhu, S.K.; Sato, M.; Koyano, T.; Preeprame, S.; Kowithayakorn, T.; Ishibashi, M. First isolation of three diterpenes as naturally-occurring compounds from Sindora siamensis. J. Nat. Med. 2007, 61, 77–79. [Google Scholar] [CrossRef]
- Kalman, N.L. A new substance, cativic acid, and its preparation, properties and derivatives. J. Am. Chem. Soc. 1938, 60, 1423–1425. [Google Scholar] [CrossRef]
- Calabuig, M.; Cortés, M.; Francisco, C.G.; Hernández, R.; Suárez, E. Labdane diterpenes from Cistus symphytifolius. Phytochemistry 1981, 20, 2255–2258. [Google Scholar] [CrossRef]
- Garcia-Sanchez, E.; Ramírez-López, C.B.; Talavera-Alemán, A.; Leon-Hernandez, A.; Martinez-Munoz, R.E.; Martínez-Pacheco, M.M.; Gomez-Hurtado, M.A.; Cerda-García-Rojas, C.M.; Joseph-Nathan, P.; del Río, R.E. Absolute configuration of (13 R)-and (13 S)-labdane diterpenes coexisting in Ageratina jocotepecana. J. Nat. Prod. 2014, 77, 1005–1012. [Google Scholar] [CrossRef] [PubMed]
- Srivilai, J.; Rabgay, K.; Khorana, N.; Waranuch, N.; Nuengchamnong, N.; Wisuitiprot, W.; Chuprajob, T.; Changtam, C.; Suksamrarn, A.; Chavasiri, W. Anti-androgenic curcumin analogues as steroid 5-alpha reductase inhibitors. Med. Chem. Res. 2017, 26, 1550–1556. [Google Scholar] [CrossRef]
- Macías, F.A.; Lacret, R.; Varela, R.M.; Nogueiras, C.; Molinillo, J.M. Isolation and phytotoxicity of terpenes from Tectona grandis. J. Chem. Ecol. 2010, 36, 396–404. [Google Scholar] [CrossRef]
- Dekker, T.; Fourie, T.; Matthee, E.; Snyckers, F.; Van der Schyf, C.; Boeyens, J.; Denner, L. Studies of South African medicinal plants: Pt. 7. S. Afr. J. Chem. 1988, 41, 33–35. [Google Scholar]
- Gallego, J.C.A. Influencia de los Factores Climáticos en la Síntesis y Actividad de Compuestos Fitotóxicos Secretados por Cistus ladanifer L. Ph.D. Thesis, Universidad de Extremadura, Badajoz, Spain, 2006. Available online: https://www.researchgate.net/publication/39379903 (accessed on 14 May 2023).
- Alías, J.C.; Sosa, T.; Valares, C.; Escudero, J.C.; Chaves, N. Seasonal variation of Cistus ladanifer L. diterpenes. Plants 2012, 1, 6–15. [Google Scholar] [CrossRef]
- Baratta, M.; Ruberto, G.; Tringali, C. Constituents of the pods of Piliostigma thonningii. Fitoterapia 1999, 70, 205–208. [Google Scholar] [CrossRef]
- Monteiro, A.F.; Batista, J.M., Jr.; Machado, M.A.; Severino, R.P.; Blanch, E.W.; Bolzani, V.S.; Vieira, P.C.; Severino, V.G. Structure and absolute configuration of diterpenoids from Hymenaea stigonocarpa. J. Nat. Prod. 2015, 78, 1451–1455. [Google Scholar] [CrossRef] [PubMed]
- Insumrong, K.; Waranuch, N.; Ingkaninan, K.; Tanuphol, N.; Mishra, A.P.; Wisuitiprot, W.; Wongwad, E.; Ngamdokmai, N.; Suphrom, N. In Vitro Skin Penetration of 5α-Reductase Inhibitors from Tectona grandis L.f Leaf Extracts. Molecules 2025, 30, 1151. [Google Scholar] [CrossRef] [PubMed]
- Liang, T.; Liao, S. Inhibition of steroid 5 α-reductase by specific aliphatic unsaturated fatty acids. Biochem. J. 1992, 285, 557–562. [Google Scholar] [CrossRef] [PubMed]
- Aggarwal, S.; Thareja, S.; Verma, A.; Bhardwaj, T.R.; Kumar, M. An overview on 5α-reductase inhibitors. Steroids 2010, 75, 109–153. [Google Scholar] [CrossRef]
- Srivilai, J.; Rabgay, K.; Khorana, N.; Waranuch, N.; Nuengchamnong, N.; Ingkaninan, K. A new label-free screen for steroid 5α-reductase inhibitors using LC-MS. Steroids 2016, 116, 67–75. [Google Scholar] [CrossRef]
- Rijo, P. Phytochemical Study and Biological Activities of Diterpenes and Derivatives from Plectranthus species. Ph.D. Thesis, Universidade de Lisboa, Lisboa, Portugal, 2011. [Google Scholar]

| No. | Raw Material Source | Herbarium Specimen Number |
|---|---|---|
| 1 | Mueang District, Chiang Rai | 06967 |
| 2 | MaeGar Silvicultural Research Station, Phayao | 05966 |
| 3 | Ngao Silvicultural Research Station, Lampang (Teak Improvement Center) | 05959 |
| 4 | Phitsanulok Silvicultural Research Station, Phitsanulok | 05960 |
| 5 | Sao Hai District, Saraburi | 05958 |
| 6 | Banna district, Nakhon Nayok | 05721 |
| 7 | Central Silvicultural Research Station, Kanchanaburi | 05957 |
| 8 | Mueang District, Ratchaburi | 05968 |
| 9 | Dong Lan Silvicultural Research Station, Khon Kaen | 05964 |
| 10 | Kong Jiam Silvicultural Research Station, Ubon Ratchathani | 05963 |
| 11 | Non Din Daeng District, Burirum | 05965 |
| 12 | BanTaKhun Silvicultural Research Station, Surat Thani | 05969 |
| 13 | ThaugKhaoBamTad Silvicultural Research Station, Trang | 05962 |
| 14 | Hat Yai District, Songkhla | 05961 |
Disclaimer/Publisher’s Note: The statements, opinions and data contained in all publications are solely those of the individual author(s) and contributor(s) and not of MDPI and/or the editor(s). MDPI and/or the editor(s) disclaim responsibility for any injury to people or property resulting from any ideas, methods, instructions or products referred to in the content. |
© 2025 by the authors. Licensee MDPI, Basel, Switzerland. This article is an open access article distributed under the terms and conditions of the Creative Commons Attribution (CC BY) license (https://creativecommons.org/licenses/by/4.0/).
Share and Cite
Tanuphol, N.; Girard, C.; Temkitthawon, P.; Suphrom, N.; Nuengchamnong, N.; Saesong, T.; Insumrong, K.; Wadeng, A.; Khangkhachit, W.; Zedet, A.; et al. Geographic Influence and Metabolomics-Driven Discovery of 5-Alpha Reductase Inhibitors in Tectona grandis L.f. (Teak) Leaves. Molecules 2025, 30, 2895. https://doi.org/10.3390/molecules30142895
Tanuphol N, Girard C, Temkitthawon P, Suphrom N, Nuengchamnong N, Saesong T, Insumrong K, Wadeng A, Khangkhachit W, Zedet A, et al. Geographic Influence and Metabolomics-Driven Discovery of 5-Alpha Reductase Inhibitors in Tectona grandis L.f. (Teak) Leaves. Molecules. 2025; 30(14):2895. https://doi.org/10.3390/molecules30142895
Chicago/Turabian StyleTanuphol, Nutchaninad, Corine Girard, Prapapan Temkitthawon, Nungruthai Suphrom, Nitra Nuengchamnong, Tongchai Saesong, Kamonlak Insumrong, Abdulaziz Wadeng, Wiyada Khangkhachit, Andy Zedet, and et al. 2025. "Geographic Influence and Metabolomics-Driven Discovery of 5-Alpha Reductase Inhibitors in Tectona grandis L.f. (Teak) Leaves" Molecules 30, no. 14: 2895. https://doi.org/10.3390/molecules30142895
APA StyleTanuphol, N., Girard, C., Temkitthawon, P., Suphrom, N., Nuengchamnong, N., Saesong, T., Insumrong, K., Wadeng, A., Khangkhachit, W., Zedet, A., Intayot, R., Jungsuttiwong, S., Plubrukarn, A., Senejoux, F., & Ingkaninan, K. (2025). Geographic Influence and Metabolomics-Driven Discovery of 5-Alpha Reductase Inhibitors in Tectona grandis L.f. (Teak) Leaves. Molecules, 30(14), 2895. https://doi.org/10.3390/molecules30142895