Article

Novel Type I/II Carbazole/Benzindole Photosensitizers Achieve Chemo-Photodynamic Synergistic Therapy for Suppressing Solid Tumors and Drug-Resistant Bacterial Infections

1
Department of Medicinal Chemistry, School of Pharmacy, Nantong University, Nantong 226001, China
2
Department of Traditional Chinese Pharmacy, China Pharmaceutical University, Nanjing 210009, China
*
Authors to whom correspondence should be addressed.
These authors contributed equally to this work.
Molecules 2025, 30(12), 2560; https://doi.org/10.3390/molecules30122560
Submission received: 8 May 2025 / Revised: 8 June 2025 / Accepted: 9 June 2025 / Published: 12 June 2025

Abstract

:
To address the clinical challenges posed by symbiotic drug-resistant bacterial infections and tumor microenvironments, this study designed and synthesized novel carbazole/benzindole-based photosensitizers A1A4, systematically evaluating their antitumor and antibacterial therapeutic potential through chemo-photodynamic therapy. Especially, compound A4 demonstrated potent Type I/II reactive oxygen species (ROS) generation capabilities. In vitro experiments revealed that A4 concentration-dependently inhibited HT-29 cells under hypoxic conditions (IC50 = 0.89 μM) with a prominent photodynamic index (PI > 9.23), and substantially promoted cancer cell programmed death. In antibacterial evaluations, A4 achieved the complete eradication of dermal MRSA infections within 7 days through ROS-mediated membrane disruption under illumination. In the HT-29 xenograft model, the PDT–chemotherapy synergy strategy achieved a tumor suppression rate of 96%. This work establishes an innovative strategy for the combinatorial management of multidrug-resistant infections and solid tumors.

1. Introduction

Malignant tumors pose a severe threat to global health. Recent studies have revealed that Methicillin-resistant Staphylococcus aureus (MRSA) exhibits competitive niche advantages within tumor microenvironments [1,2]. Clinical evidence demonstrates a 19.8% MRSA infection rate among post-operative colorectal cancer patients, with MRSA colonization reducing HT29 cell sensitivity to oxaliplatin by 3.2-fold [3]. Mechanistic investigations indicate that MRSA significantly diminishes chemotherapeutic bioavailability through the membrane adsorption of 5-fluorouracil (5-FU), evidenced by a 41% reduction in AUC0–24 [4,5]. This tumor–microbe symbiosis fosters a vicious cycle of “infection-drug resistance-metastasis” [6,7]. Consequently, developing therapeutic agents capable of simultaneously targeting malignancies and resistant infections represents a critical strategy for improving cancer treatment outcomes.
The medical community has reached a dual consensus: On the one hand, monotherapeutic chemotherapy regimens exhibit inherent limitations in addressing bacterial biofilm-associated infections, as they fail to effectively penetrate and disrupt biofilm matrices, which is a critical deficit that necessitates multimodal combination strategies [8,9,10,11]. On the other hand, whilst conventional tri-modality therapy (surgery, radiotherapy, and chemotherapy) has established standardized clinical pathways in oncology, the intrinsic microenvironmental heterogeneity and regional hypoxia characteristic of solid tumors result in chemoresistance or radioresistance in 30–40% of cases [12,13].
Within this context, photodynamic therapy (PDT) demonstrates unique therapeutic value; its mechanism, mediated through photosensitizer-generated reactive oxygen species (ROS) under specific wavelength excitation [14,15,16], confers dual therapeutic merits: in antimicrobial applications, ROS effectively eradicate drug-resistant pathogens while degrading biofilm extracellular polymeric substances [17,18,19]; in oncology, PDT selectively disrupts tumor vasculature and induces cancer cell apoptosis [20,21,22]. Recent advances reveal that the spatiotemporal coordination of chemotherapeutics with PDT generates synergistic “1 + 1 > 2” therapeutic outcomes [23,24,25,26]. This chemo-photodynamic combinatorial approach not only enhances ROS cytotoxicity via pharmacological sensitization, but also enables precise spatial–temporal drug concentration control through photoactivated drug delivery systems, offering an innovative paradigm for combating resistant infections and solid tumors [27].
Despite PDT’s demonstrated advantages in antibacterial and antitumor applications, the current lack of ideal dual-functional photosensitizers combining potent antibacterial efficacy with tumor-targeting specificity necessitates the development of advanced photosensitizing agents [28,29]. Notably, quaternization design strategies enhance antimicrobial activity, as quaternary ammonium salts are widely employed for their biofilm-eradicating activity and membrane-targeting mechanisms [30,31,32]. Herein, benzindolium quaternary salts were utilized as strong electron acceptors, coupled with carbazole tricycles as auxiliary electron-withdrawing moieties, to design and synthesize novel carbazole/benzindole-based photosensitizers A1A4 (Figure 1) [33,34,35]. Carbazole derivatives further exhibit multi-target engagement capabilities, including interactions with DNA and DNA gyrase. We anticipate that these engineered photosensitizers will achieve synergistic therapeutic effects against malignancies and MRSA through robust chemo-photodynamic integration.

2. Results and Discussion

2.1. Synthesis and Characterization

The synthetic pathway for target compounds is delineated in Scheme 1. The initial quaternization of benzindole 1 with iodomethane yielded benzindolium salt 2, which subsequently underwent Knoevenagel condensation with carbazole-3-carbaldehyde 3 to afford compound A1. For A2 synthesis, nitro group installation at the C6 position of 3 generated intermediate 4, followed by Knoevenagel condensation and subsequent iron-mediated reduction to produce A3. The bromination of 3 using NBS furnished intermediate 5, and finally, it was condensed with phenylindole iodized salt to obtain the target compound A4. All target compounds exhibited > 95% purity (Figures S24–S27), with structural verification achieved through 1H NMR, 13C NMR, and ESI-HRMS analyses, as detailed in Supplementary Data (Figures S12–S23).

2.2. Determination of Photodynamic Properties

First, the photophysical properties of compounds A1A4 were characterized using UV-Vis spectrophotometry and fluorescence spectroscopy. Four target compounds exhibited characteristic absorption bands within the 475–510 nm visible light range, with corresponding fluorescence emission maxima consistently centered at approximately 600 nm (Figure 2a,b).
PDT, a clinically validated antitumor modality, operates through photosensitizer (PS)-generated ROS under light activation to achieve targeted tumor cell eradication [36]. We used DCFH probes to detect the ROS generation levels of different photosensitizers under light treatment [36]. The experimental data revealed superior ROS induction capabilities in the A1A4 compared to the in conventional photosensitizer [Ru(bpy)3]2+ (RuB), with A3 exhibiting the highest ROS generation, followed by A4 and A2 (Figure 2c and Figure S1).
Next, complementary singlet oxygen (1O2) detection via SOSG assay demonstrated significantly enhanced 1O2 production in A4 and A2 relative to RuB (Figure 2d and Figure S2). Notably, no discernible superoxide anion (O2•−) generation was detected across any compounds using dihydroethidium probes (Figure 2f and Figure S4). Intriguingly, hydroxyl radical (•OH) accumulation was specifically observed in A4-treated samples under illumination via HPF probe detection (Figure 2e and Figure S3).
The above data show that A4 exhibits outstanding photosensitizing properties, likely exerting therapeutic effects in hypoxic tumor microenvironments through Type I/II photodynamic mechanism, and it is worthy of in-depth development as a new candidate molecule for PSs.

2.3. Electronic Spin Resonance Detection

We further investigated the photodynamic properties of active photosensitizer A4 using electron spin resonance (ESR) spectroscopy. Under illumination, distinct ESR signals of •OH, O2•−, and 1O2 were detected, whereas no significant signals were observed in the dark (Figure S6). These results align with photodynamic assays, confirming A4’s superior Type I/II PDT capability. During photoexcitation, electrons transition from the ground state (S0) to higher-energy excited states (Sn), followed by internal conversion to the lowest singlet excited state (S1). The S1 state either returns radiatively to S0 (fluorescence emission) or undergoes intersystem crossing (ISC) to the triplet state (T1). The T1 state generates O2•−/•OH via electron transfer (Type I) or 1O2 via energy transfer (Type II). Efficient ISC is a critical determinant of ROS generation by photosensitizers (PSs). The results show that A4 has a narrow HOMO-LUMO energy gap, high ΔE(LUMO-HOMO) value (ΔE(LUMO-HOMO) = 2.73 eV), and low ΔEST (1.14 eV) (Figure S7). These electronic characteristics underscore A4’s exceptional ROS-generating efficiency under photoactivation.

2.4. Chemotherapy/Photodynamic Antitumor Activity

Building on the reported pharmacodynamic advantages of natural carbazole scaffolds in chemotherapy [37] and the exceptional ROS-inducing properties of compounds A4 and A2 identified in this study, we systematically evaluated the antitumor efficacy of this series against multiple cancer cell lines (human lung cancer A549, human colon cancer HT-29, and murine breast cancer 4T1) under chemo-photodynamic combination therapy, using [Ru(bpy)3]2+ (RuB) as the positive control. Under normoxic conditions, A1, A2, and A3 demonstrated significant antitumor activity compared to RuB, but exhibited limited photodynamic effects upon illumination (Figure 3a–i). Notably, A4 showed low activity in the dark (IC50 < 100 μM for HT-29, Table S1), yet achieved remarkable light-enhanced antitumor activity (photodynamic index PI > 9.23), highlighting its superior photodynamic therapeutic potential (Figure 3j–l). Given A4’s outstanding synergistic antitumor performance and Type I ROS generation capacity, we further investigated its efficacy against HT-29 cells under hypoxic conditions. A4 effectively inhibited HT-29 cells in a concentration-dependent manner (IC50,light = 0.87–0.91 μM, Table S1; Figure S5), confirming its hypoxia-compatible therapeutic potential through combined chemo-photodynamic action. Notably, A4 outperformed other compounds in the series, particularly in photodynamic efficacy under hypoxic tumor microenvironments.

2.5. Determination of ROS Generation

The results of the MTT assay showed that compound A4 exhibited good antitumor cell activity. Based on this, we investigated whether A4 could induce ROS production in cancer cells using 2′,7′-dichlorodihydrofluorescein diacetate (DCFH-DA) to measure the intracellular ROS levels. Significant fluorescence signals were observed in A4-treated cells, while PBS and PBS + light (L) treatments did not induce any notable fluorescence (Figure 4a,b). Additionally, strong green fluorescence was detected in A4-pretreated cells after light irradiation, indicating that illumination further enhanced the ROS levels. To visualize Type I PDT effects triggered by A4, intracellular O2•− levels were evaluated using the superoxide indicator dihydroethidium (DHE). Cells co-treated with A4 and DHE exhibited intense red fluorescence after illumination, whereas non-irradiated cells showed weaker fluorescence, demonstrating increased O2•− generation post illumination (Figure 4c,d). Considering the low oxygen dependency of O2•− production in Type I PDT, we also assessed intracellular O2•− generation under hypoxic conditions. A4 and A4 + L co-treated cells still displayed bright DHE signals in hypoxia (Figure 4e,f), confirming that A4 can execute hybrid Type I/II PDT by generating ROS even under low oxygen conditions.

2.6. Live/Dead Cell Staining

Additionally, live/dead staining assays were conducted on HT29 cells to evaluate the efficacy of A4 in promoting cancer cell death, particularly its enhanced effects under laser irradiation. The results revealed that A4-treated cells without laser irradiation exhibited a certain mortality rate, indicating that A4 itself possesses certain chemotherapeutic effects capable of directly inducing partial cancer cell death. However, when A4-treated cells were subjected to laser irradiation, the number of dead cells significantly increased, demonstrating that A4 under laser irradiation markedly enhances its ability to induce cell death (Figure S8). This enhancement is attributed to the synergistic effects of A4’s chemotherapeutic activity and PDT, where A4 generates ROS under laser irradiation, further exacerbating cell death. Furthermore, MTT assay results were consistent with the live/dead staining data, confirming that A4 significantly reduces cell viability under laser irradiation. These findings suggest that A4 exerts significant antitumor effects through the synergy of chemotherapy and PDT under laser irradiation, providing robust experimental support for A4 as a novel photodynamic therapeutic agent.

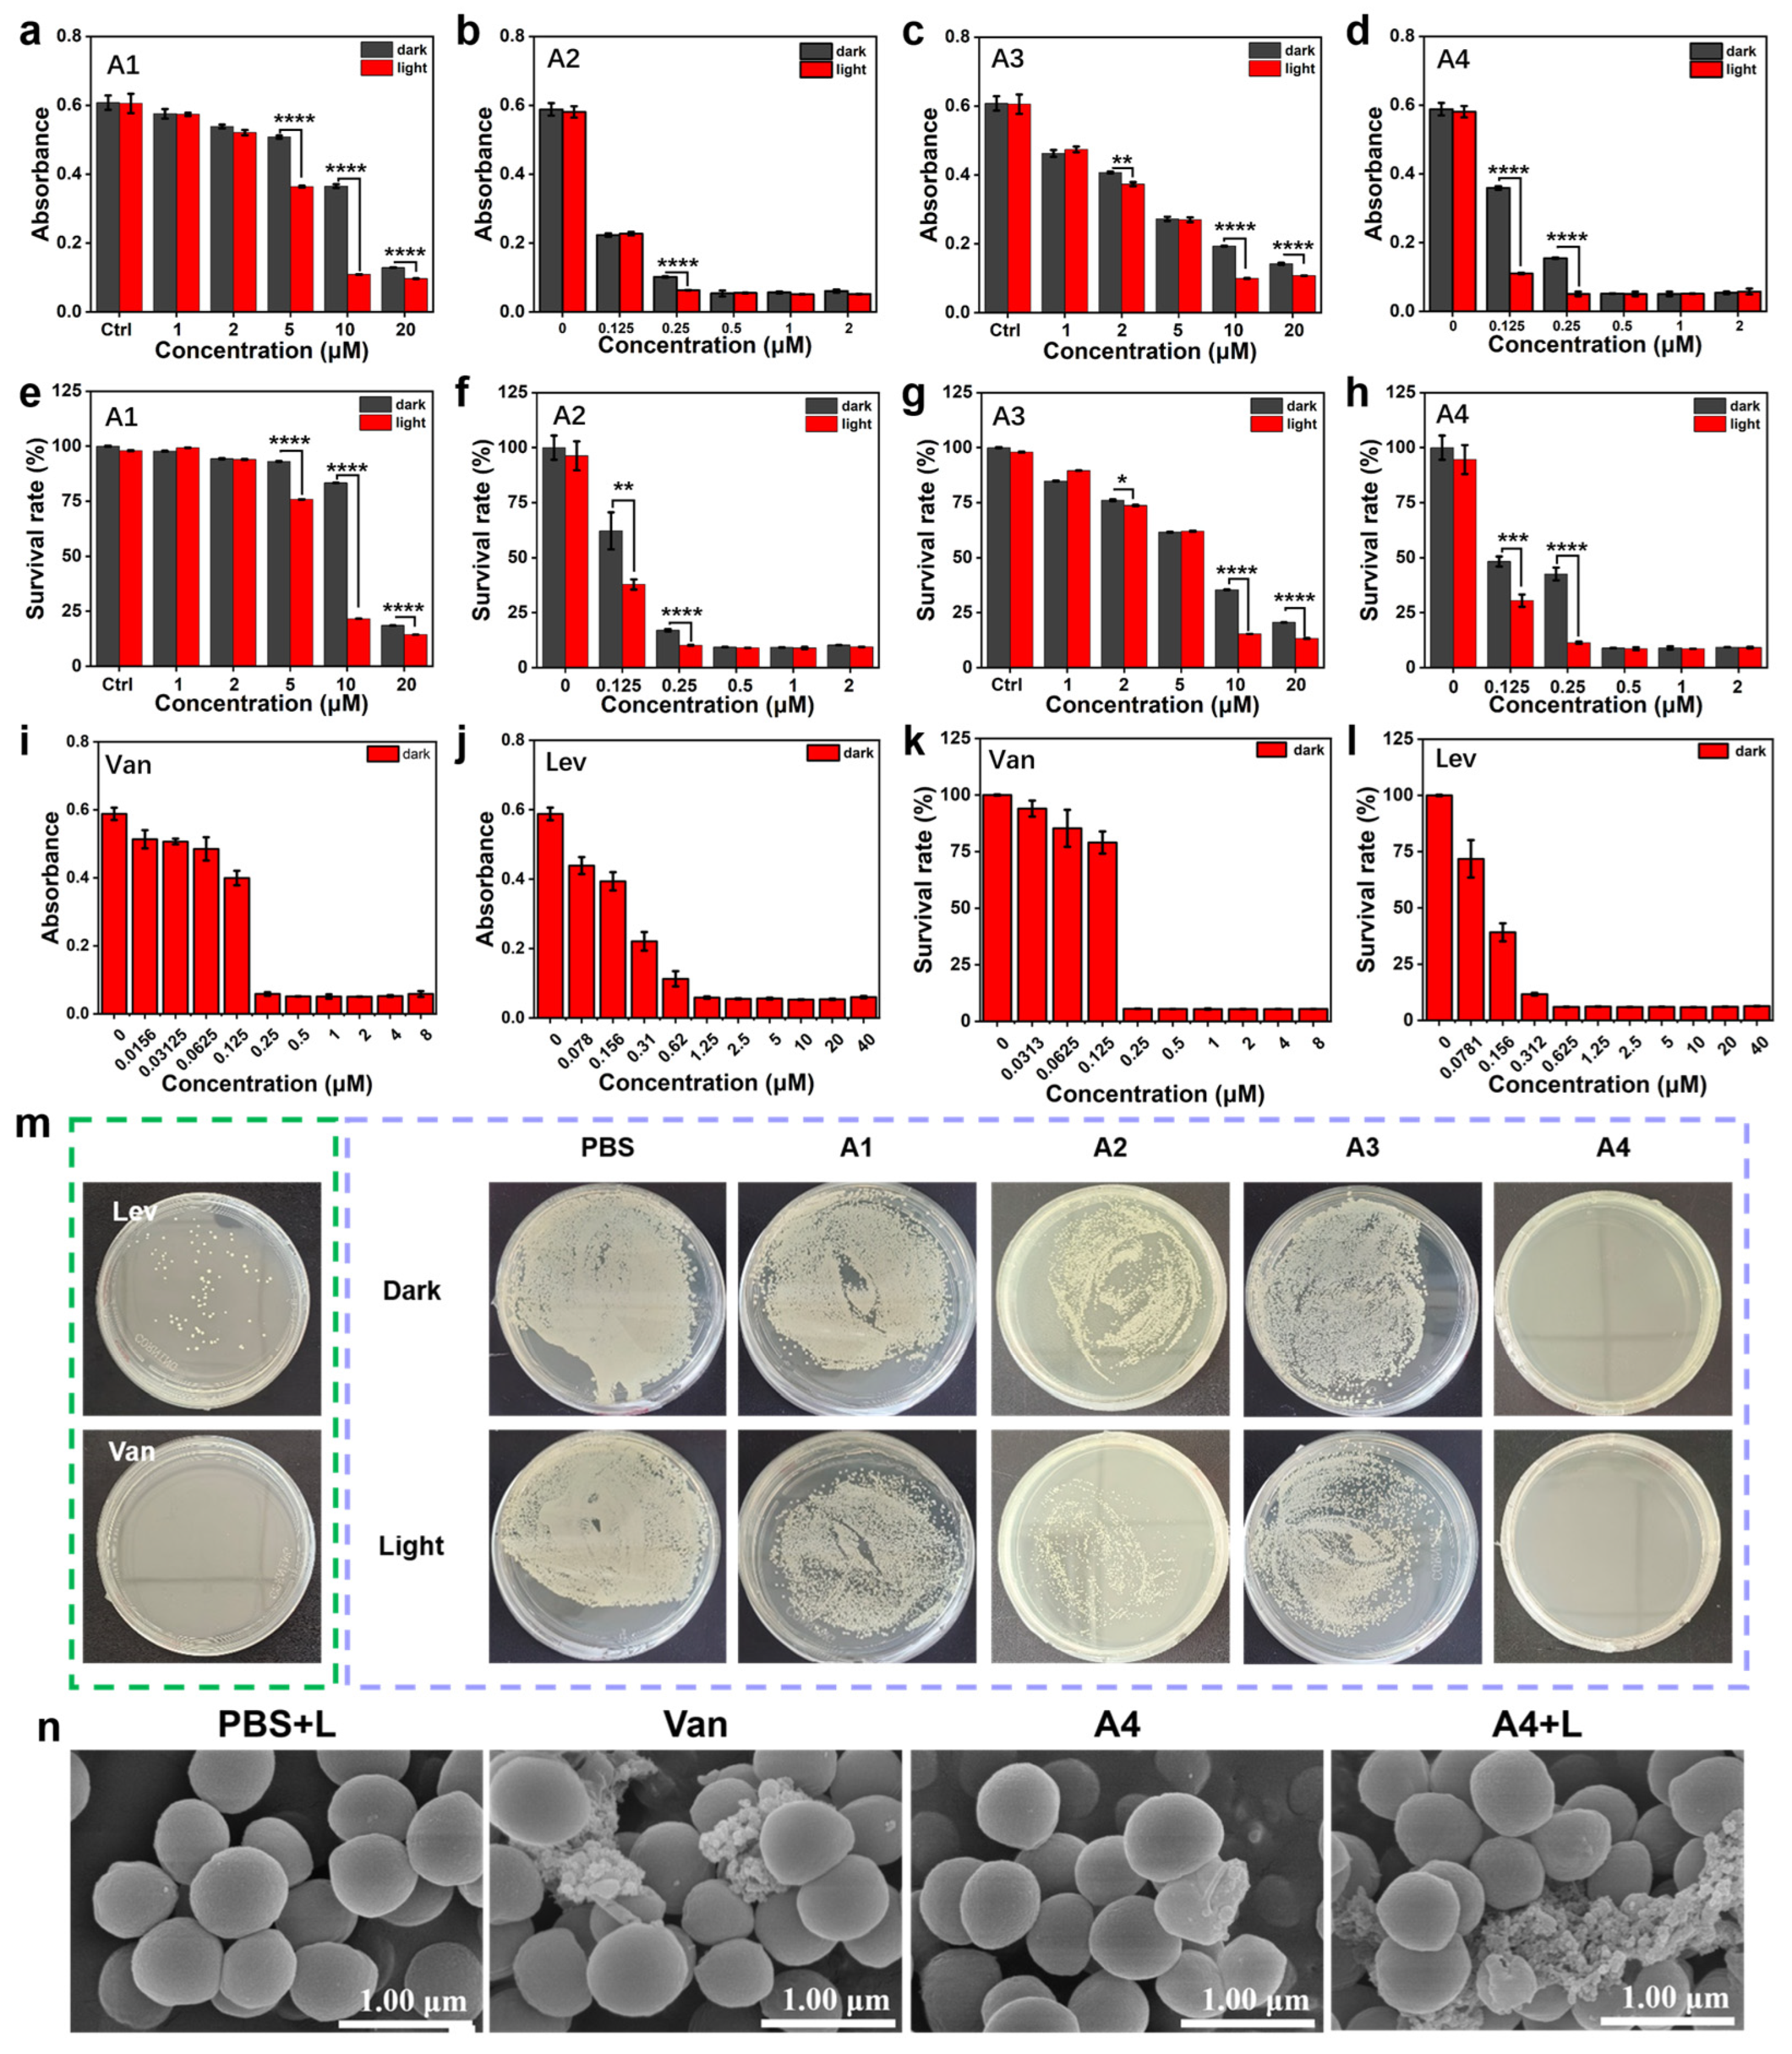
2.7. Study of In Vitro Antimicrobial Capacity

The antibacterial activity of A1A4 against MRSA was first evaluated using a turbidimetric assay, with vancomycin (Van) and levofloxacin (Lev) as positive controls. As shown in Figure 5a–l, after treating MRSA with compounds of different concentrations under light conditions, observe the OD value at 600 nm; A1 and A3 exhibited weak anti-MRSA effects at various concentrations. Compared with A1, A3, and A4, A2 demonstrated negligible photodynamic antibacterial activity, and A4-treated MRSA displayed obvious concentration-dependent antibacterial activity characteristics (Figure 5d). The CCK-8 bacterial viability assay was further employed to validate the in vitro antibacterial activity of A1A4 under light irradiation, with dark conditions as the control. The results were consistent with the turbidimetric assay, showing concentration-dependent antibacterial effects under light irradiation. At 1 μM under light irradiation, A4 exhibited potent antibacterial efficacy, comparable to Van at 1 μM, and demonstrated activity similar to Lev at 1.25 μM, while dark conditions showed no significant impact on bacterial growth (Figure 5e–h,k,l). These results indicate that ROS generated using A4 under light irradiation contribute to its potent antibacterial activity. Subsequently, a plate spread assay was used to quantitatively assess the bactericidal capacity of A1A4 against MRSA. Colony counting analysis revealed that A4, when co-incubated with MRSA under light irradiation, significantly inhibited colony growth compared to other controls, demonstrating enhanced synergistic bactericidal effects between PDT and A4 (Figure 5m). Next, the DCFH-DA fluorescent probe was utilized to evaluate ROS production in bacteria treated with A4 combined with laser irradiation. The results showed intense green fluorescence in the A4 + L group, whereas control groups exhibited no detectable fluorescence signals (Figure S9). This confirms the robust ROS-generating capability of A4 under light irradiation at the bacterial level. Finally, to further validate the damaging effect of A4 on bacterial membranes, scanning electron microscopy (SEM) was employed to observe the morphological changes in MRSA treated with A4, as shown in Figure 5. After subjecting cultured MRSA to different treatments, untreated MRSA under laser irradiation exhibited plump bacterial morphology with smooth and intact surfaces. In contrast, Van-treated and A4-treated (dark) MRSA displayed rough, ruptured surfaces and overall structural damage, indicating partial bactericidal effects. Notably, A4 combined with laser irradiation caused pronounced wrinkling of bacterial membrane surfaces and significant peripheral cellular debris, signifying membrane rupture and bacterial lysis. These results confirm that A4 and PDT synergistically exert antibacterial effects (Figure 5n).

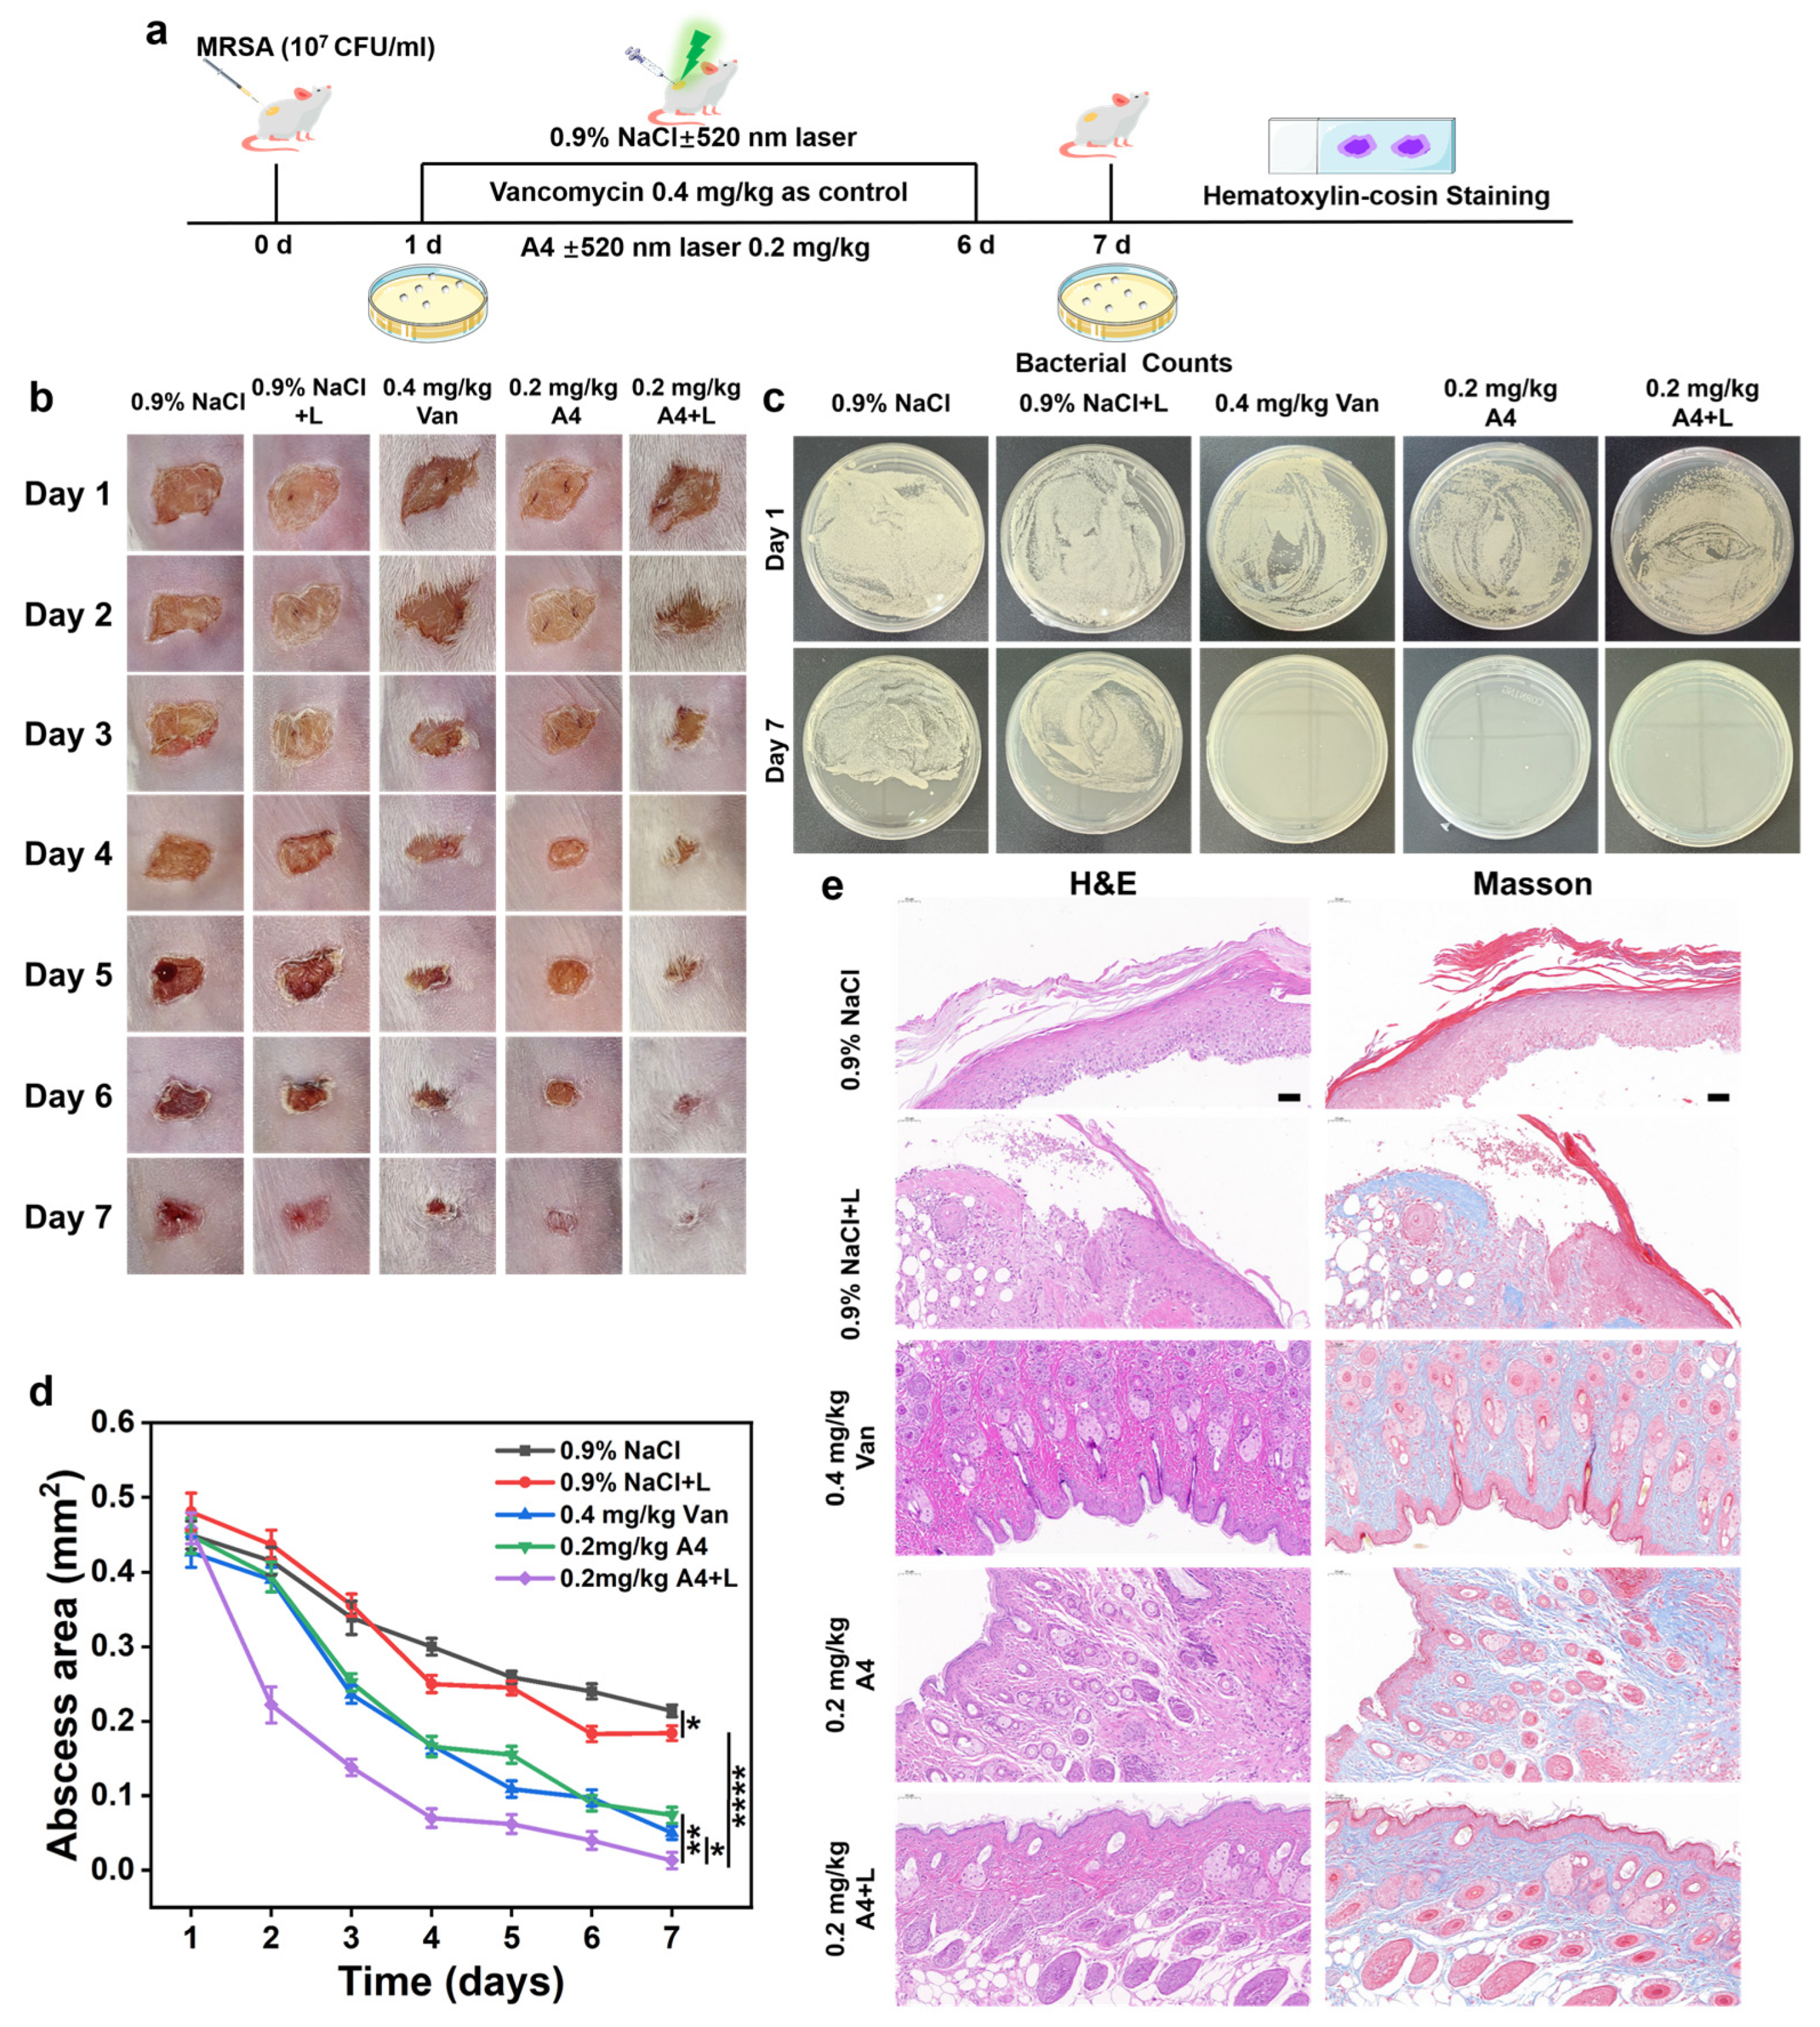
2.8. In Vivo Antimicrobial Effect

Next, the in vivo antibacterial efficacy of A4 will be further studied. We established a MRSA-infected skin defect wound model in mice (Figure 6a). ICR mice were selected as experimental subjects. After anesthesia with isoflurane, the dorsal skin was shaven, cleaned, and disinfected with 75% ethanol. A 1 × 1 cm2 surgical wound was created on the back, followed by infection with MRSA suspension (107 CFU/mL). The wound infection model was successfully established 24 h later. Infected mice were randomly divided into five groups (n = 5 per group): 0.9% NaCl, 0.9% NaCl + L, A4 (0.2 mg/kg), A4 + L, and vancomycin (0.4 mg/kg) as the positive control. Drugs were topically applied to the wounds, with the laser-irradiated groups receiving 200 mW/cm2 irradiation for 10 min. The wound healing progression was photographically documented daily for 7 days post treatment, and the wound areas were quantified to evaluate the therapeutic outcomes. As shown in Figure 6b, control group mice developed severe abscesses (~50 mm2) on dorsal skin, whereas vancomycin (0.4 mg/kg) and A4 (0.2 mg/kg) treatments led to scab formation at infection sites. Notably, A4 + L (0.2 mg/kg) treatment significantly reduced abscess size. To further assess antibacterial efficacy, bacteria were harvested from wounds on days 1 and 7 post treatment for plate counting. MRSA colony counts markedly decreased in vancomycin- (0.4 mg/kg) and A4-treated (0.2 mg/kg) groups, while no colonies were observed in the A4 + L group, indicating complete bacterial eradication (Figure 6c).
Additionally, to more intuitively evaluate the effect of A4 on infected wounds under light conditions, a semiquantitative analysis of wound areas across treatment groups was performed. The results showed that on day 7 post treatment, the wound area in the A4 + L group decreased to 0.03% of the original size, whereas the 0.9% NaCl and vancomycin groups exhibited final wound areas of 0.06% and 0.26%, respectively. This indicates that A4 combined with laser irradiation significantly enhanced anti-MRSA activity, demonstrating greater potential than vancomycin (Figure 6d). Further histological examinations with H&E and Masson staining were conducted on skin tissues. As shown in Figure 6e, after 7 days of treatment, H&E staining revealed extensive cellular voids, disrupted tissue integrity, increased inflammatory cell infiltration, and thickened epidermal layers in the 0.9% NaCl and 0.9% NaCl + L groups after MRSA infection. Vancomycin treatment reduced inflammatory cell infiltration. In the A4 group, wound sections displayed mostly healed tissue with vigorous cellular growth, though partial gaps and residual cell loss persisted. In contrast, the A4 + L group exhibited complete tissue restoration with normal architecture, no cellular defects, newly formed hair follicles, and markedly reduced inflammatory infiltration. These findings confirm the superior wound healing efficacy of A4 + L compared to the control groups.
To further analyze the wound healing activity of A4, we employed Masson staining to assess collagen degradation and deposition at inflammatory sites. Results revealed that the A4 + L group exhibited densely structured collagen fibrils (stained blue), with the highest collagen deposition in the dermis and thickened collagen fibers by day 7. In contrast, the control groups showed predominantly red-stained collagen fibrils, suggesting residual collagen degradation in these groups. These findings demonstrate that ROS generated using A4 under light conditions effectively treat MRSA skin infections and promote tissue remodeling and regeneration in mice.

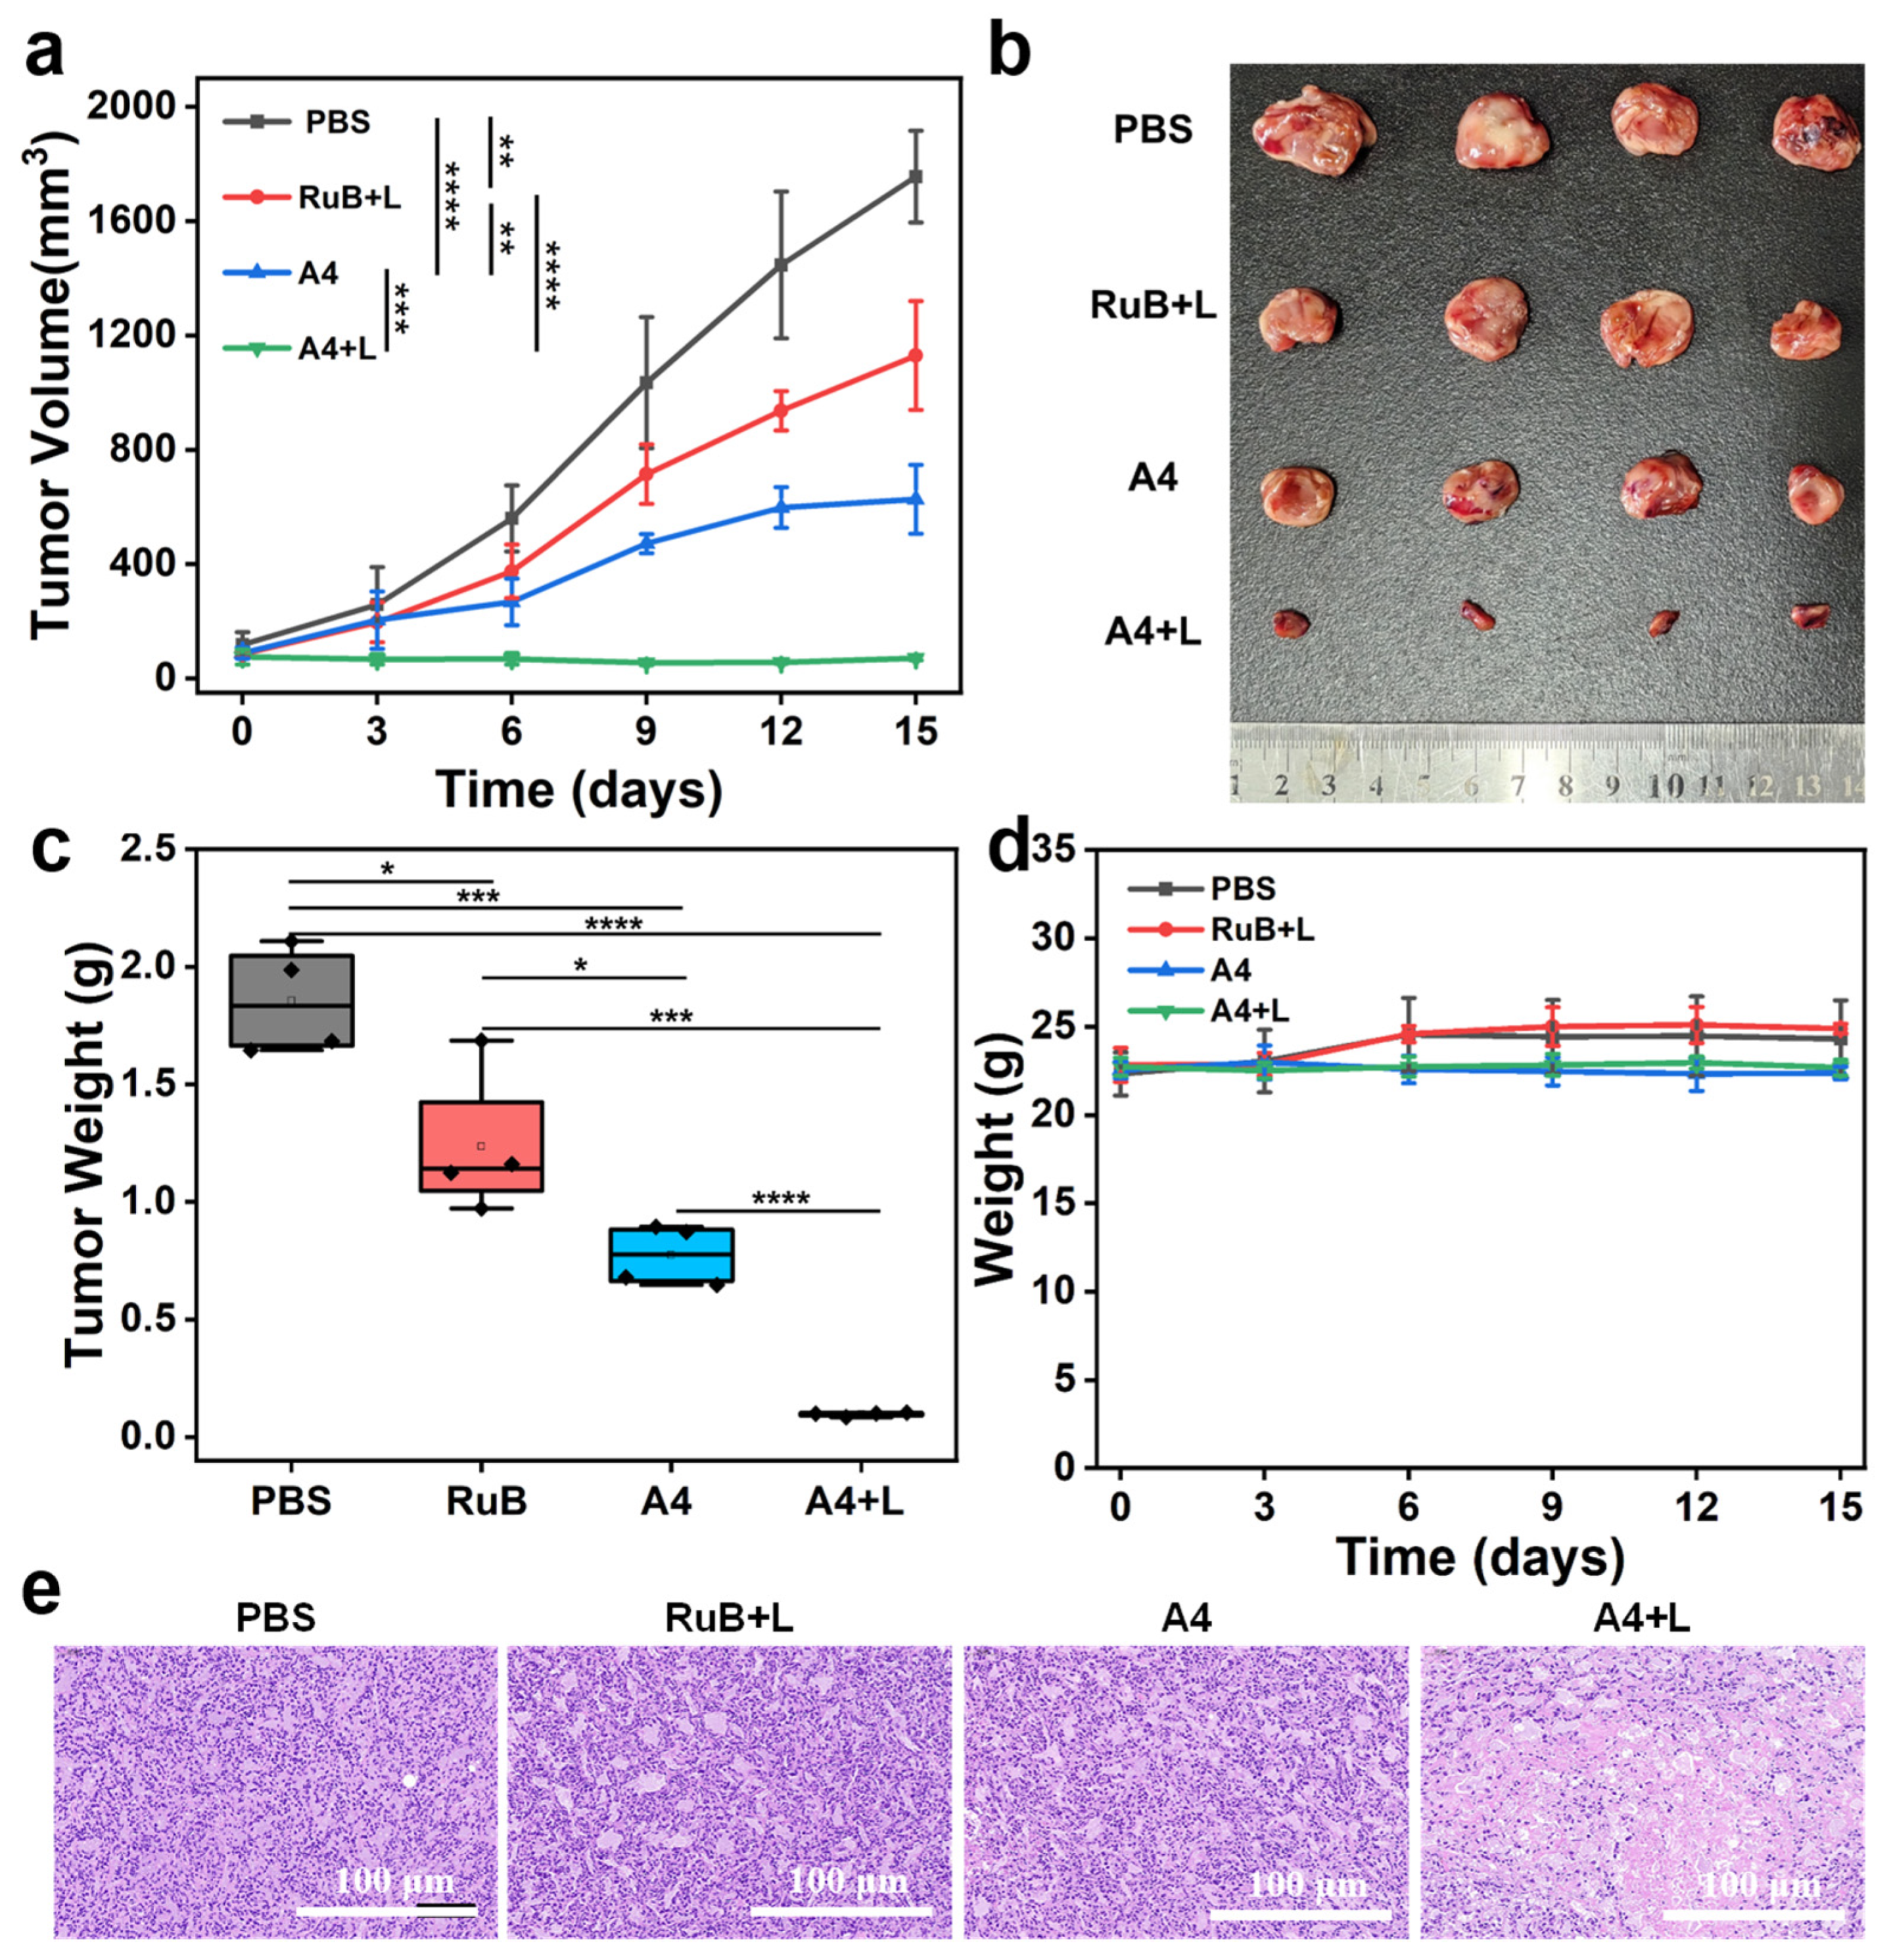
2.9. In Vivo Antitumor Assessment

Given A4’s significant ability to promote ROS generation in tumor cells and its potent photodynamic antitumor efficacy, we further evaluated its in vivo chemo-photodynamic therapy performance in an HT-29 tumor-bearing mouse model. When tumor volumes reached approximately 80 mm3, mice were randomized into four groups (n = 4 per group): PBS control, RuB + L, A4 alone, and A4 + L, and the drug was administered via intratumoral injection at a dose of 10 mg/kg every three days for a total of five times. Tumor volumes and body weights were measured every 3 days over a 15-day treatment period. The results demonstrated rapid tumor growth in the PBS and RuB + L groups. In contrast, the A4 group exhibited significantly slowed tumor progression, achieving an inhibition rate of 64.3%, far surpassing the RuB control (35.7% inhibition) and likely attributed to A4’s inherent chemotherapeutic activity. Notably, A4 combined with laser irradiation (A4 + L) induced remarkable tumor suppression, with an inhibition rate of 96.0%, significantly outperforming A4 alone and underscoring the efficacy of chemo-photodynamic synergy (Figure 7a). Upon completion of the study, the excised tumor tissues were weighed. Compared to the PBS group, A4 + L reduced tumor weight by 94.7%, whereas RuB + L and A4 alone achieved reductions of 33.4% and 58.3%, respectively (Figure 7b,c).
Furthermore, no significant changes in body weight were observed across any group during the treatment period (Figure 7d). At the end of the study, major organs and tumor samples from each group were collected for hematoxylin and eosin (H&E) staining. Histological evaluation revealed no apparent pathological damage in organ samples, with tissue sections maintaining the normal cellular morphology and architecture (Figure S10). H&E-stained tumor sections from the A4 + L group exhibited widespread nuclear pyknosis and enhanced cytoplasmic eosinophilia, indicative of therapy-induced antitumor effects. Serum biochemical analysis further demonstrated that the liver function markers (ALT/AST) and renal function indicators (CREA/UREA) remained within the normal ranges, showing no statistically significant differences compared to the PBS control group (Figure S11). Combined with histopathological and blood biochemical results, these data suggest the negligible systemic toxicity of A4. These findings underscore that A4 not only exhibits robust in vivo antitumor efficacy, but also demonstrates high safety.

3. Materials and Methods

3.1. Reagents and Instruments

All chemical agents and solvents, including 1,1,2-Trimethyl-1H-benz[e]indole (compound 1) and N-Ethyl-3-carbazolecarboxaldehyde (compound 3), were provided by commercial suppliers (Shanghai Aladdin Biochemical Technology Co., Ltd., Shanghai, China) without further purification. TLC was used to monitor all reactions. The silica gel column was used to purify the reaction products. Moreover, 2′,7′-dichlorodihydrofluorescein (DCFH) and dihydroethidium (DHE) were purchased from Meilun Pharmaceutical (Dalian Meilun Biotechnology Co., Ltd., Dalian, China). Hydroxyphenyl fluorescein (HPF) was purchased from Maclean Reagent (Macklin Biochemical Co., Ltd., Shanghai, China). Singlet oxygen sensor green (SOSG) reagent was purchased from Dalian Meilun Pharmaceutical (Dalian Meilun Biotechnology Co., Ltd., Dalian, China). Furthermore, 2′,7′-Dichlorodihydrofluorescein diacetate (DCFH-DA) was purchased from Sigma-Aldrich (Sigma-Aldrich (Shanghai) Trading Co., Ltd., St. Louis, MO, USA). Fetal bovine serum (FBS) was purchased from Thermo Fisher Scientific (Thermo Fisher Scientific Co., Ltd., Waltham, MA, USA). MTT, DMSO, DAPI, and paraformaldehyde solution (4% PFA) were purchased from Beyotime Biotechnology (Beyotime Biotechnology Co., Ltd., Shanghai, China). Live/dead viability/cytotoxicity kits were purchased from Meilun Pharmaceutical (Dalian Meilun Biotechnology Co., Ltd., Dalian, China).
The target compounds were characterized using 1H NMR, 13C NMR, and High-Resolution Mass Spectrometry (HRMS). 1H NMR and 13C NMR were recorded on a Bruker Advance DPX spectrometer from Bruker Corporation (Bruker BioSpin GmbH, Rheinstetten, Germany) at 400 and 100 MHz, respectively. Chemical shifts δ were reported in parts per million (ppm) and coupling constants J in hertz (Hz). HRMS was recorded using an Agilent Technologies LC/MSD TOF from Agilent Technologies (Agilent Technologies Inc., Santa Clara, CA, USA). The UV-Vis absorption spectra were recorded on a spectrometer (Shimadzu Corporation, Kyoto, Japan). The excitation and emission spectra were measured on a SHIMADZU RF-5301PC Fluorescence Spectrometer from Shimadzu Corporation (Shimadzu Corporation, Kyoto, Japan). Tissue sections were obtained through a Leica RM2245 semiautomatic rotary slicer from Leica Microsystems (Leica Camera AG, Wetzlar, Germany). The CLSM images were acquired using a Leica TCS SP8 from Leica Microsystems (Leica Camera AG, Wetzlar, Germany). The laser source we used was LWRPD-200F from Beijing Laserwave Optoelectronics (Beijing Laserwave Optoelectronics Technology Co., Ltd., Beijing, China).

3.2. Synthetic Approach

The synthesis processes of compounds 2, 4, and 5 were referred to in the previous literature [38,39,40].

3.2.1. Synthetic Method of (E)-2-(2-(9-Ethyl-9H-carbazol-3-yl)vinyl)-1,1,3-trimethyl-1H-benzo[e]indol-3-ium (A1)

First, 9-Ethyl-9H-carbazole-3-carboxaldehyde (223.10 mg, 1.0 mmol) was dissolved with 1,1,2,3-tetramethyl-1H-benzo[e]indol-3-ium (349.03 mg, 1.1 mmol) in anhydrous ethanol in a Schlenk tube of 25 mL, 2 drops of piperidine as the base, and the reaction was carried out at 80 °C for 30 min. After the completion of the reaction, the solvent was spun dry, and the red solid A1 was purified in a 60% yield using petroleum ether/dichloromethane (1:2, v/v) as the eluent for column chromatography. 1H NMR (400 MHz, DMSO-d6) δ 8.90–8.84 (m, 1H, ArH), 8.60–8.50 (m, 1H, ArH), 8.35–3.32 (m, 1H, ArH), 8.30 (d, J = 7.6 Hz, 1H, ArH), 8.17 (q, J = 1.9 Hz, 1H, ArH), 8.16–8.11 (m, 2H, 2ArH), 7.84 (ddd, J = 9.0, 4.5, 2.5 Hz, 2H, 2ArH), 7.75 (d, J = 6.8 Hz, 1H, ArH), 7.72 (s, 1H, ArH), 7.68–7.61 (m, 1H, ArH), 7.57 (td, J = 7.6, 1.5 Hz, 1H, ArH), 7.46 (d, J = 7.2 Hz, 1H, CH=CH), 7.39–7.27 (m, 1H, CH=CH), 4.54 (q, J = 7.0 Hz, 2H, CH2), 4.04 (s, 3H, CH3), 1.92–1.86 (m, 6H, 2CH3), and 1.37 (t, J = 7.1 Hz, 3H, CH3). 13C NMR (101 MHz, CDCl3) δ 164.6, 140.7, 129.9, 129.7, 129.0, 128.8, 128.5, 127.2, 126.8, 126.4, 124.1, 123.5, 123.2, 123.1, 121.5, 121.4, 120.8, 120.3, 109.2, 108.7, 108.6, 73.1, 38.0, 29.8, 26.9, and 13.9. ESI-MS (m/z): calcd for C31H29N2+: 429.2325, found 429.2316.

3.2.2. Synthetic Method of (E)-2-(2-(9-Ethyl-6-nitro-9H-carbazol-3-yl)vinyl)-1,1,3-trimethyl-1H-benzo[e]indol-3-ium (A2)

Second, 9-Ethyl-6-nitro-9H-carbazole-3-carboxaldehyde (268.08 mg, 1.0 mmol) was dissolved with 1,1,2,3-tetramethyl-1H-benzo[e]indol-3-ium (349.03 mg, 1.1 mmol) in anhydrous ethanol in a Schlenk tube of 25 mL, and 2 drops of piperidine were used as the base for the reaction, which was carried out at 80 °C for 30 min. After the reaction was complete, the solvent was spun dry and the red solid A2 was purified via column chromatography using dichloromethane as the eluent in a 65% yield. 1H NMR (400 MHz, DMSO-d6) δ 9.26 (d, J = 2.3 Hz, 1H, ArH), 9.15 (d, J = 1.6 Hz, 1H, ArH), 8.61 (s, 1H, ArH), 8.43 (dd, J = 9.1, 2.3 Hz, 1H, ArH), 8.40–8.35 (m, 1H, ArH), 8.23–8.14 (m, 3H, 3ArH), 7.94 (dd, J = 9.0, 7.3 Hz, 2H, 2ArH), 7.86 (d, J = 8.7 Hz, 1H, ArH), 7.80–7.73 (m, 2H, 2CH=CH), 7.66 (s, 1H, ArH), 4.62 (q, J = 7.3 Hz, 2H, CH2), 3.95 (s, 3H, CH3), 2.42 (s, 6H, 2CH3), and 1.91 (s, 3H, CH3). 13C NMR (101 MHz, CDCl3) δ 193.1, 158.8, 149.8, 143.1, 142.7, 142.3, 142.1, 138.2, 134.1, 131.6, 129.6, 129.5, 128.9, 121.8, 121.4, 121.0, 120.4, 114.5, 113.8, 110.0, 109.9, 32.5, 32.4, 29.7, 24.1, and 23.9. ESI-MS (m/z): calcd for C31H28N3O2+: 474.2176, found 474.2166.

3.2.3. Synthetic Method of (E)-2-(2-(6-Amino-9-ethyl-9H-carbazol-3-yl)vinyl)-1,1,3-trimethyl-1H-benzo[e]indol-3-ium (A3)

Third, (E)-2-(2-(9-ethyl-6-nitro-9H-carbazol-3-yl)vinyl)-1,1,3-trimethyl-1H-benzo[e]indol-3-ium (4d) (601.12 mg, 1.0 mmol) was solubilized with ethanol (3 mL), saturated ammonium chloride solution (1 mL) was added, (558.45 mg, 10.0 mmol) iron powder was added, and it was reacted for half an hour. After the reaction was complete, the residual iron powder was washed off with methanol, concentrated under reduced pressure, and purified using dichloromethane: methanol (5:1, v/v) as the eluent of column chromatography to obtain the purplish-red solid A3 in a 65% yield. 1H NMR (400 MHz, DMSO-d6) δ 8.44 (d, J = 1.7 Hz, 1H, ArH), 8.18 (d, J = 8.4 Hz, 1H, ArH), 8.07–8.00 (m, 2H, 2ArH), 7.95 (d, J = 8.5 Hz, 1H, ArH), 7.88 (s, 1H, ArH), 7.79 (d, J = 8.5 Hz, 1H, ArH), 7.64–7.58 (m, 1H, ArH), 7.54 (d, J = 8.6 Hz, 1H, ArH), 7.49 (s, 1H, CH=CH), 7.40–7.31 (m, 3H, 3ArH), 6.87 (s, 1H, CH=CH), 4.94 (s, 2H, NH2), 4.36 (q, J = 6.8 Hz, 2H, CH2), 3.96 (s, 3H, CH3), 1.67 (s, 6H, 2CH3), and 1.30 (t, J = 7.0 Hz, 3H, CH3). 13C NMR (101 MHz, DMSO-d6) δ 192.4, 158.6, 149.4, 148.5, 143.9, 140.6, 138.1, 138.0, 135.4, 130.1, 129.8, 128.9, 128.7, 127.3, 126.6, 125.8, 123.9, 122.9, 122.7, 122.3, 120.0, 119.3, 111.7, 110.3, 45.5, 38.0, 37.8, 20.1, and 14.4. ESI-MS (m/z): calcd for C31H30N3+: 444.2434, found 444.2427.

3.2.4. Synthetic Method of (E)-2-(2-(6-Bromo-9-ethyl-9H-carbazol-3-yl)vinyl)-1,1,3-trimethyl-1H-benzo[e]indol-3-ium (A4)

Fourth, 6-Bromo-9-ethyl-9H-carbazole-3-carboxaldehyde (301.01 mg, 1.0 mmol) was dissolved with 1,1,2,3-tetramethyl-1H-benzo[e]indol-3-ium (601.12 mg, 1.1 mmol) in anhydrous ethanol in a 25 mL Schlenk tube, with 2 drops of piperidine as the base, and the reaction was carried out at 80 °C for 30 min. After the reaction was complete, the solvent was spun dry and purified to a dark red solid in a 65% yield using dichloromethane: methanol (5:1, v/v) as the eluent for column chromatography. 1H NMR (400 MHz, DMSO-d6) δ 8.91–8.83 (m, 1H, ArH), 8.35 (dd, J = 8.4, 3.2 Hz, 1H, ArH), 8.30 (d, J = 7.6 Hz, 1H, ArH), 8.19–8.10 (m, 3H, 3ArH), 7.84 (ddd, J = 8.9, 4.5, 2.2 Hz, 2H, 2ArH), 7.73 (d, J = 8.3 Hz, 2H, 2ArH), 7.72–7.70 (m, 2H, 2ArH), 7.60–7.55 (m, 1H, CH=CH), 7.36–7.33 (m, 1H, CH=CH), 4.54 (q, J = 7.1 Hz, 2H, CH2), 4.04 (s, 3H, CH3), 1.92–1.86 (m, 6H, 2CH3), and 1.37 (t, J = 7.1 Hz, 3H, CH3). 13C NMR (101 MHz, CDCl3) δ 192.9, 158.8, 149.8, 148.3, 142.8, 141.9, 138.1, 134.0, 129.6, 129.5, 129.3, 129.3, 128.1, 123.8, 123.4, 123.2, 122.2, 118.4, 117.0, 110.8, 109.9, 32.5, 32.4, 24.1, 24.1, and 23.9. ESI-MS (m/z): calcd for C31H28BrN2+: 507.1430, found 507.1421.

3.3. In Vitro ROS Detection

Fluorescence spectroscopy was used to evaluate the ability and nature of A1A4 to generate ROS. Firstly, 2′,7′-Dichlorodihydrofluorescein (DCFH) was employed as a universal ROS indicator, while dihydroethidium (DHE) and hydroxyphenyl fluorescein (HPF) served as Type I ROS indicators, and singlet oxygen sensor green (SOSG) reagent was used as a Type II ROS indicator. The total ROS indicator DCFH is oxidized to dichlorofluorescein (DCF) in the presence of ROS in the system, leading to an increase in the fluorescence intensity at 523 nm. DHE, as a superoxide anion indicator, reacts with superoxide anion to generate ethidium, enhancing the fluorescence intensity at 595 nm. HPF, used to detect hydroxyl radicals, exhibits increased fluorescence intensity at 515 nm. The SOSG reagent, as a singlet oxygen indicator, is oxidized to fluorescein upon interaction with singlet oxygen, resulting in enhanced fluorescence intensity at 520 nm. During the experiments, A1A4 were dissolved in an aqueous solution containing 5% DMSO, with the final concentration adjusted to 10 μM. The concentrations of DCFH, HPF, and DHE were set to 10 μM, while the SOSG reagent was used at 5 μM. At different time points, the samples were irradiated with a 520 nm laser (power density: 100 mW/cm2). Subsequently, fluorescence emission spectra were recorded using [Ru(bpy)3]2+ (RuB) as a positive control for ROS generation. For all indicators (DCFH, DHE, HPF, and SOSG reagent), the excitation wavelength was fixed at 488 nm.

3.4. ESR Detection

EPR spectra were recorded using an ESR spectrometer model: A300-10/12 from Bruker (Bruker BioSpin GmbH, Rheinstetten, Germany), with DMPO (5,5-dimethyl-1-pyrroline N-oxide) from Sigma-Aldrich (Sigma-Aldrich (Shanghai) Trading Co., Ltd., St. Louis, MO, USA) as the O2•−,•OH trapping agent and TEMP (4-amino-2,2,6-tetramethylpiperidine) from Sigma-Aldrich (Sigma-Aldrich (Shanghai) Trading Co., Ltd., St. Louis, MO, USA) as the 1O2 trapping agent. The free radical signals of A4 were detected under laser irradiation and non-irradiation conditions. Light source: 520 nm, 100 mW/cm2, 10 min.

3.5. DFT

Computational DFT calculations were performed using Gaussian09 software (Gaussian, Inc., Wallingford, CT, USA). An initial model was generated using the crystal structure and the resulting data was analyzed using GaussView5 from Gaussian, Inc. (Gaussian, Inc., Wallingford, CT, USA).

3.6. Cell Lines and Culture Conditions

Mouse breast adenocarcinoma cell line (4T1), human lung adenocarcinoma cell line (A549), and human colorectal adenocarcinoma cell line (HT29) were purchased from (Shanghai Institute of Cell Biology, Shanghai, China). Cells were cultured in DMEM containing 10% fetal bovine serum and 1% penicillin–streptomycin (100×). The incubation conditions were set at 37 °C, 5% CO2, and 95% humidity. Cells were incubated at 37 °C under hypoxic conditions with 2% O2 and 5% CO2.

3.7. Cytotoxicity

Cells (1 × 10⁵ cells) were seeded and cultured under normoxic conditions (21% O2) or hypoxic conditions (2% O2) for 24 h. Different concentrations of A1A4 were incubated with the cells in the dark for 24 h. For the light-treated groups, cells were irradiated with a 520 nm laser (100 mW/cm2) for 10 min and further cultured for 24 h. Under hypoxic conditions (37 °C, 2% O2, and 5% CO2), cells were incubated in a tri-gas incubator for 12 h, treated with A4 (0.125, 0.25, 0.5, 1, and 2 μM) with or without 520 nm laser irradiation (100 mW/cm2, 10 min), and then cultured for an additional 24 h. Subsequently, MTT solution (0.5 mg/mL, 20 μL) was added, and cells were incubated at 37 °C for 4 h. The medium was then removed, and 150 μL of DMSO was added to each well to dissolve the formazan crystals. Absorbance at 490 nm was measured using a microplate reader to determine the cell growth inhibition rate.

3.8. Staining of Live and Dead Cells

HT-29 (2 × 10⁵ cells/mL) was treated with DMEM containing A4 (5 μM) for 1 h. Subsequently, the cells were incubated with Calcein-AM (2 μM) and PI (8 μM) for another 30 min. Finally, images were acquired using a Leica TCS SP8 confocal microscope. The excitation wavelength was 488 nm, and the emission wavelengths of Calcein-AM and PI were 500–530 nm and 600–630 nm, respectively.

3.9. Intracellular ROS Detection

The HT-29 cells (1 × 10⁴ cells/well) were cultured for 24 h. The cells were then incubated with A4 (5 μM) under normoxic (21% O2) or hypoxic (2% O2) conditions for 2 h, followed by co-incubation with DCFH-DA or DHE (10 μM) for 30 min. Hoechst 33342 (10 μM, Beyotime Biotechnology, Shanghai, China) was used for nuclear staining, and imaging was performed using a Leica TCS SP8 confocal fluorescence microscope.

3.10. Bacterial Culture

MRSA strains and type identification were provided by the subject of Mr. Yuan Zhenwei of China Pharmaceutical University, and all the above strains were cultured in LB liquid medium (Haibo Biotechnology Co., Ltd., Qingdao, China) in a 37 °C incubator.

3.11. In Vitro Antimicrobial Assay

The evaluation of antibacterial activity was carried out using broth microdilution (turbidimetric method), CCK-8 assay, and the plate coating method on MRSA.
Turbidimetric method: Nutrient broth (NB) medium was used to prepare a two-fold dilution of drug-containing suspensions. In a 96-well plate, 100 μL of the diluted bacterial suspension and 100 μL of liposome solution were added to each well, resulting in a final volume of 200 μL per well. After light irradiation, the plate was incubated at 37 °C for 16 h. Turbidity was observed and compared with the control, and the absorbance at 600 nm was measured. OD600 represents turbidity, measured at a wavelength in the yellow range. A linear relationship exists between the bacterial concentration (dry weight) and absorbance at 600 nm.
CCK-8 assay: Nutrient broth (NB) medium was used to prepare a two-fold dilution of drug-containing suspensions. In a 96-well plate, 100 μL of the diluted bacterial suspension and 100 μL of liposome solution were added to each well, resulting in a final volume of 200 μL per well. After light irradiation, the plate was incubated at 37 °C for 16 h. Then, 10 μL of CCK-8 solution was added to each well, and absorbance at 450 nm was measured.
Plate coating method for antibacterial activity evaluation: MRSA was selected as the test strain. A 100 μL bacterial suspension (1.0 × 10⁵ CFU/mL) was added to a 96-well plate, with four parallel groups (A1, A2, A3, A4) set up to maintain a final volume of 200 μL. Each group was irradiated with a 520 nm laser for 5 min. Subsequently, 100 μL of the treated bacterial suspensions from different groups was spread onto agar plates and incubated at 37 °C for 24 h. Finally, the colonies were counted to determine the synergistic photodynamic antibacterial activity of A4.

3.12. Bacterial-Level ROS

Positive MRSA bacteria were selected to assess the ROS-generating capacity of bacterial-level A4. Three groups were set up in parallel (PBS, A4, and A4 + L). In 1 mL of bacterial suspension (1.0 × 10⁸ CFU/mL), DCFH-DA (ROS commercial fluorescent probe) was added and incubated at 37 °C in an incubator for 30 min. Then, the bacterial suspension was centrifuged (5000 rpm, 3 min) after being treated in different experimental conditions in different groups, rinsed twice with sterile saline (0.9%), and then, the suspension was resuspended in 0.9% saline and added to a laser confocal dish, and the green fluorescence intensity of each group was observed via confocal microscopy to evaluate the ROS production ability at the bacterial level.

3.13. Evaluation of Bacterial Membrane Rupture via Scanning Electron Microscopy

MRSA was selected as the test strain. SEM was performed to evaluate the disruption of bacterial membranes by A4 under 520 nm laser irradiation. Four parallel groups (PBS + L, Van, A4, and A4 + L) were established. Bacterial suspensions with OD600 values of 0.5–0.8 were treated with A4 (1 μM) under different experimental conditions. The samples were then processed as follows: centrifugation, supernatant removal, collection of bacterial pellets, washing three times with 0.9% saline solution, fixation with 2% glutaraldehyde, dehydration, and imaging via SEM to characterize the bacterial membrane morphology.

3.14. Construction of an Animal Superficial Infection Model

ICR mice were selected as experimental subjects (18 g, 6–8 weeks), anesthetized with isoflurane(RWD Life Science Co., Ltd., Shenzhen, China), their hair was removed from the surgical area, and a 1 × 1 cm2 skin wound was created with a scalpel. The wounds were cleaned with saline and then infected with MRSA bacterial solution (1 × 10⁸ CFU, 200 μL) for 1 day. The superficial bacterial infection model was established on mice. During the experimental period, the wounds were covered with sterile gauze and secured with an elastic bandage, and adequate food and water were given.

3.15. Evaluation of Therapeutic Efficacy in Animal Skin Infection Models

After the successful establishment of the animal skin infection model, five parallel groups (0.9% NaCl, 0.9% NaCl +L, 0.4 mg/kg Van, 0.2 mg/kg A4, and 0.2 mg/kg A4 +L) were set up, with 5 mice per group. During treatment, 200 μL of the corresponding drug solution was topically sprayed onto the infected skin area. Light-treated groups received 520 nm laser irradiation (5 min) on the wound region, while non-irradiated groups were kept in the dark. The wound size and healing status of the infected skin were statistically analyzed daily to evaluate therapeutic efficacy under different treatments. On day 8, skin tissues from the wound sites were harvested and fixed with 4% paraformaldehyde. Histopathological sections were prepared and stained with hematoxylin and eosin (H&E) to assess granulation tissue formation and wound healing progression. Masson’s trichrome staining was further performed to evaluate collagen deposition.

3.16. In Vivo Antitumor Studies

All animal experiments were approved by the Animal Research and Care Committee of Nantong University (Approval No. S20210925-003) and complied with the National Research Council’s Guide for the Care and Use of Laboratory Animals. Female Balb/c-nude mice (6–8 weeks old, 18–20 g) were purchased from Nanjing Jicui Yaokang Biotechnology Co., Ltd. (Nanjing, China). A 100 μL PBS suspension containing 2 × 10⁶ HT29 cells was subcutaneously injected into the right flank of each mouse. When the tumor volumes reached 80 mm3, the mice were randomly divided into four groups (n = 4 per group): PBS, RuB + L, A4, and A4 + L. Drugs were administered via intratumoral injection at a dose of 10 mg/kg. At 2 h post injection, the light-treated groups (RuB + L and A4 + L) were irradiated with a 520 nm laser (100 mW/cm2, 10 min). Treatments were repeated every 3 days for a total of 5 cycles. Next, the tumor volumes as well as body weights of mice in different treatment groups were recorded for 15 days. At the end of the experiment, the mice were euthanized, and the tumors were excised and weighed for antitumor evaluation. The excised tumors and major organs were sectioned and stained with hematoxylin and eosin (H&E) to observe the morphological changes in tumor cells. Masson’s trichrome staining was used to assess collagen degradation. The tumor volume (V) was calculated using the following formula: V = 1/2 × a × b2. V represents the tumor volume, a represents the longest diameter of the tumor site, and b represents the diameter perpendicular to a.

3.17. H&E Coloring

After the drug effect experiment, Balb/c mouse tumors and major organs such as the heart, liver, spleen, lung, kidney, and so on were dissected and placed in 4% paraformaldehyde for fixation, and then they were subjected to routine operations such as dehydration, transparency, paraffin embedding, and sectioning, etc. Finally, they were stained with H&E using a hematoxylin eosin staining kit (Beyotime Biotechnology Co., Ltd., Shanghai, China) for the relevant histopathological analyses.

3.18. Blood Biochemistry Analysis

A4 was administered to ICR mice at a dose of 5 mg/kg via the tail vein, and blood was obtained 1 day later for relevant blood biochemical analyses: the first category was renal function markers, including creatinine and blood urea nitrogen; the second category was liver function markers, including alanine aminotransferase and aspartate aminotransferase from (Jiancheng Bioengineering Institute, Nanjing, China).

4. Conclusions

In this study, we designed and synthesized novel carbazole/benzindole photosensitizers A1A4, and evaluated the antimicrobial and antitumor activities of compound A4 under the synergistic effect of PDT, revealing its dual therapeutic potential. In in vitro antimicrobial assays, A4 exhibited a concentration-dependent inhibitory effect on MRSA by significantly inducing ROS generation under light conditions, and its antimicrobial activity was comparable to that of vancomycin and superior to that of levofloxacin. Scanning electron microscopy and fluorescence probe experiments further confirmed that A4 synergistically exerted its bactericidal effect by disrupting the integrity of bacterial membranes and inducing ROS burst. In the MRSA-infected mouse skin wound model, A4 combined with light treatment not only eliminated the wound bacteria completely, but also accelerated wound healing significantly (the wound area was reduced to 0.03% by day 7), and achieved functional repair by promoting collagen deposition and epidermal regeneration.
In addition, in the HT-29 tumor model, A4’s PDT synergistic chemotherapy strategy demonstrated excellent antitumor effects (96% inhibition rate) and did not trigger significant hepatic or renal functional damage or histopathological abnormalities, indicating its good in vivo safety. Comprehensively, A4 achieved dual precision intervention against drug-resistant bacterial infections and solid tumors by targeting and regulating ROS generation through photodynamic effects. These multifunctional properties provide a theoretical basis for its application in clinical combination therapy, especially in complex cases of drug-resistant bacterial infections combined with tumors. Future studies are needed to further analyze the molecular targets of A4, optimize its photosensitivity stability and delivery efficiency, and explore its efficacy in multidrug-resistant pathogens and metastatic tumor models.

Supplementary Materials

The following supporting information can be downloaded at: https://www.mdpi.com/article/10.3390/molecules30122560/s1. Additional experimental details and methods, including synthetic procedures for compounds A1A4, characterization data (1H NMR, 13C NMR, and ESI-HRMS), and HPLC purity analysis (Figures S12–S27). Photophysical properties: UV-Vis absorption spectra, fluorescence emission spectra (Figures S1–S4), and ESR detection of ROS (Figure S6). In vitro cytotoxicity assays under normoxic/hypoxic conditions (MTT results, Table S1), inhibitory activity of A4 on hypoxic HT29 cells with/without irradiation (Figure S5), live/dead cell staining (Figure S8), and intracellular ROS detection (DCFH-DA and DHE assays, Figure 4). Antibacterial studies: turbidimetric method, CCK-8 assay, plate coating method, bacterial membrane integrity evaluation via SEM (Figure 5n), and bacterial-level ROS generation (Figure S9). In vivo models: MRSA-infected skin wound healing assessment (Figure 6), including histopathological analysis (H&E and Masson staining). Antitumor efficacy in HT-29 xenograft models (Figure 7), tumor volume/weight data, and H&E staining of tumor tissues. Safety evaluations: Blood biochemical analysis (ALT, AST, CREA, UREA) (Figure S11). Histopathology of major organs (heart, liver, spleen, lung, kidney) via H&E staining (Figure S10). Computational studies: HOMO-LUMO energy gaps and spin-state energy differences (ΔEST) for A4 (Figure S7). Supplementary figures: fluorescence spectra for ROS detection (Figures S1–S4), ESR signals (Figure S6), and confocal microscopy images (Figures S8 and S9).

Author Contributions

Conceptualization, Y.L. and L.W.; methodology, Y.M., K.X., Y.L. and L.W.; software, Y.M., J.Z. and Z.Y.; validation, X.L. and J.Z.; formal analysis, Z.W.; investigation, X.L. and Y.M.; resources, Z.W.; data curation, X.L., Y.M., J.Z., K.X. and Y.C.; writing—original draft preparation, Z.W.; writing—review and editing, Y.L. and L.W.; visualization, Z.W.; supervision, Y.C., Z.Y., Y.L. and L.W.; project administration, X.L.; funding acquisition, Y.L. All authors have read and agreed to the published version of the manuscript.

Funding

This research received no external funding.

Institutional Review Board Statement

Not applicable.

Informed Consent Statement

Not applicable.

Data Availability Statement

The data presented in this study are available in the article.

Conflicts of Interest

The authors declare no conflicts of interest.

Abbreviations

The following abbreviations are used in this manuscript:
PDTPhotodynamic Therapy
ROSReactive Oxygen Species
MRSAMethicillin-resistant Staphylococcus aureus
IC50Half-maximal Inhibitory Concentration
HOMOHighest Occupied Molecular Orbital
LUMOLowest Unoccupied Molecular Orbital
ESRElectron Spin Resonance
CFUColony-Forming Units
SEMScanning Electron Microscopy
H&EHematoxylin and Eosin
ALTAlanine Aminotransferase
ASTAspartate Aminotransferase
CREACreatinine
UREAUrea
DCFH-DA2′,7′-Dichlorodihydrofluorescein Diacetate
CCK-8Cell Counting Kit-8
RuBRuthenium-based photosensitizer

References

  1. Langouët-Astrié, C.; Oshima, K.; McMurtry, S.A.; Yang, Y.; Kwiecinski, J.M.; LaRivière, W.B.; Kavanaugh, J.S.; Zakharevich, I.; Hansen, K.C.; Shi, D.; et al. The influenza-injured lung microenvironment promotes MRSA virulence, contributing to severe secondary bacterial pneumonia. Cell Rep. 2022, 41, 111721. [Google Scholar] [CrossRef] [PubMed]
  2. Chen, H.; Li, Y.; Chen, D.; Fang, Y.; Gong, X.; Wang, K.; Ma, C. Photothermally enhanced antibacterial wound healing using albumin-loaded tanshinone IIA and IR780 nanoparticles. Front. Bioeng. Biotechnol. 2024, 12, 1487660. [Google Scholar] [CrossRef]
  3. Patel, H.; Patel, A.; Chauhan, R.; Bhavsar, T.; Rathod, S.; Kadam, M.; Rawat, A.; Rawat, S. Genotypic and phenotypic characterization of virulence in methicillin resistant Staphylococcus aureus isolated from a local hospital of Ahmedabad, Gujarat, India. BMC Microbiol. 2025, 25, 223. [Google Scholar] [CrossRef] [PubMed]
  4. Cao, Y.Q.; Tang, H.B.; Wang, G.H.; Li, P.Z.; Song, Z.; Li, W.Z.; Sun, X.L.; Zhong, X.X.; Yu, Q.Q.; Zhu, S.H.; et al. Targeting survivin with Tanshinone IIA inhibits tumor growth and overcomes chemoresistance in colorectal cancer. Cell Death Discov. 2023, 9, 351. [Google Scholar] [CrossRef]
  5. Yang, Y.; Wang, J.; Huang, S.; Li, M.; Chen, J.; Pei, D.; Tang, Z.; Guo, B. Bacteria-responsive programmed self-activating antibacterial hydrogel to remodel regeneration microenvironment for infected wound healing. Natl. Sci. Rev. 2024, 11, nwae044. [Google Scholar] [CrossRef]
  6. Sun, K.; Zhi, Y.; Ren, W.; Li, S.; Zheng, J.; Gao, L.; Zhi, K. Crosstalk between O-GlcNAcylation and ubiquitination: A novel strategy for overcoming cancer therapeutic resistance. Exp. Hematol. Oncol. 2024, 13, 107. [Google Scholar] [CrossRef]
  7. Xing, J.; Shan, J.; Xue, H.; Zhang, H.; Cheng, L.; Hao, J.; Wang, X. Multifunctional Adaptable Injectable TiN-Based Hydrogels for Antitumor and Antidrug-Resistant Bacterial Therapy. Adv. Healthc. Mater. 2024, 13, e2400297. [Google Scholar] [CrossRef] [PubMed]
  8. Wu, C.; Chen, W.; Yan, S.; Zhong, J.; Du, L.; Yang, C.; Pu, Y.; Li, Y.; Lin, J.; Zeng, M.; et al. MRI-guided photothermal/photodynamic immune activation combined with PD-1 inhibitor for the multimodal combination therapy of melanoma and metastases. Regen. Biomater. 2024, 11, rbae019. [Google Scholar] [CrossRef]
  9. Fan, G.; Yu, B.; Tang, L.; Zhu, R.; Chen, J.; Zhu, Y.; Huang, H.; Zhou, L.; Liu, J.; Wang, W.; et al. TSPAN8+ myofibroblastic cancer-associated fibroblasts promote chemoresistance in patients with breast cancer. Sci. Transl. Med. 2024, 16, eadj5705. [Google Scholar] [CrossRef]
  10. Wang, X.; Liu, T.; Lv, X.; Sun, N.; Li, F.; Luo, L.; Zhuge, X.; Huang, J.; Wang, L. A Potential Nontraditional Approach to Combat tmexCD1-toprJ1-Mediated Tigecycline Resistance: Melatonin as a Synergistic Adjuvant of Tigecycline. Antimicrob. Agents Chemother. 2023, 67, e0004723. [Google Scholar] [CrossRef]
  11. Wei, J.; Zhu, L.; Lu, Q.; Li, G.; Zhou, Y.; Yang, Y.; Zhang, L. Recent progress and applications of poly(beta amino esters)-based biomaterials. J. Control. Release 2023, 354, 337–353. [Google Scholar] [CrossRef] [PubMed]
  12. Shang, T.; Jia, Z.; Li, J.; Cao, H.; Xu, H.; Cong, L.; Ma, D.; Wang, X.; Liu, J. Unraveling the triad of hypoxia, cancer cell stemness, and drug resistance. J. Hematol. Oncol. 2025, 18, 32. [Google Scholar] [CrossRef]
  13. Bayat, M.; Nahand, J.S. Battlegrounds of treatment resistance: Decoding the tumor microenvironment. Naunyn Schmiedebergs Arch. Pharmacol. 2025. [Google Scholar] [CrossRef] [PubMed]
  14. Przygoda, M.; Bartusik-Aebisher, D.; Dynarowicz, K.; Cieślar, G.; Kawczyk-Krupka, A.; Aebisher, D. Cellular Mechanisms of Singlet Oxygen in Photodynamic Therapy. Int. J. Mol. Sci. 2023, 24, 16890. [Google Scholar] [CrossRef] [PubMed]
  15. Wu, Y.; Wang, Z.; Ge, Y.; Zhu, Y.; Tian, T.; Wei, J.; Jin, Y.; Zhao, Y.; Jia, Q.; Wu, J.; et al. Microenvironment Responsive Hydrogel Exerting Inhibition of Cascade Immune Activation and Elimination of Synovial Fibroblasts for Rheumatoid Arthritis Therapy. J. Control. Release 2024, 370, 747–762. [Google Scholar] [CrossRef]
  16. Liu, X.; Zheng, H.; Peng, Y.; Ji, D.; Wang, C.; Wang, D.; Jia, Z.; Chang, Y.; Cai, X.; Wang, L.; et al. Novel Ru(II) Complexes as Type-I/-II Photosensitizers for Multimodal Hypoxia-Tolerant Chemo-Photodynamic/Immune Therapy. Mol. Pharm. 2025, 22, 882–894. [Google Scholar] [CrossRef]
  17. Naskar, A.; Kim, K.S. Friends against the Foe: Synergistic Photothermal and Photodynamic Therapy against Bacterial Infections. Pharmaceutics 2023, 15, 1116. [Google Scholar] [CrossRef]
  18. Zhang, M.; Cheng, J.; Shen, Z.; He, K.; Zheng, B. Red light-triggered release of ROS and carbon monoxide for combinational antibacterial application. J. Mater. Chem. B 2024, 12, 1077–1086. [Google Scholar] [CrossRef] [PubMed]
  19. Wang, X.; Wang, H.; Cheng, J.; Li, H.; Wu, X.; Zhang, D.; Shi, X.; Zhang, J.; Han, N.; Chen, Y. Initiative ROS generation of Cu-doped ZIF-8 for excellent antibacterial performance. Chem. Eng. J. 2023, 466, 143201. [Google Scholar] [CrossRef]
  20. Wang, Y.; Wang, P.; Li, W.; Lin, Z.; Wang, Y.; Chen, Q.; Zhang, S.; He, Z.; Luo, C.; Sun, J. Cascaded multiresponsive supramolecular dimer-engineered nano-modulator enabling spatiotemporally adaptable tumor immune microenvironment remodeling in photodynamic immunotherapy. Nano Today 2024, 56, 102305. [Google Scholar] [CrossRef]
  21. Lu, X.X.; Xue, C.; Dong, J.H.; Zhang, Y.Z.; Gao, F. Nanoplatform-based strategies for enhancing the lethality of current antitumor PDT. J. Mater. Chem. B 2024, 12, 3209–3225. [Google Scholar] [CrossRef] [PubMed]
  22. Qian, J.; Xu, Z.; Meng, C.; Liu, J.; Hsu, P.L.; Li, Y.; Zhu, W.; Yang, Y.; Morris-Natschke, S.L.; Lee, K.H.; et al. Design and synthesis of benzylidenecyclohexenones as TrxR inhibitors displaying high anticancer activity and inducing ROS, apoptosis, and autophagy. Eur. J. Med. Chem. 2020, 204, 112610. [Google Scholar] [CrossRef]
  23. Chen, G.; Xu, Q.; Feng, Z.; Xu, Q.; Zhang, X.; Yang, Y.; Zhang, Y.; Liang, X.J.; Yu, Z.; Yu, M. Glutamine Antagonist Synergizes with Electrodynamic Therapy to Induce Tumor Regression and Systemic Antitumor Immunity. ACS Nano 2022, 16, 951–962. [Google Scholar] [CrossRef]
  24. Feng, Y.; Coradi Tonon, C.; Ashraf, S.; Hasan, T. Photodynamic and antibiotic therapy in combination against bacterial infections: Efficacy, determinants, mechanisms, and future perspectives. Adv. Drug Deliv. Rev. 2021, 177, 113941. [Google Scholar] [CrossRef] [PubMed]
  25. Hong, G.; Chang, J.E. Enhancing Cancer Treatment Through Combined Approaches: Photodynamic Therapy in Concert with Other Modalities. Pharmaceutics 2024, 16, 1420. [Google Scholar] [CrossRef]
  26. Zhao, Z.; Liu, J.; Wu, Y.; Liang, X.; Zhang, Y.; Li, T.; Wang, Y.; Luo, Y.; Wang, S.; Song, G.; et al. Ultrasound-driven nanoreactor with USP39 ShRNAi-intensified ferroptosis for synergistic sono-chemodynamic therapy. Chem. Eng. J. 2023, 471, 144154. [Google Scholar] [CrossRef]
  27. Wu, W.; Shao, X.; Zhao, J.; Wu, M. Controllable Photodynamic Therapy Implemented by Regulating Singlet Oxygen Efficiency. Adv. Sci. 2017, 4, 1700113. [Google Scholar] [CrossRef]
  28. Cui, M.; Tang, D.; Wang, B.; Zhang, H.; Liang, G.; Xiao, H. Bioorthogonal Guided Activation of cGAS-STING by AIE Photosensitizer Nanoparticles for Targeted Tumor Therapy and Imaging. Adv. Mater. 2023, 35, e2305668. [Google Scholar] [CrossRef] [PubMed]
  29. Liu, C.; Ji, X.; Yu, Z.; Zhang, S.; Zhang, R.; Zhao, W.; Dong, X. Discovery of Subcellular-Targeted Aza-BODIPY Photosensitizers for Efficient Photodynamic Antitumor Therapy. J. Med. Chem. 2023, 66, 7205–7220. [Google Scholar] [CrossRef]
  30. Dai, J.; Dan, W.; Ren, S.; Shang, C.; Wang, J. Design, synthesis and biological evaluations of quaternization harman analogues as potential antibacterial agents. Eur. J. Med. Chem. 2018, 160, 23–36. [Google Scholar] [CrossRef]
  31. Zhou, M.; Zhang, B.; Wang, T.; Xiao, P.; Cheng, L.; Tang, R. Synergistic antibacterial effect of quaternary ammonium salt functionalized metal-organic framework. Mater. Adv. 2024, 5, 7035–7039. [Google Scholar] [CrossRef]
  32. Zhao, Y.-Q.; Xiu, Z.; Wu, R.; Zhang, L.; Ding, X.; Zhao, N.; Duan, S.; Xu, F.-J. A Near-Infrared-Responsive Quaternary Ammonium/Gold Nanorod Hybrid Coating with Enhanced Antibacterial Properties. Adv. NanoBiomed Res. 2022, 2, 2200111. [Google Scholar] [CrossRef]
  33. Su, H.; Shang, W.; Li, G.; Yan, W.; Yan, X.; Tang, B.Z.; Qin, W. Near-Infrared II AIE Luminogens with Mitochondria-Targeting Characteristics for Combinational Phototherapies of Breast Tumors Through Synergistic Cell Apoptosis and Pyroptosis. Adv. Funct. Mater. 2025, 35, 2414976. [Google Scholar] [CrossRef]
  34. Xie, X.; Sun, T.; Pan, H.; Ji, D.; Xu, Z.; Gao, G.; Miao, J.; Wang, L.; Zhang, Y.; Liu, J.; et al. Development of Novel β-Carboline/Furylmalononitrile Hybrids as Type I/II Photosensitizers with Chemo-Photodynamic Therapy and Minimal Toxicity. Mol. Pharm. 2024, 21, 3553–3565. [Google Scholar] [CrossRef] [PubMed]
  35. Ling, Y.; Li, Y.; Zhu, R.; Qian, J.; Liu, J.; Gao, W.; Meng, C.; Miao, J.; Xiong, B.; Qiu, X.; et al. Hydroxamic Acid Derivatives of β-Carboline/Hydroxycinnamic Acid Hybrids Inducing Apoptosis and Autophagy through the PI3K/Akt/mTOR Pathways. J. Nat. Prod. 2019, 82, 1442–1450. [Google Scholar] [CrossRef]
  36. Liu, J.; Ou, X.; Wang, K.; Wang, K.; Gui, L.; Song, F.; Chen, C.; Lam, J.W.Y.; Yuan, Z.; Tang, B.Z. Two-Photon-Activated Heavy-Atom Free AIEgen for Highly Efficient Type I Photodynamic Therapy. Adv. Funct. Mater. 2024, 34, 2410202. [Google Scholar] [CrossRef]
  37. Banerjee, A.; Kundu, S.; Bhattacharyya, A.; Sahu, S.; Maji, M.S. Benzannulation strategies for the synthesis of carbazoles, indolocarbazoles, benzocarbazoles, and carbolines. Org. Chem. Front. 2021, 8, 2710–2771. [Google Scholar] [CrossRef]
  38. Huang, B.; Chen, W.; Kuang, Y.Q.; Liu, W.; Liu, X.J.; Tang, L.J.; Jiang, J.H. A novel off-on fluorescent probe for sensitive imaging of mitochondria-specific nitroreductase activity in living tumor cells. Org. Biomol. Chem. 2017, 15, 4383–4389. [Google Scholar] [CrossRef]
  39. Zhao, L.; Xu, Q.; Shao, Z.; Chen, Y.; Xue, Z.; Li, H.; Zhang, J. Enhanced Oxygen Reduction Reaction Performance Using Intermolecular Forces Coupled with More Exposed Molecular Orbitals of Triphenylamine in Co-porphyrin Electrocatalysts. ACS Appl. Mater. Interfaces 2020, 12, 45976–45986. [Google Scholar] [CrossRef]
  40. Patel, D.V.; Patel, N.R.; Kanhed, A.M.; Teli, D.M.; Patel, K.B.; Joshi, P.D.; Patel, S.P.; Gandhi, P.M.; Chaudhary, B.N.; Prajapati, N.K.; et al. Novel carbazole-stilbene hybrids as multifunctional anti-Alzheimer agents. Bioorg. Chem. 2020, 101, 103977. [Google Scholar] [CrossRef]
Figure 1. Chemical structures of novel carbazole/benzindole photosensitizers A1A4 and schematic diagram illustrating their ROS-mediated synergistic mechanisms: membrane disruption in MRSA and pro-apoptotic activity in tumor cells.
Molecules 30 02560 g001
Scheme 1. Synthetic route. (a) CH3I, CH3CN, 80 °C (b) C5H11N, ethanol, 80 °C, and 60–75% (c) CH3COOH, HNO3, 0 °C, and 85% (d) Fe, NH4Cl, 80 °C, and 55%, and (e) NBS, TBAB, 65 °C, and 85%.
Molecules 30 02560 sch001
Figure 2. UV–Vis (a) and fluorescence spectra (b) of compounds A1A4 (10 µM) in deionized water at room temperature. (c) DCFH for detecting ROS, (d) SOSG reagent for 1O2, (e) HPF for •OH, and (f) DHE for O2•− detection across various groups. The time interval for irradiation time t: 20 s. Light source: 520 nm, 50 mW/cm2.
Molecules 30 02560 g002
Figure 3. Inhibitory activities on 4T1 (a,d,g,j), A549 (b,e,h,k), and HT29 cells (c,f,i,l) exhibited by RuB and A1A4 with/without irradiation, L: light. Light source: 520 nm, 100 mW/cm2, 10 min, mean ± SD, n = 3, * p < 0.05, ** p < 0.01, *** p < 0.001, and **** p < 0.0001.
Molecules 30 02560 g003
Figure 4. (a) Fluorescence microscopic imaging of HT29 cells in different groups after treatment with DCFH-DA. (b) Average fluorescence intensity of DCFH-DA of HT29 cells in different groups. (cf) Fluorescence microimaging of 4T1 cells in different groups treated with DHE in (c) normoxic or (e) hypoxic environments. Average fluorescence intensity of DHE in HT29 cells of different groups in (d) normoxic or (f) hypoxic environments. L: light. Light source: 520 nm, 100 mW/cm2, 10 min, scale bar = 100 μm, mean ± SD, n = 3, ** p < 0.01, and *** p < 0.001.
Molecules 30 02560 g004
Figure 5. Anti-MRSA (ad,i,j) (original OD600 = 0.6) performance of A1A4 and (eh,k,l) the bacteriostatic efficacy of A1A4 was determined through the CCK-8 gradient dilution technique, with vancomycin and levofloxacin serving as the control agents. (m) The efficacy of plate streaking for treating MRSA with/without irradiation. Concentration: 1 μM. (n) The SEM images of MRSA subjected to various treatment groups. L: light. Light source: 520 nm, 100 mW/cm2, 5 min, scale bar = 200 nm, mean ± SD, n = 3, * p < 0.05, ** p < 0.01, *** p < 0.001, and **** p < 0.0001.
Molecules 30 02560 g005
Figure 6. (a) Establishment of a murine skin defect wound model infected with MRSA (b) the assessment of wound healing, (c) plate counting images of bacteria extracted from wounds, (d) quantitative analysis of wound area, and (e) histopathological evaluation via H&E and Masson staining across various treatment groups. L: light. Light source: 520 nm, 100 mW/cm2, 5 min, scale bar = 50 μm, mean ± SD, n = 3, * p < 0.05, ** p < 0.01, and **** p < 0.0001.
Molecules 30 02560 g006
Figure 7. (a) Tumor growth curves of the tumor-bearing mice with various treatments, (b) images of tumors harvested from tumor-bearing mice at 15 days after different treatments. (c) Tumor weights of mice after different treatments, (d) body weight changes in HT29 tumor-bearing mice with different treatments, and (e) H&E staining of tumor tissue sections collected from mice in different groups at the end of the treatment (scale bar = 100 μm). L: light. Light source: 520 nm, 100 mW/cm2, 10 min, and mean ± SD, n = 3. * p < 0.05, ** p < 0.01, *** p < 0.001, and **** p < 0.0001.
Molecules 30 02560 g007
Disclaimer/Publisher’s Note: The statements, opinions and data contained in all publications are solely those of the individual author(s) and contributor(s) and not of MDPI and/or the editor(s). MDPI and/or the editor(s) disclaim responsibility for any injury to people or property resulting from any ideas, methods, instructions or products referred to in the content.

