

Application of Fourier Transform Near-Infrared Spectroscopy and Chemometrics for Quantitative Analysis of Milk of Lime (MOL) Used in the Sugar Industry

Abstract
1. Introduction
2. Results and Discussion
2.1. Physical and Chemical Properties of Milk of Lime (MOL)
- Increasing the amount of quicklime in pure water leads to a corresponding increase in available calcium oxide content—from 14.53 g CaO/100 cm3 at a 1:6 quicklime-to-water ratio to 17.81 g CaO/100 cm3 at a 1:4 ratio. Simultaneously, a decrease in the share of calcium oxide available in the total lime content is observed, amounting to 81.67% for the 1:4 ratio and 75.76% for the 1:6 ratio.
- Sucrose in milk of lime at concentrations exceeding 2–3% w/w leads to an increase in the available calcium oxide content compared to MOL prepared with pure water. At the highest tested sucrose concentration (5% w/w), this increase ranged from 4.86 percentage points (quicklime-to-water ratio 1:6) to 5.54 percentage points (1:4 ratio) relative to the corresponding milk of lime samples prepared with pure water.
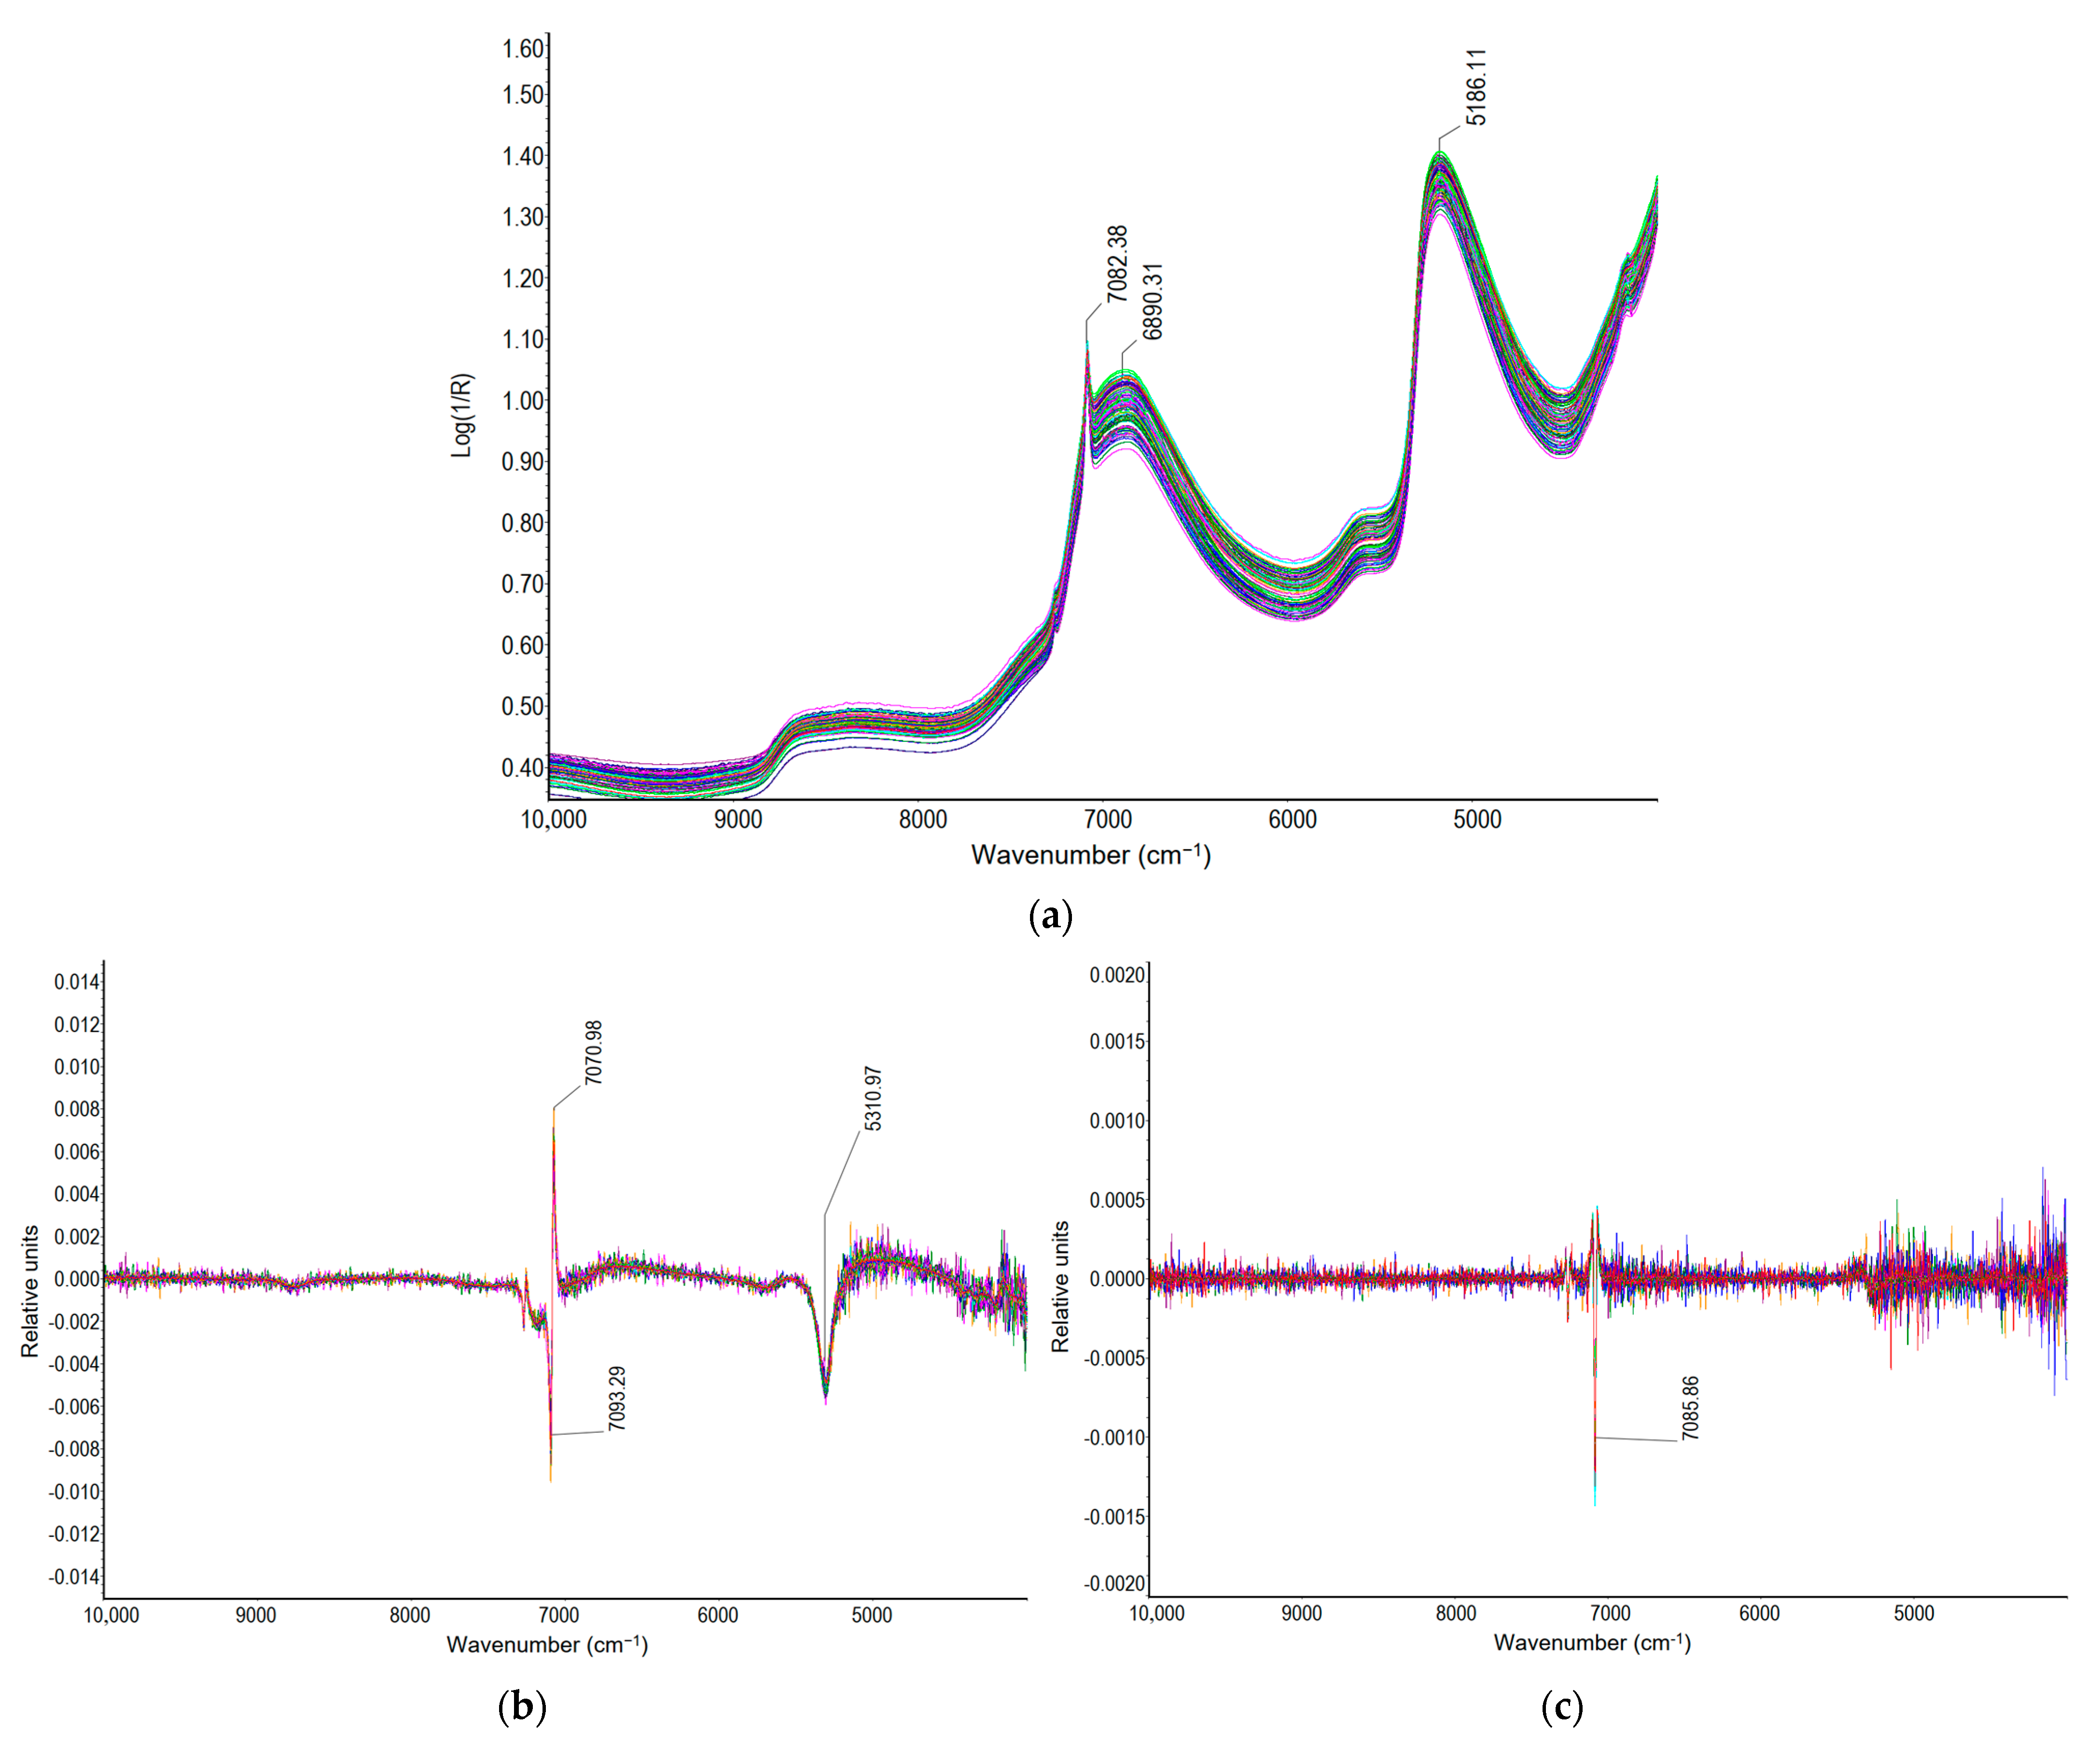
2.2. FT-NIR Spectra of the Milk of Lime Samples
2.3. Chemometric Analysis
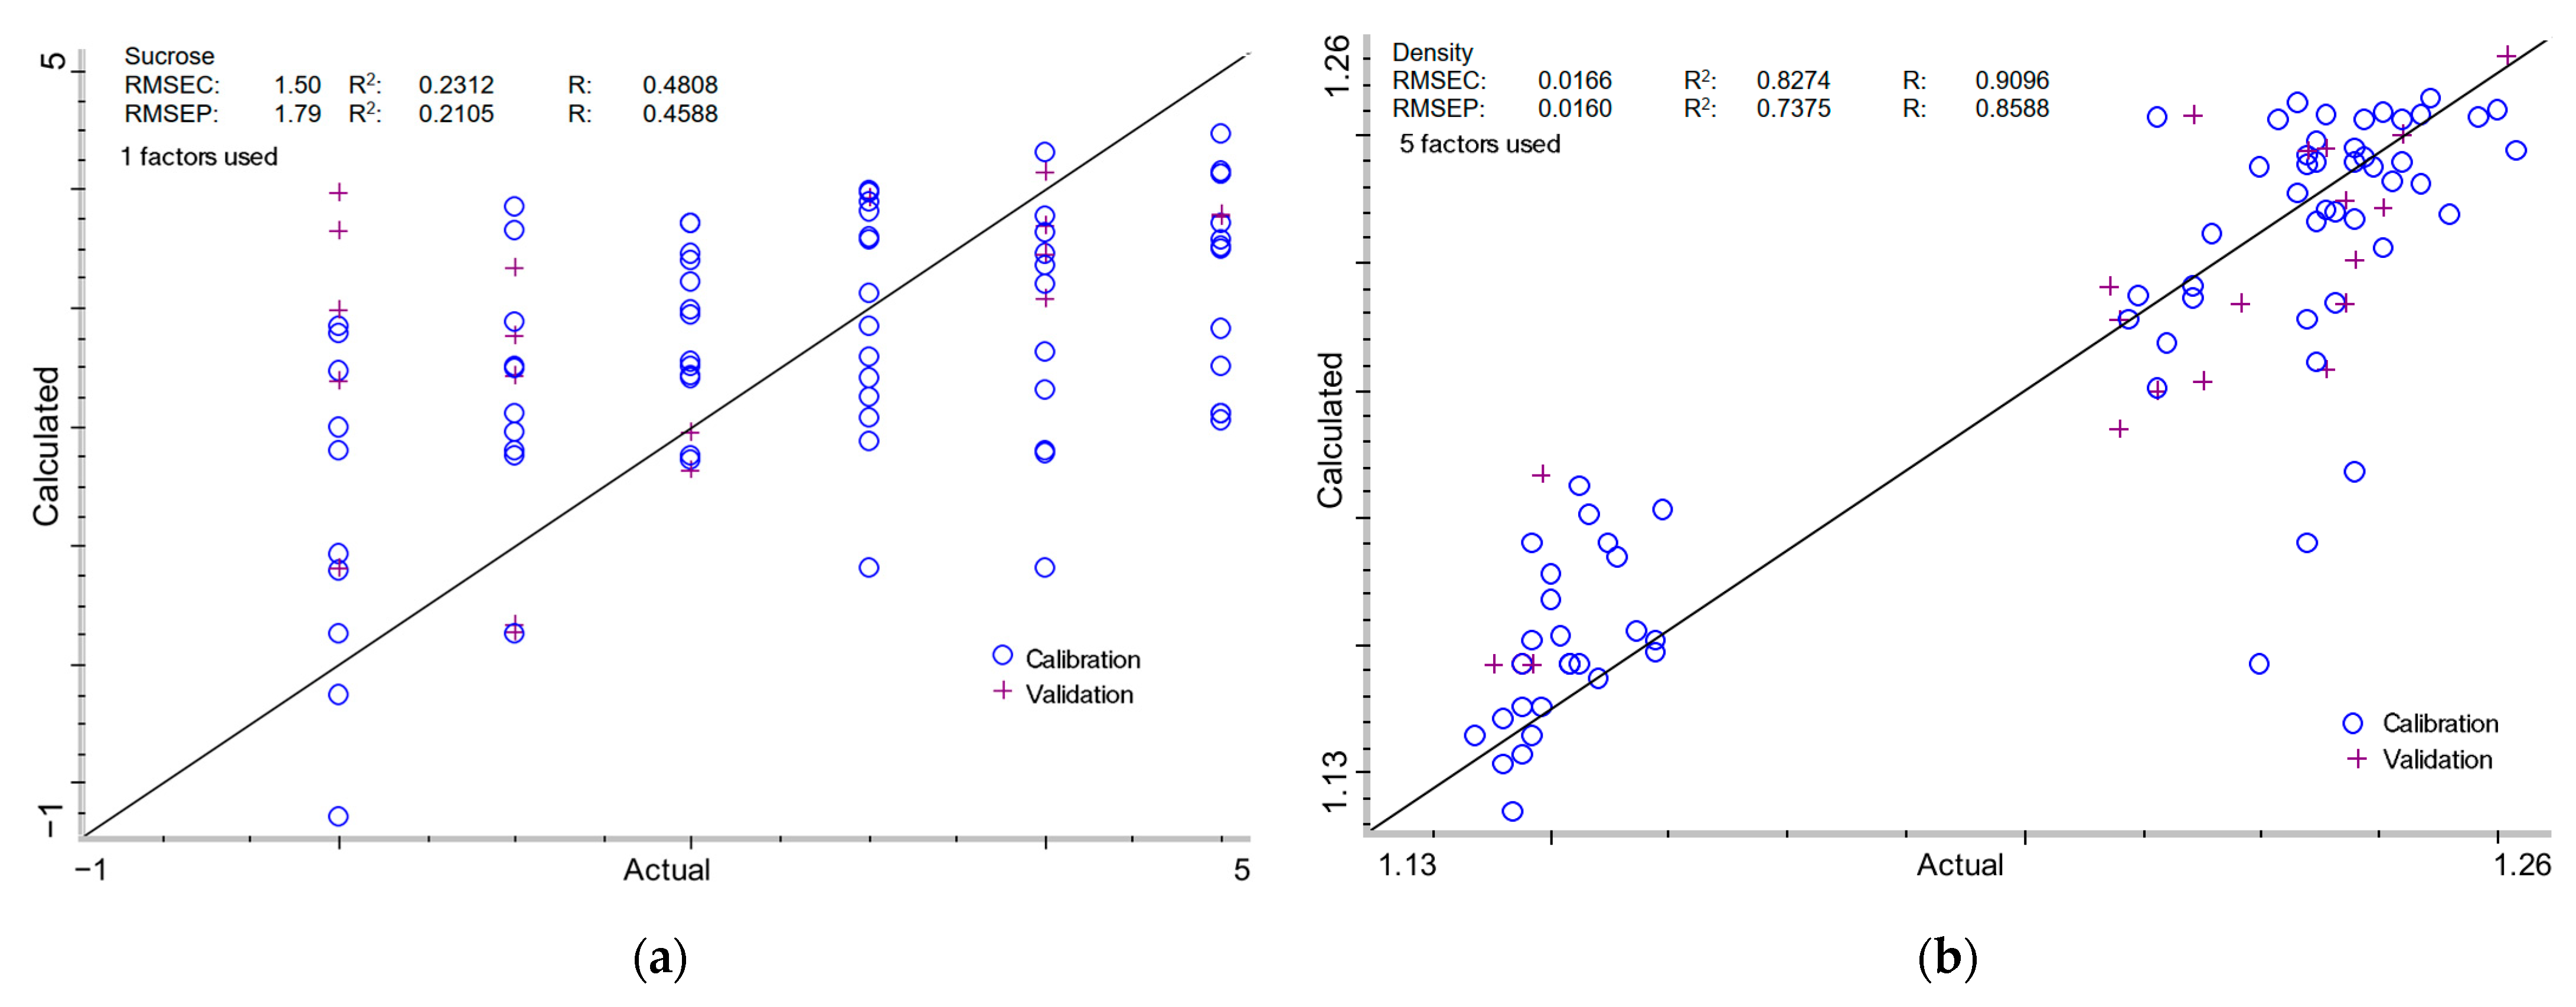
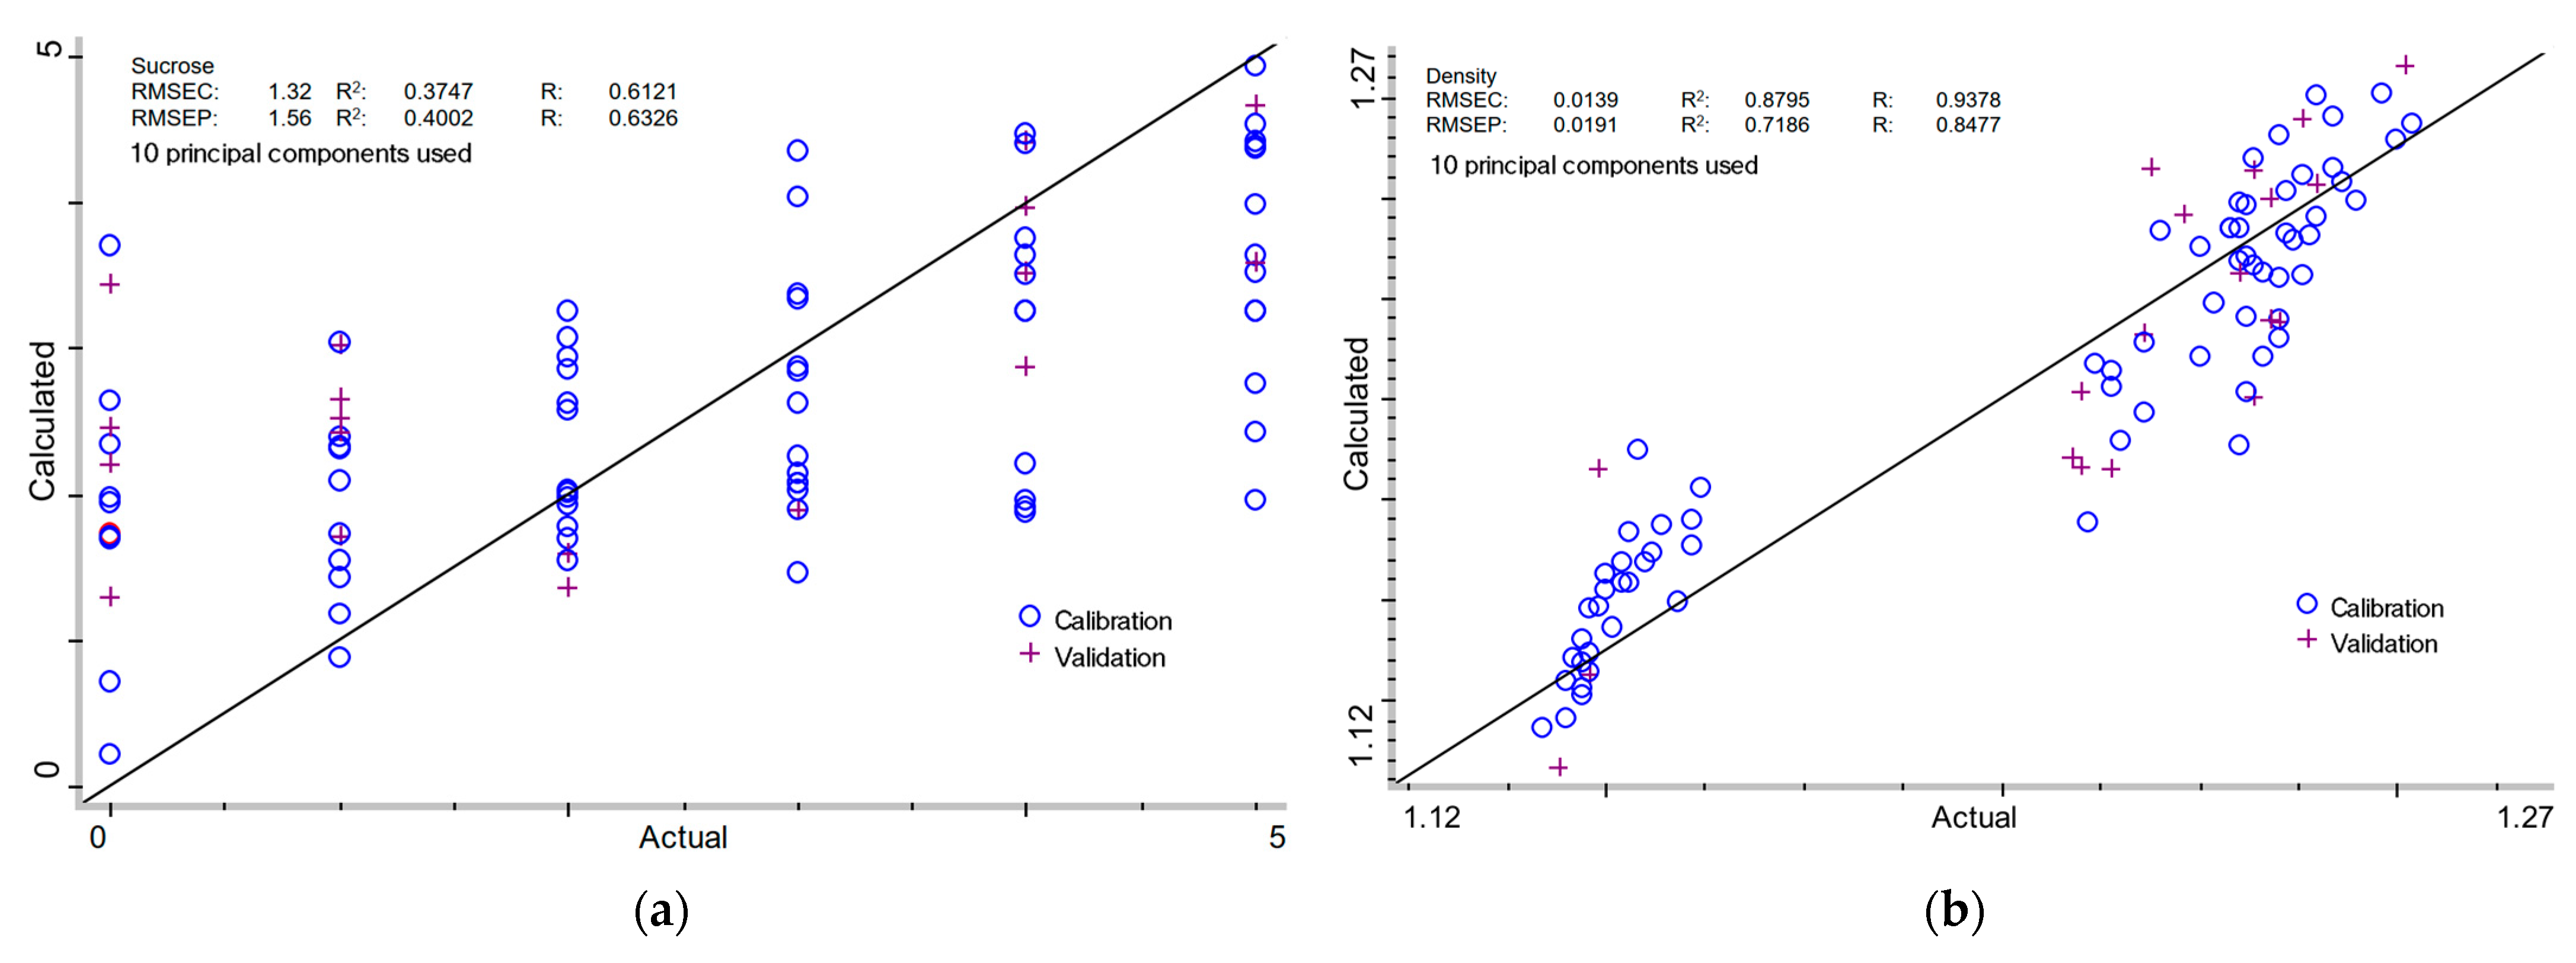
2.3.1. Sucrose Content in Milk of Lime
2.3.2. Density of Milk of Lime
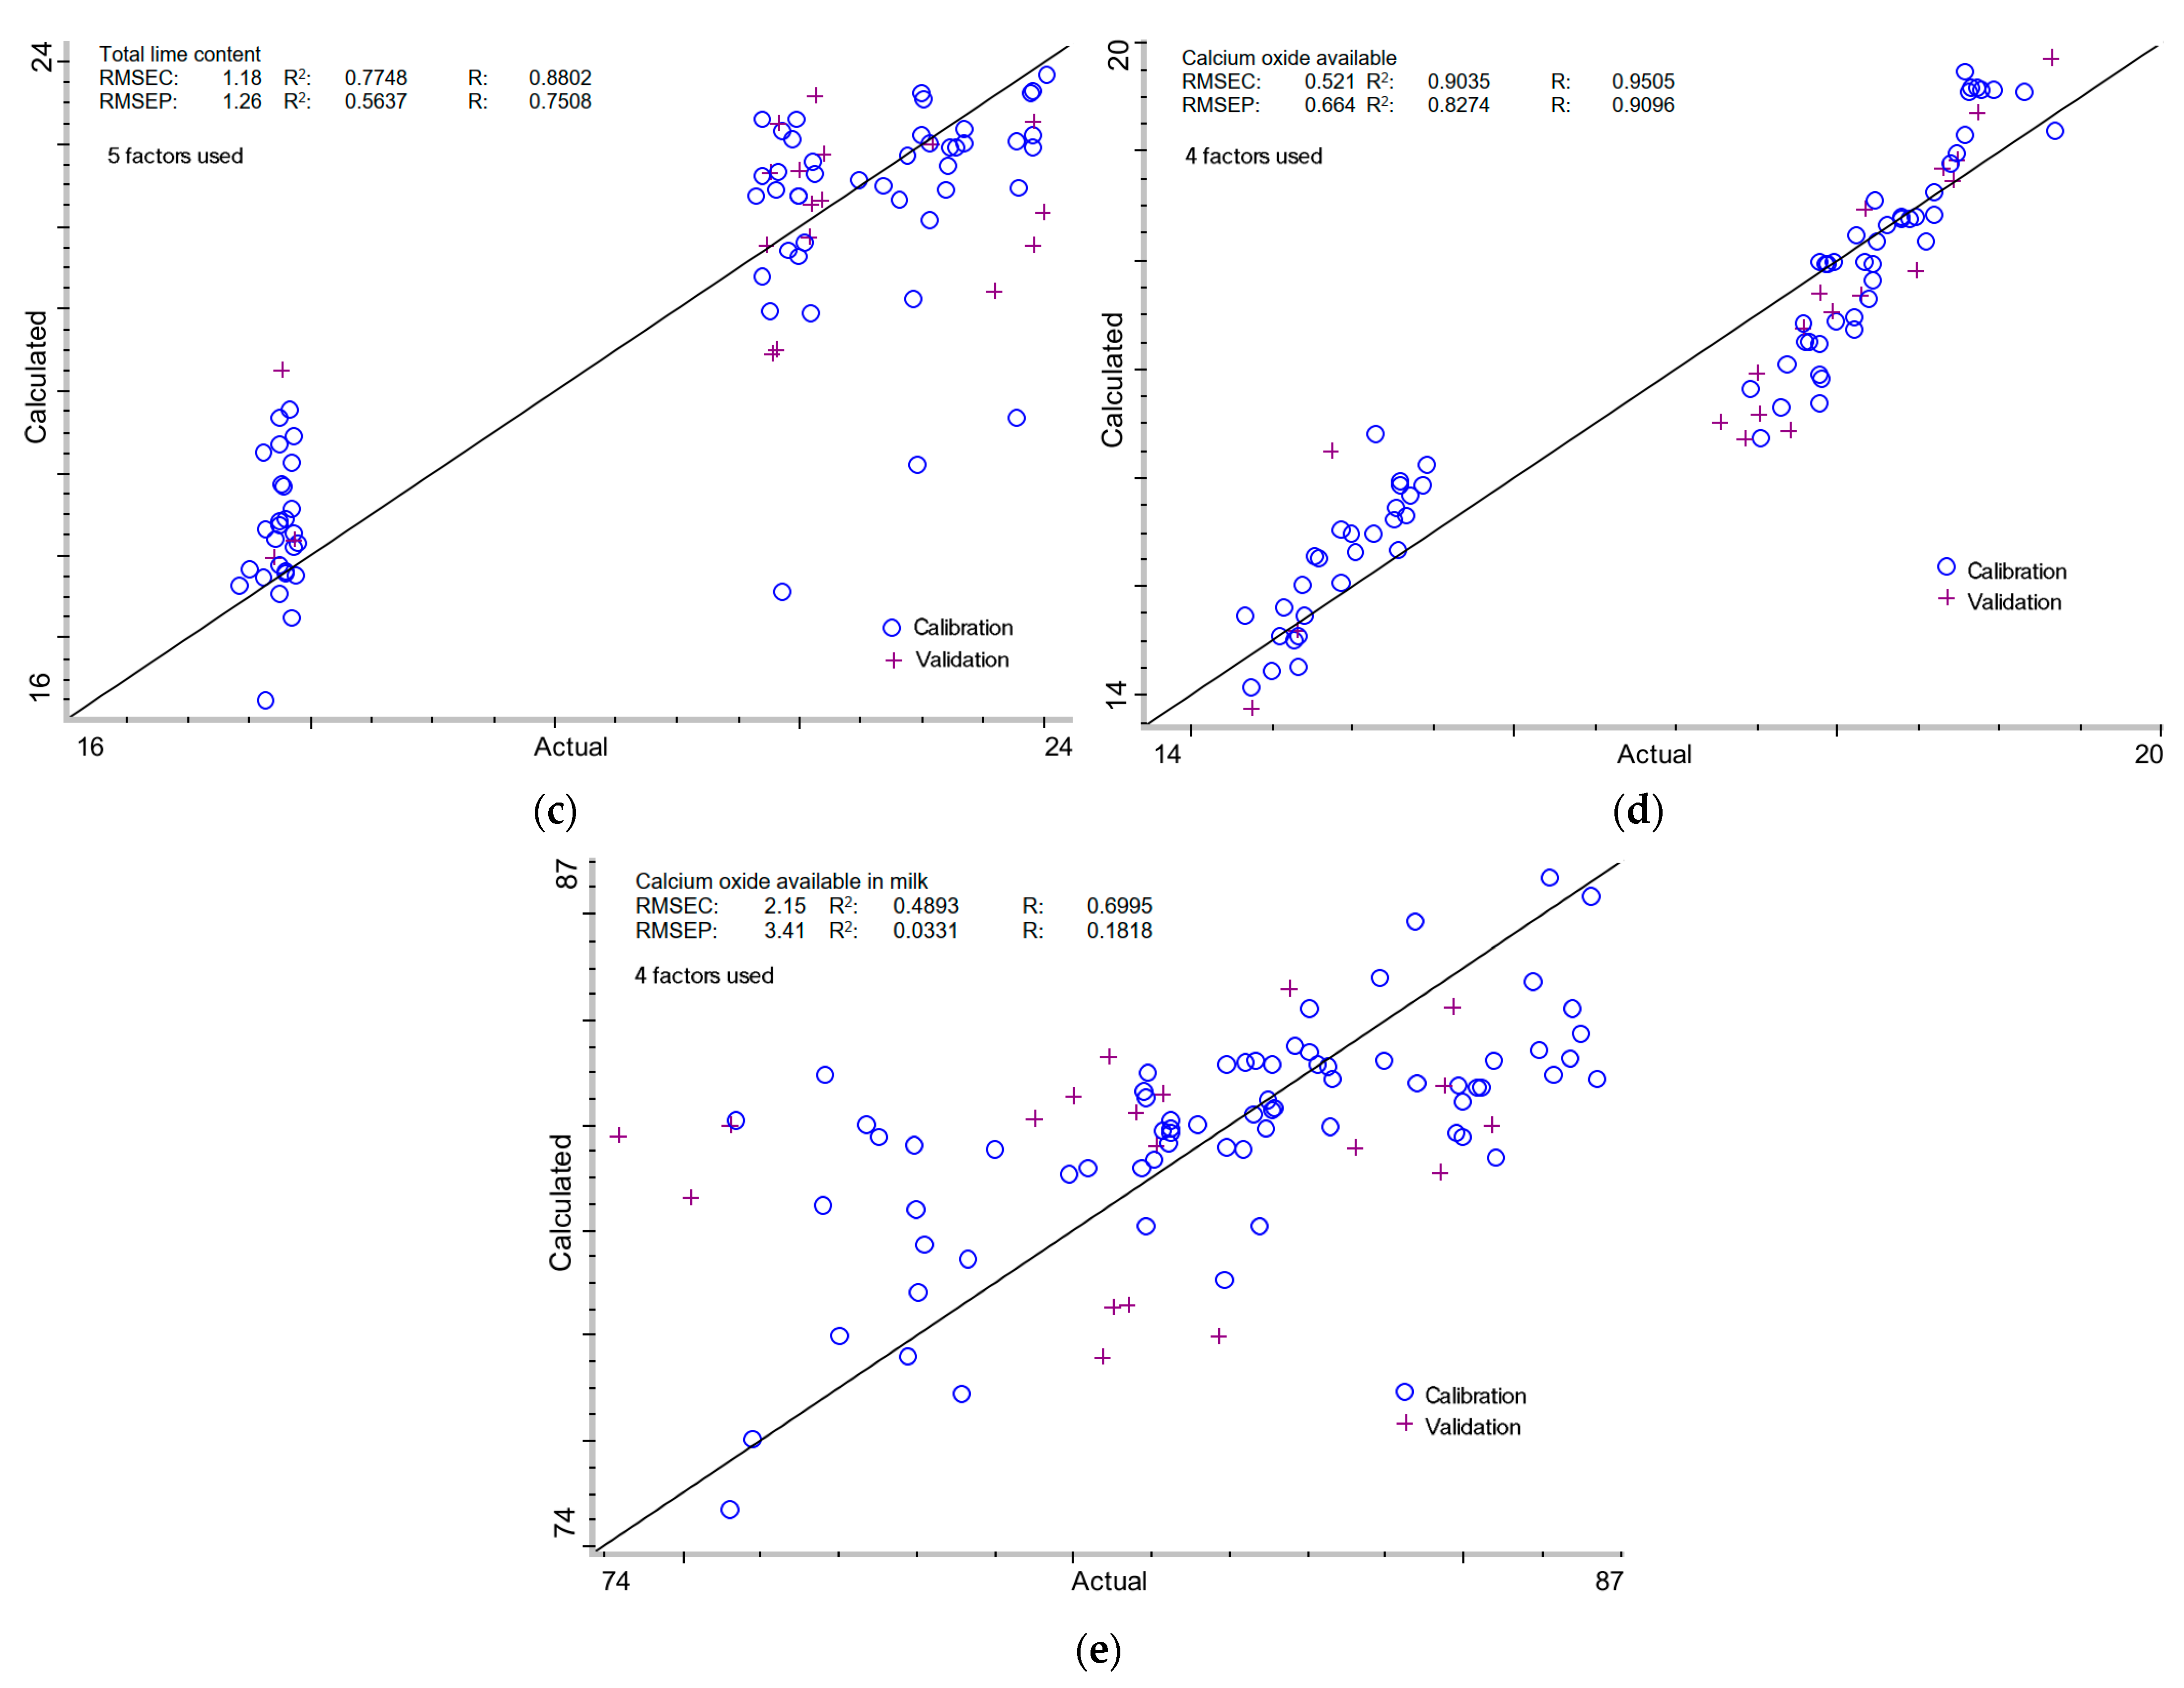
2.3.3. Total Lime Content in Milk of Lime
2.3.4. Calcium Oxide Available in Milk of Lime
2.3.5. Calcium Oxide Available in Total Lime of Milk of Lime
3. Materials and Methods
3.1. Milk of Lime Preparation
3.2. Chemical and Physicochemical Analysis
3.3. Near-Infrared Spectroscopy
3.4. Chemometric Techniques
3.5. Statistical Analysis
4. Conclusions
Author Contributions
Funding
Institutional Review Board Statement
Informed Consent Statement
Data Availability Statement
Conflicts of Interest
References
- Muir, B.M. Sugar beet processing to sugars. In Sugar Beet Cultivation, Management and Processing; Misra, V., Sri-vastava, S., Mall, A.K., Eds.; Springer Nature: Singapore, 2022; pp. 837–862. ISBN 978-981-19-2730-0. [Google Scholar] [CrossRef]
- Zheplinska, M.; Vasyliv, V.; Shynkaruk, V.; Khvesyk, J.; Yemtcev, V.; Mushtruk, N.; Rudyk, Y.; Gruntovskyi, M.; Tarasenko, S. The use of vapor condensation cavitation to increase the activity of milk of lime in sugar beet production. Potravin. Slovak J. Food Sci. 2022, 16, 463–472. [Google Scholar] [CrossRef] [PubMed]
- Vasyliv, V.; Mushtruk, M.; Zheplinska, M.; Mukoid, R.; Tkachenko, S. Method of Electrohydraulic Activation of Water-Lime Suspension in Sugar Production. In Proceedings of the Advanced Manufacturing Processes III, Odessa, Ukraine, 7–10 September 2021; Tonkonogyi, V., Ivanov, V., Trojanowska, J., Oborskyi, G., Pavlenko, I., Eds.; Springer International Publishing: Cham, Germany, 2022; pp. 664–673. [Google Scholar] [CrossRef]
- Egorova, M.I.; Puzanova, L.N.; Nikolaeva, E.S. Quality of technological limestone quality as an important aspect of the efficiency of sugar beet factories. IOP Conf. Ser. Earth Environ. Sci. 2021, 845, 012107. [Google Scholar] [CrossRef]
- Optimizing Pre Liming pH for Efficient Juice Clarification Process in Sri Lankan Sugar Factories. Research Square. Available online: https://www.researchsquare.com/article/rs-362414/v1 (accessed on 30 May 2024).
- Henrique, H.M.; Santos, L.C.; Parreira, P.M. Production of milk of lime for sugar cane industry: Study of factors influencing lime slaking. Mater. Sci. Forum 2010, 660, 437–442. [Google Scholar] [CrossRef]
- Deneus, E.; Merkel, G.; Michelberger, T.D.; Rad, M.D.A.; Willems, M.D. Method for Reducing Lime Consumption in Sugar Beet Juice Cleaning. DE Patent 10350672 B4, 29 October 2009. [Google Scholar]
- Chen, J.C.P.; Chou, C.C. Cane Sugar Handbook: A Manual for Cane Sugar Manufacturers and Their Chemists, 12th ed.; John Wiley & Sons: New York, NY, USA, 1993; ISBN 978-0-471-53037-4. [Google Scholar]
- Eldien, W.N.; Ali, E.H.M.; Sohily, A. Evaluation and optimization of hot liming process in Kenana Sugar Factory, White Nile State, Sudan. Int. J. Sci. Res. Publ. 2017, 7, 1–5. Available online: https://www.ijsrp.org/research-paper-0417/ijsrp-p6402.pdf (accessed on 23 May 2025).
- Eggleston, G.; Legendre, D.; Pontif, K.; Gober, J. Improved control of sucrose losses and clarified juice turbidity with lime saccharate in hot lime clarification of sugarcane juice and other comparisons with milk of lime. J. Food Process. Preserv. 2014, 38, 311–325. [Google Scholar] [CrossRef]
- Saetear, P.; Saechua, N.; Sereenonchai, K. Sequential injection system for analysis of degree brix, orthophosphate and pH in raw sugarcane juice applicable to sugar industry. Molecules 2021, 26, 6484. [Google Scholar] [CrossRef]
- Jimoh, O.A.; Mahmed, N.; Okoye, P.U.; Ariffin, K.S. Utilization of milk of lime (MOL) originated from carbide lime waste and operating parameters optimization study for potential precipitated calcium carbonate (PCC) production. Environ. Earth Sci. 2016, 75, 1251. [Google Scholar] [CrossRef]
- Oates, J.A.H. Lime and Limestone: Chemistry and Technology, Production and Uses, 1st ed.; Wiley-VCH: Weinheim, Germany, 1998; ISBN 978-3-527-29527-2. [Google Scholar]
- Boynton, R.S. Chemistry and Technology of Lime and Limestone, 2nd ed.; Wiley: New York, NY, USA, 1980; ISBN 978-0-471-02771-3. [Google Scholar]
- Stuart, B. Infrared spectroscopy. In Kirk-Othmer Encyclopedia of Chemical Technology; John Wiley & Sons, Ltd.: Hoboken, NJ, USA, 2015; pp. 1–18. ISBN 978-0-471-23896-6. [Google Scholar] [CrossRef]
- Moore, D.S.; Gauglitz, G. Handbook of Spectroscopy, 2nd ed.; John Wiley & Sons: Hoboken, NJ, USA, 2014; pp. 39–46. ISBN 978-3-527-65472-7. [Google Scholar]
- Maria, C. Application of FTIR spectroscopy in environmental studies. In Advanced Aspects of Spectroscopy; Akhyar Farrukh, M., Ed.; InTech: Houston, TX, USA, 2012; pp. 49–84. ISBN 978-953-51-0715-6. [Google Scholar]
- Flores-Valdez, M.; Meza-Márquez, O.G.; Osorio-Revilla, G.; Gallardo-Velázquez, T. Identification and quantification of adulterants in coffee (Coffea arabica L.) using FT-MIR spectroscopy coupled with chemometrics. Foods 2020, 9, 851. [Google Scholar] [CrossRef]
- Bureau, S.; Cozzolino, D.; Clark, C.J. Contributions of Fourier-transform mid infrared (FT-MIR) spectroscopy to the study of fruit and vegetables: A review. Postharvest Biol. Technol. 2019, 148, 1–14. [Google Scholar] [CrossRef]
- Rodríguez, S.D.; Rolandelli, G.; Buera, M.P. Detection of quinoa flour adulteration by means of FT-MIR spectroscopy combined with chemometric methods. Food Chem. 2019, 274, 392–401. [Google Scholar] [CrossRef]
- Hirri, A.; Bassbasi, M.; Abdelkhalek, O.; Kzaiber, F. The use of Fourier transform mid infrared (FT-MIR) spectroscopy for detection and estimation of extra virgin olive oil adulteration with old olive oil. Sky J. Food Sci. 2015, 4, 60–66. [Google Scholar]
- Fragoso, S.; Aceña, L.; Guasch, J.; Mestres, M.; Busto, O. Quantification of phenolic compounds during red winemaking using FT-MIR spectroscopy and PLS-regression. J. Agric. Food Chem. 2011, 59, 10795–10802. [Google Scholar] [CrossRef] [PubMed]
- Potgieter, J.H.; Potgieter, S.S.; Waal, D.D. An empirical study of factors influencing lime slaking. Part II: Lime constituents and water composition. Water SA 2003, 29, 157–160. [Google Scholar] [CrossRef]
- Potgieter, J.H.; Potgieter, S.S.; Moja, S.J.; Mulaba-Bafubiandi, A. An empirical study of factors influencing lime slaking. Part I: Production and storage conditions. Miner. Eng. 2002, 15, 201–203. [Google Scholar] [CrossRef]
- Aykas, D.P.; Ball, C.; Menevseoglu, A.; Rodriguez-Saona, L.E. In situ monitoring of sugar content in breakfast cereals using a novel FT-NIR spectrometer. Appl. Sci. 2020, 10, 8774. [Google Scholar] [CrossRef]
- Li, Q.; Yu, X.; Gao, J.-M. A novel method to determine total sugar of Goji berry using FT-NIR spectroscopy with effective wavelength selection. Int. J. Food Prop. 2017, 20, S478–S488. [Google Scholar] [CrossRef]
- Simeone, M.L.F.; Parrella, R.A.C.; Schaffert, R.E.; Damasceno, C.M.B.; Leal, M.C.B.; Pasquini, C. Near infrared spectroscopy determination of sucrose, glucose and fructose in sweet sorghum juice. Microchem. J. 2017, 134, 125–130. [Google Scholar] [CrossRef]
- Priori, S.; Mzid, N.; Pascucci, S.; Pignatti, S.; Casa, R. Performance of a portable FT-NIR MEMS spectrometer to predict soil features. Soil Syst. 2022, 6, 66. [Google Scholar] [CrossRef]
- Stenberg, B.; Viscarra Rossel, R.A.; Mouazen, A.M.; Wetterlind, J. Chapter five—Visible and near infrared spectroscopy in soil science. In Advances in Agronomy, 1st ed.; Sparks, D.L., Ed.; Academic Press: Cambridge, MA, USA, 2010; Volume 107, pp. 163–215. [Google Scholar] [CrossRef]
- Oh, S.; Hyun, C.-U.; Park, H.-D. Near-infrared spectroscopy of limestone ore for CaO estimation under dry and wet conditions. Minerals 2017, 7, 193. [Google Scholar] [CrossRef]
- Dalm, M.; Buxton, M.W.N.; van Ruitenbeek, F.J.A.; Voncken, J.H.L. Application of near-infrared spectroscopy to sensor based sorting of a porphyry copper ore. Miner. Eng. 2014, 58, 7–16. [Google Scholar] [CrossRef]
- Gallie, E.A.; McArdle, S.; Rivard, B.; Francis, H. Estimating sulphide ore grade in broken rock using visible/infrared hyperspectral reflectance spectra. Int. J. Remote Sens. 2002, 23, 2229–2246. [Google Scholar] [CrossRef]
- Van der Meer, F. Spectral reflectance of carbonate mineral mixtures and bidirectional reflectance theory: Quantitative analysis techniques for application in remote sensing. Remote Sens. Rev. 1995, 13, 67–94. [Google Scholar] [CrossRef]
- Saeki, T.; Monteiro, P.J.M. A Model to predict the amount of calcium hydroxide in concrete containing mineral admixtures. Cem. Concr. Res. 2005, 35, 1914–1921. [Google Scholar] [CrossRef]
- Biernacki, J.; Williams, P.; Stutzman, P. Kinetics of reaction of calcium hydroxide and fly ash. ACI Mater. J. 2001, 98, 340–349. [Google Scholar]
- Sangpongpitthaya, T.; Christy, A.A.; Thorstensen, R.T. Quantitative determination of calcium hydroxide by using near-infrared spectroscopy. Key Eng. Mater. 2018, 765, 300–304. [Google Scholar] [CrossRef]
- Ridi, F.; Fratini, E.; Milani, S.; Baglioni, P. Near-infrared spectroscopy investigation of the water confined in tricalcium silicate pastes. J. Phys. Chem. B 2006, 110, 16326–16331. [Google Scholar] [CrossRef]
- Yu, P.; Kirkpatrick, R.J.; Poe, B.; McMillan, P.F.; Cong, X. Structure of calcium silicate hydrate (C-S-H): Near-, mid-, and far-infrared spectroscopy. J. Am. Ceram. Soc. 1999, 82, 742–748. [Google Scholar] [CrossRef]
- Bokobza, L. Near infrared spectroscopy. J. Infrared Spectrosc. 1998, 6, 3–17. [Google Scholar] [CrossRef]
- Liapina, K.V.; Dulnev, P.G.; Marinin, A.I.; Pushanko, N.N.; Olishevskiy, V.V. The lime purification of sugar-containing solution using high-viscosity colloidal solutions. Biotechnol. Acta 2015, 8, 71–76. [Google Scholar] [CrossRef]
- National Lime Association. Fact Sheet: Properties of Lime. Available online: https://www.lime.org/documents/publications/free_downloads/fact-properties2007rev.pdf (accessed on 17 April 2025).
- Moropoulou, A.; Bakolas, A.; Aggelakopoulou, E. The effects of limestone characteristics and calcination temperature to the reactivity of the quicklime. Cem. Concr. Res. 2001, 31, 633–639. [Google Scholar] [CrossRef]
- Ineich, T.; Degreve, C.; Karamoutsos, S.; du Plessis, C. Utilization efficiency of lime consumption during magnesium sulfate precipitation. Hydrometallurgy 2017, 173, 241–249. [Google Scholar] [CrossRef]
- Walter, R.H.; Sherman, R.M. Stoichiometric relationship between calcium oxide and sugars in water solution. J. Sci. Food Agric. 1973, 24, 23–26. [Google Scholar] [CrossRef]
- Paruta, A.N. Solubility of several solutes as a function of the dielectric constant of sugar solutions. J. Pharm. Sci. 1964, 53, 1252–1254. [Google Scholar] [CrossRef]
- Cameron, F.K.; Patten, H.E. The solubility of lime in aqueous solutions of sugar and glycerol. J. Phys. Chem. 1911, 15, 67–72. [Google Scholar] [CrossRef]
- Fujino, K.; Kobayashi, J.; Higuchi, I. Complex formation from calcium hydroxide and carbohydrate in alkaline solutions. Nippon Kagaku Kaishi 1972, 2287–2292. [Google Scholar] [CrossRef]
- Pannetier, N.; Khoukh, A.; François, J. Physico-chemical study of sucrose and calcium ions interactions in alkaline aqueous solutions. Macromol. Symp. 2001, 166, 203–208. [Google Scholar] [CrossRef]
- Doherty, W.O.S. Improved sugar cane juice clarification by understanding calcium oxide-phosphate-sucrose systems. J. Agric. Food Chem. 2011, 59, 1829–1836. [Google Scholar] [CrossRef]
- López, M.G.; García-González, A.S.; Franco-Robles, E.; López, M.G.; García-González, A.S.; Franco-Robles, E. Carbohydrate analysis by NIRS-chemometrics. In Developments in Near-Infrared Spectroscopy; IntechOpen: London, UK, 2017; ISBN 978-953-51-3018-5. [Google Scholar] [CrossRef]
- Takeuchi, M.; Kikuchi, T.; Kondo, A.; Kurosawa, R.; Ryu, J.; Matsuoka, M. Near-infrared spectroscopic analysis─formation of Ca(OH)2 and Ca(OD)2 by hydration of CaO with H2O and D2O. J. Phys. Chem. C 2023, 127, 6406–6413. [Google Scholar] [CrossRef]
- Pesce, C.; Pesce, G.L.; Molinari, M.; Richardson, A. Effects of organic additives on calcium hydroxide crystallisation during lime slaking. Cem. Concr. Res. 2021, 139, 106254. [Google Scholar] [CrossRef]
- Ma, B.; Zhang, L.; Zhang, P.; Dong, R. Influence of sucrose on cement hydration process. J. Chin. Ceram. Soc. 2004, 32, 1285–1288. [Google Scholar]
- Pesce, C.; Pesce, G.; Molinari, M.; Corradi, M. Effects of sucrose on fresh-state and setting properties of air lime. Mater. Struct. 2023, 56, 131. [Google Scholar] [CrossRef]
- Jung, Y.; Hwang, J. Near-infrared studies of glucose and sucrose in aqueous solutions: Water displacement effect and red shift in water absorption from water-solute interaction. Appl. Spectrosc. 2013, 67, 171–180. [Google Scholar] [CrossRef] [PubMed]
- Watari, M.; Higashiyama, H.; Mitsui, N.; Tomo, M.; Ozaki, Y. On-line monitoring of the density of linear low-density polyethylene in a real plant by near-infrared spectroscopy and chemometrics. Appl. Spectrosc. 2004, 58, 248–255. [Google Scholar] [CrossRef]
- Shimoyama, M.; Ninomiya, T.; Sano, K.; Ozaki, Y.; Higashiyama, H.; Watari, M.; Tomo, M. Near infrared spectroscopy and chemometrics analysis of linear low-density polyethylene. J. Infrared Spectrosc. 1998, 6, 317–324. [Google Scholar] [CrossRef]
- Via, B.K. Prediction of oriented strand board wood strand density by near infrared and fourier transform infrared reflectance spectroscopy. J. Infrared Spectrosc. 2010, 18, 491–498. [Google Scholar] [CrossRef]
- Leblon, B.; Adedipe, O.; Hans, G.; Haddadi, A.; Tsuchikawa, S.; Burger, J.; Stirling, R.; Pirouz, Z.; Groves, K.; Nader, J.; et al. A review of near-infrared spectroscopy for monitoring moisture content and density of solid wood. For. Chron. 2013, 89, 595–606. [Google Scholar] [CrossRef]
- Rosso, S.; Muniz, G.I.B.D.; Matos, J.L.M.D.; Haselein, C.R.; Hein, P.R.G.; Lopes, M.D.C. Estimate of the density of Eucalyptus grandis W. Hill ex Maiden using near infrared spectroscopy. Cerne 2013, 19, 647–652. [Google Scholar] [CrossRef]
- Wazir, N.A.; Saadon, S.; Bashkoro, P.T.; Dolmat, N.; Othman, A.; Sariman, M. Prediction of waxy crude oil properties using near- infrared spectroscopy for upstream applications. In Proceedings of the SPE Asia Pacific Oil and Gas Conference and Exhibition; Society of Petroleum Engineers: Calgary, AB, Canada, 2024; p. 011. [Google Scholar] [CrossRef]
- Román-Ospino, A.D.; Singh, R.; Ierapetritou, M.; Ramachandran, R.; Méndez, R.; Ortega-Zuñiga, C.; Muzzio, F.J.; Romañach, R.J. Near infrared spectroscopic calibration models for real time monitoring of powder density. Int. J. Pharm. 2016, 512, 61–74. [Google Scholar] [CrossRef]
- Chen, W.; Xu, W.B.; Li, Y. Microstructural investigation of carbonation of calcium silicate hydrate in hydrated cement paste. Adv. Mater. Res. 2011, 261-263, 601–605. [Google Scholar] [CrossRef]
- Pesce, C.; Ball, R.J.; Molinari, M.; Reeksting, S.; Pesce, G.L. Effects of carbohydrates and sulfonates during CaO hydration on portlandite microstructure. Cem. Concr. Res. 2024, 175, 107372. [Google Scholar] [CrossRef]
- BN-80/5537-03; Glass Hydrometers—Densimeter for Milk of Lime—Requirements and Test Methods. Polish Industry Standard. Institute of Glass Processing Technology: Poznań, Poland, 1980. (In Polish)
- BS EN 459-2:2021; Building Lime—Part 2: Test Methods. British Standards Institution: London, UK, 2021.
- Abrantes, G.; Almeida, V.; Maia, A.J.; Nascimento, R.; Nascimento, C.; Silva, Y.; Silva, Y.; Veras, G. Comparison between variable-selection algorithms in PLS regression with near-infrared spectroscopy to predict selected metals in soil. Molecules 2023, 28, 6959. [Google Scholar] [CrossRef] [PubMed]
- Zhang, W.; Kasun, L.C.; Wang, Q.J.; Zheng, Y.; Lin, Z. A review of machine learning for near-infrared spectroscopy. Sensors 2022, 22, 9764. [Google Scholar] [CrossRef] [PubMed]
- Zeng, J.; Guo, Y.; Han, Y.; Li, Z.; Yang, Z.; Chai, Q.; Wang, W.; Zhang, Y.; Fu, C. A review of the discriminant analysis methods for food quality based on near-infrared spectroscopy and pattern recognition. Molecules 2021, 26, 749. [Google Scholar] [CrossRef]
- Brereton, R.G. Pattern recognition in chemometrics. Chemom. Intell. Lab. Syst. 2015, 149, 90–96. [Google Scholar] [CrossRef]
- Burnham, A.J.; MacGregor, J.F.; Viveros, R. Latent variable multivariate regression modeling. Chemom. Intell. Lab. Syst. 1999, 48, 167–180. [Google Scholar] [CrossRef]
- Nelson, P.R.C.; Taylor, P.A.; MacGregor, J.F. Missing data methods in PCA and PLS: Score calculations with incomplete observations. Chemom. Intell. Lab. Syst. 1996, 35, 45–65. [Google Scholar] [CrossRef]
- Revilla, I.; Hernández Jiménez, M.; Martínez-Martín, I.; Valderrama, P.; Rodríguez-Fernández, M.; Vivar-Quintana, A.M. The potential use of near infrared spectroscopy (NIRS) to determine the heavy metals and the percentage of blends in tea. Foods 2024, 13, 450. [Google Scholar] [CrossRef] [PubMed]
- Lastras, C.; Revilla, I.; González-Martín, M.I.; Vivar-Quintana, A.M. Prediction of fatty acid and mineral composition of lentils using near infrared spectroscopy. J. Food Compos. Anal. 2021, 102, 104023. [Google Scholar] [CrossRef]
- Peris-Díaz, M.D.; Krężel, A. A guide to good practice in chemometric methods for vibrational spectroscopy, electrochemistry, and hyphenated mass spectrometry. TrAC Trends Anal. Chem. 2021, 135, 116157. [Google Scholar] [CrossRef]


| CaO:H20 or Sucrose Solution | Sucrose (%) | Density (g/cm3) | Total Lime Content (g CaO/100 cm3) | Calcium Oxide Availability (g CaO/100 cm3) | Calcium Oxide Availability in Total Lime (%) | Change in Calcium Oxide Availability Relative to Water Solution (Δ%) |
|---|---|---|---|---|---|---|
| 0 | 1.145 ± 0.002 a | 17.79 ± 0.19 a | 14.53 ± 0.17 a | 81.67 ± 0.88 a | 0.00 | |
| 1 | 1.148 ± 0.001 a | 17.78 ± 0.09 a | 14.61 ± 0.18 ab | 82.15 ± 0.53 ab | 0.48 | |
| 2 | 1.148 ± 0.001 a | 17.67 ± 0.11 a | 14.74 ± 0.17 abc | 83.39 ± 0.61 bc | 1.72 | |
| 1:6 | 3 | 1.151 ± 0.002 b | 17.80 ± 0.02 a | 14.98 ± 0.11 bc | 84.17 ± 0.48 cd | 2.50 |
| 4 | 1.154 ± 0.002 b | 17.78 ± 0.05 a | 15.28 ± 0.09 c | 85.91 ± 0.29 de | 4.24 | |
| 5 | 1.160 ± 0.001 c | 17.76 ± 0.11 a | 15.36 ± 0.08 d | 86.53 ± 0.15 e | 4.86 | |
| 0 | 1.211 ± 0.002 a | 21.91 ± 0.15 a | 17.59 ± 0.26 a | 80.28 ± 0.64 a | 0.00 | |
| 1 | 1.215 ± 0.004 b | 21.93 ± 0.20 a | 17.72 ± 0.15 ab | 80.81 ± 0.33 b | 0.52 | |
| 2 | 1.219 ± 0.003 c | 21.94 ± 0.23 a | 18.04 ± 0.12 b | 82.23 ± 0.28 c | 1.94 | |
| 1:5 | 3 | 1.227 ± 0.002 d | 21.92 ± 0.09 a | 18.18 ± 0.13 b | 82.93 ± 0.34 d | 2.64 |
| 4 | 1.232 ± 0.002 de | 21.94 ± 0.19 a | 18.62 ± 0.17 c | 84.86 ± 0.11 e | 4.57 | |
| 5 | 1.233 ± 0.003 e | 21.92 ± 0.16 a | 18.68 ± 0.16 c | 85.24 ± 0.18 ef | 4.96 | |
| 0 | 1.232 ± 0.002 a | 23.51 ± 0.45 a | 17.81 ± 0.26 a | 75.76 ± 1.51 a | 0.00 | |
| 1 | 1.233 ± 0.002 a | 23.44 ± 0.41 a | 17.91 ± 0.26 a | 76.39 ± 0.63 ab | 0.63 | |
| 2 | 1.233 ± 0.003 a | 23.27 ± 0.43 a | 18.10 ± 0.26 a | 77.75 ± 0.30 b | 1.99 | |
| 1:4 | 3 | 1.239 ± 0.003 b | 23.35 ± 0.58 a | 18.46 ± 0.26 b | 79.05 ± 1.05 c | 3.29 |
| 4 | 1.241 ± 0.002 bc | 23.28 ± 0.39 a | 18.84 ± 0.26 c | 80.94 ± 0.40 d | 5.18 | |
| 5 | 1.249 ± 0.003 a | 23.39 ± 0.52 a | 19.02 ± 0.26 d | 81.30 ± 0.47 d | 5.54 |
| Data Format | MSC | PLSf | Calibration | Validation | ||||||
|---|---|---|---|---|---|---|---|---|---|---|
| RS | 1st | 2nd | RMSEC | R2 | R | RMSEP | R2 | R | ||
| Sucrose content (%) | ||||||||||
| - | + | - | + | 1 | 1.50 | 0.2312 | 0.4808 | 1.79 | 0.2105 | 0.4588 |
| Density (g/cm3) | ||||||||||
| - | + | - | + | 5 | 0.0166 | 0.8274 | 0.9096 | 0.0160 | 0.7375 | 0.8588 |
| Total lime content (g CaO/100 cm3) | ||||||||||
| - | + | - | - | 5 | 1.18 | 0.7748 | 0.8802 | 1.26 | 0.5637 | 0.7508 |
| Calcium oxide available (g CaO/100 cm3) | ||||||||||
| + | - | - | - | 4 | 0.521 | 0.9035 | 0.9505 | 0.664 | 0.8274 | 0.9096 |
| % Calcium oxide available (% CaO) | ||||||||||
| - | - | + | - | 4 | 2.15 | 0.4893 | 0.6995 | 3.41 | 0.0331 | 0.1818 |
| Data Format | MSC | PCU | Calibration | Validation | ||||
|---|---|---|---|---|---|---|---|---|
| RS | RMSEC | R2 | R | RMSEP | R2 | R | ||
| Sucrose content (%) | ||||||||
| + | - | 10 | 1.32 | 0.3747 | 0.6121 | 1.56 | 0.4002 | 0.6326 |
| Density (g/cm3) | ||||||||
| + | - | 10 | 0.0139 | 0.8795 | 0.9378 | 0.0191 | 0.7186 | 0.8477 |
| Total lime content (g CaO/100 cm3) | ||||||||
| + | - | 10 | 1.11 | 0.7983 | 0.8935 | 1.56 | 0.5023 | 0.7087 |
| Calcium oxide available (g CaO/100 cm3) | ||||||||
| + | - | 10 | 0.497 | 0.9115 | 0.9547 | 0.645 | 0.8281 | 0.9100 |
| % Calcium oxide available (% CaO) | ||||||||
| + | + | 10 | 2.62 | 0.2409 | 0.4908 | 3.77 | 0.0968 | 0.3112 |
| CaO:Water or Sucrose Solution | CaO Mass (g) | H2O Mass (g) | Sucrose Mass (g) | Sucrose Concentration (% w/w) | Total Mass (g) |
|---|---|---|---|---|---|
| 1:4 | 100 | 400 | 0 | 0 | 500 |
| 100 | 395 | 5 | 1 | 500 | |
| 100 | 390 | 10 | 2 | 500 | |
| 100 | 385 | 15 | 3 | 500 | |
| 100 | 380 | 20 | 4 | 500 | |
| 100 | 375 | 25 | 5 | 500 | |
| 1:5 | 100 | 500 | 0 | 0 | 600 |
| 100 | 494 | 6 | 1 | 600 | |
| 100 | 488 | 12 | 2 | 600 | |
| 100 | 482 | 18 | 3 | 600 | |
| 100 | 476 | 24 | 4 | 600 | |
| 100 | 470 | 30 | 5 | 600 | |
| 1:6 | 100 | 700 | 0 | 0 | 700 |
| 100 | 700 | 7 | 1 | 700 | |
| 100 | 700 | 14 | 2 | 700 | |
| 100 | 700 | 21 | 3 | 700 | |
| 100 | 700 | 28 | 4 | 700 | |
| 100 | 700 | 35 | 5 | 700 |
Disclaimer/Publisher’s Note: The statements, opinions and data contained in all publications are solely those of the individual author(s) and contributor(s) and not of MDPI and/or the editor(s). MDPI and/or the editor(s) disclaim responsibility for any injury to people or property resulting from any ideas, methods, instructions or products referred to in the content. |
© 2025 by the authors. Licensee MDPI, Basel, Switzerland. This article is an open access article distributed under the terms and conditions of the Creative Commons Attribution (CC BY) license (https://creativecommons.org/licenses/by/4.0/).
Share and Cite
Gruska, R.M.; Kunicka-Styczyńska, A.; Molska, M. Application of Fourier Transform Near-Infrared Spectroscopy and Chemometrics for Quantitative Analysis of Milk of Lime (MOL) Used in the Sugar Industry. Molecules 2025, 30, 2308. https://doi.org/10.3390/molecules30112308
Gruska RM, Kunicka-Styczyńska A, Molska M. Application of Fourier Transform Near-Infrared Spectroscopy and Chemometrics for Quantitative Analysis of Milk of Lime (MOL) Used in the Sugar Industry. Molecules. 2025; 30(11):2308. https://doi.org/10.3390/molecules30112308
Chicago/Turabian StyleGruska, Radosław Michał, Alina Kunicka-Styczyńska, and Magdalena Molska. 2025. "Application of Fourier Transform Near-Infrared Spectroscopy and Chemometrics for Quantitative Analysis of Milk of Lime (MOL) Used in the Sugar Industry" Molecules 30, no. 11: 2308. https://doi.org/10.3390/molecules30112308
APA StyleGruska, R. M., Kunicka-Styczyńska, A., & Molska, M. (2025). Application of Fourier Transform Near-Infrared Spectroscopy and Chemometrics for Quantitative Analysis of Milk of Lime (MOL) Used in the Sugar Industry. Molecules, 30(11), 2308. https://doi.org/10.3390/molecules30112308