
BRS Carmem Grape Liqueurs: Influence of Alcoholic Base on Physicochemical Characteristics, Anthocyanin Composition, and Sensory Acceptance

 , , , and
Abstract

1. Introduction
2. Results and Discussion
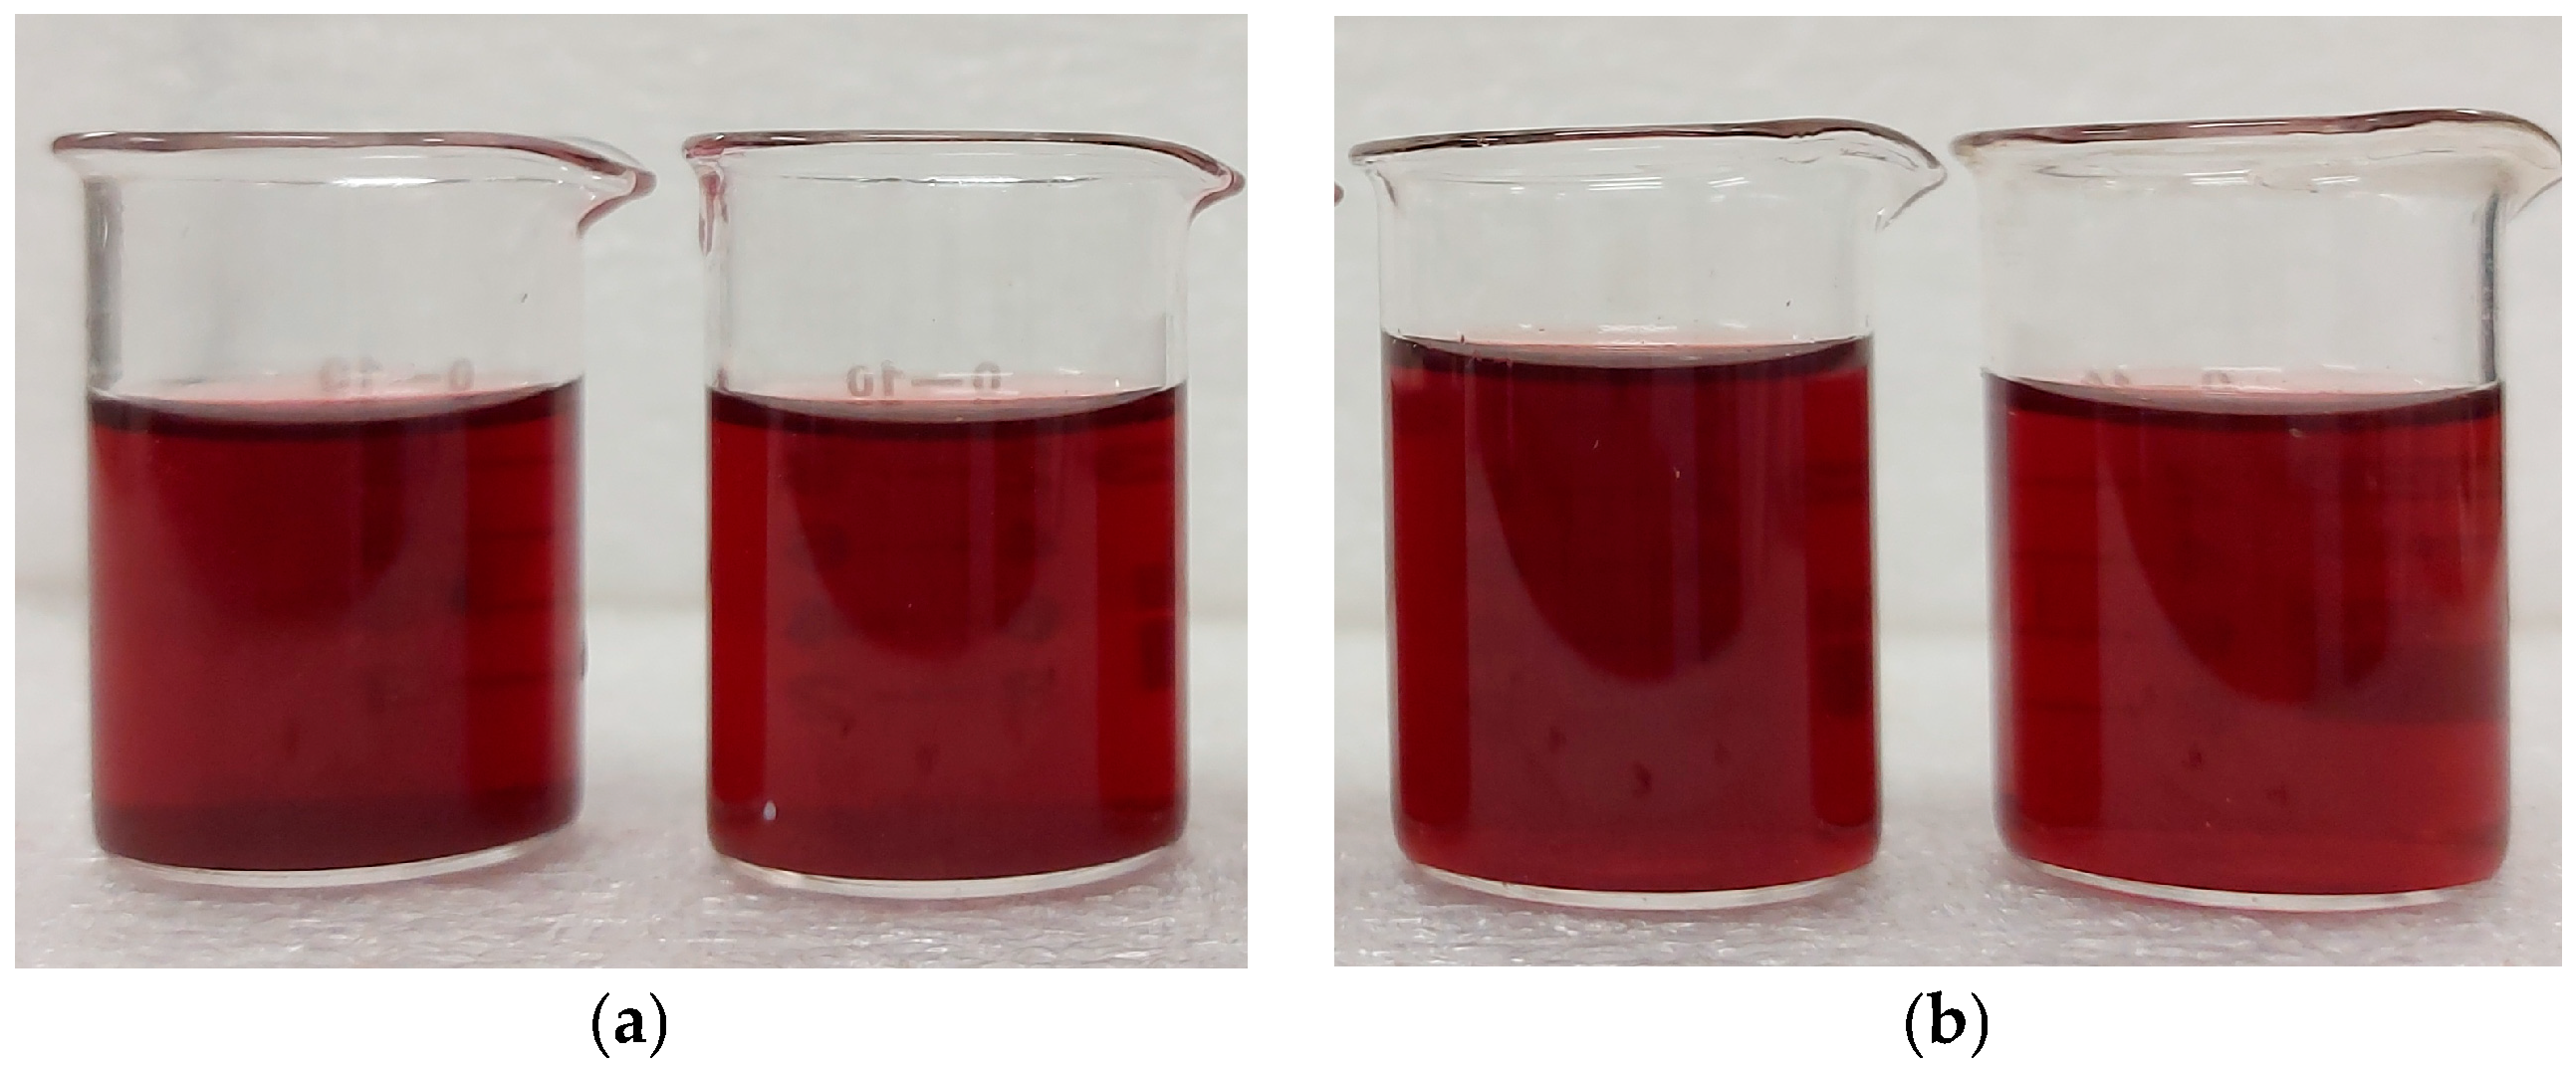
2.1. Physicochemical Characteristics
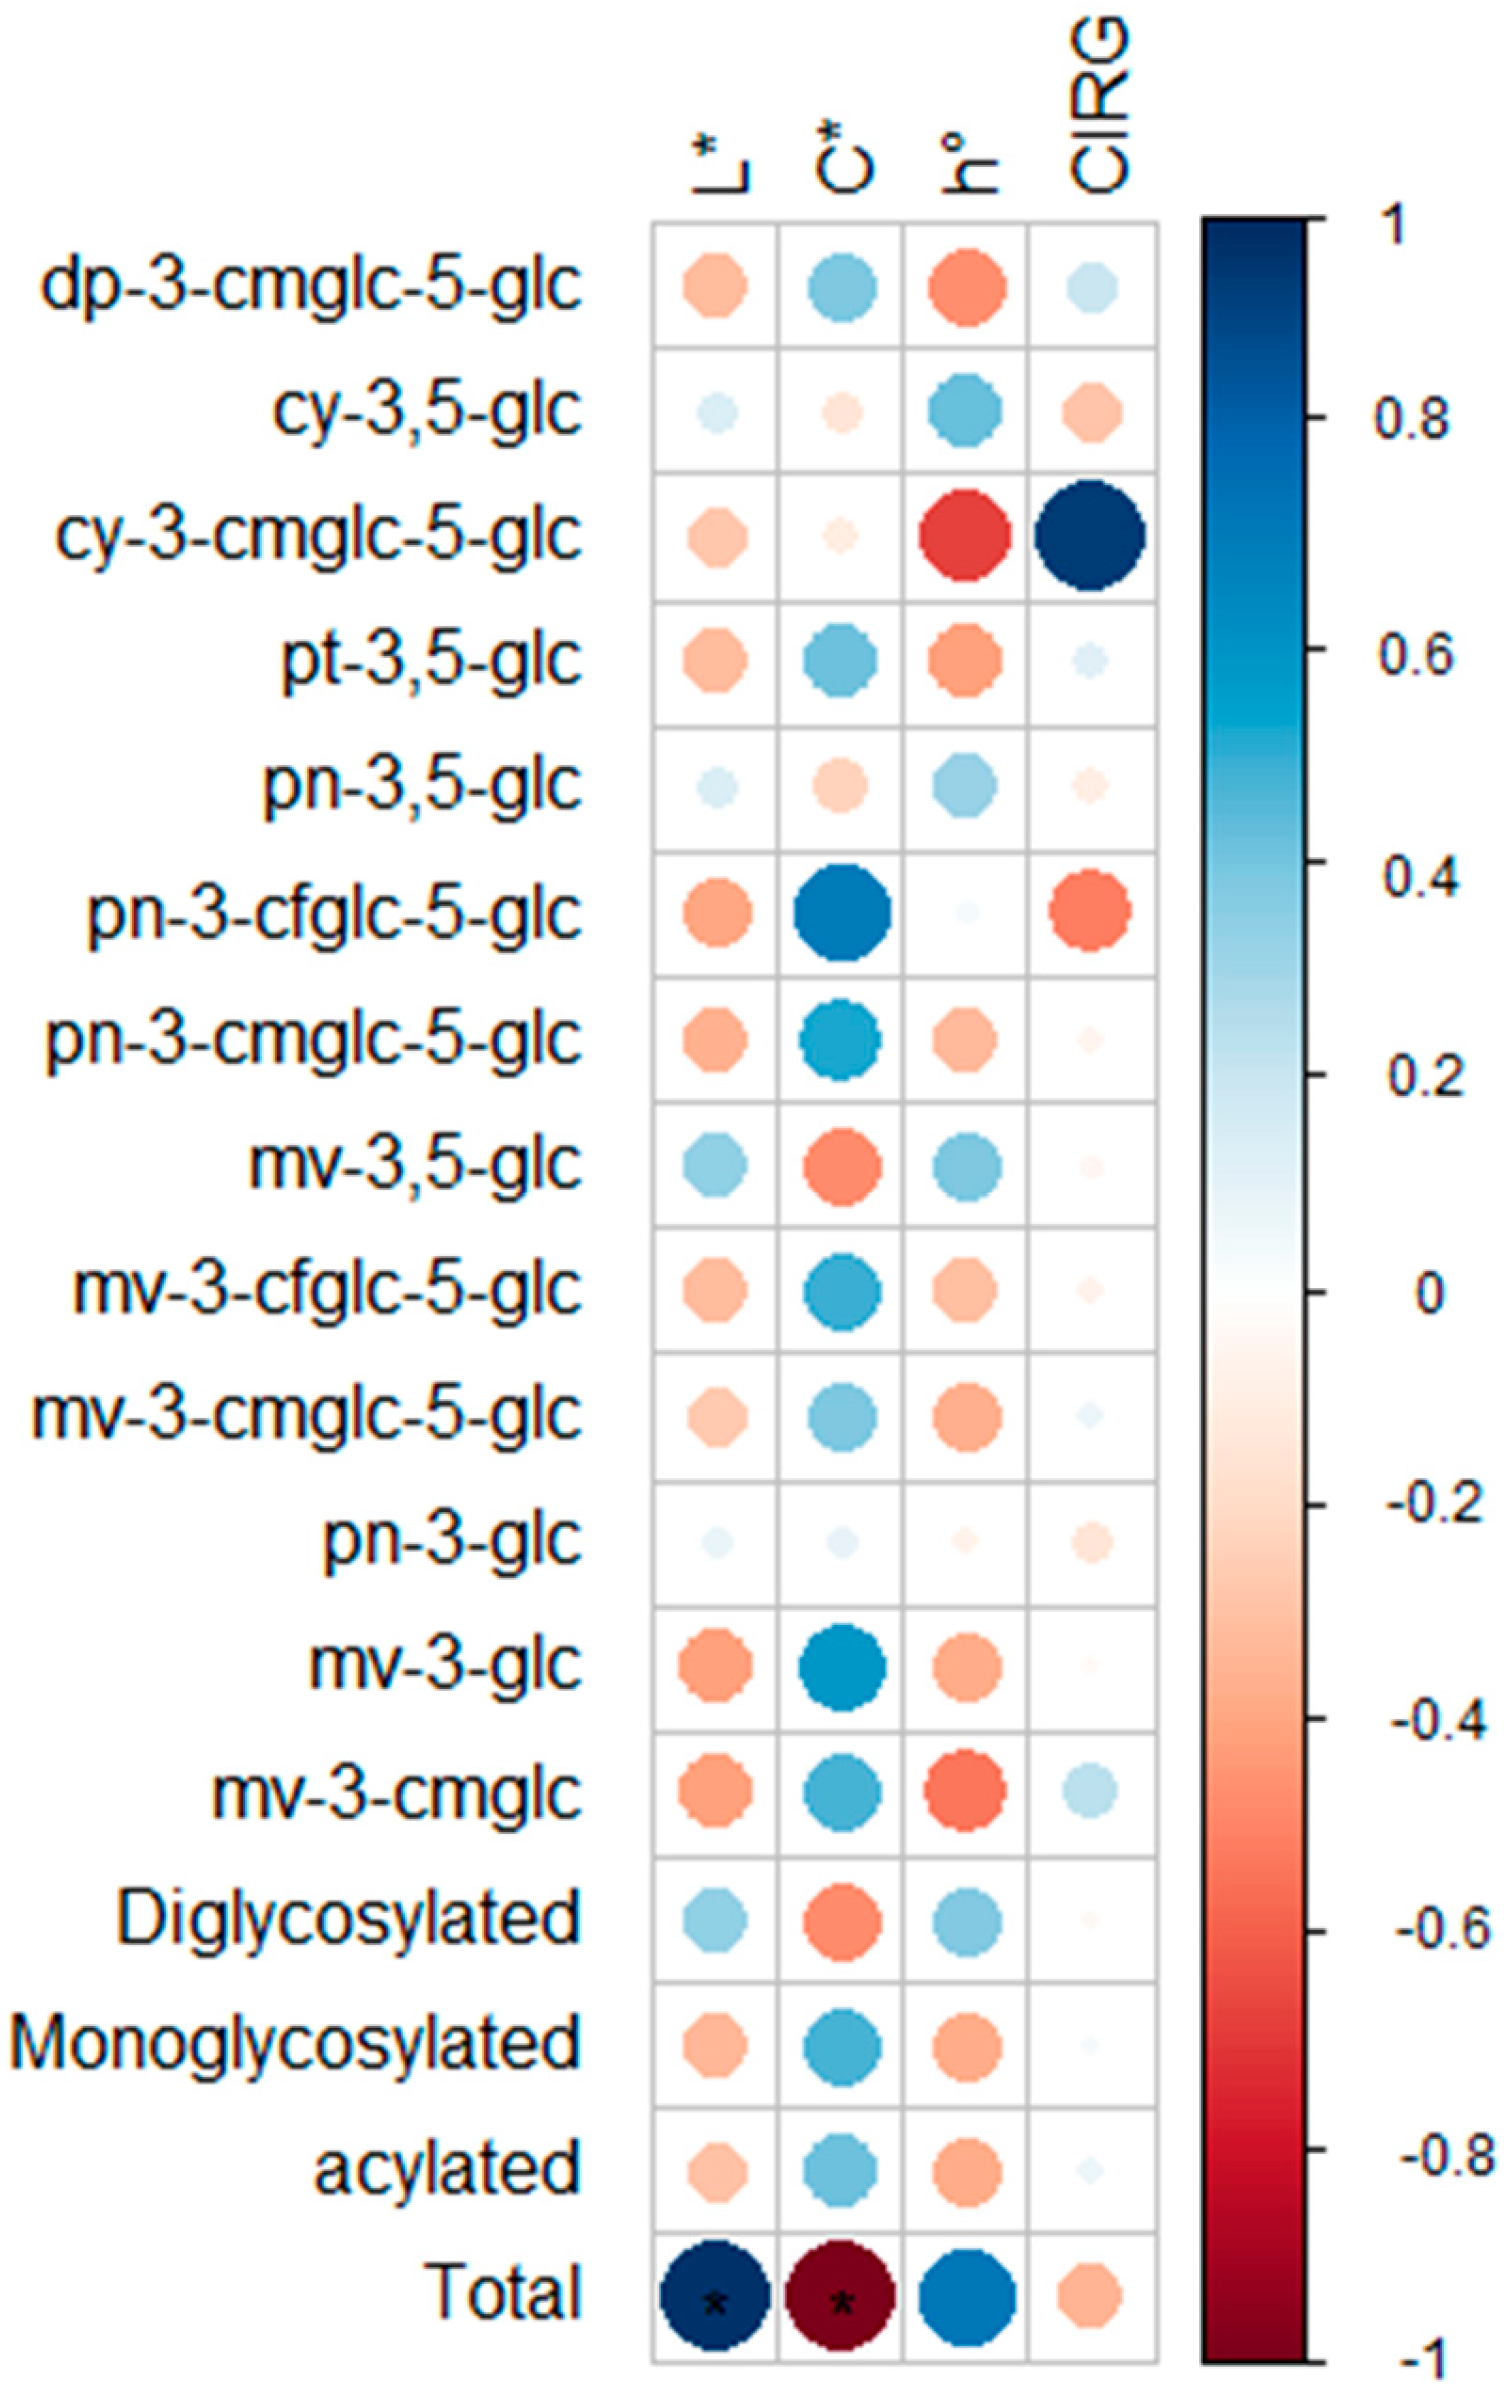
2.2. Identification and Quantification of Anthocyanins in the Liqueur
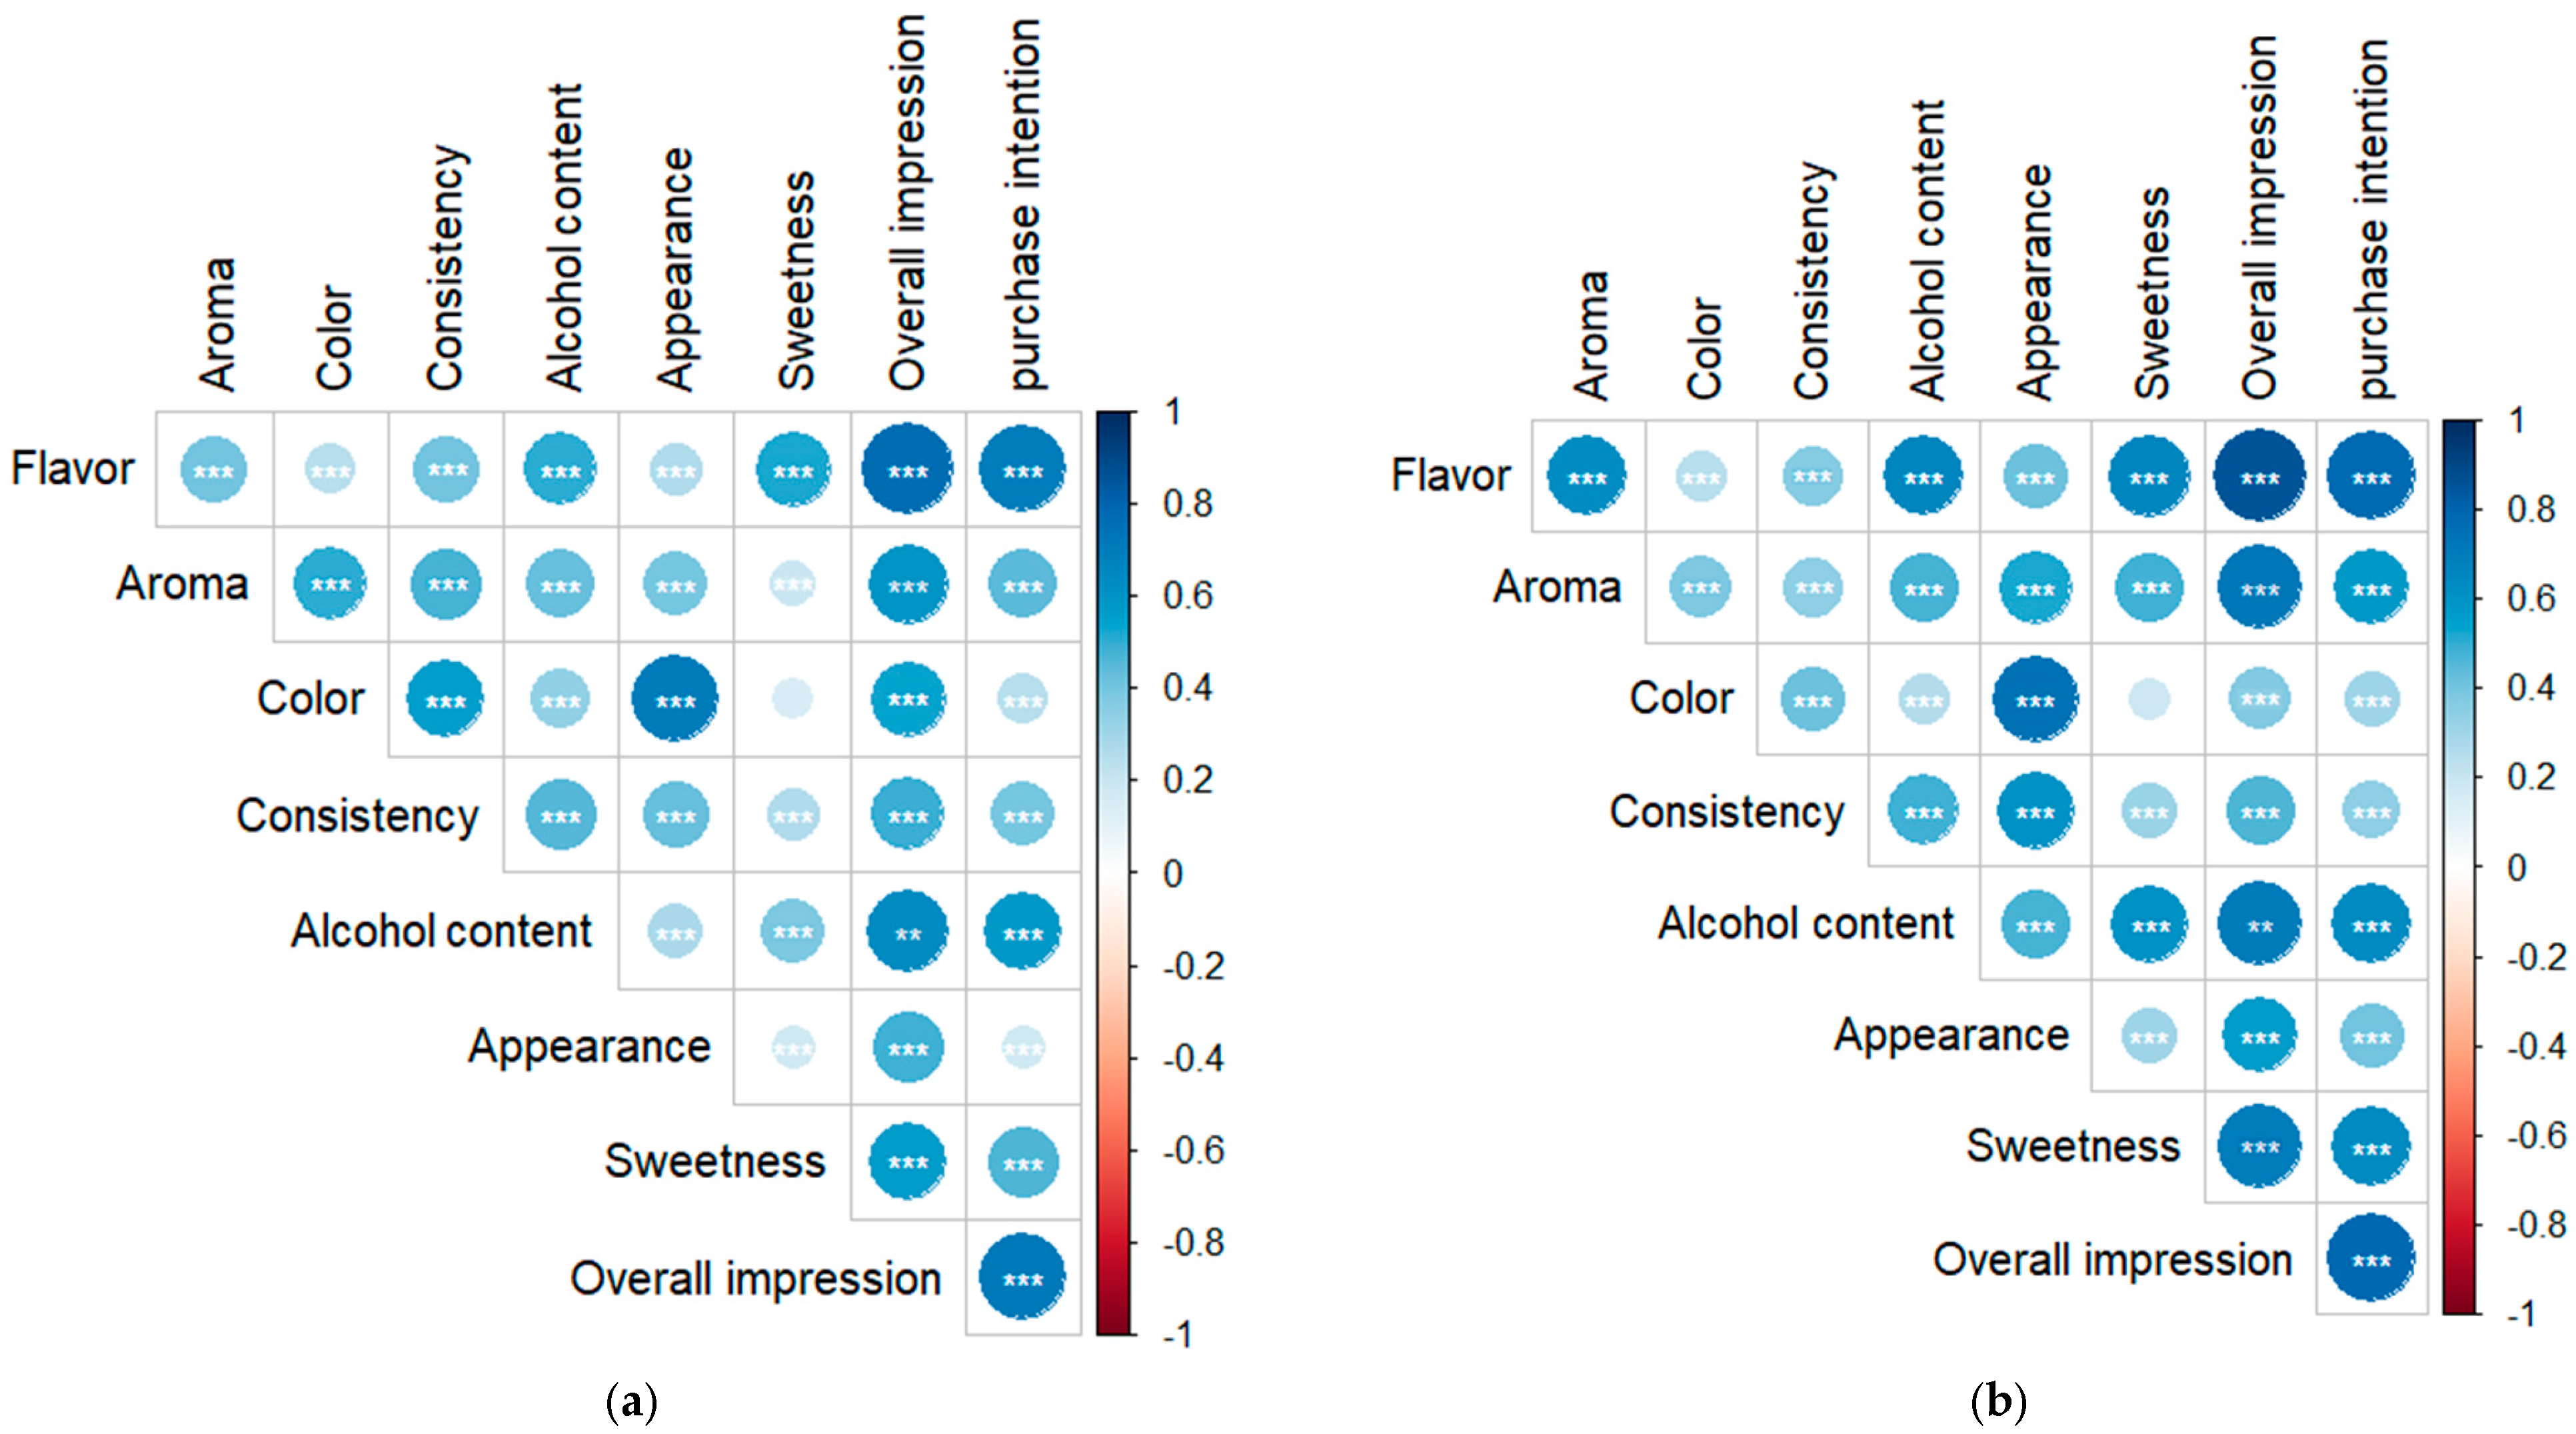
2.3. Sensory Acceptance
3. Materials and Methods
3.1. Reagents and Standards
3.2. Grapes and Ingredients for Liqueur Production
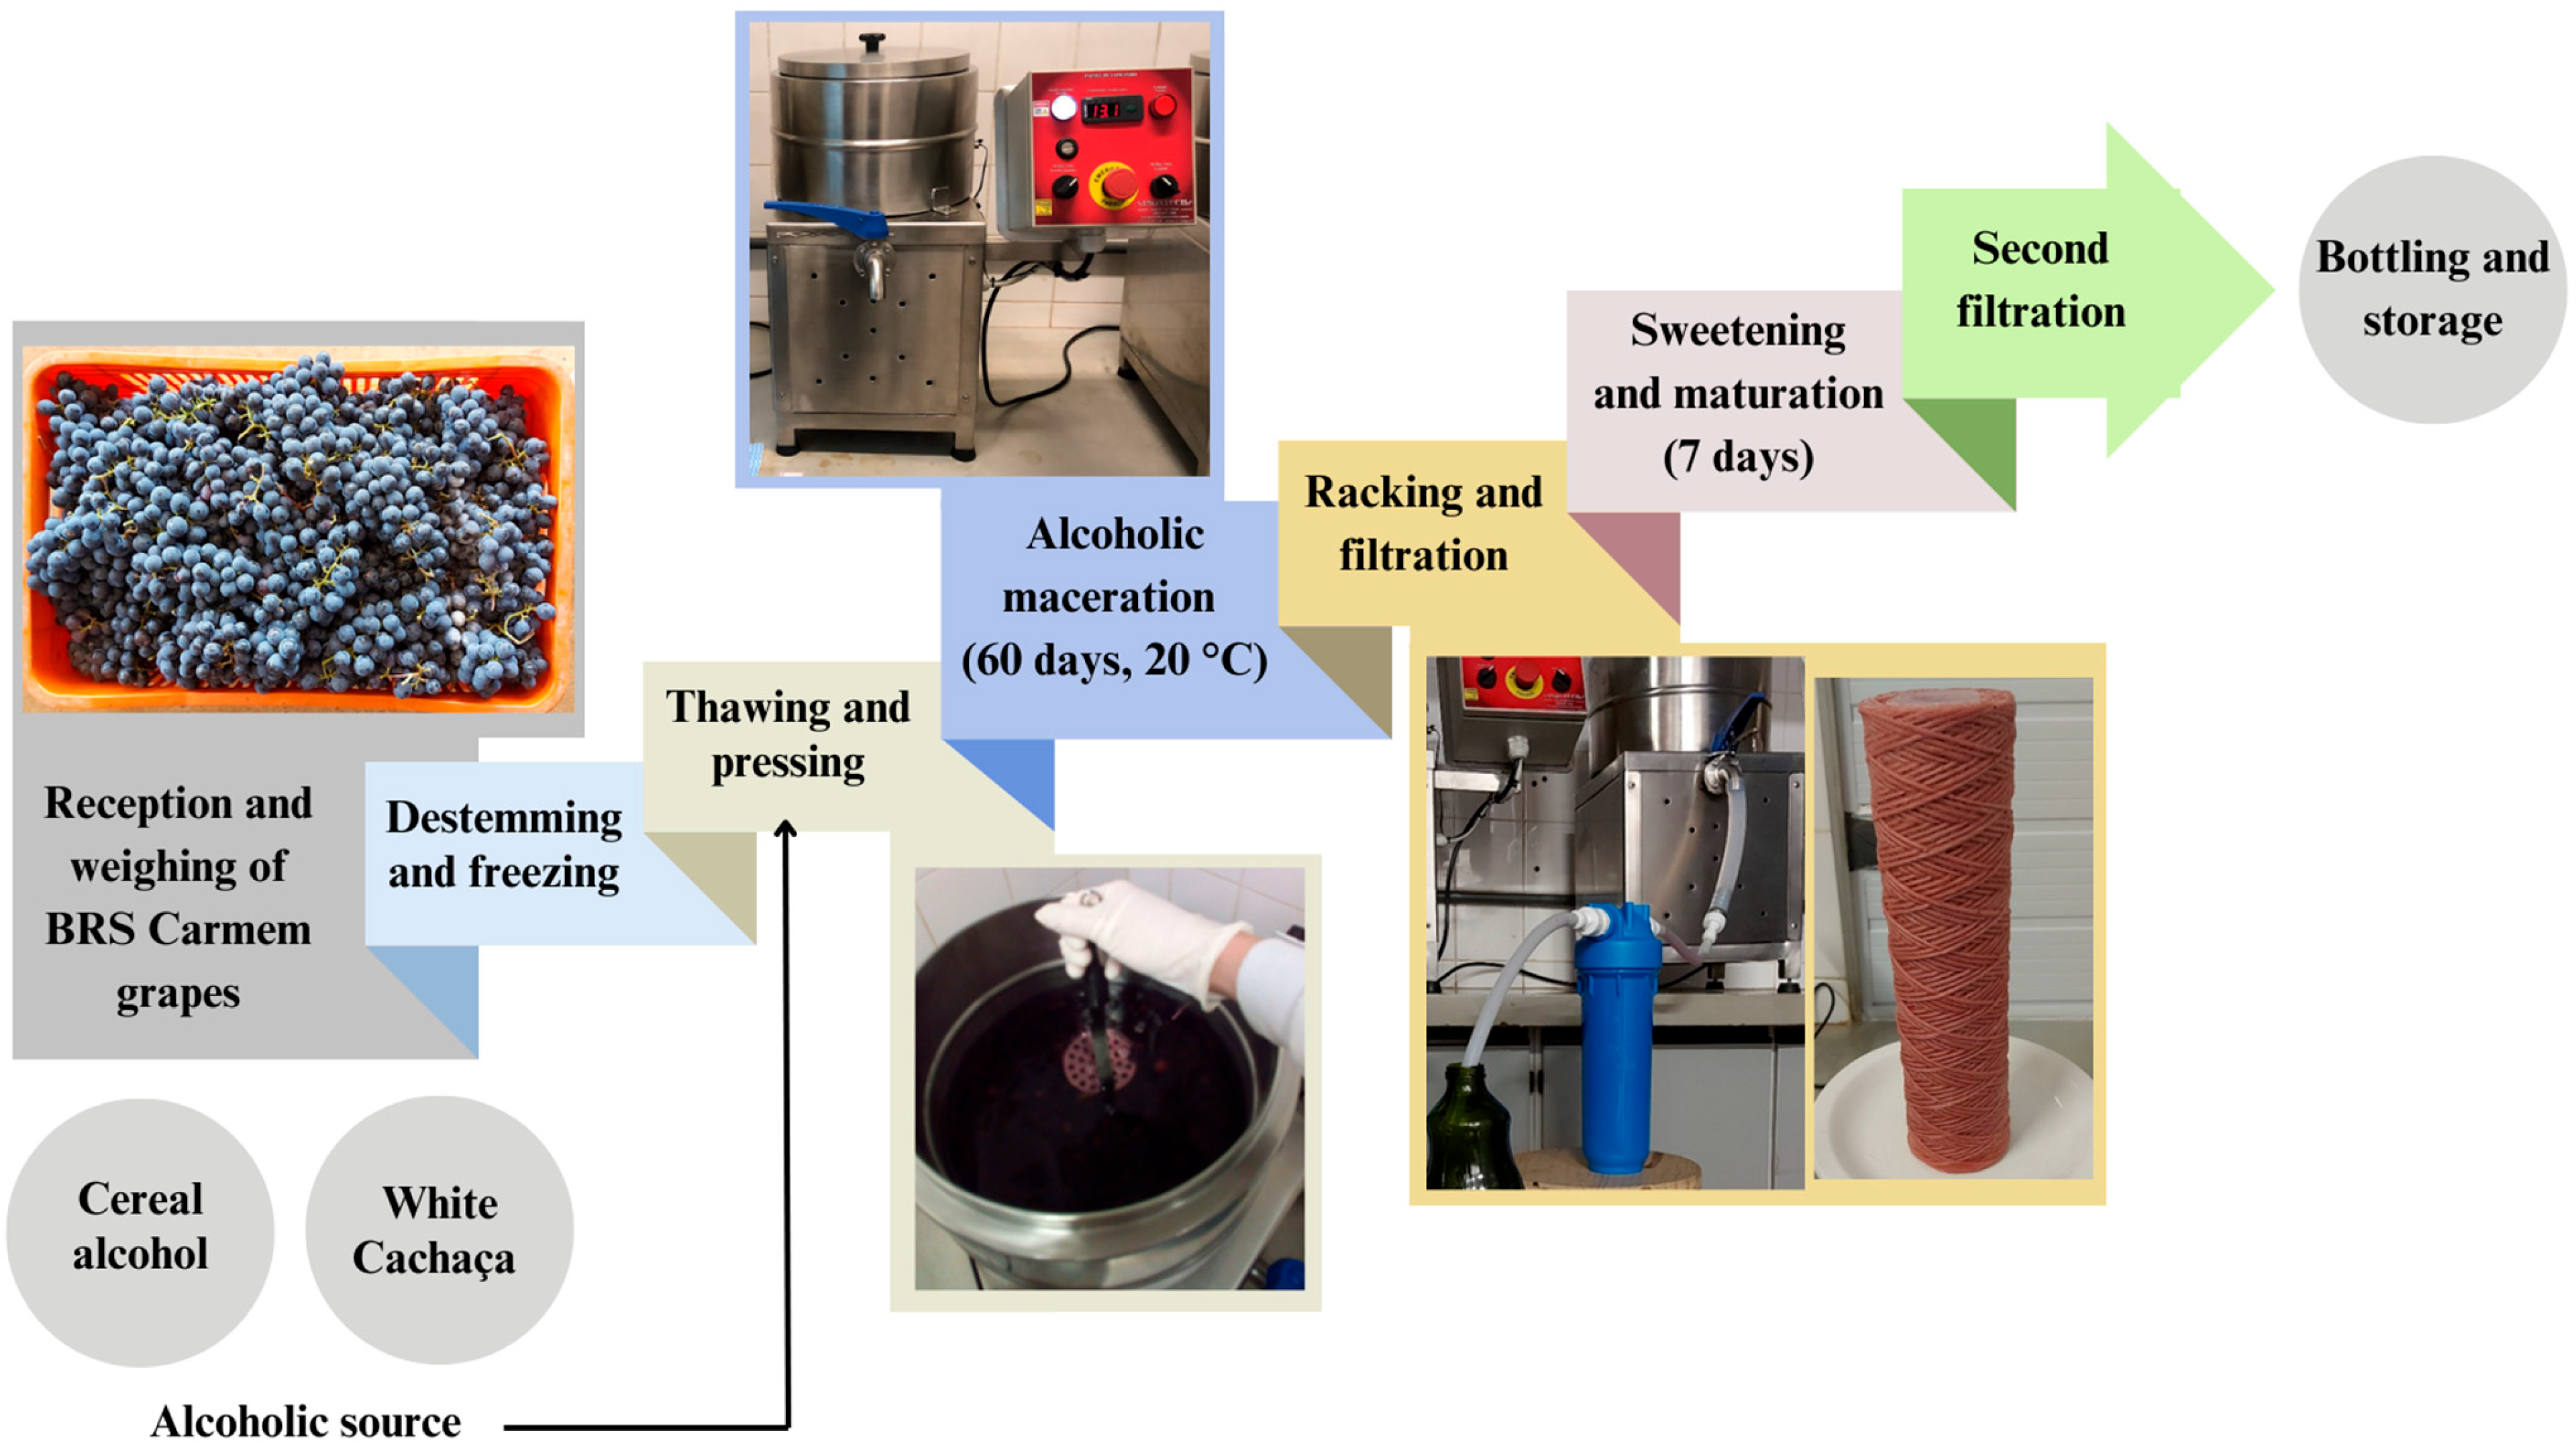
3.3. Liqueurs Production
3.4. Physicochemical Characterization of the Liqueur
3.5. Identification and Quantification of Anthocyanins
3.6. Sensory Analysis
3.7. Statistical Analysis
4. Conclusions
Author Contributions
Funding
Institutional Review Board Statement
Informed Consent Statement
Data Availability Statement
Acknowledgments
Conflicts of Interest
Abbreviations
| A | Cereal alcohol |
| C | White cachaça |
| PC | Phenolic compound |
| SS | Soluble solids |
| TA | Total acidity |
| TPC | Total phenolic compounds |
| CIRG | Color Index for Red Grapes |
| mv | Malvidin |
| pn | Peonidin |
| pt | Petunidin |
| dp | Delphinidin |
| cy | Cyanidin |
| glc | Glucoside |
| cmglc | Coumaroil-glucoside |
| cfglc | Caffeoyl-glucoside |
References
- IWSR—International Wine and Spirits Research. Available online: https://info.theiwsr.com/5-key-trends-ebook-2025 (accessed on 26 February 2025).
- Caldeira, I.; Lopes, D.; Delgado, T.; Canas, S.; Anjos, O. Development of Blueberry Liquor: Influence of Distillate, Sweetener and Fruit Quantity. J. Sci. Food Agric. 2018, 98, 1088–1094. [Google Scholar] [CrossRef] [PubMed]
- Neves, N.A.; Gómez-Alonso, S.; García-Romero, E.; Hermosín-Gutiérrez, I.; Silva, I.F.d.; Stringheta, P.C. Chemical Composition of Jabuticaba (Plinia jaboticaba) Liquors Produced from Cachaça and Cereal Alcohol. Food Sci. Technol. 2022, 155, 112923. [Google Scholar] [CrossRef]
- Oliveira, E.N.A.; Santos, D.C.; Gomes, J.P.; Rocha, A.P.T.; Albuquerque, E.M.B. Estabilidade Física e Química de Licores de Graviola Durante o Armazenamento em Condições Ambientais. Rev. Bras. Eng. Agríc. Ambient. 2015, 19, 245–251. [Google Scholar] [CrossRef]
- Silva, E.S.; Costa Junior, J.R.S.; Lacerda, M.S.S.; Brandão, T.S.O. Licores de frutas: Importância, riquezas e símbolos para a região nordeste do Brasil. Centro Científ. Con. 2021, 18, 137–155. [Google Scholar] [CrossRef]
- Camargo, U.A.; Maia, J.D.G.; Ritschel, P.S. BRS Carmem: Nova Cultivar de Uva Tardia para Suco. Embrapa Uva E Vinho. Comun. Técnico 2008, 84, 8. Available online: https://www.infoteca.cnptia.embrapa.br/handle/doc/542548 (accessed on 27 March 2025).
- Nishiyama-Hortense, Y.P.; Olivati, C.; Pérez-Navarro, J.; Souza, R.T.; Janzantti, N.S.; Da-Silva, R.; Hermosín-Gutiérrez, I.; Gómez-Alonso, S.; Lago-Vanzela, E.S. Phenolic Composition of Brazilian BRS Carmem (Muscat Belly A × BRS Rúbea) Grapes: Evaluation of Their Potential Use as Bioingredients. Foods 2023, 12, 2608. [Google Scholar] [CrossRef]
- Camargo, U.A. Impacto das Cultivares Brasileiras de Uva no Mercado Interno e Potencial no Mercado Internacional. In Anais do XII Congresso Brasileiro de Viticultura e Enologia; Ritschel, P., Sebben, S.S., Eds.; Embrapa Uva e Vinho: Bento Gonçalves, Brazil, 2008; pp. 37–42. Available online: https://www.alice.cnptia.embrapa.br/alice/handle/doc/543069 (accessed on 27 March 2025).
- da Silva, M.J.R.; Paiva, A.P.M.; Pimentel, A.; Sánchez, C.A.P.C.; Callili, D.; Moura, M.; Leonel, S.; Tecchio, M.A. Yield Performance of New Juice Grape Varieties Grafted onto Different Rootstocks under Tropical Conditions. Sci. Hortic. 2018, 241, 194–200. [Google Scholar] [CrossRef]
- da Silva, M.J.R.; da Silva Padilha, C.V.; dos Santos Lima, M.; Pereira, G.E.; Venturini Filho, W.G.; Moura, M.F.; Tecchio, M.A. Grape Juices Produced from New Hybrid Varieties Grown on Brazilian Rootstocks—Bioactive Compounds, Organic Acids and Antioxidant Capacity. Food Chem. 2019, 289, 714–722. [Google Scholar] [CrossRef]
- De-Castilhos, M.B.M.; Del Bianchi, V.L.; Gómez-Alonso, S.; García-Romero, E.; Hermosín-Gutiérrez, I. sensory descriptive and comprehensive GC–MS as suitable tools to characterize the effects of alternative winemaking procedures on wine aroma. Part I: BRS Carmem and BRS Violeta. Food Chem. 2019, 272, 462–470. [Google Scholar] [CrossRef]
- Addis, R.; Mannu, A.; Pintore, G.; Petretto, G.L. Statistical analysis applied to the production of Mirto liqueur. Appl. Sci. 2024, 14, 5973. [Google Scholar] [CrossRef]
- Dechkunchorn, M.; Phet-Tool, S.; Suepchat, P.; Tinchan, P.; Jumnongpon, R. Effect of Ethanol Concentrations, Honey Adding and Maceration Times on Quality of Mao (Antidesma thwaitesianum) Liqueur. Trends Sci. 2024, 21, 7673. [Google Scholar] [CrossRef]
- Brazil, Ministério da Agricultura, Pecuária e Abastecimento. Consolidação das Normas de Bebidas, Fermentado Acético, Vinho e Derivados da Uva e do Vinho: Anexo à Norma Interna DIPOV n° 01/2019—Cartilhão/Coordenação Geral de Vinhos e Bebidas, 3rd ed.; MAPA/AECS: Brasília, Brazil, 2024. Available online: https://www.gov.br/agricultura/pt-br/assuntos/inspecao/produtos-vegetal/legislacao-de-produtos-origem-vegetal/bebidas (accessed on 11 October 2024).
- Almeida, V.E.; Neto, J.F.B.; Bezerra, T.K.A.; da Silva, V.P.; Veras, G.; Ramos, R.O.; Fernandes, D.D.S. Quantification of alcohol content and identification of fraud in traditional cachaças using NIR spectroscopy. Food Chem. 2025, 480, 143809. [Google Scholar] [CrossRef]
- Ratkovich, N.; Esser, C.; Machado, A.M.R.; Mendes, B.A.; Cardoso, M.G. The spirit of cachaça production: An umbrella review of processes, flavour, contaminants and quality improvement. Foods 2023, 12, 3325. [Google Scholar] [CrossRef]
- Bortoletto, A.M.; Alcarde, A.R. Assessment of chemical quality of Brazilian sugar cane spirits and cachaças. Food Control 2015, 54, 1–6. [Google Scholar] [CrossRef]
- Bragança, M.G.L. Licor: Processamento Artesanal; EMATER-MG: Belo Horizonte, Brazil, 2013; p. 15. [Google Scholar]
- Leonarski, E.; Dos Santos, D.F.; Kuasnei, M.; Lenhani, G.C.; Quast, L.B.; Zanella Pinto, V. Development, chemical, and sensory characterization of liqueurs from Brazilian native fruits. J. Culin. Sci. Technol. 2021, 19, 214–227. [Google Scholar] [CrossRef]
- Nascimento, G.S.d.; Borges, G.R.; Scheid, C.; Garavaglia, J. Effects of Cinnamon Addition on the Sensory and Physicochemical Characteristics of Banana Liqueurs. Food Sci. Technol. 2023, 43, e2623. [Google Scholar] [CrossRef]
- Oliveira, C.B.d.; Queiroz, B.B.T.; Delalibera, P.; Navarro, J.P.; Gómez-Alonso, S.; Pertuzatti, P.B. Application of Response Surface Methodology in the Characterization and Sensorial Analysis of Anacardium humile Liqueur. Food Chem. Adv. 2023, 3, 100533. [Google Scholar] [CrossRef]
- United States. Code of Federal Regulations. Title 27, Part 5, Section 5.150—Cordials and Liqueurs; Office of the Federal Register National Archives and Records Administration: Washington, DC, USA, 2024. [Google Scholar]
- European Union. Regulation (EU) 2019/787 of the European Parliament and of the Council of 17 April 2019 on the definition, description, presentation, labeling and the protection of geographical indications of spirit drinks, and repealing Regulation (EC) No 110/2008. Off. J. Eur. Union. 2019, 130, 1–54.
- Matias-Guiu, P.; Rodríguez-Bencomo, J.J.; Pérez-Correa, J.R.; López, F. Aroma Compounds Evolution in Fruit Spirits under Different Storage Conditions Analyzed with Multiway ANOVA and Artificial Neural Networks. J. Food Process. Preserv. 2020, 44, e14410. [Google Scholar] [CrossRef]
- Corrêa Antunes, L.E.; Duarte Filho, J.; de Souza, C.M. Conservação pós-colheita de frutos de amoreira-preta. Pesq. Agropecu. Bras. 2003, 38, 413–419. Available online: https://www.scielo.br/j/pab/a/sX4GV9HLv8qXFLZbkQY3Pxs/ (accessed on 1 November 2024). [CrossRef]
- Kuskoski, E.M.; García Asuero, A.; Morales, M.T.; Fett, R. Frutos tropicais silvestres e polpas de frutas congeladas: Atividade antioxidante, polifenóis e antocianinas. Ciênc. Rural. 2006, 36, 1283–1287. [Google Scholar] [CrossRef]
- Folta, K.M.; Klee, H.J. Sensory sacrifices when we mass-produce mass produce. Hortic. Res. 2016, 3, 16032. [Google Scholar] [CrossRef] [PubMed]
- Schmitzer, V.; Mikulic-Petkovsek, M.; Stampar, F. Traditional rose liqueur–A pink delight rich in phenolics. Food Chem. 2019, 272, 434–440. [Google Scholar] [CrossRef] [PubMed]
- Lima, C.M.G.; Benoso, P.; Pierezan, M.D.; Santana, R.F.; Hassemer, G.S.; Rocha, R.A.; Dalla Nora, F.M.; Verruck, S.; Caetano, D.; Simal-Gandara, J. A State-of-the-art review of the chemical composition of sugarcane spirits and current advances in quality control. J. Food Compos. Anal. 2022, 106, 104338. [Google Scholar] [CrossRef]
- Ribéreau-Gayon, P.; Glories, Y.; Maujean, A.; Dubourdieu, D. The chemistry of wine, stabilization and treatments. In Handbook of Enology; John Wiley & Sons: Chichester, UK, 2002; Volume 2. [Google Scholar]
- Pathare, P.B.; Opara, U.L.; Al-Said, F.A.J. Colour measurement and analysis in fresh and processed foods: A review. Food Bioprocess. Technol. 2013, 6, 36–60. [Google Scholar] [CrossRef]
- Kontaxakis, E.; Lydakis, D.; Fisarakis, I. Enhancing red table grape coloration using Tsikoudia: A novel and sustainable approach. Plants 2024, 13, 2689. [Google Scholar] [CrossRef]
- Olivares, D.; Contreras, C.; Muñoz, V.; Rivera, S.; González-Agüero, M.; Retamales, J.; Defilippi, B.G. Relationship among color development, anthocyanin and pigment-related gene expression in ‘Crimson Seedless’ grapes treated with abscisic acid and sucrose. Plant Physiol. Biochem. 2017, 115, 286–297. [Google Scholar] [CrossRef]
- Tiwari, B.K.; Patras, A.; Brunton, N.; Cullen, P.J.; O’Donnell, C.P. Effect of ultrasound processing on anthocyanins and color of red grape juice. Ultrason. Sonochem. 2010, 17, 598–604. [Google Scholar] [CrossRef]
- Vieira, V.B.; Rodrigues, J.B.; Brasil, C.C.B.; Rosa, C.S.d. Produção, caracterização e aceitabilidade de licor de camu-camu (Myrciaria dúbia (H.B.K.) McVaugh). Alim. Nutr. 2010, 21, 519–522. [Google Scholar]
- Xie, S.; Liu, Y.; Chen, H.; Zhang, Z.; Ge, M. Anthocyanin Degradation and the Underlying Molecular Mechanism in a Red-Fleshed Grape Variety. LWT–Food Sci. Technol. 2021, 151, 112198. [Google Scholar] [CrossRef]
- Romero, I.; Sanchez-Ballesta, M.T.; Escribano, M.I.; Merodio, C. Individual anthocyanins and their contribution to total antioxidant capacity in response to low temperature and high CO2 in stored Cardinal table grapes. Postharvest Biol. Technol. 2008, 49, 1–9. [Google Scholar] [CrossRef]
- Casassa, L.F. Flavonoid Phenolics in Red Winemaking. In Phenolic Compounds—Natural Sources, Importance and Applications; Soto-Hernández, M., Palma-Tenango, M., García-Mateos, R., Eds.; IntechOpen: London, UK, 2017; pp. 257–276. [Google Scholar] [CrossRef]
- Casassa, L.F.; Fanzone, M.L.; Sari, S.E. Comparative phenolic, chromatic, and sensory composition of five monovarietal wines processed with microwave technology. Heliyon 2022, 8, e12332. [Google Scholar] [CrossRef] [PubMed]
- Li, X.; Zhang, L.; Peng, Z.; Zhao, Y.; Wu, K.; Zhou, N.; Yan, Y.; Ramaswamy, H.S.; Sun, J.; Bai, W. The impact of ultrasonic treatment on blueberry wine anthocyanin color and its in-vitro antioxidant capacity. Food Chem. 2020, 333, 127455. [Google Scholar] [CrossRef]
- Wang, Z.; Zhang, L.; Li, Y.; Liu, Q.; Yuan, C. Non-acylated and acylated anthocyanins in red wines of different ages: Color contribution and evaluation. J. Food Compos. Anal. 2023, 115, 104951. [Google Scholar] [CrossRef]
- Shi, N.; Li, H.-Q.; Lu, H.-C.; Tian, M.-B.; Han, X.; He, F.; Wang, J. Adjusting the pomace ratio during red wine fermentation: Effects of adding white grape pomace and juice runoff on wine flavoromics and sensory qualities. Food Chem. X 2023, 20, 100939. [Google Scholar] [CrossRef]
- Enaru, B.; Drețcanu, G.; Pop, T.D.; Stǎnilǎ, A.; Diaconeasa, Z. Anthocyanins: Factors affecting their stability and degradation. Antioxidants 2021, 10, 1967. [Google Scholar] [CrossRef]
- Torskangerpoll, K.; Andersen, Ø.M. Colour stability of anthocyanins in aqueous solutions at various pH values. Food Chem. 2005, 89, 427–440. [Google Scholar] [CrossRef]
- Rodrigues, V.N.; dos Santos, D.F.; dos Santos, G.H.F.; Bitencourt, T.B. Market Research, Elaboration and Characterization of Pineapple Liqueur. Rev. Produção E Desenvolvimento 2017, 3, 34–42. [Google Scholar] [CrossRef]
- Abella, E.C.; Dutra, H.M.A.; Schneider, E.P.; Nachtigal, J.C. Processamento da Uva na Propriedade Rural; Embrapa Uva e Vinho: Bento Gonçalves, Brazil, 2007; p. 23. Available online: http://www.infoteca.cnptia.embrapa.br/infoteca/handle/doc/542095 (accessed on 1 November 2024).
- Brazil, Agência Nacional de Vigilância Sanitária. Regulamento Técnico de Boas Práticas para Serviços de Alimentação—Resolução RDC nº 216, de 15 de Setembro de 2004; Ministério da Saúde: Brasília, Brazil, 2004; p. 14. Available online: https://www.gov.br/anvisa/pt-br (accessed on 1 November 2024).
- IAL—Instituto Adolfo Lutz. Métodos Físico-Químicos para Análise de Alimentos, 4th ed.; Ministério da Saúde: Brasília, Brazil, 2008; p. 1018. [Google Scholar]
- OIV (Organisation Internationale de la Vigne et du Vin). OIV Descriptor List for Grape Varieties and Vitis Species; OIV: Paris, France, 2001. [Google Scholar]
- Lipps, W.C.; Braun-Howland, E.B.; Baxter, T.E. Standard Methods for the Examination of Water and Wastewater, 24th ed.; American Public Health Association: Washington, DC, USA; American Water Works Association: Denver, CO, USA; Water Environment Federation: Alexandria, VA, USA, 2023. [Google Scholar]
- AOAC—Association of Official Analytical Chemists. Official Methods of Analysis of AOAC International, 18th ed.; AOAC International: Washington, DC, USA, 2005. [Google Scholar]
- Ribéreau-Gayon, P.; Stonestreet, E. Le Dosage des Anthocyanes dans les Vins Rouges. Determ. Anthocyanins Red. Wine. Bull. Soc. Chim. Fr. 1965, 9, 2649–2652. [Google Scholar]
- McLellan, M.R.; Lind, L.R.; Kime, R.W. Hue Angle Determinations and Statistical Analysis for Multiquadrant Hunter L, a, b Data. J. Food Qual. 1995, 18, 235–240. [Google Scholar] [CrossRef]
- Francis, F.J. Colorimetric Properties of Food. In Engineering Properties of Foods, 3rd ed.; Rao, M.A., Rizvi, S.S.H., Datta, A.K., Eds.; CRC Press: Boca Raton, FL, USA, 2005; pp. 703–732. [Google Scholar] [CrossRef]
- Carreño, J.; Martínez, A.; Almela, L.; Fernández-López, J.A. Proposal of an Index for the objective evaluation of the colour of red table grapes. Food Res. Int. 1995, 28, 373–377. [Google Scholar] [CrossRef]
- Rebello, L.P.G.; Lago-Vanzela, E.S.; Barcia, M.T.; Ramos, A.M.; Stringheta, P.C.; Da-Silva, R.; Castillo-Muñoz, N.; Gómez-Alonso, S.; Hermosín-Gutiérrez, I. Phenolic composition of the berry parts of hybrid grape cultivar BRS Violeta (BRS Rúbea × IAC 1398-21) Using HPLC–DAD–ESI-MS/MS. Food Res. Int. 2013, 54, 354–366. [Google Scholar] [CrossRef]
- Castillo-Muñoz, N.; Fernández-González, M.; Gómez-Alonso, S.; García-Romero, E.; Hermosín-Gutiérrez, I. Red-Color related phenolic composition of Garnacha Tintorera (Vitis vinifera L.) grapes and red wines. J. Agric. Food Chem. 2009, 57, 7883–7891. [Google Scholar] [CrossRef] [PubMed]
- Lago-Vanzela, E.S.; Da-Silva, R.; Gomes, E.; García-Romero, E.; Hermosín-Gutiérrez, I. Phenolic composition of the Brazilian seedless table grape varieties BRS Clara and BRS Morena. J. Agric. Food Chem. 2011, 59, 8314–8323. [Google Scholar] [CrossRef]
- Lago-Vanzela, E.S.; Da-Silva, R.; Gomes, E.; García-Romero, E.; Hermosín-Gutiérrez, I. Phenolic composition of the edible parts (flesh and skin) of Bordô grape (Vitis labrusca) using HPLC–DAD–ESI-MS/MS. J. Agric. Food Chem. 2011, 59, 13136–13146. [Google Scholar] [CrossRef]
- Macfie, H.J.H.; Bratchell, N.; Greenhoff, K.; Vallis, L.V. Designs to balance the effect of order of presentation and first-order carry-over effects in hall tests. J. Sens. Stud. 1989, 4, 129–148. [Google Scholar] [CrossRef]
- R Core Team. R: A Language and Environment for Statistical Computing; R Foundation for Statistical Computing: Vienna, Austria, 2022. [Google Scholar]
- Wei, T.; Simko, V. R Package ‘Corrplot’: Visualization of a Correlation Matrix, Version 0.95; CRAN: Wien, Austria, 2024. [Google Scholar]
- Nakazawa, M. FMSB: Functions for Medical Statistics Book with Some Demographic Data, Version 0.7.6; Pearson Education: Tokyo, Japan, 2024. [Google Scholar]


| Parameter 1 | Cereal Alcohol | White Cachaça |
|---|---|---|
| SS (°Brix) | 23.25 ± 0.01 * | 19.50 ± 0.01 |
| Total sugar content (g⋅L−1) | 177.3 ± 6.9 * | 149.5 ± 2.0 |
| TA (g tartaric acid⋅100 g−1) | 0.39 ± 0.06 * | 0.33 ± 0.04 |
| pH | 2.77 ± 0.06 | 2.87 ± 0.02 * |
| TPC (mg gallic acid⋅100 g−1) | 607.45 ± 27.83 * | 457.64 ± 11.86 |
| Lightness (L*) | 26.51 ± 0.63 | 30.64 ± 0.25 * |
| Chromaticity (C*) | 29.38 ± 0.52 * | 24.55 ± 0.31 |
| Hue angle (h°) | 59.16 ± 1.77 | 63.18 ± 2.34 * |
| Color Index for Red Grapes (CIRG) | 2.16 ± 0.10 | 2.12 ± 0.08 |
| Alcohol content (% v/v at 20 °C) | 21.59 ± 1.49 | 20.14 ± 0.28 |
| Methyl alcohol (mg⋅100 mL−1) | 18.65 ± 2.09 * | 10.47 ± 1.33 |
| Copper (mg⋅kg−1) | <0.3 | <0.3 |
| Lead (mg⋅L−1) | <0.1 | <0.1 |
| Anthocyanin 1 | Molecular Ion; Product (m/z) | Molar Ratio | |
|---|---|---|---|
| Cereal Alcohol | White Cachaça | ||
| Diglycosylated (3,5-glc) | |||
| dp-3-cmglc-5-glc | 773; 611, 303 | 0.62 ± 0.16 | 0.50 ± 0.21 |
| cy-3,5-glc | 611; 449, 287 | 0.40 ± 0.02 | 0.40 ± 0.03 |
| cy-3-cmglc-5-glc | 757; 595, 287 | 0.34 ± 0.09 | 0.34 ± 0.03 |
| pt-3,5-glc | 641; 479, 317 | 0.60 ± 0.12 | 0.51 ± 0.14 |
| pn-3,5-glc | 625; 463, 301 | 8.17 ± 0.85 | 8.52 ±1.08 |
| pn-3-cfglc-5-glc | 787; 625, 301 | 1.25 ± 0.13 | 1.16 ± 0.03 |
| pn-3-cmglc-5-glc | 771; 609, 301 | 3.60 ± 0.21 | 3.44 ± 0.15 |
| mv-3,5-glc | 655; 493, 331 | 36.03 ± 2.91 | 38.36 ± 2.74 |
| mv-3-cfglc-5-glc | 817; 655, 331 | 12.88 ± 0.27 | 12.79 ±0.21 |
| mv-3-cmglc-5-glc | 801; 639, 331 | 33.81 ± 2.86 | 31.89 ± 3.02 |
| Monoglycosylated (3-glc) | |||
| pn-3-glc | 463, 301 | 0.71 ± 0.06 | 0.70 ± 0.05 |
| mv-3-glc | 493, 331 | 1.27 ± 0.15 | 1.13 ± 0.13 |
| mv-3-cmglc | 639, 331 | 0.32 ± 0.08 | 0.25 ± 0.09 |
| Ratio (3,5-glc/3-glc) | 43.39 ± 5.26 | 47.34 ± 5.60 | |
| Total anthocyanin (mg mv-3-glc⋅L−1) | 212.76 ± 25.72 ns | 225.95 ± 57.24 ns | |
| Total anthocyanin (mg mv-3.5-diglc⋅L−1) | 420.04 ± 16.39 ns | 456.44 ± 45.96 ns | |
| Radar Chart | Attribute | Cereal Alcohol | White Cachaça |
|---|---|---|---|
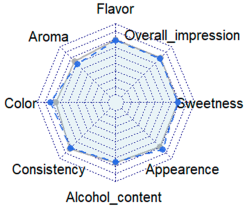 | Appearance | 7.6 ± 1.4 * | 7.1 ± 1.6 |
| Color | 7.5 ± 1.6 * | 6.9 ± 1.7 | |
| Consistency | 7.3 ± 1.6 | 7.4 ± 1.4 | |
| Aroma | 6.2 ± 1.8 | 6.7 ± 1.7 * | |
| Flavor | 7.1 ± 1.4 | 7.2 ± 1.6 | |
| Sweetness | 7.1 ± 1.6 | 7.1 ± 1.6 | |
| Alcohol content | 6.8 ± 1.8 | 6.9 ± 1.9 | |
| Overall impression | 7.1 ± 1.3 | 7.2 ± 1.4 |
Disclaimer/Publisher’s Note: The statements, opinions and data contained in all publications are solely those of the individual author(s) and contributor(s) and not of MDPI and/or the editor(s). MDPI and/or the editor(s) disclaim responsibility for any injury to people or property resulting from any ideas, methods, instructions or products referred to in the content. |
© 2025 by the authors. Licensee MDPI, Basel, Switzerland. This article is an open access article distributed under the terms and conditions of the Creative Commons Attribution (CC BY) license (https://creativecommons.org/licenses/by/4.0/).
Share and Cite
Silva, F.B.d.; Gaspar, T.; Shimizu-Marin, V.D.; Nishiyama-Hortense, Y.P.; Pérez-Navarro, J.; Gómez-Alonso, S.; Lago-Vanzela, E.S. BRS Carmem Grape Liqueurs: Influence of Alcoholic Base on Physicochemical Characteristics, Anthocyanin Composition, and Sensory Acceptance. Molecules 2025, 30, 2270. https://doi.org/10.3390/molecules30112270
Silva FBd, Gaspar T, Shimizu-Marin VD, Nishiyama-Hortense YP, Pérez-Navarro J, Gómez-Alonso S, Lago-Vanzela ES. BRS Carmem Grape Liqueurs: Influence of Alcoholic Base on Physicochemical Characteristics, Anthocyanin Composition, and Sensory Acceptance. Molecules. 2025; 30(11):2270. https://doi.org/10.3390/molecules30112270
Chicago/Turabian StyleSilva, Francielli Brondani da, Taís Gaspar, Victoria Diniz Shimizu-Marin, Yara Paula Nishiyama-Hortense, José Pérez-Navarro, Sergio Gómez-Alonso, and Ellen Silva Lago-Vanzela. 2025. "BRS Carmem Grape Liqueurs: Influence of Alcoholic Base on Physicochemical Characteristics, Anthocyanin Composition, and Sensory Acceptance" Molecules 30, no. 11: 2270. https://doi.org/10.3390/molecules30112270
APA StyleSilva, F. B. d., Gaspar, T., Shimizu-Marin, V. D., Nishiyama-Hortense, Y. P., Pérez-Navarro, J., Gómez-Alonso, S., & Lago-Vanzela, E. S. (2025). BRS Carmem Grape Liqueurs: Influence of Alcoholic Base on Physicochemical Characteristics, Anthocyanin Composition, and Sensory Acceptance. Molecules, 30(11), 2270. https://doi.org/10.3390/molecules30112270