Abstract
The flower buds of three Panax species (PGF: P. ginseng; PQF: P. quinquefolius; PNF: P. notoginseng) widely consumed as health tea are easily confused in market circulation. We aimed to develop a green, fast, and easy analysis strategy to distinguish PGF, PQF, and PNF. In this work, fast gas chromatography electronic nose (fast GC e-nose), headspace-gas chromatography-ion mobility spectrometry (HS-GC-IMS), and headspace solid phase microextraction-gas chromatography-mass spectrometry (HS-SPME-GC-MS) were utilized to comprehensively analyze the volatile organic components (VOCs) of three flowers. Meanwhile, a principal component analysis (PCA) and heatmap were applied to distinguish the VOCs identified in PGF, PQF, and PNF. A random forest (RF) analysis was used to screen key factors affecting the discrimination. As a result, 39, 68, and 78 VOCs were identified in three flowers using fast GC e-nose, HS-GC-IMS, and HS-SPME-GC-MS. Nine VOCs were selected as potential chemical markers based on a model of RF for distinguishing these three species. Conclusively, a complete VOC analysis strategy was created to provide a methodological reference for the rapid, simple, and environmentally friendly detection and identification of food products (tea, oil, honey, etc.) and herbs with flavor characteristics and to provide a basis for further specification of their quality and base sources.
1. Introduction
Multiple species from the Panax genus are known to exhibit tonic effects on human health, such as Panax ginseng C.A. Meyer, Panax quinquefolius L., and Panax notoginseng (Burk.) F.H. Chen are the most widely known and share a large market as drugs, dietary supplements, and foods. Previous research has found that versatile primary and secondary metabolites, including saponins, polysaccharides, flavonoids, amino acids, organic acids, and sterols, etc., are present in these plants. Among these, saponins are the primary bioactive components, exhibiting pharmacological effects on the central nervous system, cardiovascular system, and immune system [1,2]. With the development of modern detection technology, active ingredients similar to those in the respective rhizomes and roots have been found in their flower parts [3,4]. Flower buds are increasingly attracting attention due to their specific health-promoting properties and potential medicinal uses. The flower buds of three Panax species (PGF: P. ginseng; PQF: P. quinquefolius; PNF: P. notoginseng) are currently being developed as a new food ingredient, such as in the form of health tea, which is particularly popular in China due to its unique aroma and health benefits. With further development, these flower buds have also been used in beverages and even added to shampoos [5]. There is a significant price difference among the three flowers, each varying in edibility and taste. PGF and PNF have the best reputation and are priced higher than PQF or other ginseng species. However, the flower buds of PGF, PQF, and PNF have similar appearances. Illegal merchants have substituted cheap PQF, which has a similar appearance, for the more expensive PNF or PGF in order to seek exorbitant profits, resulting in a particularly serious issue with these three flowers being mixed in the market [6]. There is an urgent need for a fast and simple method to distinguish these three flowers in order to maintain the stability of the market. Meanwhile, most research on the components in the three flowers has focused on saponins, while studies on the VOCs of these three flowers are hitherto quite limited. Therefore, it was necessary to characterize the VOCs of the three flowers and provide a reference for their product development.
Conventional approaches for plant identification include microscopic examination, the analysis of physicochemical properties, and thin-layer chromatography (TLC) [7]. These conventional methods require professional personnel and are subject to strong objectivity and low accuracy [8]. Modern identification methods mainly rely on instruments for identification, such as high-performance liquid chromatography (HPLC), mass spectrometry, spectrometry, etc. These technologies have become particularly popular in identification due to their advantages of objectivity and accuracy, especially mass spectrometry [9]. Mass spectrometry mainly includes gas chromatography–mass spectrometry (GC-MS) and liquid chromatography–mass spectrometry (LC-MS). Although LC-MS has the characteristic of high sensitivity, it requires complex sample processing in the early stages. GC-MS includes two-dimensional gas chromatography (GC-GC), gas chromatography–mass spectrometry, electronic noses (e-noses), and gas chromatography–olfactometry–mass spectrometry (GC-O-MS). GC-MS and e-noses are widely used in identification due to their high speed and sensitivity [10,11]. Furthermore, the introduction of headspace solid-phase microextraction (HS-SPME) with GC-MS has significantly simplified the processing of complex samples. This innovation offers the benefits of nondestructive sample processing and improved detection efficiency [12]. Similarly to GC-MS, e-nose technology is a mature technology that is widely used in the food industry [13]. It can simulate human olfactory function and has the advantages of convenience and speed. GC-MS and e-noses are particularly advantageous in the determination of medium-to-large VOCs, although their effectiveness may not be as high as that of HS-GC-IMS for small molecules. HS-GC-IMS is an emerging technique with high molecular specificity, sensitivity, easy operation, affordability and nondestructive analysis, making it well-suited for detecting small-molecular-weight VOCs [14]. HS-SPME-GC-MS and HS-GC-IMS are able to promote detection efficiency and accuracy and implement the comprehensive characterization of VOCs [15]. To the best of our knowledge, no research has been conducted on the identification of PGF, PQF, and PNF and the characterization of their VOCs combining HS-SPME-GC-MS, fast GC e-nose, and HS-GC-IMS.
Therefore, the aim of this study was to establish a complete analytical strategy to achieve a comprehensive characterization and evaluate the flavor characteristics of the VOCs of PGF, PQF, and PNF using HS-SPME-GC-MS, a fast GC e-nose, and HS-GC-IMS combined with multivariate statistical analysis. The differences in the VOCs are further discussed to identify the key markers responsible for these differences. This study aims to achieve the rapid identification of varieties, which can serve as a reference for the establishment of future technologies for the rapid detection and identification of food products and medicinal materials with distinct flavor characteristics as well as for quality control throughout production and circulation. The overall strategy of the experiment is shown in Figure 1.
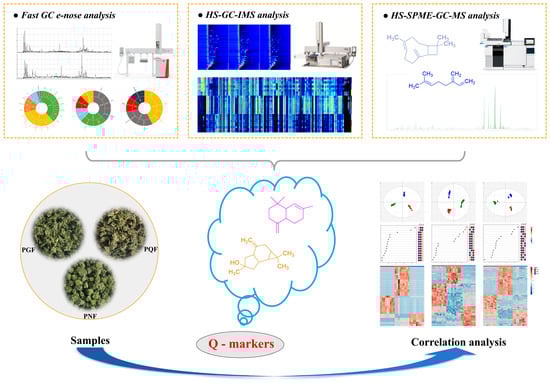
Figure 1.
The overall strategy of the experiment.
2. Results and Discussion
2.1. Characterization of the Flavor Components by Fast GC E-Nose
The fast GC e-nose is an advanced olfactive tool with the high-efficiency separation ability of GC and the biological simulation of smell that has been widely used in the food industry [16,17]. Moreover, due to its advantages in the rapid and objective evaluation of the quality of food and medicinal materials, it has been widely developed in the field of identification and separation of food and medicinal materials [18]. In this study, 27 batches of PGF, PQF, and PNF flavor compounds from different regions were detected using two columns with different polarities (MXT-5 and MXT-1701). From the TIC diagram (Figure S1), it can be seen that columns with different polarities have different effects on the separation and detection of the same sample’s odor, mainly in terms of peak intensities. Since the VOCs of flower samples are mostly non-polar compounds, the MXT-5 column was used as the main identification column, while the MXT-1701 column was used as the auxiliary identification column. The calculated Kovats retention indices were matched against the Arochemical base database and a total of 39 compounds were identified from the three flowers. Table 1 presents the relative information of the aroma components. From the flowers of PQF, 11 components were identified, including 4 hydrocarbons, 1 ether, 5 esters, 2 aldehydes, and 2 terpenes. From the flowers of PGF, 14 compounds were identified, including 2 hydrocarbons, 1 ether, 2 esters, 3 aldehydes, 1 terpene, 1 ketone, and 1 furan. From the flowers of PNF, 26 compounds were identified, including 6 hydrocarbons, 5 esters, 4 aldehydes, 2 alcohols, 4 ketones and 5 terpenes. In addition, 3-methylbutanal and α-himachalene were identified as common components in the three flowers. In addition, the sensory characteristics of the three flower flavor components were obtained in the ArochemBase database and their respective flavor wheels were plotted as shown in Figure 2.

Table 1.
The types, relative content, and sensory description of aroma components in the flower bud of PGF, PQF, and PNF based on the RI on two columns (MXT-5 and MXT-1701) via fast GC e-nose.
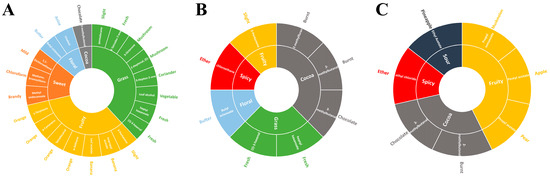
Figure 2.
Flavor wheel of the flower buds of (A) PNF, (B) PQF, and (C) PGF based on the fast GC e-nose.
The scent characteristics of the three flowers were roughly divided into four types, namely grass, fruit, sweet, flower, and cocoa. PNF had a strong fruity and grassy flavor (Figure 2A). Among the detected aroma components from PNF, seven and eight components were divided into the perception category of fruity flavor and the perception category of grassy flavor, respectively. Fruit aroma components comprised 3-pentanone, leaf acetate, γ-terpinene, α-selinene, tetradecanal, etc.; among the seven fruit aroma components, four were further specific to sweet orange smell. The contents of (Z)-3-hexenal and pentadecane in grass flavor were higher, while the contents of (E)-2-heptenal and 3-octanone were synergically manifested as light mushroom odor. PGF and PQF had less sweetness and more cocoa flavor, and both had relatively high contents of chloroethane, a spicy flavor component (Figure 2B,C). Therefore, PNF tasted better when used as a flower tea than PQF and PGF.
2.2. Qualitative Analysis of the VOCs by HS-GC-IMS
HS-GC-IMS as an emerging technique for gas analysis is widely used in the food, medical, and environmental fields because of its high efficiency, non-destructive nature of the sample, fast detection speed, and high information content [19]. In order to achieve the rapid identification of PGF, PQF, and PNF, the VOCs of the three flowers were analyzed via HS-GC-IMS as an untargeted analytical strategy in the present study. The VOCs were identified via Rt and Dt using GC × IMS Library Search. The information of the samples analyzed via HS-GC-IMS for the three types of flowers is shown in the form of topographic maps and fingerprints in Figure 3. A top view of the GC-IMS 3D-topographic plot in PGF, PQF, and PNF samples from different areas is shown in Figure 3A. It can be seen that most of the signals appeared in the retention time of 100–900 s and the drift time of 1.0–2.0 s. Each point in the topographic maps represents a VOC in the sample, and the color shades of the point indicate the relative content of the compound; the redder the color, the higher the relative content, and the bluer the color, the lower the relative content. In Figure 3A, the three flowers differed in composition, and even for the components shared by the three flowers, the relative contents were different. In total, 68 VOCs were identified in the three flowers, including 42 from PGF, 48 from PQF, and 58 from PNF.
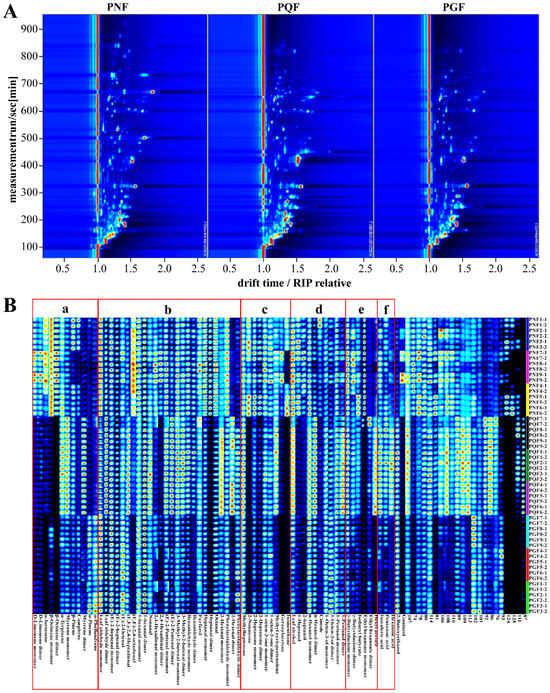
Figure 3.
(A) Two-dimensional chromatogram results of volatile fractional compositions in the flower bud of PGF, PQF, and PNF. (B) The VOC fingerprint of the flower buds of PGF, PQF, and PNF.
To further facilitate a clearer comparison of the VOCs among the three flowers, the chemical composition of the samples was classified and illustrated as fingerprints. The differences of the three flowers in terms of constituent species and content are visually demonstrated in Figure 3B. A total of 68 VOCs were identified for the three flowers, including 12 terpenes, 26 aldehydes, 9 ketones, 10 alcohols, 6 esters, and 3 acids (Table 2), which corresponded to the 6 regions of a, b, c, d, e, and f in Figure 3B, respectively. In addition, there were 22 detected constituents that had not yet been identified. PNF, PGF, and PQF were the most abundant in aldehyde components, with (E,E)-2,4-octadienal, 2,4-hexadienal dimer, and heptanal dimer being the aldehydes specific to PNF in the three flowers, and 2-hexenal dimer being the aldehyde specific to PQF in the three flowers (Figure 3B-a). Terpenoids were the second most abundant components in the three flowers, and their composition was more different. d-limonene monomer, d-limonene dimer, α-farnesene, β-ocimene monomer, and β-ocimene dimer were the unique terpenoid components of PNF in the three kinds of flowers. Limonene, with some anti-inflammatory and antioxidant effects, has long been used in the food and cosmetics industry. α-farnesene has a strong floral aroma and is often used as an additive in daily chemical products. Myrcene dimer is a unique terpenoid component of PQF in the three flowers. α-pinene and α-phellandrene were the specific terpenoids of PGF in the three flowers (Figure 3B-b). The abundance of ketone constituents was higher in PNF than in PGF and PQF. We found that 2-Nonanone, geraniolactone and isomenthone could be distinguished from the other two flower species as characteristic components of PNF. Methyl cyclopentenolone was higher in PQF (Figure 3B-c). The alcohol composition of the three flowers was more similar, with 1-heptanol and 2-heptanol being higher in PNF, and 1-pentanol monomer and 1-pentanol dimer being higher in PQF (Figure 3B-d). Esters were relatively few in PGF, and ethyl hexanoate monomer and hexyl acetate can be used as the signature ester components of PNF and PQF, respectively (Figure 3B-e). Acids were predominantly found in PQF, such as isovaleric acid, pentanoic acid, and hexanoic acid (Figure 3B-f). In addition, there were many components of PNF and PQF with high content that have not yet been identified.
Table 2.
Identification of the VOCs in the flower buds of PGF, PQF, and PNF via HS-GC-IMS.
2.3. Qualitative VOCs via HS-SPME-GC-MS
HS-SPME-GC-MS is widely used for VOC detection because of its simplicity, rapidity, and specificity [20]. Moreover, the introduction of solid-phase microextraction (SPME) into GC-MS greatly improves the detection speed and realizes the non-destructive operation of samples [12]. In contrast to the detection of small molecules via GC e-nose and HS-GC-IMS, HS-SPME-GC-MS was able to control the quality of food and medicinal materials from the perspective of large molecules [10]. In this study, the VOCs of three flowers were detected via HS-SPME-GC-MS.
The key parameters were optimized before the experiments formally started. The univariate method was used to select the SPME conditions for each factor individually: three fiber coatings were tested, including polydimethylsiloxane 100 mm phase thickness (PDMS), polydimethylsiloxane/divinylbenzene 65 mm phase thickness (PDMS/DVB), and polydimet-hylsiloxane/carboxen/divinyl benzene 50/30 mm phase thickness (PDMS/CAR/DVB). After filtering the miscellaneous peaks, we compared the number of peaks under different conditions. The number of PDMS peaks was the least and the number of PDMS/DVB peaks was the most. In addition, the incubation temperatures (50 °C, 60 °C, 70 °C) and incubation times (5 min, 10 min, 15 min) were optimized. An analysis of chromatograms showed that the peak area and number of peaks decreased significantly with increasing incubation temperature. Both peak area and peak number were optimal when the incubation temperature was 50 °C. The incubation time was positively correlated with the peak areas of the components, and when the incubation time was 5 min, the peak areas of most of the components were at a suitable level for measurement. Finally, the extraction time was optimized. The samples were extracted for 10 min, 20 min, and 30 min then contrasted with the TIC. A high peak area was achieved for all components at an extraction time of 10 min and the number of peaks did not change significantly with increasing extraction time. Thus, 10 min of extraction time was chosen as the most suitable. The resulted optimal extraction parameters were determined as follows, and the PDMS/DVB coating was chosen and incubated for 5 min at 50 °C, followed by 10 min in an extract.
The TICs of the three different flower samples are shown in Figure 4. The three flowers were overall somewhat similar, but there were some differences in the type and content of VOCs. Qualitatively, a total of 78 VOCs were identified from PQF, PGF, and PNF according to the retention index and matching value, as well as comparison with the literature reference (Table 3), with 66 in PGF, 63 in PQF, and 69 in PNF, and 55 common components among the three. Eleven compounds passed the standard substance verification and are highlighted as numbers in the TIC. All the identified components included 38 terpenes, 12 alcohols, 9 esters, 7 aldehydes, 6 ketones, 3 acids, and 3 others. The results show that the major VOCs in the PQF and PGF samples are relatively similar, mainly including β-elemene, santalene, α-bergamotene, (E)-β-farnesene, bicyclosesquiphellandrene, β-selinene, and eremophilene, whereas the major VOCs in the PNF are different and consist mainly of octanal, (−)-isoledene, β-elemene, β-caryophyllene, (−)-aristolene, (E)-β-farnesene, valerena-4, 7(11)-diene, β-santalene, germacrene D, bicyclosesquiphellandrene, (−)-α-muurolene, (+)-δ-cadinene, and spathulenol. Spathulenol and β-caryophyllene are important active components of the three species present only in PGF and their relative content was higher than 5%; both exhibit high antioxidant activity and antiproliferative effects, in addition to the anti-inflammatory as well as anti-mycobacterial activity of spathulenol [21,22].
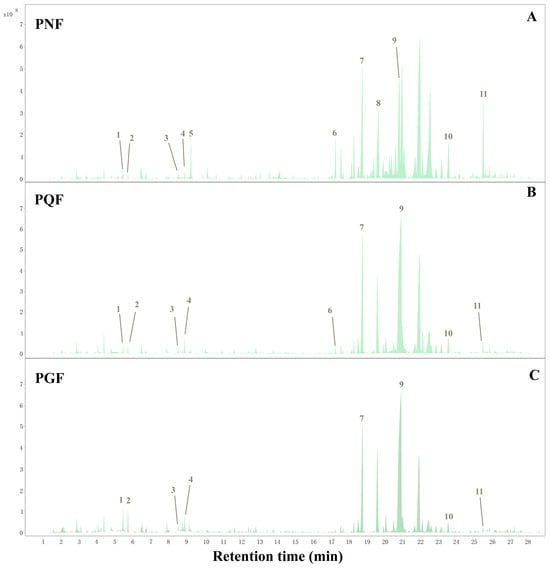
Figure 4.
The total ion chromatogram (TLC) of the flower buds of (A) PNF, (B) PQF, and (C) PGF based on HS-SPME-GC-MS.
Table 3.
Volatile chemical components identified in the flower buds of PGF, PQF, and PNF via HS-SPME-GC-MS.
2.4. Comprehensive Analysis
In order to determine whether fast GC e-nose, HS-GC-IMS, and HS-SPME-GC-MS could distinguish between PGF, PQF, and PNF, the three sets of data collected were statistically analyzed by peak area. Unsupervised PCA was a common method of dimensionality reduction of image processing and the data were visualized [23,24]. It reduced the dimensionality of the data by projecting its variables onto the main factors, thereby providing a visual representation of group clustering trends. Therefore, PCA methods were used for data processing to analyze the differences in chemical composition between all samples. A, B, and C in Figure 5 represent the results of fast GC e-nose analysis, HS-GC-IMS analysis, and HS-SPME-GC-MS analysis, respectively. R2X and Q2 could evaluate the explanatory and predictive abilities of the models; the closer R2X and Q2 were to 1, the better the fitness of the model was [25]. The model parameters of fast GC e-nose analysis (R2X = 0.922 and Q2 = 0.780) show that 92.2% and 78.0% of the total variation could be explained and predicted, respectively. The model parameters of HS-GC-IMS analysis (R2X = 0.937 and Q2 = 0.840) indicate that 93.7% and 84.0% of the total variation could be explained and predicted, respectively. The model parameters of HS-SPME-GC-MS analysis (R2X = 0.834 and Q2 = 0.762) indicate that 83.4% and 76.2% of the total variation could be explained and predicted, respectively. The three analysis methods could cluster the three flowers into three categories, which indicates that there were significant differences in the volatile components among the three types of flowers.
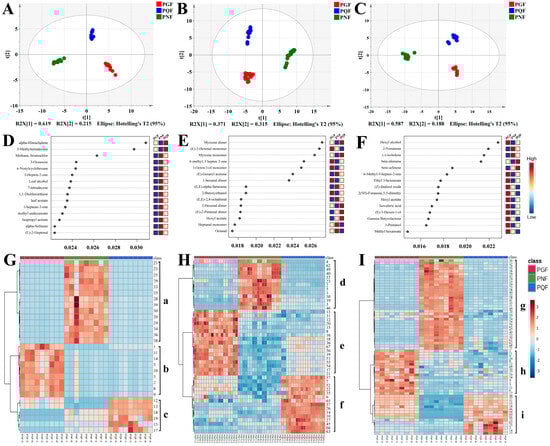
Figure 5.
(A–C): PCA analysis via fast GC e-nose, HS-GC-IMS, and HS-SPME-GC-MS, respectively; (D–F): RFA via fast GC e-nose, HS-GC-IMS, and HS-SPME-GC-MS, respectively; (G–I): the heatmap clustering of the VOCs via fast GC e-nose, HS-GC-IMS, and HS-SPME-GC-MS, respectively (The codes of the compounds correspond to those in Table 3).
The random forest algorithm (RFA) is a powerful and flexible integrated learning algorithm that relies on the result of random combinations of multiple decision tree predictions to improve the accuracy and stability of the model, and it is suitable for regression and classification [26]. The classification trees were set as 2000 in this study. During tree building, one-third of the samples were used as training data and the remaining samples as test samples to obtain an unbiased assessment of the out-of-bag (OOB) error. After several trees, the cumulative OOB error rates decreased to zero in the three types of flowers. Figure 5D–F shows the significant features in the random forest classification model. Fast GC e-nose analysis selected characteristic components with an RFA score value higher than 0.028 for analysis (Figure 5D), and 5-methyltetradecane and α-himachalene were the characteristic components of PQF. The characteristic components with an RFA score value higher than 0.026 were selected for analysis in HS-GC-IMS analysis (Figure 5E); the (E)-2-hexenal monomer was most specific in PGF, and the myrcene monomer and myrcene dimer were the characteristic components of PQF. The characteristic components with an RFA score value higher than 0.020 were selected for analysis in HS-SPME-GC-MS analysis (Figure 5F): hexyl alcohol was most specific in PGF; β-elemene was the characteristic components of PQF; and 2-nonanone and (−)-isoledene were the characteristic components of PNF. Therefore, nine VOCs (5-methyltetradecane, α-himachalene, (E)-2-hexenal monomer, myrcene monomer, myrcene dimer, hexyl alcohol, β-elemene, 2-nonanone, and (−)-isoledene) were selected as the potential chemical markers based on a model of RF.
To further visualize the differences in VOC matter content among the three types of flowers, MetaboAnalyst 5.0 was used for heat map hierarchical clustering analysis. With the relative content of components identified via fast GC e-nose, HS-GC-IMS, and HS-SPME-GC-MS as variables, each variable was normalized, and the three kinds of flowers were clustered into heatmaps by using Euclidean distance for similarity measure and Ward clustering algorithm. As shown in Figure 5G–I, the components of class a, d and g were more abundant in PNF, the components of class b, e and h were more abundant in PGF, and the components of class c, f, and i were more abundant in PQF. In conclusion, the thermograms formed by clustering the analyzed data from all three instruments were able to demonstrate the differences in the content of the three flowers well.
3. Materials and Methods
3.1. Sample Source and Preparation
A total of 27 samples belonging to three species, PGF, PQF, and PNF, were purchased in three batches of each species from three different origins. PNF was collected from Wenshan (PNF-1, PNF-2, PNF-3), Qiubei (PNF-4, PNF-5, PNF-6), and Yanshan (PNF-7, PNF-8, PNF-9) all in Yunnan; PGF and PQF were collected from Fusong (PGF-1, PGF-2, PGF-3, PQF-1, PQF-2, PQF-3) and Baishan (PGF-4, PGF-5, PGF-6, PQF-4, PQF-5, PQF-6) all in Jilin, and PGF-7, PGF-8, PGF-9, PQF-7, PQF-8, PQF-9 were from Xinbin, Liaoning Province, China. All samples in the experiments were authenticated by Professor Lijuan Zhang from Tianjin University of Traditional Chinese Medicine. Detailed information about the samples is listed in Supplementary Table S1. The specimens were deposited in the College of Pharmaceutical Engineering of Traditional Chinese Medicine, Tianjin University of Traditional Chinese Medicine, China. All samples were crushed with a grinder and sieved through a 40-mesh sieve. For the subsequent analysis, the powdered sample was immediately stored in an airtight bag in a cool dark, dry room at 20 °C.
3.2. Chemicals and Reagents
N-alkane C6-C16 standard (Lot: 563121) for fast GC e-nose was purchased from RESTEK (Bellefonte, PA, USA). N-ketone C4-C9 standard mix for HS-GC-IMS was purchased from Sinopharm Chemical Reagent Beijing Co., Ltd. (Beijing, China). N-alkane C8-C20 standard for HS-SPME-GC-MS was purchased from Sigma-Aldrich Chemical Co., Ltd. (St. Louis, MO, USA). Reference compounds were purchased for identification. Spathulenol (CAS: 6750-60-3, 93%), δ-elemene (CAS: 20307-84-0, 95%), β-elemene (CAS: 515-13-9, 98%), (E)-β-farnesene (CAS: 18794-84-8, 80%), 1-octen-3-ol (CAS: 3391-86-4, 98%), (E)-3-hexen-1-ol (CAS: 928-97-2, 97%), β-caryophyllene (CAS: 87-44-5, 98%), myrcene (CAS: 123-35-3, 98%), (+)-δ-cadinene (CAS: 483-76-1, 95%) and hexyl alcohol (CAS: 111-27-3, 99%) were bought from Shanghai Yuanye Bio-Technology Co., Ltd. (Shanghai, China). Octanal (CAS: 124-13-0, 97%) was provided by Aladdin Biochemical Technology Co., Ltd. (Shanghai, China).
3.3. Fast GC E-Nose Analysis Conditions
The Heracles NEO e-nose (Alpha M.O.S., Toulouse, France) combines the functionality of gas chromatography technology with the pattern recognition technology of an e-nose and is equipped with a headspace autosampler (PAL-RSI, Alpha m.o.s., Toulouse, France) and two different polarity columns (MXT-5: a nonpolar column, 10 m × 0.18 mm, 0.4 µm, with 14% cyanobenzenyl and 86% methylpolysiloxane; MXT-1701: a low-polar column, 10 m × 0.18 mm, 0.4 µm, containing 5% diphenyl, 95% methyl polysiloxane). These two parallel metal capillary ultra-fast columns of different polarities were combined with a flame ionization detector (Fid) and a built-in pre-concentration trap system to dramatically increase detection sensitivity.
Before analysis, 0.5 g of dried powder was added to a 20 mL specialized vial for headspace extraction. To allow the odor to saturate the headspace bottles, the incubation temperature was set to 70 °C for 20 min, with a stirring speed of 500 rpm. At a constant inlet temperature (200 °C) and inlet pressure (10 kPa), 5000 µL of headspace phase was injected into the gas chromatography port using an autosampler at a speed of 125 µL/s. The injector temperature was 200 °C. The analytes were collected in a trap within 229 s from the initial temperature 50 °C to the final 240 °C. The column temperature was initially of 50 °C, then increased to 72 °C at a rate of 0.3 °C per second, then increased to 140 °C at a rate of 3 °C per second, then increased to 190 °C at a rate of 0.7 °C per second, then increased to 200 °C at a rate of 0.3 °C per second, and finally increased to 250 °C at 3 °C per second, remaining at 250 °C for another 10 s. The two FIDs temperatures and gains were set to 260 °C and 12, respectively. Hydrogen was used as the carrier gas at a constant flow of 1.0 mL/min. Each sample was repeatedly measured three times, following the above conditions. The N-alkane C6-C16 standard was used for calibration to convert the retention time (RT) into the retention index (RI) of each compound as external references.
3.4. HS-GC-IMS Analysis Conditions
The VOCs in the three flowers were analyzed using the HS-GC-IMS system (FlavourSpecÒ, Gesellschaft fur Analytische Sensorsysteme mbH, Dortmund, Germany), which was equipped with an autosampler unit (CTC Analytics AG, Zwingen, Switzerland) and an MXT-5 capillary column (15 m × 0.53 mm ID, 1 µm, CS-Chromatographie Service GmbH, Langerwehe, Germany) [10]. In brief, a 0.5 g powder sample was accurately placed into a 20 mL headspace glass sampling bottle and incubated at 80 °C for 20 min at 500 rpm. After incubation, the headspace samples (500 µL) were automatically injected into the syringe (60 °C) in the splitless mode and then driven into a capillary column of 80 °C isothermal conditions through nitrogen of 99.999% purity; its flow rate was first set at 2 mL/min for 2 min, then increased to 4 mL/min with 7 min, increased to 10 mL/min over 10 min, increased to 100 mL/min over 20 min, increased to 150 mL/min over 30 min, and then was maintained until 45 min. The pre-separated compounds were driven into an ionization chamber and ionized by a 3H ionization source with 300 MBq activity in the positive ion mode. The resulting ions were driven to a drift tube (9.8 cm in length), which was operated on a constant temperature (45 °C) and voltage (5 kV). The flow rate of the drift gas (nitrogen gas) was set at 150 mL/min. Each sample was repeatedly measured three times, following the above conditions. The N-ketones C4-C9 standard was used to calculate the RI and drift time (Dt) of each compound as external references.
3.5. HS-SPME-GC-MS Analysis Conditions
For HS-SPME-GC-MS, we accomplished headspace autosampling by installing the SPME fiber (Supelco, Bellefonte, PA, UAS) on a MultiPurpose sampler (Gerstel, Mülheim, Germany) in conjunction with a GC autosampling system equipped with an Agilent 7890B-7000D gas chromatography and mass spectrometry detector (Agilent, Santa Clara, CA, USA; Thermo Fisher, Waltham, MA, USA). The GC was fitted with a HP-5MS elastic quartz capillary column (30 m × 0.25 mm × 0.25 µm, 19091S-433, J&W Scientific, Folsom, CA, USA) [27]. Firstly, 0.1 g of sample was weighed accurately into a 20 mL headspace glass sampling bottle (Zhejiang HAMAG Technology, Ningbo, China), then the headspace bottle was sealed with a screw cap with a silicon gasket. The sample was incubated at 50 °C incubation temperature for 5 min and then the SPME needle was inserted into the headspace glass sampling bottle for extraction for 10 min. Subsequently, the SPME needle immediately plugged into the heated injection port at desorption for 5 min (250 °C, splitless mode). The flow rate of helium (>99.999%) as the carrier gas was 1 mL/min. The GC column temperature was programmed as follows: initially programmed at 40 °C for 2 min, then changed at a rate of 16 °C per minute to 60 °C, at a rate of 4 °C per minute to 99 °C, at a rate of 34 °C per minute to 133 °C, then rose to 134 °C at a rate of 0.5 °C per minute, then at a rate of 2 °C per minute to 134 °C, at a rate of 0.5 °C per minute to 136 °C, at a rate of 2 °C per minute to 141 °C; eventually, the temperature changed at a rate of 22 °C per minute to 240 °C. The GC total running time was 29 min. The MS was operated in electron ionization (EI) mode at an ionizing energy of 70 eV. The injection port and ion source temperature were set at 250 °C and 230 °C, respectively. The quadrupole temperature was 150 °C. The mass spectra (MS1 full scan mode) were scanned from 50 to 600 Da. All samples were prepared in duplicate for analysis. An N-alkane C8–C20 standard was used to calculate the RI of each compound as external references.
3.6. Data Analysis
The data acquisition and processing of fast GC e-nose was performed using Alpha software 2021 (version 7.2.8, Alpha Software Co., Burlington, MA, USA). The VOCs detected via fast GC e-nose were identified based on the Kovats retention index compared with the AroChemBase professional flavor database qualitatively. The extraction and analysis of the HS-GC-IMS data were performed with a Laboratory Analytical Viewer (LAV) (version 2.2.1, G.A.S, Dortmund, Germany). VOCs detected via HS-GC-IMS were identified based on the calculated RI and drift time (drift time, Dt) compared with the database of IMS, and the fingerprint was established using a gallery plot. VOCs detected via HS-SPME-GC-MS were identified from the standard NIST17 library (matching degree > 750, RI) and reference compounds [27]. SIMCA14.1 was used to build the model of principal component analysis (PCA). A heat map and random forest (RF) model were performed using the online website MetaboAnalyst 5.0 for data processing.
4. Conclusions
In summary, this research constructed a method for identifying and characterizing PQF, PGF, and PNF based on fast GC e-nose, HS-GC-IMS, and HS-SPME-GC-MS combined with multivariate statistics. The fingerprint, flavor wheel, and multivariate statistical results could effectively visualize the characteristics of the three flowers. The results indicate that the three flowers could be accurately and objectively distinguished without relying on appearance features. This method provides valuable technology for the authenticity and quality control of food products and medicinal materials with flavor characteristics. Fast GC e-nose and HS-GC-IMS provided an objective method for odor identification due to their fast and easy-to-use advantages. HS-SPME-GC-MS revealed the differences in chemical characteristics of VOCs among the three flowers (PQF, PGF, and PNF), providing scientific reference for the development of their health flower tea. Meanwhile, nine components (5-methyltetradecane, α-himachalene, (E)-2-hexenal monomer, myrcene monomer, myrcene dimer, hexyl alcohol, β-elemene, 2-nonanone, and (−)-isoledene) were identified through multivariate statistical analysis as chemical markers for distinguishing these three species. The proposed method is fast, simple, environmentally friendly, and could successfully distinguish PQF, PGF, and PNF using scent.
Supplementary Materials
The following supporting information can be downloaded at: https://www.mdpi.com/article/10.3390/molecules29030602/s1, Table S1: Details of samples of the flower bud of P. ginseng (PGF), P. quinquefolius; Figure S1: (A) The total ion chromatogram (TIC) of the flower bud of PGF, PQF, and PNF aroma compounds identified via fast GC e-nose (MXT-5-FID1 and MXT-1701-FID2); Figure S2: Reference compounds spectrogram.
Author Contributions
Writing—original draft, writing—review and editing, software, methodology, and data curation, Y.Y. and J.Y.; writing—original draft, writing—review and editing, validation, software, methodology, data curation, J.X.; writing—original draft, S.W.; software and methodology, H.D.; methodology, L.H. and S.B.; formal analysis, W.S.; formal analysis, Y.Z.; conceptualization, X.S.; writing—review and editing, conceptualization and supervision, H.Y.; writing—review and editing, Z.L. All authors have read and agreed to the published version of the manuscript.
Funding
This work was financially supported by the Science and Technology Program of Tianjin (No: 22ZYJDSS00100) for H.Y.
Institutional Review Board Statement
Not applicable.
Informed Consent Statement
Not applicable.
Data Availability Statement
Data are contained within the article and Supplementary Materials.
Acknowledgments
The authors would like to thank the support from the Innovation Team and Talents Cultivation Program of National Administration of Traditional Chinese Medicine (No: ZYYCXTD-D-202002) and the Science and Technology Project of Haihe Laboratory of Modern Chinese Medicine (No: 22HHZYSS00003).
Conflicts of Interest
Authors Wen Song and Ying Zhang were employed by the company Tianjin HongRenTang Pharmaceutical Co., Ltd. The remaining authors declare that the research was conducted in the absence of any commercial or financial relationships that could be construed as a potential conflict of interest.
References
- Wang, T.; Guo, R.; Zhou, G.; Zhou, X.; Kou, Z.; Sui, F.; Li, C.; Tang, L.; Wang, Z. Traditional uses, botany, phytochemistry, pharmacology and toxicology of Panax notoginseng (Burk.) FH Chen: A review. J. Ethnopharmacol. 2016, 188, 234–258. [Google Scholar] [CrossRef]
- Li, W.; Duan, Y.; Yan, X.; Liu, X.; Fan, M.; Wang, Z.J.B. A mini-review on pharmacological effects of ginsenoside Rb3, a marked saponin from Panax genus. Biocell 2022, 46, 1417. [Google Scholar] [CrossRef]
- Qiu, S.; Yang, W.-Z.; Yao, C.-L.; Qiu, Z.-D.; Shi, X.-J.; Zhang, J.-X.; Hou, J.-J.; Wang, Q.-R.; Wu, W.-Y.; Guo, D.-A. Nontargeted metabolomic analysis and “commercial-homophyletic” comparison-induced biomarkers verification for the systematic chemical differentiation of five different parts of Panax ginseng. J. Chromatogr. A 2016, 1453, 78–87. [Google Scholar] [CrossRef] [PubMed]
- Yang, W.-Z.; Bo, T.; Ji, S.; Qiao, X.; Guo, D.-A.; Ye, M. Rapid chemical profiling of saponins in the flower buds of Panax notoginseng by integrating MCI gel column chromatography and liquid chromatography/mass spectrometry analysis. Food Chem. 2013, 139, 762–769. [Google Scholar] [CrossRef]
- Nakamura, S.; Sugimoto, S.; Matsuda, H.; Yoshikawa, M. Medicinal flowers. XVII. New dammarane-type triterpene glycosides from flower buds of American ginseng, Panax quinquefolium L. Chem. Pharm. Bull. 2007, 55, 1342–1348. [Google Scholar] [CrossRef] [PubMed]
- Jee, H.-S.; Chang, K.-H.; Park, S.-H.; Kim, K.-T.; Paik, H.-D. Morphological characterization, chemical components, and biofunctional activities of Panax ginseng, Panax quinquefolium, and Panax notoginseng roots: A comparative study. Food Rev. Int. 2014, 30, 91–111. [Google Scholar] [CrossRef]
- Vadivel, V.; Ravichandran, N.; Rajalakshmi, P.; Brindha, P.; Gopal, A.; Kumaravelu, C. Microscopic, phytochemical, HPTLC, GC–MS and NIRS methods to differentiate herbal adulterants: Pepper and papaya seeds. J. Herb. Med. 2018, 11, 36–45. [Google Scholar] [CrossRef]
- Zhao, Z.; Liang, Z.; Ping, G.J. Macroscopic identification of Chinese medicinal materials: Traditional experiences and modern understanding. J. Ethnopharmacol. 2011, 134, 556–564. [Google Scholar] [CrossRef] [PubMed]
- Cai, Z.; Lee, F.; Wang, X.; Yu, W.J. A capsule review of recent studies on the application of mass spectrometry in the analysis of Chinese medicinal herbs. J. Mass Spectrom. 2002, 37, 1013–1024. [Google Scholar] [CrossRef]
- Xie, J.; Li, X.; Li, W.; Ding, H.; Yin, J.; Bie, S.; Li, F.; Tian, C.; Han, L.; Yang, W. Characterization of the key volatile organic components of different parts of fresh and dried perilla frutescens based on headspace-gas chromatography-ion mobility spectrometry and headspace solid phase microextraction-gas chromatography-mass spectrometry. Arab. J. Chem. 2023, 16, 104867. [Google Scholar] [CrossRef]
- Roy, M.; Yadav, B.K. Electronic nose for detection of food adulteration: A review. J. Food Sci. Technol. 2022, 59, 846–858. [Google Scholar] [CrossRef]
- Zanella, D.; Anderson, H.E.; Selby, T.; Magnuson, R.H., II; Liden, T.; Schug, K.A. Comparison of headspace solid-phase microextraction high capacity fiber coatings based on dual mass spectrometric and broadband vacuum ultraviolet absorption detection for untargeted analysis of beer volatiles using gas chromatography. Anal. Chim. Acta 2021, 1141, 91–99. [Google Scholar] [CrossRef]
- Zhou, H.; Luo, D.; GholamHosseini, H.; Li, Z.; He, J. Identification of chinese herbal medicines with electronic nose technology: Applications and challenges. Sensors 2017, 17, 1073. [Google Scholar] [CrossRef] [PubMed]
- He, W.; Ren, F.; Wang, Y.; Gao, X.; Wang, X.; Dai, X.; Song, J. Application of GC-IMS in Detection of Food Flavor Substances; IOP Conference Series: Earth and Environmental Science; IOP Publishing: Bristol, UK, 2020; p. 012030. [Google Scholar]
- Yin, J.; Wu, M.; Lin, R.; Li, X.; Ding, H.; Han, L.; Yang, W.; Song, X.; Li, W.; Qu, H. Application and development trends of gas chromatography–ion mobility spectrometry for traditional Chinese medicine, clinical, food and environmental analysis. Microchem. J. 2021, 168, 106527. [Google Scholar] [CrossRef]
- Yang, Y.; Qian, M.C.; Deng, Y.; Yuan, H.; Jiang, Y. Insight into aroma dynamic changes during the whole manufacturing process of chestnut-like aroma green tea by combining GC-E-Nose, GC-IMS, and GC× GC-TOFMS. Food Chem. 2022, 387, 132813. [Google Scholar] [CrossRef] [PubMed]
- Heema, R.; Gnanalakshmi, K.S. An overview of applications of electronic nose and electronic tongue in food and dairy industry. Agric. Rev. 2022, 43, 327–333. [Google Scholar] [CrossRef]
- Zhang, J.-B.; Fei, C.-H.; Zhang, W.; Qin, Y.-W.; Li, Y.; Wang, B.; Jin, S.-J.; Su, L.-L.; Mao, C.-Q.; Ji, D.; et al. Rapid identification for the species discrimination of Curcumae Rhizoma using spectrophotometry and flash gas chromatography e-nose combined with chemometrics. Chin. J. Anal. Chem. 2022, 50, 100167. [Google Scholar] [CrossRef]
- Gu, S.; Zhang, J.; Wang, J.; Wang, X.; Du, D. Recent development of HS-GC-IMS technology in rapid and non-destructive detection of quality and contamination in agri-food products. TrAC Trends Anal. Chem. 2021, 144, 116435. [Google Scholar] [CrossRef]
- Pati, S.; Tufariello, M.; Crupi, P.; Coletta, A.; Grieco, F.; Losito, I. Quantification of volatile compounds in wines by HS-SPME-GC/MS: Critical issues and use of multivariate statistics in method optimization. Processes 2021, 9, 662. [Google Scholar] [CrossRef]
- Do Nascimento, K.F.; Moreira, F.M.F.; Santos, J.A.; Kassuya, C.A.L.; Croda, J.H.R.; Cardoso, C.A.L.; do Carmo Vieira, M.; Ruiz, A.L.T.G.; Foglio, M.A.; de Carvalho, J.E. Antioxidant, anti-inflammatory, antiproliferative and antimycobacterial activities of the essential oil of Psidium guineense Sw. and spathulenol. J. Ethnopharmacol. 2018, 210, 351–358. [Google Scholar] [CrossRef]
- Dahham, S.S.; Tabana, Y.M.; Iqbal, M.A.; Ahamed, M.B.; Ezzat, M.O.; Majid, A.S.; Majid, A.M. The anticancer, antioxidant and antimicrobial properties of the sesquiterpene β-caryophyllene from the essential oil of Aquilaria crassna. Molecules 2015, 20, 11808–11829. [Google Scholar] [CrossRef] [PubMed]
- Hasan, B.M.S.; Abdulazeez, A.M.; Mining, D. A review of principal component analysis algorithm for dimensionality reduction. J. Soft Comput. Data Min. 2021, 2, 20–30. [Google Scholar]
- Shooshtari, M.; Salehi, A. An electronic nose based on carbon nanotube-titanium dioxide hybrid nanostructures for detection and discrimination of volatile organic compounds. Sens. Actuators B Chem. 2022, 357, 131418. [Google Scholar] [CrossRef]
- Sun, L.; Wu, J.; Wang, K.; Liang, T.; Liu, Q.; Yan, J.; Yang, Y.; Qiao, K.; Ma, S.; Wang, D. Comparative Analysis of Acanthopanacis Cortex and Periplocae Cortex Using an Electronic Nose and Gas Chromatography–Mass Spectrometry Coupled with Multivariate Statistical Analysis. Molecules 2022, 27, 8964. [Google Scholar] [CrossRef]
- Breiman, L. Random forests. Mach. Learn. 2001, 45, 5–32. [Google Scholar] [CrossRef]
- Wu, X.; Li, W.; Li, C.; Yin, J.; Wu, T.; Zhang, M.; Zhu, L.; Chen, H.; Zhang, X.; Bie, S. Discrimination and characterization of the volatile organic compounds of Acori tatarinowii rhizoma based on headspace-gas chromatography-ion mobility spectrometry and headspace solid phase microextraction-gas chromatography-mass spectrometry. Arab. J. Chem. 2022, 15, 104231. [Google Scholar] [CrossRef]
Disclaimer/Publisher’s Note: The statements, opinions and data contained in all publications are solely those of the individual author(s) and contributor(s) and not of MDPI and/or the editor(s). MDPI and/or the editor(s) disclaim responsibility for any injury to people or property resulting from any ideas, methods, instructions or products referred to in the content. |
© 2024 by the authors. Licensee MDPI, Basel, Switzerland. This article is an open access article distributed under the terms and conditions of the Creative Commons Attribution (CC BY) license (https://creativecommons.org/licenses/by/4.0/).