
Non-Invasive Monitoring of Corticosterone Levels in Mouse Urine with Liquid Chromatography-Electrospray Ionization-Tandem Mass Spectrometry

 ,
, 

Abstract
1. Introduction
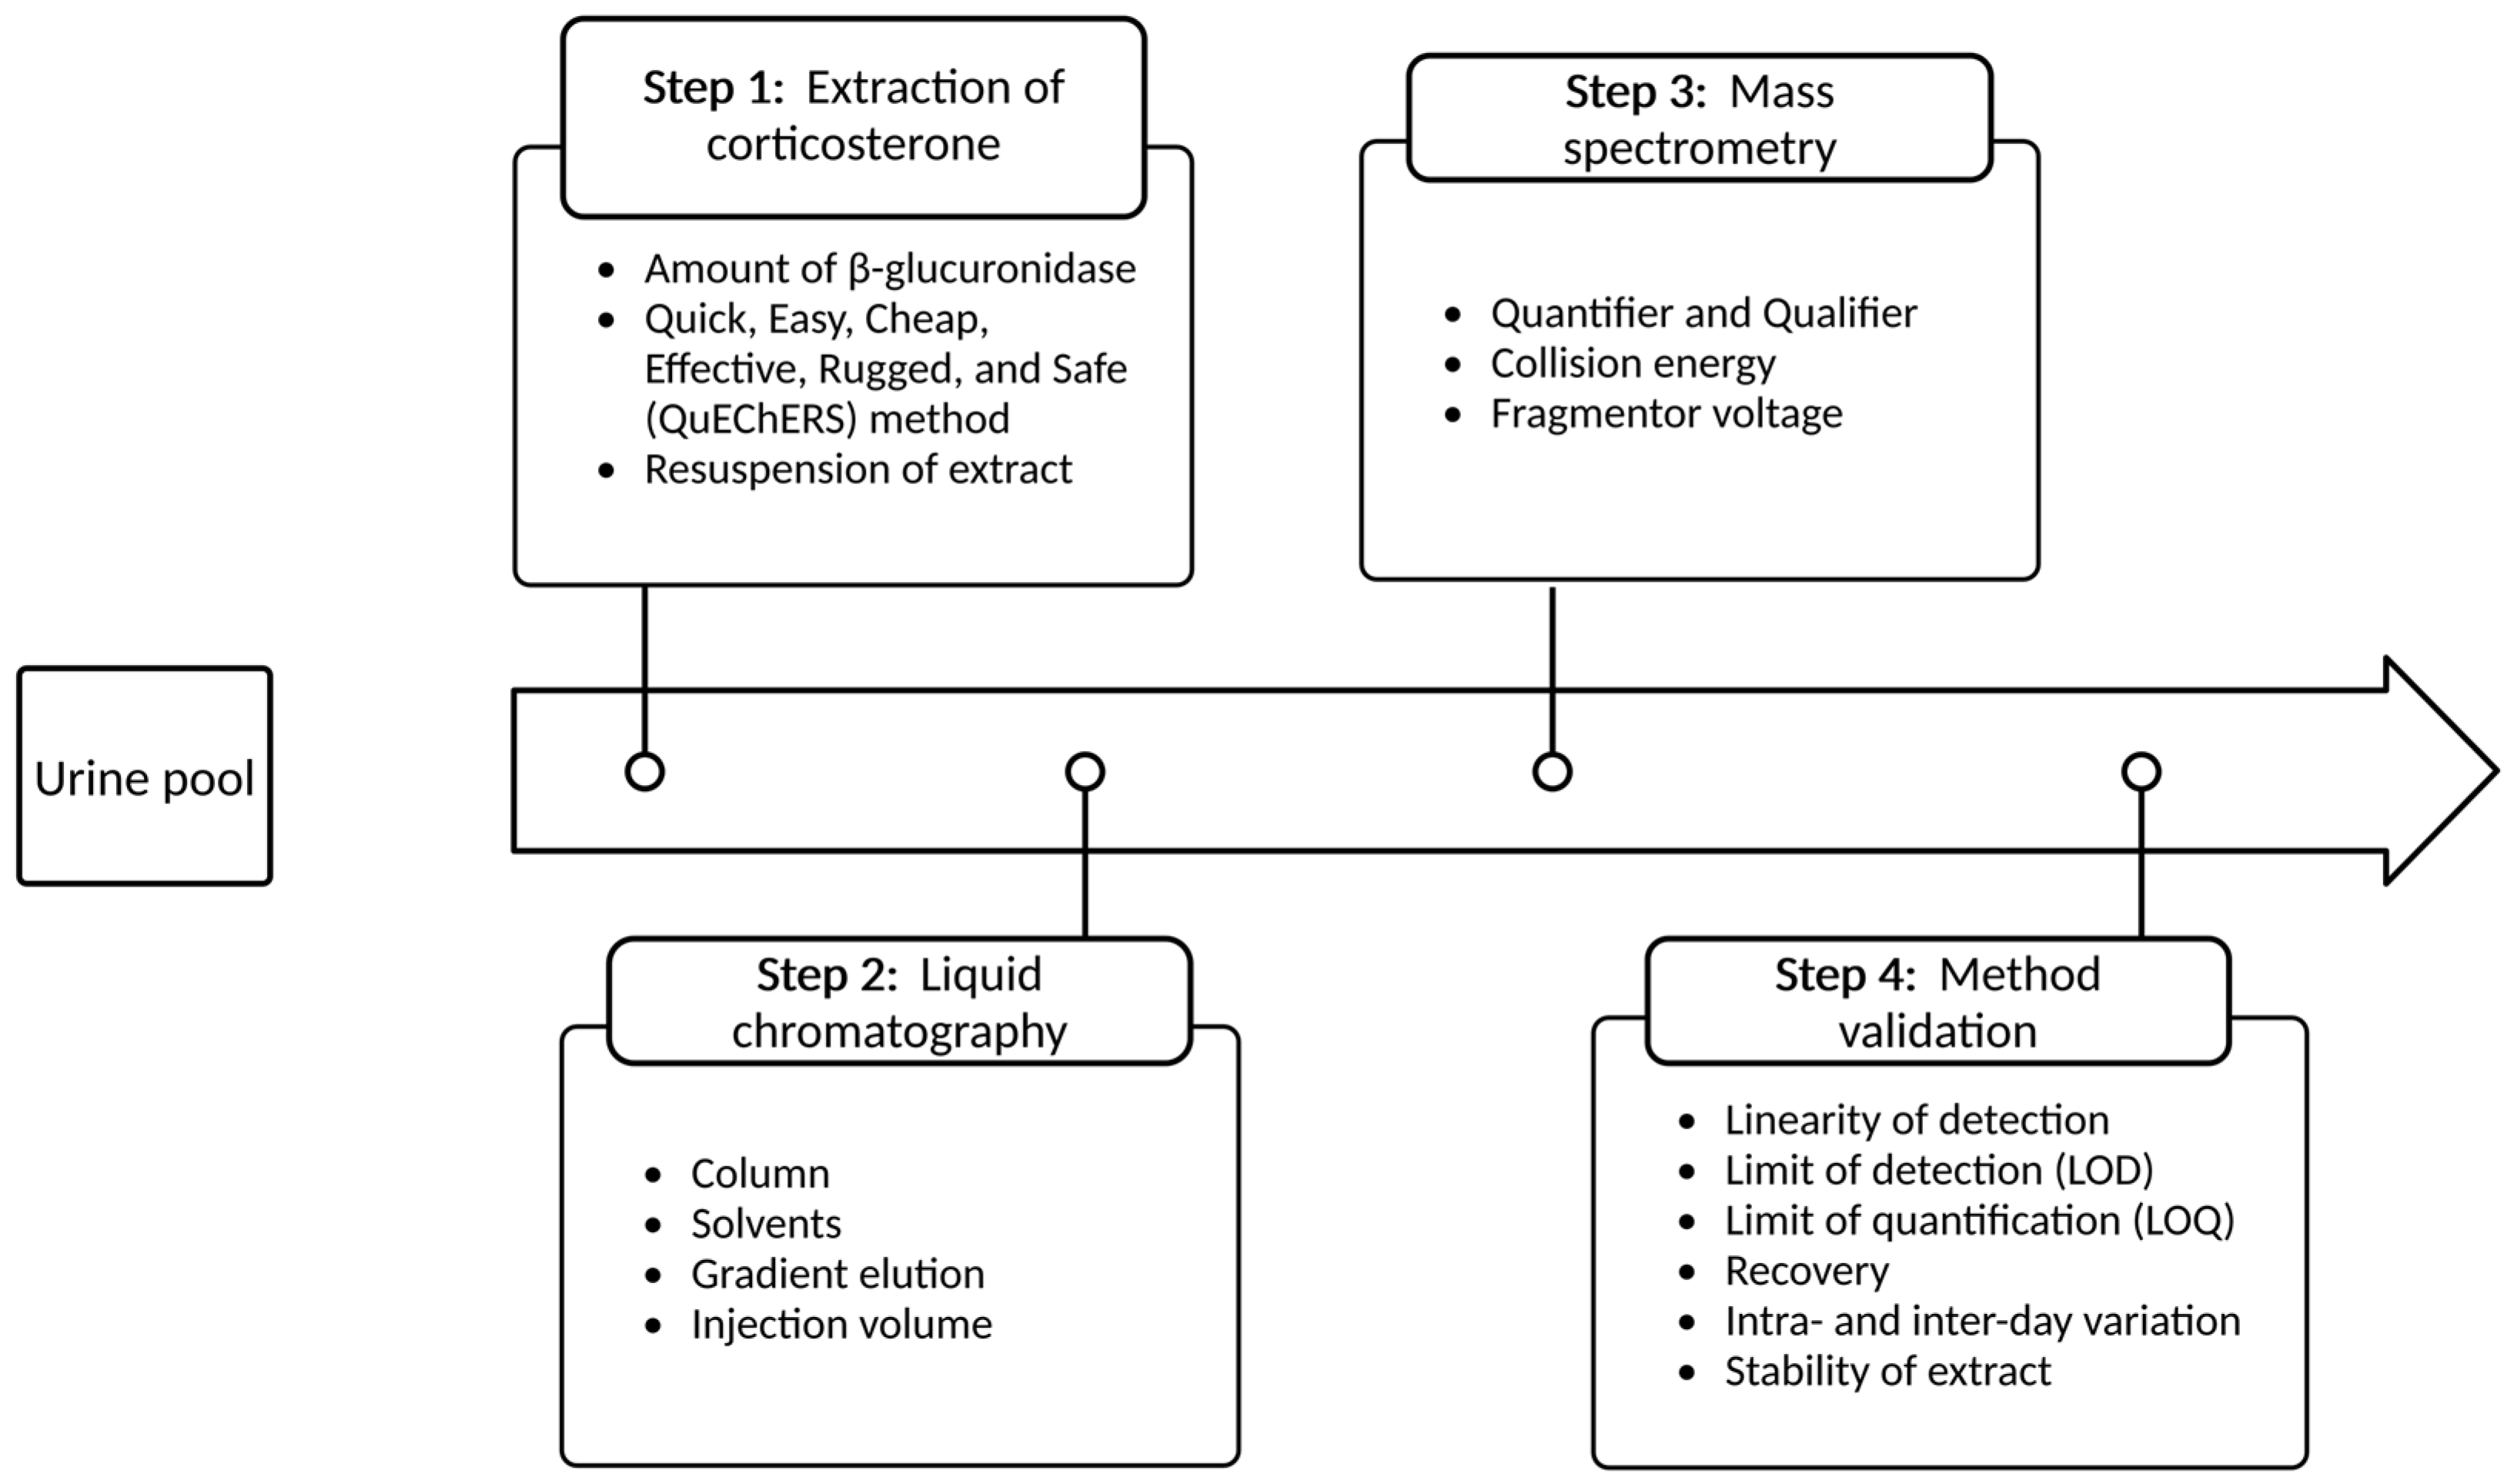
2. Results
2.1. Extraction of Corticosterone from Mouse Urine
2.1.1. Amount of β-Glucuronidase
2.1.2. Quick, Easy, Cheap, Effective, Rugged, and Safe (QuEChERS) Method
2.1.3. Resuspension of Extract
2.2. Development of a LC-MS/MS Method for Quantification of Corticosterone in Mouse Urine
2.2.1. Liquid Chromatography
2.2.2. Mass Spectrometry
2.3. Analytical Procedure Verification
2.3.1. Results of Linearity of Detection, LOD, LOQ
2.3.2. Results of Recovery, Intra- and Inter-Day Variation
2.3.3. Results of Accuracy and Matrix Effect
2.3.4. Results of Stability of Extracts
2.4. Corticosterone and Creatinine Concentrations in Urine of Stressed Mice
2.5. Water Intake and Urinary Excretion of Stressed Mice
3. Discussion
4. Materials and Methods
4.1. Materials and Standards
4.2. Stress Protocol
4.3. Urine Samples and Water Intake
4.4. Extraction Protocol for Corticosterone from Mouse Urine
4.5. Liquid Chromatography Tandem-Mass Spectrometry Analysis
4.6. Quantification of Corticosterone
4.7. Quantification of Creatinine
4.8. Method Validation
4.8.1. Linearity of Detection, LOD, LOQ
4.8.2. Recovery, Intra- and Inter-Day Variation
4.8.3. Accuracy and Matrix Effect
4.8.4. Stability of Extracts
4.9. Statistical Analyses
5. Conclusions
Author Contributions
Funding
Institutional Review Board Statement
Informed Consent Statement
Data Availability Statement
Acknowledgments
Conflicts of Interest
References
- Herman, J.P.; Figueiredo, H.; Mueller, N.K.; Ulrich-Lai, Y.; Ostrander, M.M.; Choi, D.C.; Cullinan, W.E. Central mechanisms of stress integration: Hierarchical circuitry controlling hypothalamo-pituitary-adrenocortical responsiveness. Front. Neuroendocrinol. 2003, 24, 151–180. [Google Scholar] [CrossRef] [PubMed]
- Kupczyk, D.; Bilski, R.; Kozakiewicz, M.; Studzińska, R.; Kędziora-Kornatowska, K.; Kosmalski, T.; Pedrycz-Wieczorska, A.; Głowacka, M. 11β-HSD as a new target in pharmacotherapy of metabolic diseases. Int. J. Mol. Sci. 2022, 23, 8984. [Google Scholar] [CrossRef] [PubMed]
- Joëls, M.; Karst, H.; Sarabdjitsingh, R.A. The stressed brain of humans and rodents. Acta Physiol. 2018, 223, e13066. [Google Scholar] [CrossRef] [PubMed]
- van der Mierden, S.; Leenaars, C.H.C.; Boyle, E.C.; Ripoli, F.L.; Gass, P.; Durst, M.; Goerlich-Jansson, V.C.; Jirkof, P.; Keubler, L.M.; Talbot, S.R.; et al. Measuring endogenous corticosterone in laboratory mice—A mapping review, meta-analysis, and open source database. ALTEX-Altern. Anim. Exp. 2021, 38, 111–122. [Google Scholar] [CrossRef]
- Sadok, I.; Ożga, K.; Klich, D.; Olech, W.; Krauze-Gryz, D.; Beliniak, A.; Łopucki, R. A validated LC-MS/MS method for simultaneous determination of key glucocorticoids in animal hair for applications in conservation biology. Sci. Rep. 2023, 13, 23089. [Google Scholar] [CrossRef]
- von Kortzfleisch, V.T.; Karp, N.A.; Palme, R.; Kaiser, S.; Sachser, N.; Richter, S.H. Improving reproducibility in animal research by splitting the study population into several ‘mini-experiments’. Sci. Rep. 2020, 10, 16579. [Google Scholar] [CrossRef]
- Frommlet, F. Improving reproducibility in animal research. Sci. Rep. 2020, 10, 19239. [Google Scholar] [CrossRef]
- Bayne, K. Environmental enrichment and mouse models: Current perspectives. Animal Model. Exp. Med. 2018, 1, 82–90. [Google Scholar] [CrossRef]
- Statnick, A. Russell and Burch’s Principles of Humane Experimental Techniques. Available online: https://caat.jhsph.edu/the-principles-of-humane-experimental-technique/ (accessed on 6 November 2024).
- Rinwa, P.; Eriksson, M.; Cotgreave, I.; Bäckberg, M. 3R-Refinement principles: Elevating rodent well-being and research quality. Lab. Anim. Res. 2024, 40, 11. [Google Scholar] [CrossRef]
- Keubler, L.M.; Hoppe, N.; Potschka, H.; Talbot, S.R.; Vollmar, B.; Zechner, D.; Häger, C.; Bleich, A. Where are we heading? Challenges in evidence-based severity assessment. Lab. Anim. 2020, 54, 50–62. [Google Scholar] [CrossRef]
- Wittek, L.; Touma, C.; Nitezki, T.; Laeger, T.; Krämer, S.; Raila, J. Reduction in cold stress in an innovative metabolic cage housing system increases animal welfare in laboratory mice. Animals 2023, 13, 2866. [Google Scholar] [CrossRef] [PubMed]
- Chu, L.; Li, N.; Deng, J.; Wu, Y.; Yang, H.; Wang, W.; Zhou, D.; Deng, H. LC-APCI+-MS/MS method for the analysis of ten hormones and two endocannabinoids in plasma and hair from the mice with different gut microbiota. J. Pharm. Biomed. Anal. 2020, 185, 113223. [Google Scholar] [CrossRef] [PubMed]
- Shackleton, C.H.L.; Hughes, B.A.; Lavery, G.G.; Walker, E.A.; Stewart, P.M. The corticosteroid metabolic profile of the mouse. Steroids 2008, 73, 1066–1076. [Google Scholar] [CrossRef] [PubMed]
- Schiffer, L.; Barnard, L.; Baranowski, E.S.; Gilligan, L.C.; Taylor, A.E.; Arlt, W.; Shackleton, C.H.L.; Storbeck, K.-H. Human steroid biosynthesis, metabolism and excretion are differentially reflected by serum and urine steroid metabolomes: A comprehensive review. J. Steroid Biochem. Mol. Biol. 2019, 194, 105439. [Google Scholar] [CrossRef]
- Hohlbaum, K.; Bert, B.; Dietze, S.; Palme, R.; Fink, H.; Thöne-Reineke, C. Severity classification of repeated isoflurane anesthesia in C57BL/6JRj mice-assessing the degree of distress. PLoS ONE 2017, 12, e0179588. [Google Scholar] [CrossRef]
- Touma, C.; Sachser, N.; Möstl, E.; Palme, R. Effects of sex and time of day on metabolism and excretion of corticosterone in urine and feces of mice. Gen. Comp. Endocrinol. 2003, 130, 267–278. [Google Scholar] [CrossRef]
- Cook, N.J. Review: Minimally invasive sampling media and the measurement of corticosteroids as biomarkers of stress in animals. Can. J. Anim. Sci. 2012, 92, 227–259. [Google Scholar] [CrossRef]
- Kurien, B.T.; Everds, N.E.; and Scofield, R.H. Experimental animal urine collection: A review. Lab. Anim. 2004, 38, 333–361. [Google Scholar] [CrossRef]
- Kurien, B.T.; Scofield, R.H. Mouse urine collection using clear plastic wrap. Lab. Anim. 1999, 33, 83–86. [Google Scholar] [CrossRef]
- Doyle, N.; Germain, C.; Barma, M.-C.; Larocque, K.; Allegret, V.; Varela, A.; Parente, C.; Poitout, F. Urine Collection for Group-Housed Mice in Toxicology Studies Using the Labsand ® Techniques—An Alternative Method. Available online: https://www.criver.com/sites/default/files/resources/doc_a/UrineCollectionforGroup-HousedMiceinToxicologyStudiesUsingtheLabSand%C2%AETechniques-AnAlternativeMethod.pdf (accessed on 6 November 2024).
- Hoffman, J.F.; Fan, A.X.; Neuendorf, E.H.; Vergara, V.B.; Kalinich, J.F. Hydrophobic sand versus metabolic cages: A comparison of urine collection methods for rats (Rattus norvegicus). J. Am. Assoc. Lab. Anim. Sci. 2018, 57, 51–57. [Google Scholar]
- Jorgensen, A.; Maigaard, K.; Wörtwein, G.; Hageman, I.; Henriksen, T.; Weimann, A.; Møller, P.; Loft, S.; Hau, J.; Poulsen, H.E.; et al. Chronic restraint stress in rats causes sustained increase in urinary corticosterone excretion without affecting cerebral or systemic oxidatively generated DNA/RNA damage. Prog. Neuropsychopharmacol. Biol. Psychiatry 2013, 40, 30–37. [Google Scholar] [CrossRef] [PubMed]
- Rappold, B.A. Review of the use of liquid chromatography-tandem mass spectrometry in clinical laboratories: Part II-operations. Ann. Lab. Med. 2022, 42, 531–557. [Google Scholar] [CrossRef] [PubMed]
- van de Merbel, N.C. Advances in liquid chromatography–tandem mass spectrometry (LC–MS–MS)-based quantitation of biopharmaceuticals in biological samples. LCGC Suppl. 2015, 33, 38–42. [Google Scholar]
- Li, H.; Liu, X.; Poh, Y.; Wu, L.; Zhou, Q.-G.; Cai, B.-C. Rapid determination of corticosterone in mouse plasma by ultra fast liquid chromatography-tandem mass spectrometry. Biomed. Chromatogr. 2014, 28, 1860–1863. [Google Scholar] [CrossRef]
- Li, H.; Sheng, L.-P.; Wang, B.; Yang, Z.-L.; Liu, S.-Y. An optimized method for corticosterone analysis in mouse plasma by ultra-performance liquid chromatography-full-scan high-resolution accurate mass spectrometry. J. Chromatogr. Sci. 2015, 53, 285–294. [Google Scholar] [CrossRef]
- Leenaars, C.H.C.; van der Mierden, S.; Durst, M.; Goerlich-Jansson, V.C.; Ripoli, F.L.; Keubler, L.M.; Talbot, S.R.; Boyle, E.; Habedank, A.; Jirkof, P.; et al. Measurement of corticosterone in mice: A protocol for a mapping review. Lab. Anim. 2020, 54, 26–32. [Google Scholar] [CrossRef]
- Kalliokoski, O.; Jacobsen, K.R.; Darusman, H.S.; Henriksen, T.; Weimann, A.; Poulsen, H.E.; Hau, J.; Abelson, K.S.P. Mice do not habituate to metabolism cage housing-a three week study of male BALB/c mice. PLoS ONE 2013, 8, e58460. [Google Scholar] [CrossRef]
- Kovalčíková, A.; Gyurászová, M.; Gardlík, R.; Boriš, M.; Celec, P.; Tóthová, Ľ. The effects of sucrose on urine collection in metabolic cages. Lab. Anim. 2019, 53, 180–189. [Google Scholar] [CrossRef]
- Stechman, M.J.; Ahmad, B.N.; Loh, N.Y.; Reed, A.A.C.; Stewart, M.; Wells, S.; Hough, T.; Bentley, L.; Cox, R.D.; Brown, S.D.M.; et al. Establishing normal plasma and 24-hour urinary biochemistry ranges in C3H, BALB/c and C57BL/6J mice following acclimatization in metabolic cages. Lab. Anim. 2010, 44, 218–225. [Google Scholar] [CrossRef]
- Hauser, B.; Deschner, T.; Boesch, C. Development of a liquid chromatography-tandem mass spectrometry method for the determination of 23 endogenous steroids in small quantities of primate urine. J. Chromatogr. B Analyt. Technol. Biomed. Life Sci. 2008, 862, 100–112. [Google Scholar] [CrossRef]
- Anastassiades, M.; Lehotay, S.J. Fast and easy multiresidue method employing acetonitrile extraction/partitioning and “dispersive solid-phase extraction” for the determination of pesticide residues in produce. J. AOAC Int. 2003, 86, 412–431. [Google Scholar] [CrossRef] [PubMed]
- Payá, P.; Anastassiades, M.; Mack, D.; Sigalova, I.; Tasdelen, B.; Oliva, J.; Barba, A. Analysis of pesticide residues using the Quick Easy Cheap Effective Rugged and Safe (QuEChERS) pesticide multiresidue method in combination with gas and liquid chromatography and tandem mass spectrometric detection. Anal. Bioanal. Chem. 2007, 389, 1697–1714. [Google Scholar] [CrossRef] [PubMed]
- Nodari, F.; Hsu, F.-F.; Fu, X.; Holekamp, T.F.; Kao, L.-F.; Turk, J.; Holy, T.E. Sulfated steroids as natural ligands of mouse pheromone-sensing neurons. J. Neurosci. 2008, 28, 6407–6418. [Google Scholar] [CrossRef] [PubMed]
- Wang, T.; Shah, Y.M.; Matsubara, T.; Zhen, Y.; Tanabe, T.; Nagano, T.; Fotso, S.; Krausz, K.W.; Zabriskie, T.M.; Idle, J.R.; et al. Control of steroid 21-oic acid synthesis by peroxisome proliferator-activated receptor alpha and role of the hypothalamic-pituitary-adrenal axis. J. Biol. Chem. 2010, 285, 7670–7685. [Google Scholar] [CrossRef] [PubMed]
- Zhen, Y.; Krausz, K.W.; Chen, C.; Idle, J.R.; Gonzalez, F.J. Metabolomic and genetic analysis of biomarkers for peroxisome proliferator-activated receptor alpha expression and activation. Mol. Endocrinol. 2007, 21, 2136–2151. [Google Scholar] [CrossRef]
- Beyoglu, D.; Zhou, Y.; Chen, C.; Idle, J.R. Mass isotopomer-guided decluttering of metabolomic data to visualize endogenous biomarkers of drug toxicity. Biochem. Pharmacol. 2018, 156, 491–500. [Google Scholar] [CrossRef]
- Speziale, R.; Montesano, C.; Di Pietro, G.; Cicero, D.O.; Summa, V.; Monteagudo, E.; Orsatti, L. The urine metabolome of R6/2 and zQ175DN Huntington’s disease mouse models. Metabolites 2023, 13, 961. [Google Scholar] [CrossRef]
- Bielohuby, M.; Herbach, N.; Wanke, R.; Maser-Gluth, C.; Beuschlein, F.; Wolf, E.; Hoeflich, A. Growth analysis of the mouse adrenal gland from weaning to adulthood: Time- and gender-dependent alterations of cell size and number in the cortical compartment. Am. J. Physiol. Endocrinol. Metab. 2007, 293, E139–E146. [Google Scholar] [CrossRef]
- Kalliokoski, O.; Hau, J.; Jacobsen, K.R.; Schumacher-Petersen, C.; Abelson, K.S. Distribution and time course of corticosterone excretion in faeces and urine of female mice with varying systemic concentrations. Gen. Comp. Endocrinol. 2010, 168, 450–454. [Google Scholar] [CrossRef]
- Hoppe, C.C.; Moritz, K.M.; Fitzgerald, S.M.; Bertram, J.F.; Evans, R.G. Hypertension and sustained tachycardia in mice housed individually in metabolism cages. Physiol. Res. 2009, 58, 69–75. [Google Scholar] [CrossRef]
- Rowland, N.E.; Toth, L.A. Analytic and interpretational pitfalls to measuring fecal corticosterone metabolites in laboratory rats and mice. Comp. Med. 2019, 69, 337–349. [Google Scholar] [CrossRef] [PubMed]
- Allende, F.; Solari, S.; Campino, C.; Carvajal, C.A.; Lagos, C.F.; Vecchiola, A.; Valdivia, C.; Baudrand, R.; Owen, G.I.; Fardella, C.E. LC-MS/MS method for the simultaneous determination of free urinary steroids. Chromatographia 2014, 77, 637–642. [Google Scholar] [CrossRef] [PubMed]
- MacLean, B.; Tomazela, D.M.; Shulman, N.; Chambers, M.; Finney, G.L.; Frewen, B.; Kern, R.; Tabb, D.L.; Liebler, D.C.; MacCoss, M.J. Skyline: An open source document editor for creating and analyzing targeted proteomics experiments. Bioinformatics 2010, 26, 966–968. [Google Scholar] [CrossRef] [PubMed]


| Amount of β-Glucuronidase [U] a | Concentration of Corticosterone [fmol/µL] b | Variation [%] c |
|---|---|---|
| 25 | 78.11 ± 3.7 | 7.9 |
| 50 | 83.57 ± 3.5 | 1.5 |
| 100 | 82.23 ± 3.9 | 3.1 |
| 200 | 84.82 ± 5.5 | - |
| 400 | 77.39 ± 3.0 | 8.8 |
| Column | Kinetex C8 (2.6 µm, 100 Å, 150 × 4.60 mm; Phenomenex Ltd., Aschaffenburg, Germany) | |||||
| Column temperature | 40 °C | |||||
| Flow rate | 0.450 mL/min | |||||
| Solvents | A | Water + 0.1% formic acid | ||||
| B | Acetonitrile + 0.1% formic acid | |||||
| Gradient | 1 min | 20% B | ||||
| 8–9 min | 100% B | |||||
| 9.01–12 min | 20% B | |||||
| Postrun | 4 min | 20% B | ||||
| Injection volume | 5 µL | |||||
| Source parameters | Mode | Positive | ||||
| Capillary | 4500 V | |||||
| Drying gas temperature | 120 °C | |||||
| Drying gas flow (N2) | 11 L/min | |||||
| Nebulizer | 40 psi | |||||
| Nozzle | 0 V | |||||
| Sheath gas temperature | 400 °C | |||||
| Sheath gas flow (N2) | 12 L/min | |||||
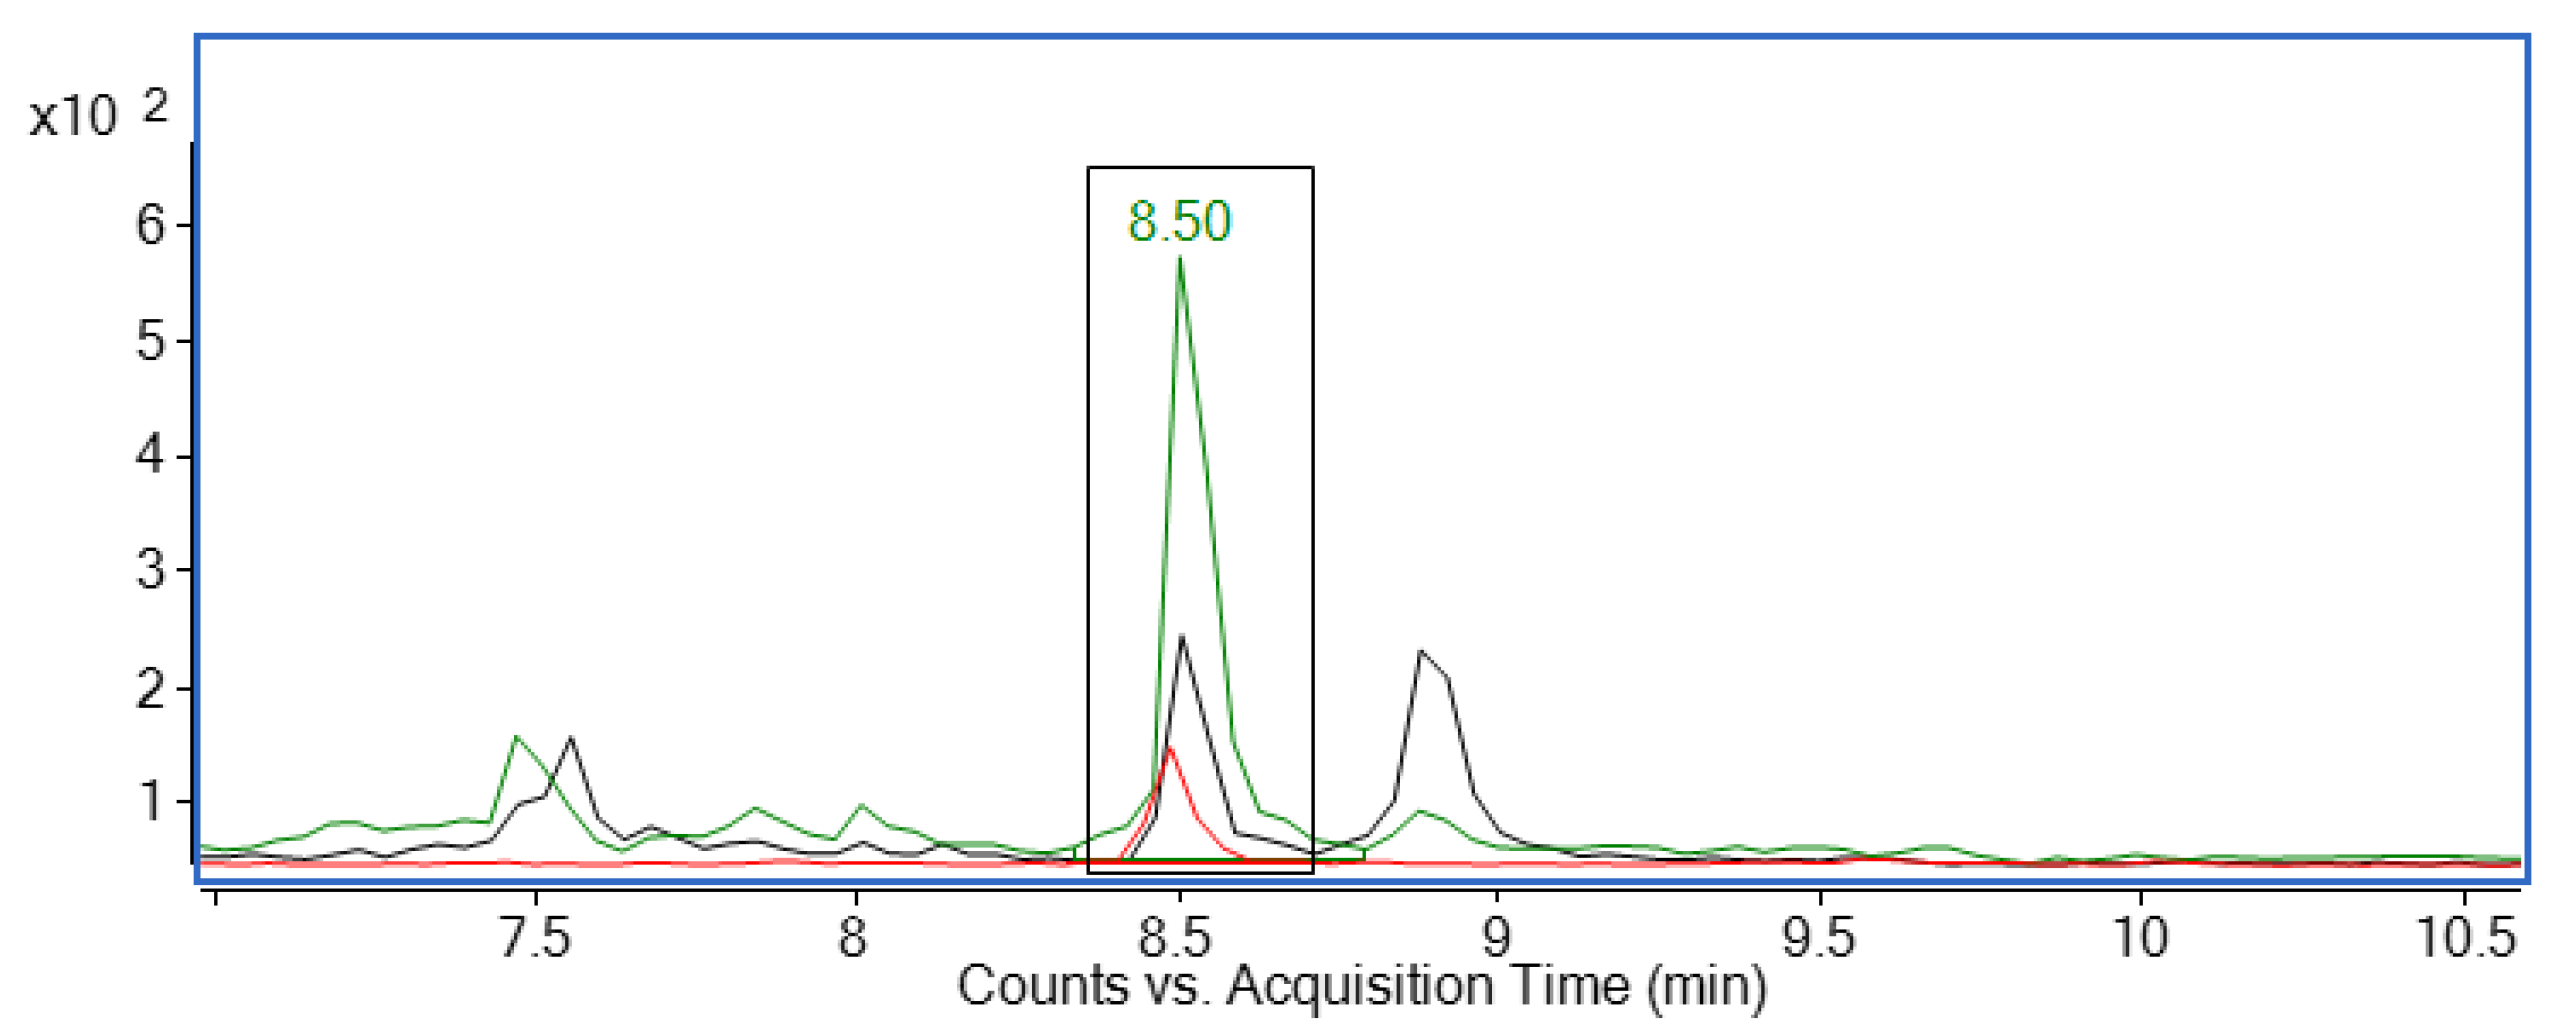
| Multiple reaction monitoring | Compound | Retention time [min] | MRM transition [m/z] | Collision energy [eV] | Fragmentor voltage [V] | |
| Corticosterone | Qualifier | 8.50 | 347.2 > 121.1 | 30 | 125 | |
| Quantifier | 347.2 > 97.1 | 40 | 160 | |||
| Corticosterone-d8 | Qualifier | 8.48 | 355.3 > 125.0 | 30 | 125 | |
| Quantifier | 355.3 > 100.2 | 40 | 160 | |||
| Dwell time | 175 ms | |||||
| Cell accelerator voltage | 5 V | |||||
| Parameter a | Corticosterone |
|---|---|
| Linearity in range 1–5000 fmol/µL [r2] b | 0.988 |
| Limit of detection (LOD) [fmol/µL] c | 0.358 |
| Limit of quantification (LOQ) [fmol/µL] d | 0.823 |
| Intra-day variation day 1 [%] e | 5.23 ± 0.1 |
| Intra-day recovery day 1 [%] e | 90.4 ± 3.2 |
| Intra-day variation day 2 [%] e | 5.59 ± 0.1 |
| Intra-day recovery day 2 [%] e | 110.6 ± 3.6 |
| Intra-day variation day 3 [%] e | 4.21 ± 0.1 |
| Intra-day recovery day 3 [%] e | 98.4 ± 2.8 |
| Inter-day variation [%] e | 7.34 ± 0.1 |
| Inter-day recovery [%] e | 99.8 ± 9.1 |
Disclaimer/Publisher’s Note: The statements, opinions and data contained in all publications are solely those of the individual author(s) and contributor(s) and not of MDPI and/or the editor(s). MDPI and/or the editor(s) disclaim responsibility for any injury to people or property resulting from any ideas, methods, instructions or products referred to in the content. |
© 2024 by the authors. Licensee MDPI, Basel, Switzerland. This article is an open access article distributed under the terms and conditions of the Creative Commons Attribution (CC BY) license (https://creativecommons.org/licenses/by/4.0/).
Share and Cite
Howe-Wittek, L.; Kroschk, P.; Nieschalke, K.; Rawel, H.M.; Krämer, S.; Raila, J. Non-Invasive Monitoring of Corticosterone Levels in Mouse Urine with Liquid Chromatography-Electrospray Ionization-Tandem Mass Spectrometry. Molecules 2024, 29, 5399. https://doi.org/10.3390/molecules29225399
Howe-Wittek L, Kroschk P, Nieschalke K, Rawel HM, Krämer S, Raila J. Non-Invasive Monitoring of Corticosterone Levels in Mouse Urine with Liquid Chromatography-Electrospray Ionization-Tandem Mass Spectrometry. Molecules. 2024; 29(22):5399. https://doi.org/10.3390/molecules29225399
Chicago/Turabian StyleHowe-Wittek, Laura, Paul Kroschk, Kai Nieschalke, Harshadrai M. Rawel, Stephanie Krämer, and Jens Raila. 2024. "Non-Invasive Monitoring of Corticosterone Levels in Mouse Urine with Liquid Chromatography-Electrospray Ionization-Tandem Mass Spectrometry" Molecules 29, no. 22: 5399. https://doi.org/10.3390/molecules29225399
APA StyleHowe-Wittek, L., Kroschk, P., Nieschalke, K., Rawel, H. M., Krämer, S., & Raila, J. (2024). Non-Invasive Monitoring of Corticosterone Levels in Mouse Urine with Liquid Chromatography-Electrospray Ionization-Tandem Mass Spectrometry. Molecules, 29(22), 5399. https://doi.org/10.3390/molecules29225399