Article

Preparation of Composites Derived from Modified Loess/Chitosan and Its Adsorption Performance for Methyl Orange

Gansu Key Laboratory of Efficient Utilization of Oil and Gas Resources in Longdong, Longdong University, Qingyang 745000, China
*
Author to whom correspondence should be addressed.
Molecules 2024, 29(21), 5052; https://doi.org/10.3390/molecules29215052
Submission received: 16 September 2024 / Revised: 22 October 2024 / Accepted: 22 October 2024 / Published: 25 October 2024

Abstract

:
A modified loess/chitosan composite (ML@CS) was prepared via solution. The microstructure and physicochemical properties of ML@CS were characterised via scanning electron microscope (SEM), Zeta potential, X-ray diffraction (XRD), Fourier transform infrared spectrum (FT-IR), and thermogravimetric analysis (TGA). An aqueous solution of methyl orange (MO) was used as simulated wastewater from which the influence of the initial concentration and pH of MO, the dosage amount and regeneration performance of ML@CS, adsorption temperature, and time on the adsorption effect of MO were systematically investigated. The adsorption kinetics, isothermal adsorption, and adsorption mechanism were also analysed. The results indicate that ML@CS had a good adsorption effect on MO. When the initial concentration of MO was 200 mg/L, pH was 5.0, and ML@CS dosage was 1.0 g/L, the adsorption equilibrium could be reached within 180 min at room temperature, and the equilibrium adsorption capacity and removal rate reached 199.52 mg/g and 99.75%, respectively. After five adsorption–desorption cycles, the MO removal rate remained above 82%. The adsorption behaviour of ML@CS for MO conforms to the pseudo–second–order kinetic model and the Langmuir isotherm adsorption model. The spontaneous exothermic process was mainly controlled by monolayer chemical adsorption and the physical adsorption only played an auxiliary role. ML@CS efficiently adsorbed MO in water and can be used as a high-efficiency, low-cost adsorbent for printing and dyeing wastewater treatment.

1. Introduction

The amount of wastewater generated by the printing and dyeing industry, owing to its rapid development, has been increasing dramatically. This wastewater has high chemical oxygen demand (COD) and chromaticity, complex components, high biological toxicity, difficult natural degradation, and requires treatment [1]. In particular, azo dyes or methyl orange (MO) have potential carcinogenic, teratogenic, and mutagenic effects on organisms and are one of the refractory industrial wastewaters [2]. Among the various technologies used for azo dye wastewater treatment, adsorption is effective and commonly used [3]. However, most of the traditional adsorbent materials (such as activated carbon, resin, molecular sieve, inorganic and organic polymer flocculant, etc.) have some evident shortcomings such as difficult separation, easy loss, poor recycling, serious secondary pollution, and high preparation cost [4,5]. Therefore, the development of environment-friendly adsorption materials with high efficiency, economic viability, and good recycling performance is one of the hot spots in the field of wastewater treatment research.
Chitosan (CS) is a linear polymer with a high molecular weight. It is obtained by the partial deacetylation of the natural polysaccharide chitin, which contains active groups such as hydroxyl (–OH), amino (–NH2), glycosides, and N-acetyl amino groups in its molecular chain [5,6]. Owing to the formation of a secondary structure from the hydrogen bonds between the skeleton chain structures, CS exhibits the following effects: ion exchange, chelation, adsorption, crosslinking, flocculation, biocompatibility, and degradation of most organic compounds and metal ions [7,8,9,10]. However, the applicability of CS for industry is limited, to some extent, by virtue of its high crystallinity, low porosity and mechanical strength, weak resistance to acid, poor chemical stability, difficult solid-liquid separation and recovery, and easy-to-cause secondary pollution [7]. Owing to its typical high porosity, weak cementation and metastable structure with loose filling, and active points, including silicon and aluminium, as well as good dispersibility, large specific surface area, and strong chemical resistance, loess exhibits excellent adsorption and cementation properties [11,12], and is applied in the field of fine chemical industry [13,14,15]. However, the functional groups on the surface of loess are few, the hydrophilicity is strong, the adsorption capacity is limited, and the selectivity is poor, which limits its practical application in wastewater treatment.
To exploit the synergistic effect of loess and chitosan in printing and dyeing wastewater treatment, improve the physical and chemical stability, and enhance the mechanical strength and regeneration performance of the adsorption material, a composite was prepared by modifying loess to have the characteristics of a resource-rich, low-cost, non-toxic, harmless, and environmentally friendly material. CS was loaded onto the modified loess (ML) and its adsorption property was explored. This study provides new ideas for the development and utilisation of green, efficient, and low-cost materials for the treatment of wastewater containing MO.

2. Results and Discussion

2.1. Modified Loess

Firstly, water-soluble impurities, suspended solids, and sand particles in loess were removed by washing with water, and then the acid-soluble substances in loess were removed by acidification using hydrochloric acid (HCl). This process reduced the ash content in the loess and enlarged its specific surface area, thereby improving its adsorption performance. More importantly, the exchange reaction between H+ and cations in the loess released more silicon hydroxyl group (Si–OH) from the surface of loess particles, which was favourable for the combination of loess and CS [16].

2.2. Material Characterisation

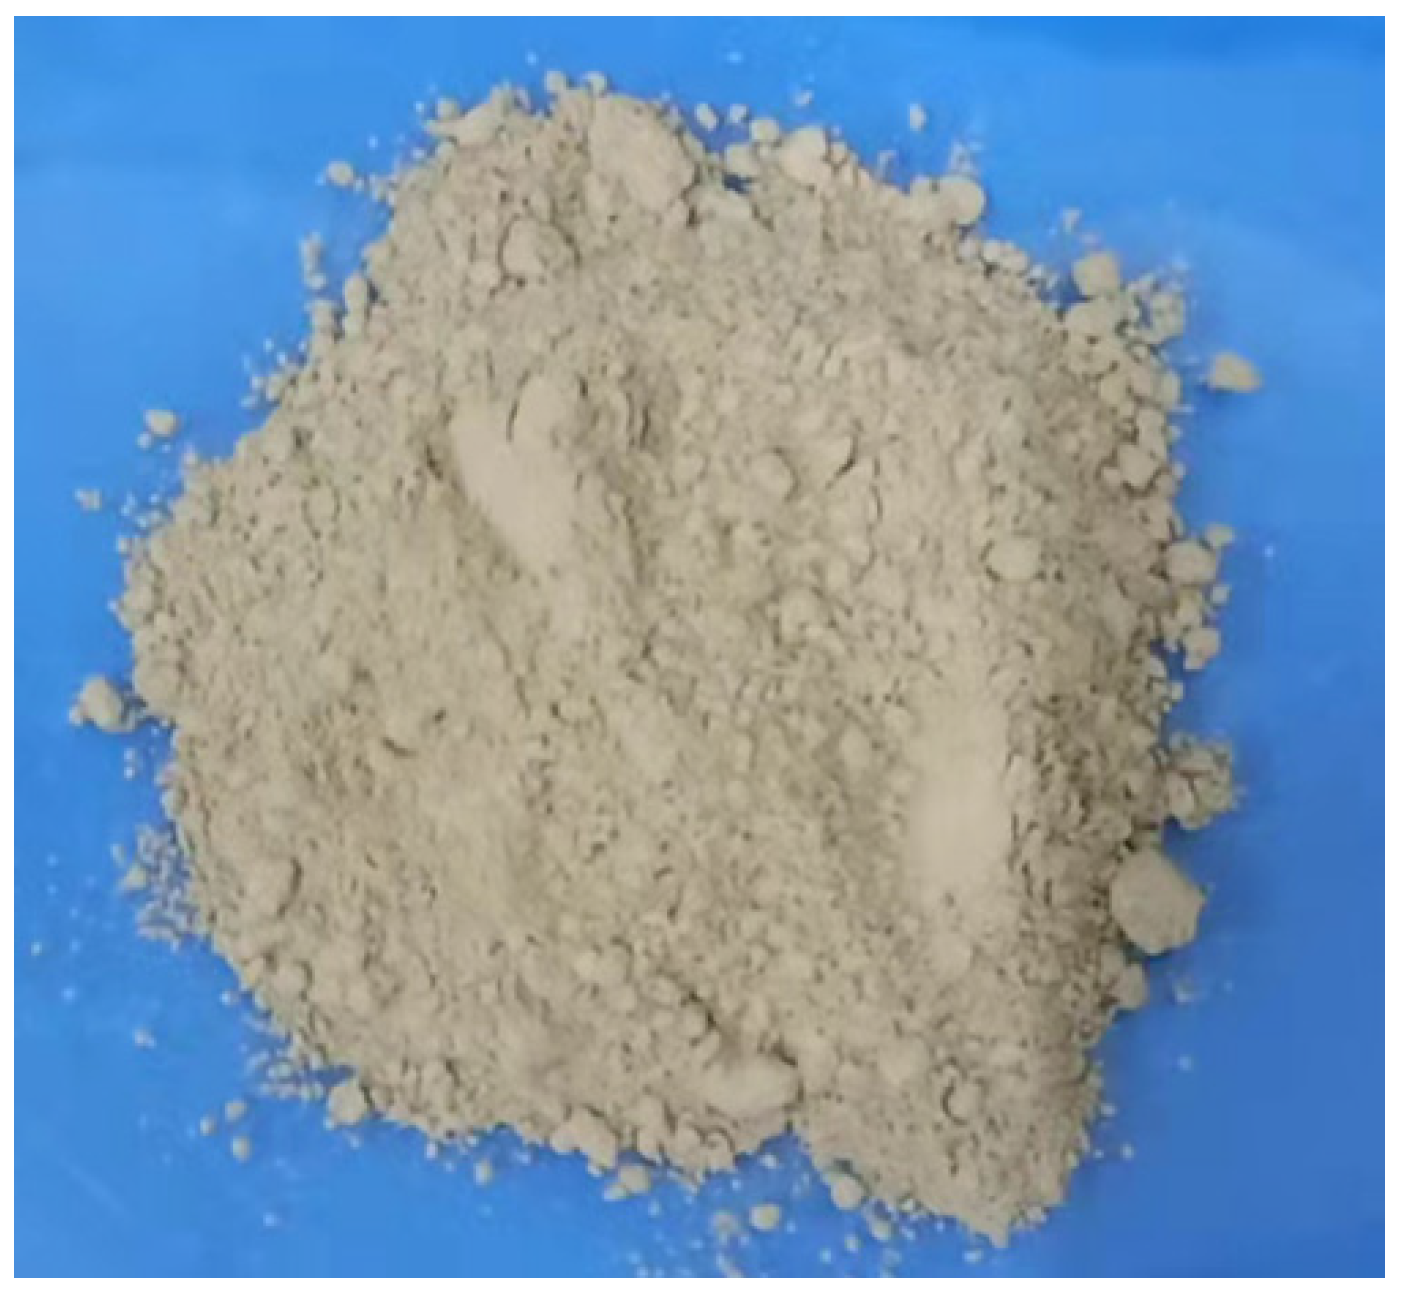
2.2.1. Appearance and Morphology

CS was loaded onto the surface of the modified loess, which yielded a light-yellow powdered ML@CS composite (Figure 1). The morphological characteristics of ML and ML@CS were explored via SEM. The results are shown in Figure 2. The BET data of ML and ML@CS are shown in Table 1.
A comparison of the SEM images of ML and ML@CS shows layered structures with irregular textures stacked together and unevenly distributed pores on the surface of ML particles, whereas the agglomerates of ML@CS appear to be more dispersed, and a large number of irregular particles are attached to the surface of the agglomerates. Notably, the layered structure of the loess in ML@CS has not completely disappeared, indicating that loess and CS have been successfully compounded. Furthermore, it can be seen from Table 1 that although there is little difference between the average pore volume and average pore size of ML@CS and ML, the specific surface area of ML@CS is 48.71 m2/g larger than that of ML, indicating that CS loading on the surface of ML not only increases the specific surface area and adsorption site of ML, but also acts as a bridge to bind the loess particles. At the same time, the introduction of CS hinders the stacking between ML particles, which was conducive to improving the adsorption performance.

2.2.2. Zeta Potential Analysis
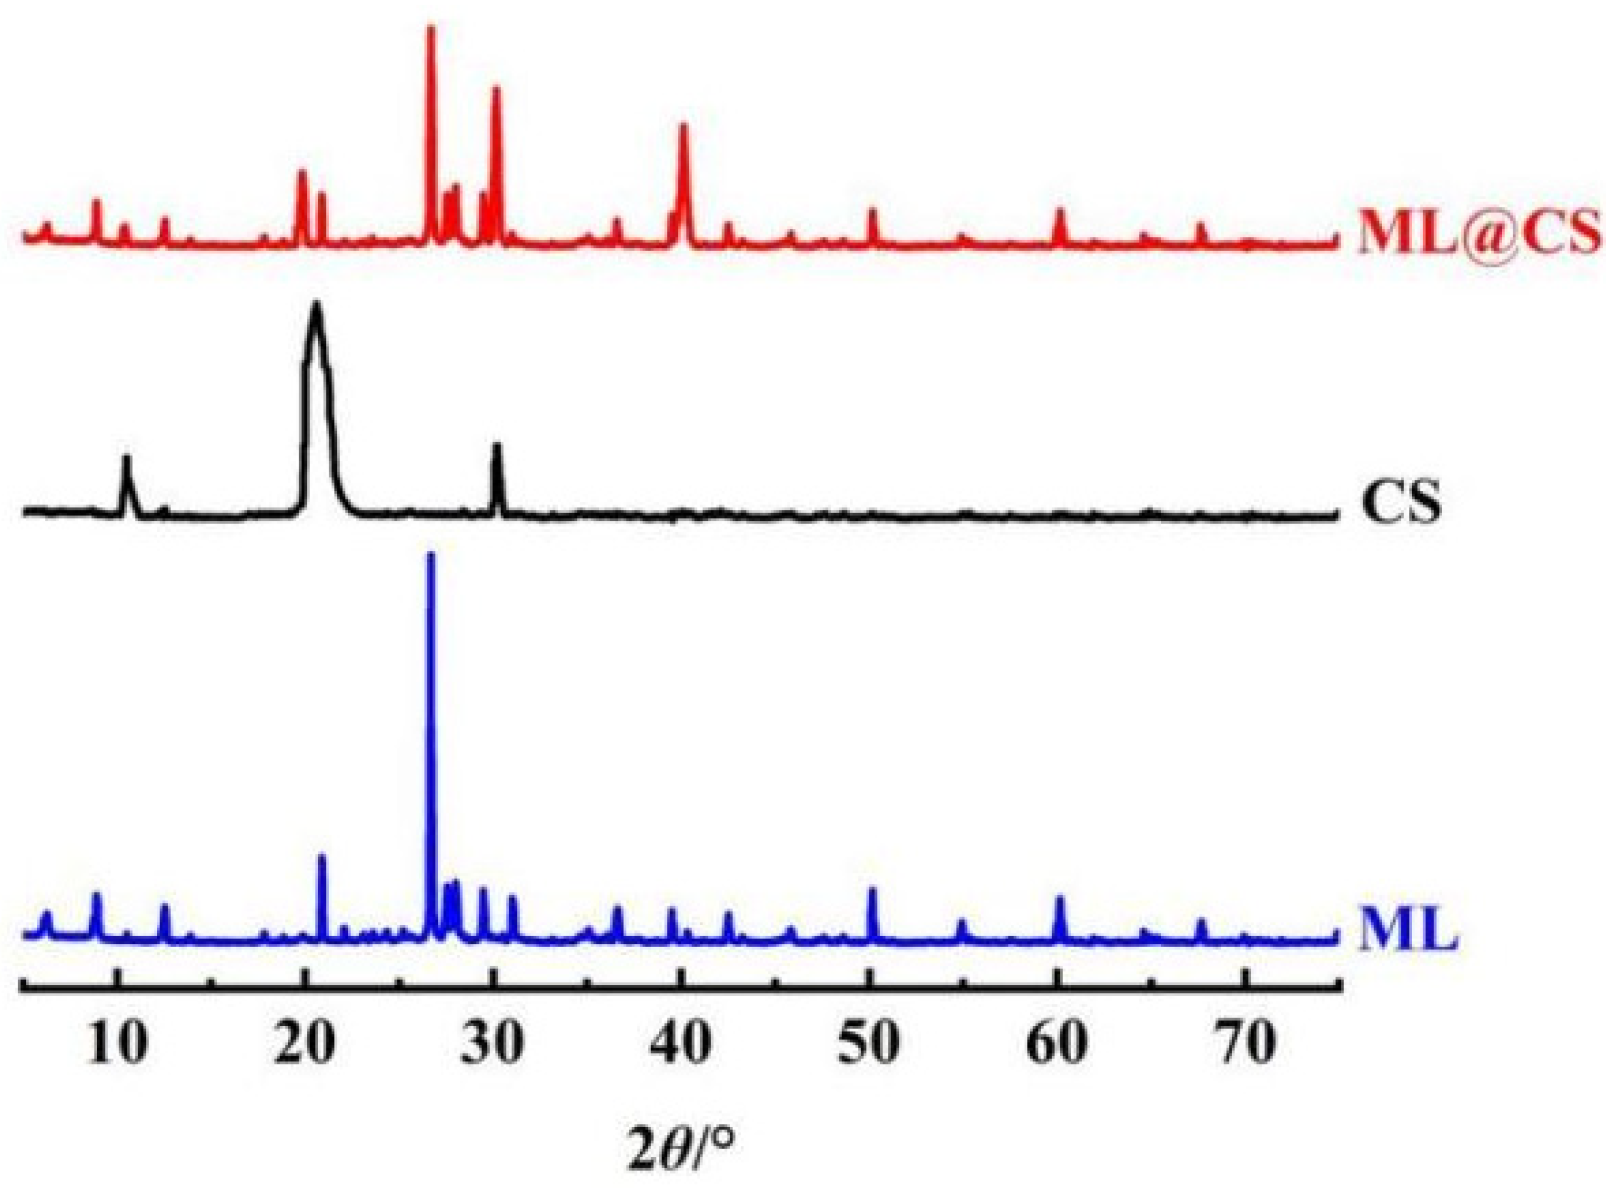
The Zeta potential of ML@CS as a function of pH is shown in Figure 3.
The surface electrical properties of the adsorption materials influence their adsorption properties. The adsorption efficiency and capacity can be substantially improved by selecting the adsorbate based on its surface charge properties and the size of the adsorbent. Figure 3 shows that the Zeta potential is positive when the pH is between 2 and 5, indicating that the ML@CS surface is positively charged. When pH > 6, the Zeta potential is negative and the isoelectric point is 5.85.

2.2.3. XRD Analysis

By comparing the XRD patterns in Figure 4, it is found that ML@CS shows the typical diffraction peaks of loess at 2θ = 22.1°, 28.0°, 31.0°, and 36.6°, indicating that the main composition of loess does not change during the preparation of ML@CS [17]. Moreover, the characteristic diffraction peaks of CS appear at 2θ = 10.5°, 20.6°, and 30.2° [18], a new diffraction peak appears at about 2θ = 40.1°, and the wider amorphous structure peak (2θ = 19.8°) in CS is shifted, indicating that CS has successfully combined with ML. In addition, the amorphous region of CS is enlarged and the crystallinity is reduced [19], but the basic structure of CS is not damaged, and there is still a certain amount of –OH and –NH2 on the surface that can adsorb MO well [20].

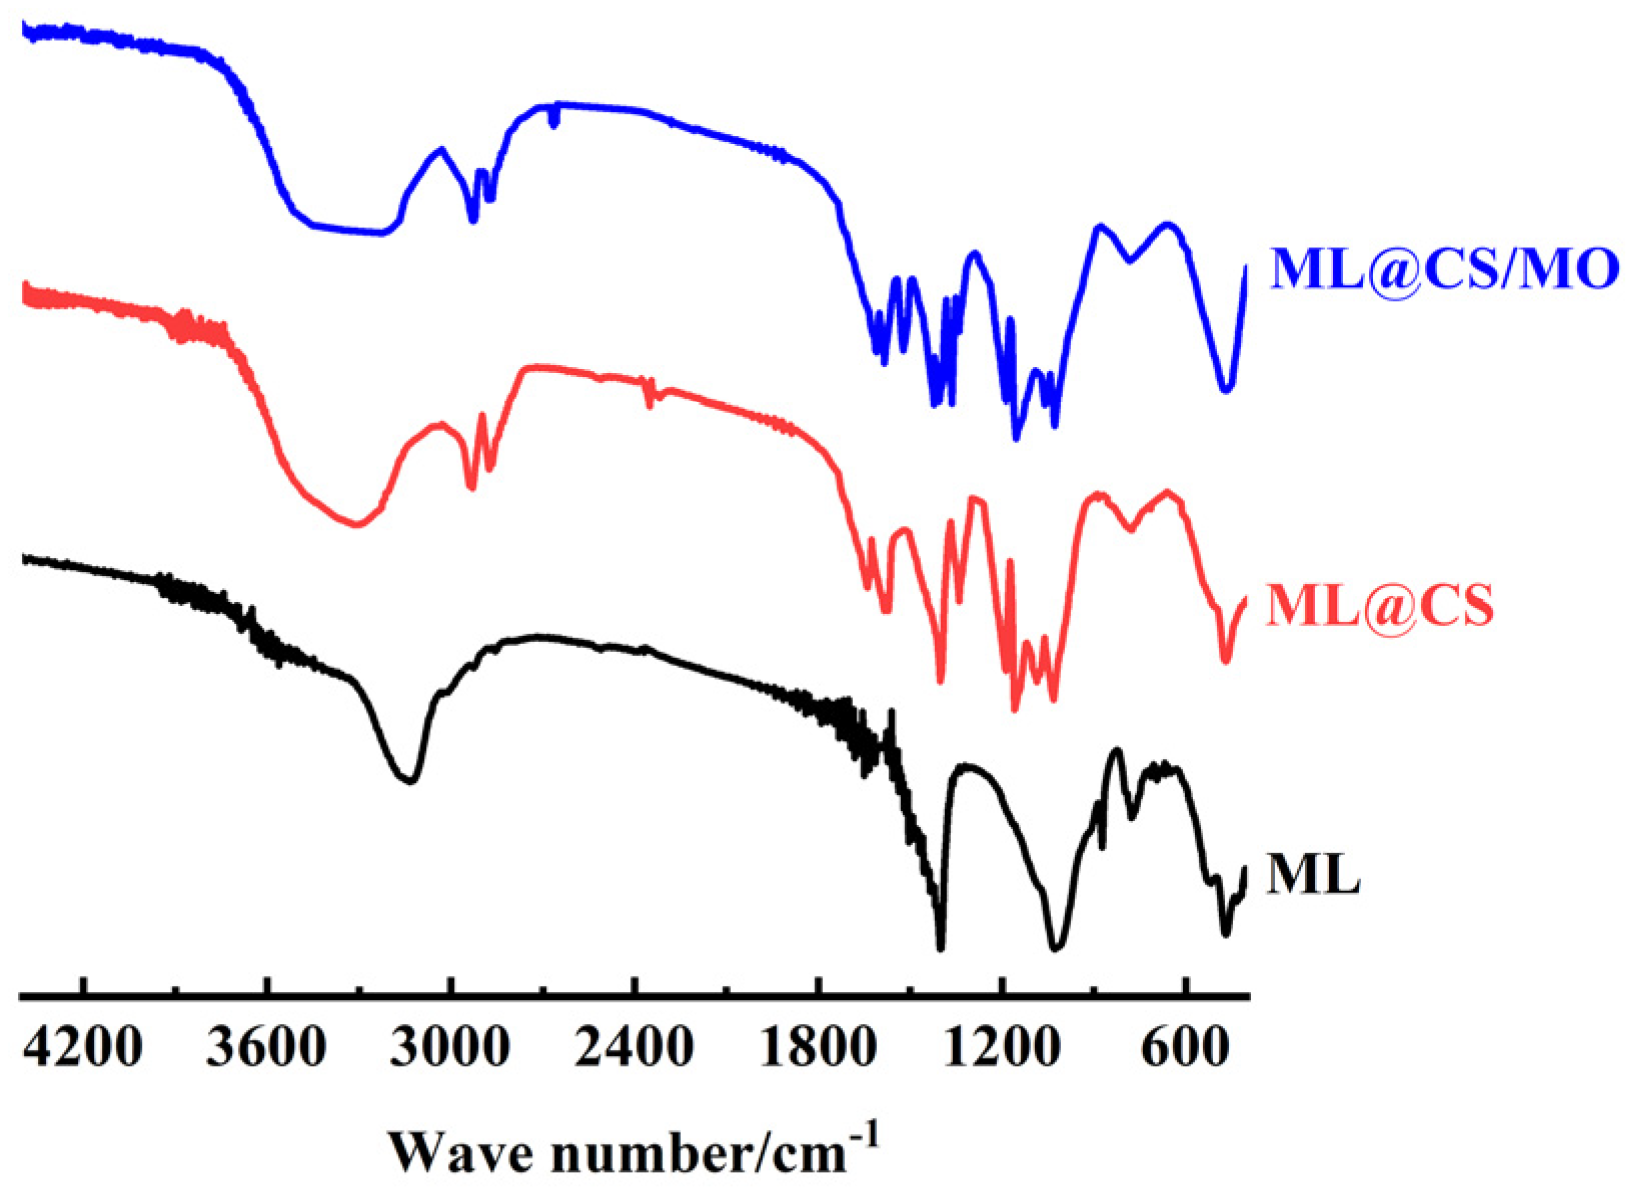
2.2.4. FT-IR Analysis

As can be seen from Figure 5, the peaks at 471 cm−1 and 778 cm−1 are assigned to the Si–O–Si bending vibration and the Si–O stretching vibration absorption, respectively. A strong absorption peak at 1086 cm−1 is formed by the superposition of the Si–O–Si stretching vibration absorption and the C–O stretching vibration absorption. The peaks at 2930 cm−1 and 2874 cm−1 can be ascribed to the stretching vibration absorption of C–H in –CH3 and –CH2– [21], and those at 1630 cm−1 and 1402 cm−1 can be attributed to the O–H and C–H bending vibration absorption, respectively. The peak at 1186 cm−1 is ascribed to the C–N stretching vibration absorption, and the weak amide absorption peak can be observed at 1341 cm−1. The peak around 1159 cm−1 can be ascribed to the C–O stretching vibration absorption, and those peaks around 1080 cm−1 and 1032 cm−1 belongs to the C3–OH and C6–OH stretching vibrations absorption in CS, respectively [22]. The peaks at 1572 and 1639 cm−1 are assigned to the in-plane bending vibration absorption of N–H in –NHCO– and the stretching vibration absorption of C=O, respectively [23].
The absorption peak at 1402 cm−1 belongs to the –COOH stretching vibration, which can be attributed to the natural organic matter composition in loess [24,25]. The multiple broad absorption peak at ~3200–3450 cm−1 originated from the overlap and broadening of the absorption peaks of O–H and N–H stretching vibrations, indicating the presence of intramolecular and intermolecular hydrogen bonds between –OH and –NH2 in CS molecules [26]. A strong –NH2 shear vibration absorption peak was observed at 1585 cm−1, indicating that –NH2 on CS is not destroyed during the ML@CS synthesis. These results confirm the successful synthesis of ML@CS by loading CS on the ML surface.
After the adsorption of MO on ML@CS, the mixed absorption peaks of N–H and O–H at 3415 cm−1 shifted to 3222 cm−1 and the peak intensity decreased, demonstrating that the groups originating from MO may form hydrogen bonds with –OH and –NH2 on ML@CS. At the same time, the bending vibration and skeleton vibration absorption peaks of benzene appeared at 1421 and 1610 cm−1, respectively. Similarly, the N=N vibration absorption peak was observed at 1521 cm−1, the C−N stretching vibration absorption peaks appeared at 1153 cm−1 and 1027 cm−1 and the S=O stretching vibration absorption peak appeared at 1364 cm−1. These characteristic peaks manifested the existence of a basic skeleton of MO and RSO3 [27]. This confirms that an interaction occurred between –OH and –NH2 in ML@CS and the groups in MO [28,29]. Thus, –OH or –NH2 on the molecule must be protected during ML@CS synthesis.

2.2.5. TGA

Figure 6 shows the TGA curves of ML, CS, and ML@CS.
At room temperature to 250 °C, the weight loss rate of ML is 8.59%, which is mainly caused by the evaporation of adsorbed water in the loess surface and void. At 250–700 °C, the weight loss rate of ML is 1.84%, mainly resulting from the partial loss of bound water and decomposition of organic matter. The weight loss of CS is 0.78% due to the loss of water molecules when the temperature increases from room temperature to 100 °C. At 100–400 °C, the rapid weight loss of CS is 48.87% because of the loss of strong binding water and the degradation of CS [30]. As the temperature increases from room temperature to 200 °C, the weight loss of ML@CS is 1.91% due to the loss of a small amount of water molecules. At 200–450 °C, the weight loss of ML@CS is 33.53% because of the oxidative decomposition of CS. As the temperature increases from room temperature to 700 °C, the total weight loss rate of ML@CS is 37.09%, which is higher than that of ML and lower than that of CS. The weight loss of ML@CS is relatively slow, confirming the formation of a composite using CS and ML, ML@CS also has good thermal stability.

2.3. Influence of Adsorption Conditions on the Adsorption Effect

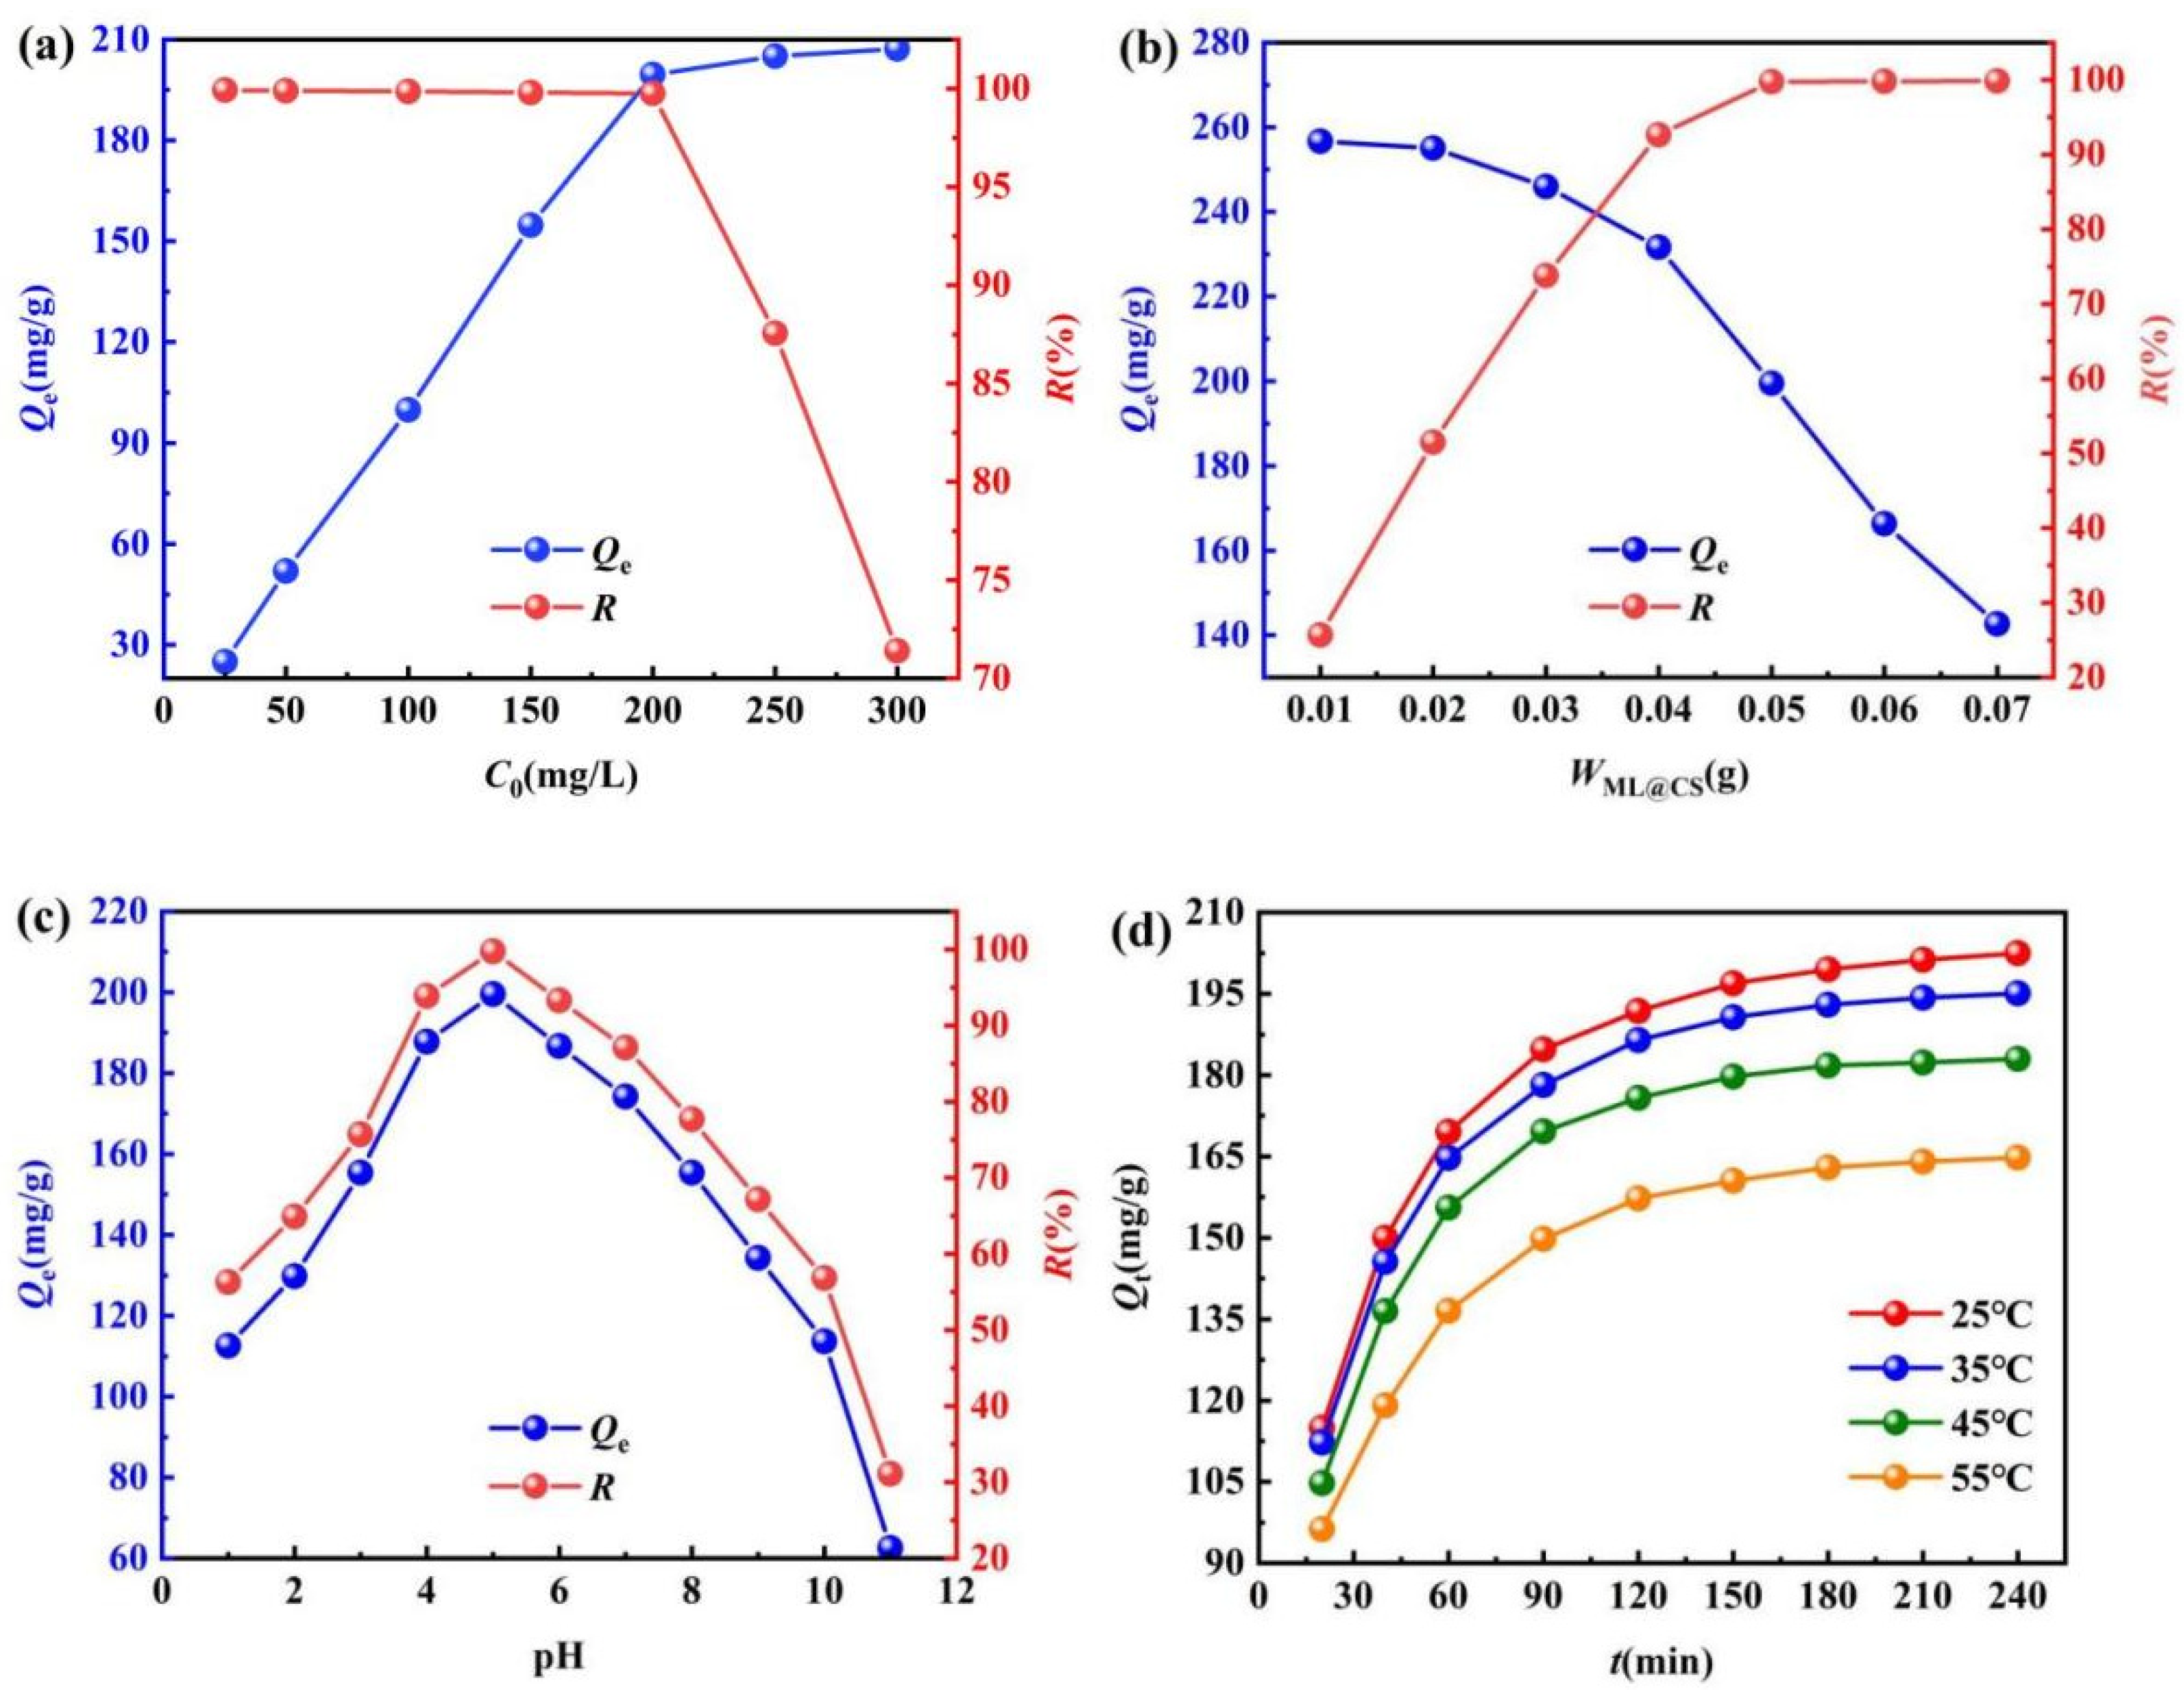
2.3.1. Effect of Initial Concentration

The effects of the initial concentrations (25, 50, 100, 150, 200, 250, and 300 mg/L) on the adsorption effect of ML@CS for MO were investigated at 25 °C, WML@CS of 0.05 g, pH of 5.0, and adsorption time of 180 min. As shown in Figure 7a, Qe increases rapidly from 24.98 to 199.53 mg/g with a continuous increase in C0 from 25 to 200 mg/L for a constant ML@CS amount, whereas R gradually decreases from 99.92% to 99.75%. The residual concentration of MO in the water after treatment is< 0.5000 mg/L, which meets the emission standards. Qe gradually increases to 207.20 mg/g when C0 is increased to 300 mg/L, whereas R considerably decreases to 71.41% because the adsorption sites of ML@CS did not reach a saturation state at low concentrations. The driving force for mass transfer of the solution increases with C0, and more amounts of MO are adsorbed on the ML@CS surface, resulting in a rapid increase in Qe [31] and a gradual decrease in R. When the adsorption sites on the ML@CS surface are almost occupied completely, the excess MO can only be in a free state in the solution. Thus, Qe increases gradually and R decreases considerably. Therefore, the optimal initial concentration of MO was regarded as 200 mg/L.

2.3.2. Effect of the Addition Amount of ML@CS

The adsorbent amount is an important index for investigating the adsorption effect. When the dosage was insufficient, the adsorption effect was poor. Moreover, the pollutant could not be completely removed and the polluted water was not well treated. However, excessive amounts will decrease the adsorption efficiency and result in resource wastage and increase the cost. Thus, adding an appropriate amount of adsorbent will yield excellent treatment effect for polluted water and be economical. The effect of ML@CS dosage on MO adsorption was exploited when C0 was 200 mg/L, pH was 5.0 and adsorption temperature and time were 25 °C and 180 min, respectively. As shown in Figure 7b, R increases considerably at first and then increases gradually, whereas Qe first decreases gradually and then substantially after the addition of ML@CS. After the ML@CS amount is increased from 0.01 to 0.05 g, R increases considerably from 25.67% to 99.76% and Qe decreases gradually from 256.65 to 199.52 mg/g. When the ML@CS amount is further increased to 0.07 g, R increases gradually to 99.85% and Qe decreases to 142.64 mg/g. This is possibly because the ML@CS amount was low at the beginning and the number of adsorption sites was less when C0 was kept at a certain concentration, only a small amount of MO was adsorbed, resulting in low R and high Qe. Upon adding ML@CS, the available adsorption sites increased and the mass transfer power for adsorption became larger. This caused the adsorption of more MO amounts by the active sites on the ML@CS surface, and thus, R increased considerably. Meanwhile, the adsorption sites that were not occupied by MO increased gradually. Excessive amounts of ML@CS result in excess adsorption sites or the aggregation and overlap of adsorption sites, which reduce the utilisation rate of adsorption sites and cause a sharp decrease in Qe [32]. Considering the adsorption effect and cost, the optimal dosage of ML@CS was determined to be 0.05 g, i.e., 1.00 g/L.

2.3.3. Effect of Solution pH

Acidity, or pH, is one of the important factors affecting adsorption behaviour, which not only affects the surface charge and properties of the adsorbent, but also affects the existence form of MO in solution. At 25 °C, the effect of pH on the adsorption ability of MO by ML@CS was investigated at C0 of 200 mg/L, WML@CS of 0.05 g, and adsorption time of 180 min. As shown in Figure 7c, the adsorption performance of ML@CS was considerably influenced by the pH of the solution. In particular, Qe and R increased first and then decreased with increasing pH. The maximum Qe and R of 199.52 mg/g and 99.76%, respectively, were obtained at pH 5.0 because pH determined the electrochemical properties of the solution and affected the existing forms of CS and MO in the solution. The change in the proportion of different existing forms can lead to variation in the adsorption mechanism. At pH < 5.85, the Zeta potential shows that the ML@CS surface is positively charged, and the protonations of –NH2 and –OH on the ML@CS surface to form amino cation (–NH3+) and hydroxyl cation (–OH2+) will also increase the positive charge density on the ML@CS surface [33], these will be conducive to the adsorption of RSO3 in wastewater by electrostatic attraction and increase Qe and R. However, RSO3 was not adsorbed at low pH because (1) the weakly alkaline CS was prone to hydrolysis, (2) the enhanced positivity of MO repelled the positive charge on the ML@CS surface and (3) the excess H+ in the solution competed with –NH3+ and –OH2+ on the ML@CS surface. When pH > 5.85, the Zeta potential shows that the ML@CS surface is negatively charged, meanwhile (1) –NH2 on CS is not easily protonated and –OH is easily converted to oxygen anion (–O), which did not facilitate the electrostatic interaction between CS and RSO3, and (2) excessive OH group in the solution resulted in competitive adsorption with RSO3 and decreased the electrostatic adsorption capacity of MO on the ML@CS surface, thereby decreasing Qe and R [34]. In addition, the existing form of MO at various pH affected the adsorption. At pH < 3.1, the red p-quinone structure was the dominant form. At pH > 4.4, yellow azo was the main structure. The azo structure was more stable than the quinone structure and was more difficult to be removed. A certain adsorption amount was observed at higher or lower pH due to the formation of hydrogen bonds between the highly electronegative oxygen and nitrogen atoms in the MO molecule and the –OH of ML@CS [35]. Thus, the optimum pH for MO adsorption by ML@CS was deemed to be 5.0.

2.3.4. Effect of Adsorption Temperature and Time

The effects of temperature and adsorption time on MO were studied at C0, WML@CS, and pH of 200 mg/L, 0.05 g, and 5.0, respectively. As shown in Figure 7d, both Qt and R first increase dramatically and then gradually as the adsorption time increases at different temperatures. After a certain adsorption time, Qt and R tend to remain unchanged, indicative of chemical adsorption. Moreover, the adsorption process was slow and required considerable time to reach equilibrium. For example, in the first 150 min, the Qt of MO on ML@CS increased rapidly at 25 °C with time. After 150–180 min, Qt increased gradually until reaching the adsorption equilibrium (~180 min), and Qt and R remained nearly unchanged because at the initial stage of adsorption, MO molecules and active groups in ML@CS did not achieve optimal interaction and a large number of unoccupied adsorption sites were present on the ML@CS surface [36]. As the adsorption time increased, the concentration of MO near ML@CS decreased and a concentration gradient formed with the surrounding MO solution owing to the gradual adsorption of MO near ML@CS. This facilitated the rapid diffusion of MO in the high-concentration area near the periphery of ML@CS, thereby dramatically increasing Qt and R. As the adsorption sites and concentration gradient on the ML@CS surface decreased, Qt and R increased only gradually. When the active sites on the ML@CS surface tended to be saturated, a dynamic balance of adsorption and desorption was achieved and Qt remained almost unchanged. As can be seen from Figure 7d, with the increase of temperature, Qt decreases at the same time and the time to reach adsorption equilibrium shorten, but the adsorption equilibrium can be reached within 180 min in both cases, indicating that the adsorption of ML@CS on MO is an exothermic process under experimental conditions, and the increase of temperature inhibits the forward adsorption and decreases the adsorption capacity [37]. Therefore, the optimal adsorption time at 25 °C is 180 min.

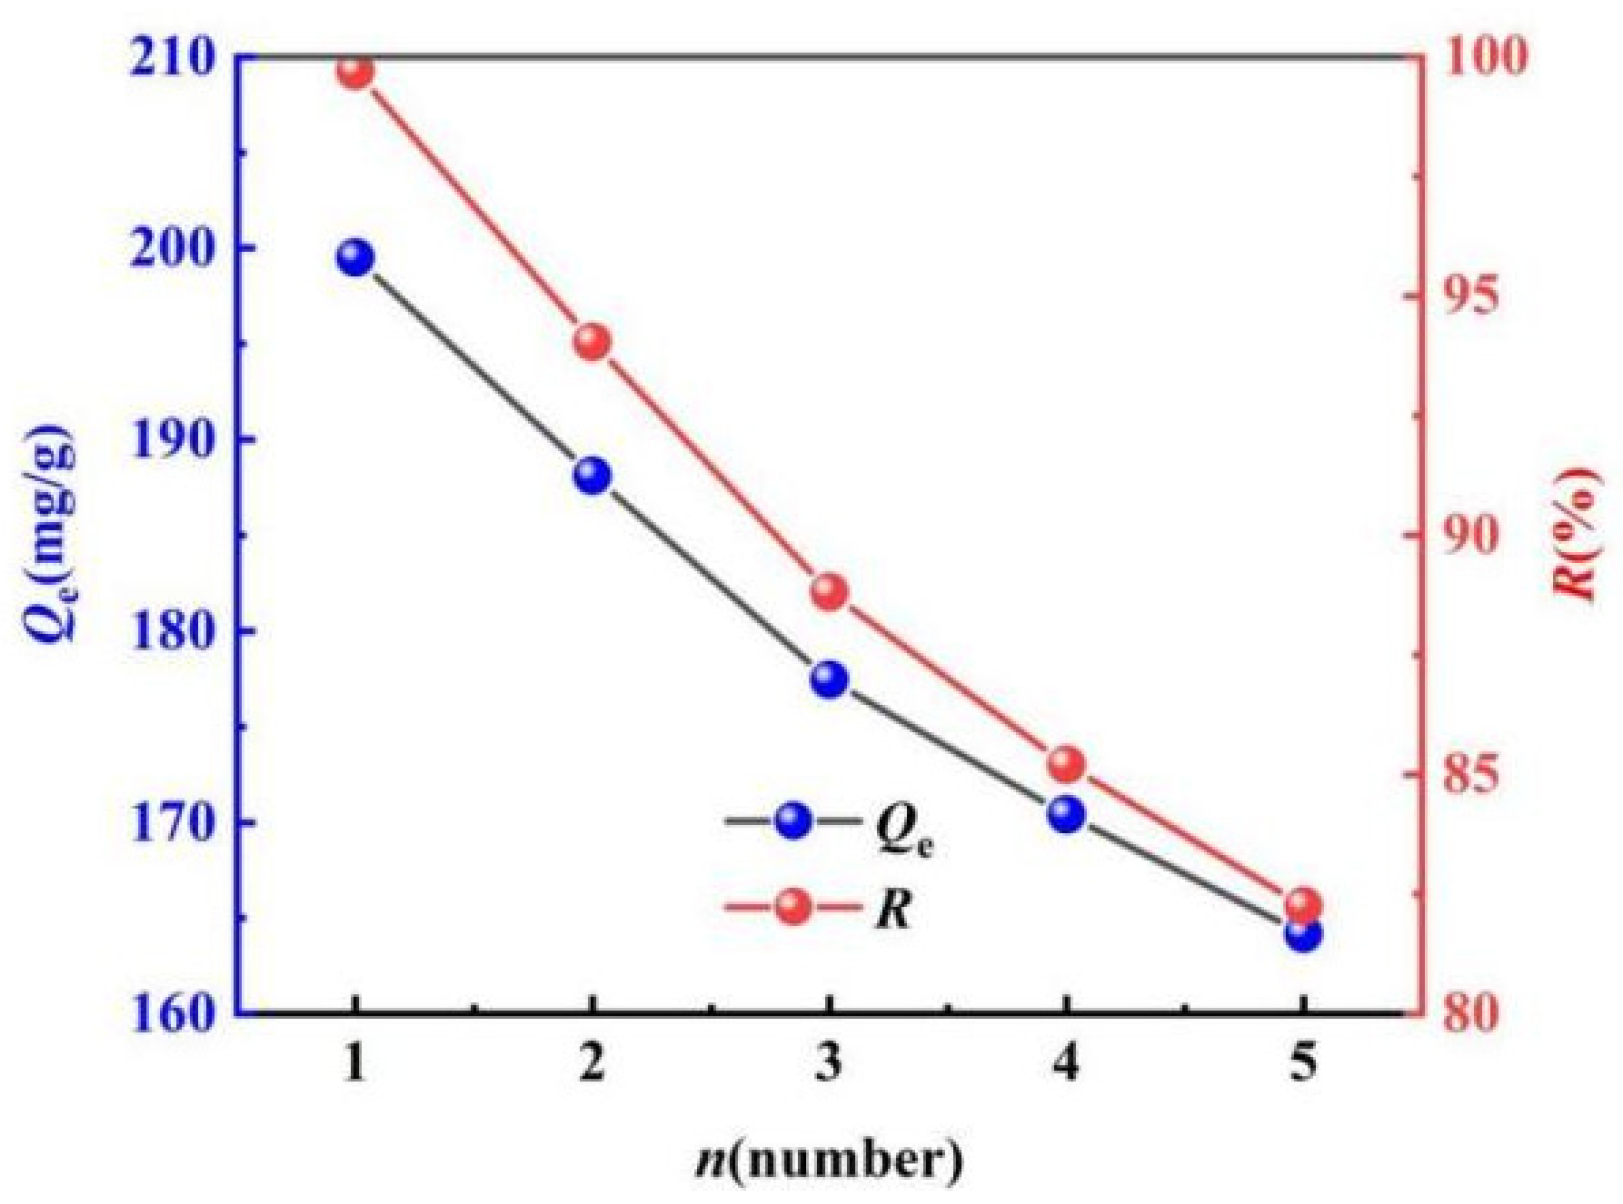
2.3.5. Evaluation of the Regeneration Performance

Taking both the application performance and economy into consideration, the regeneration performance of ML@CS is shown in Figure 8.
MO can be released from ML@CS by exchanging OH with the anion MO, thereby realising the regeneration and reuse of ML@CS. Solid–liquid separation of regenerated ML@CS can be easily performed than that of CS under centrifugation owing to the gravity of the loess. As shown in Figure 8, both Qe and R decreased with the increase of cycle, but Qe and R decreased from 199.52 mg/g and 99.76% to 164.18 mg/g and 82.25% after five cycles, and Qe and R decreased by about 7.06 mg/g and 3.50% after each cycle, respectively, and no significant change was observed in appearance and mechanical strength of ML@CS, indicating that ML@CS has good mechanical strength and regeneration performance. The adsorption efficiency decreased after cyclic regeneration because (1) some adsorption sites adsorbed MO too firmly and it could not be effectively desorbed by sodium hydroxide solution and (2) the structure of ML@CS was partially destroyed during desorption, reducing the number of adsorption sites.

2.4. Analysis of the Desorption Mechanism

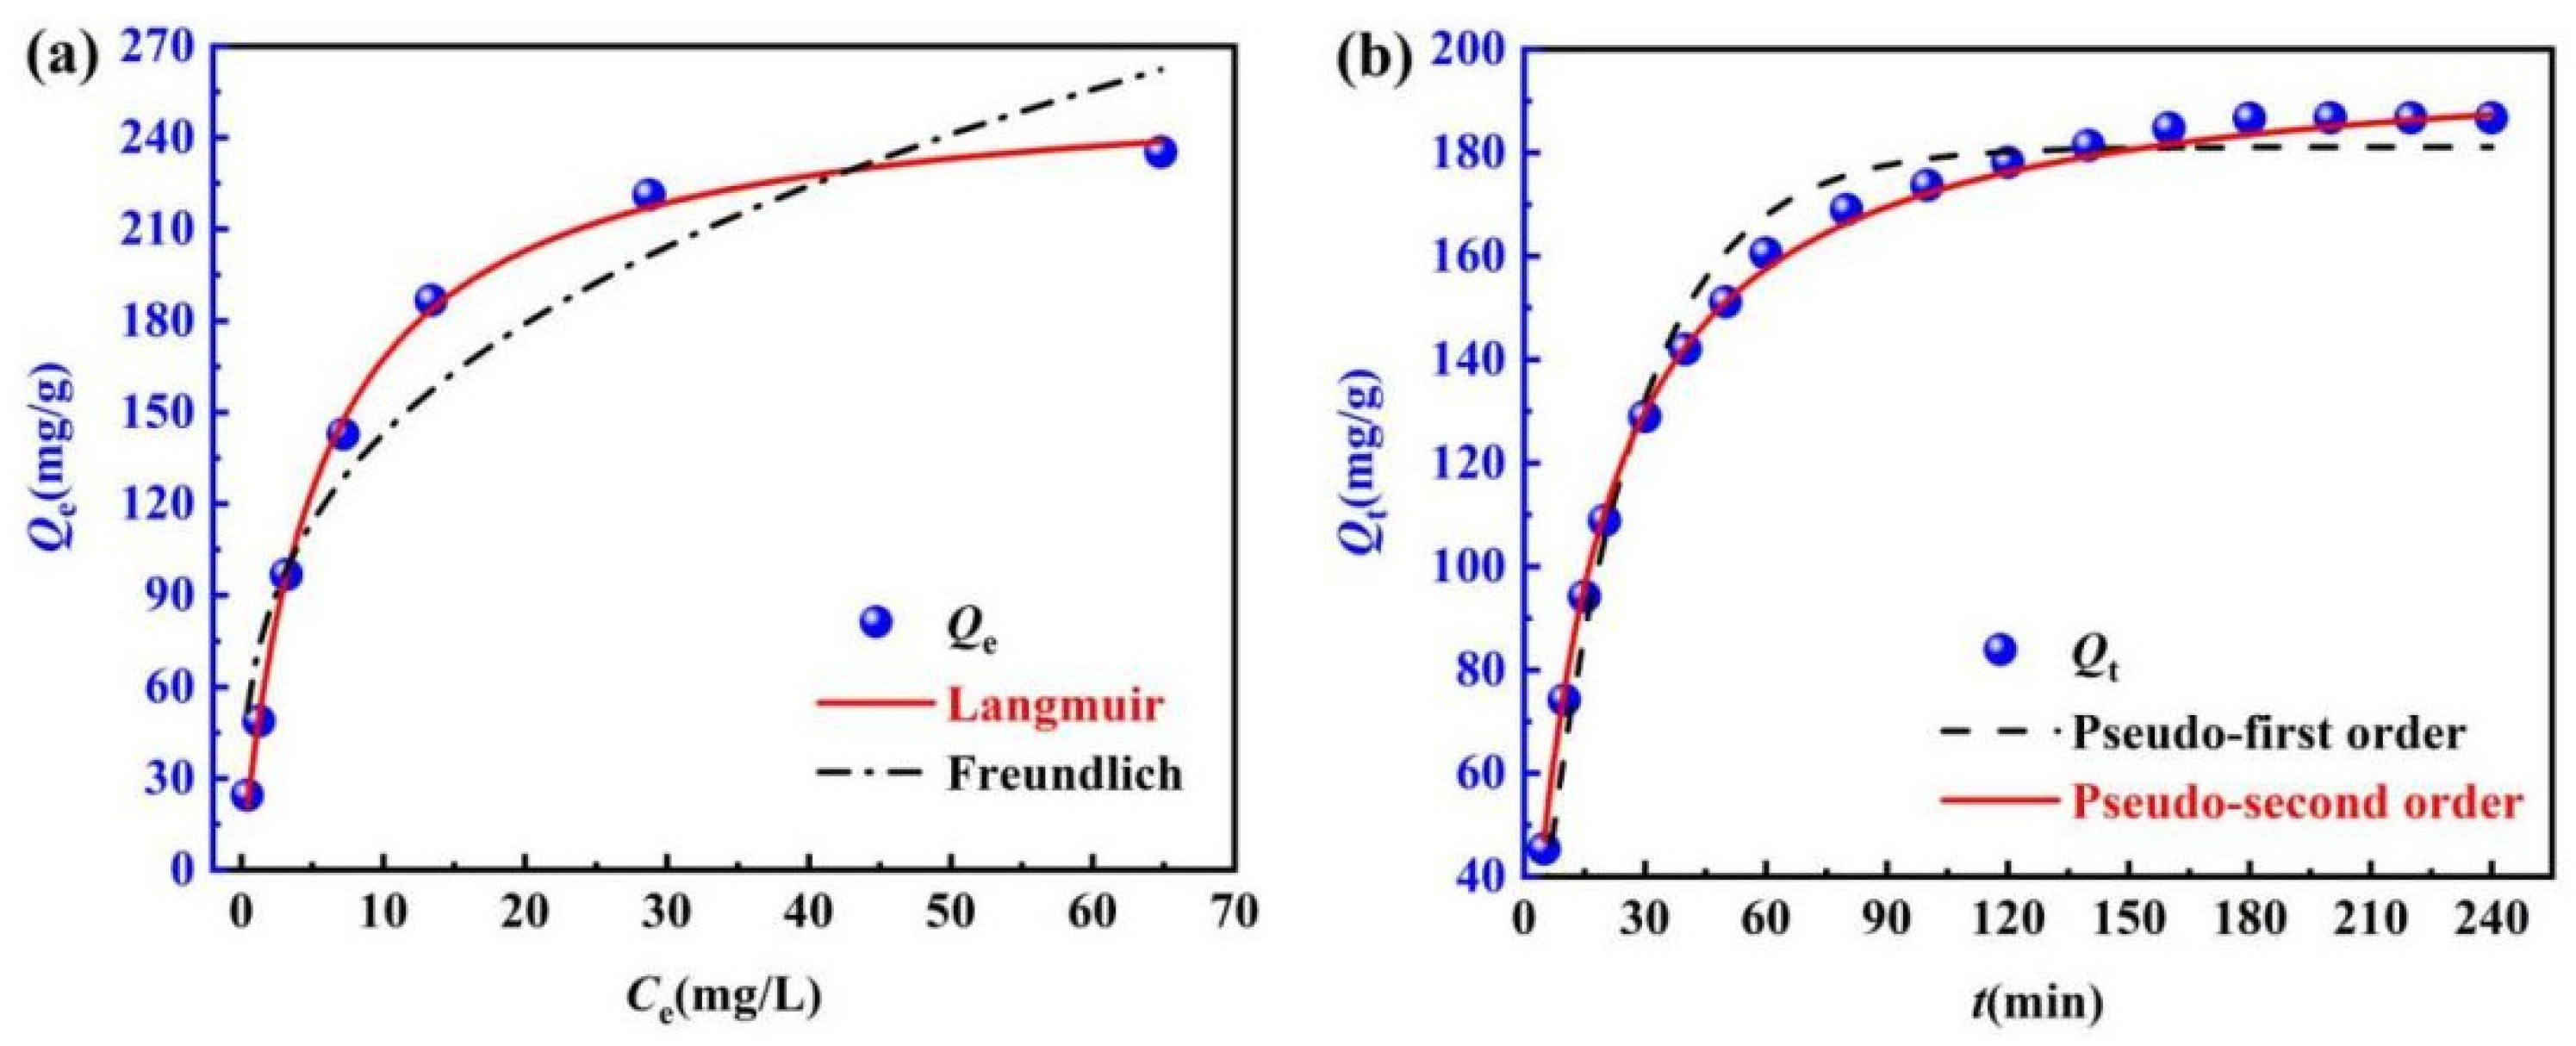
2.4.1. Adsorption Isothermal Analysis

The adsorption isotherm can describe the relationship between the equilibrium concentration of adsorbent and the adsorption amount, and reveal the interaction between adsorbent and adsorbent [38]. Freundlich and Langmuir models are fitted with Matlab and Origin software to the adsorption data, and the results are shown in Figure 9a and Table 2.
Figure 9a shows that the Qe of ML@CS for MO increases with Ce at a certain temperature. Table 2 shows the adsorption parameter 1/n of 0.325 < 0.5 in the Freundlich isotherm model, suggesting adsorption easily occurred [39]. However, the R2 (0.997) of the Langmuir model was significantly higher than that of the Freundlich model (R2= 0.897), and kL (0.189) and RL were in the range of 0–1, indicating that the adsorption behaviour of ML@CS for MO is more suitable to be described using the Langmuir model. It is mainly homogeneous adsorption by single molecular layer, which is conducive to adsorption and there is no interaction between the adsorbed substances [40]. At the adsorption temperature of 25 °C, the Qmax calculated by the Langmuir equation is 259.76 mg/g, which was obviously higher than the saturated adsorption capacity of traditional adsorbents such as activated carbon (113.63 mg/g), activated carbon nanotubes (149 mg/g), and chitosan nanocomposites (93.84 mg/g) for MO at the same temperature [34,41,42]. These results confirmed the excellent adsorption effect of ML@CS for MO.

2.4.2. Analysis of the Adsorption Kinetics

The pseudo-first-order and pseudo-second-order kinetic models are fitted with Matlab and Origin software to the adsorption data at 25 °C, and the results are shown in Figure 9b and Table 3.
Figure 9b and Table 3 show that the pseudo-first-order and pseudo-second-order kinetic models had high correlation coefficients (R2 > 0.95). This indicates that the experimental data agreed well with the results of these models and physical and chemical adsorption may occur. However, the correlation coefficient (R2 = 0.998) of the quasi-second-order kinetic adsorption model was higher than that of the quasi-first-order kinetic model (R2 = 0.977), and the fitted Qe, cal (200.00 m/g) was closer to Qe, exp (199.52 mg/g), signifying that the adsorption behaviour of ML@CS for MO can be better explained using the quasi-second-order kinetic adsorption model.
In conclusion, the adsorption capacity of ML@CS for MO was related to the adsorption sites on its surface. The adsorption rate mainly focused on the chemical adsorption with hydrogen bonding and electrostatic attraction between ML@CS and MO [43] and was supplemented by physical adsorption. The fitting data of adsorption kinetics were consistent with the adsorption isotherm data.

2.4.3. Analysis of Adsorption Mechanism

The findings related to adsorption conditions, adsorption kinetics and adsorption isotherms of ML@CS for MO showed that ML@CS exhibited a distinctive adsorption performance for MO, and adsorption mainly occurred based on monolayer chemical adsorption, wherein the physical adsorption only played an auxiliary role. This is because (1) MO molecules mainly diffused into the ML@CS pores under zero potential, (2) –NH3+ and –OH2+ obtained from the protonation of –OH and –NH2 in ML@CS had strong electrostatic attraction with RSO3 in MO, and (3) –OH in ML@CS can be adsorbed through van der Waals force or hydrogen bonds with highly electronegative O and N atom in MO molecules [35,44]. Figure 10 shows the adsorption mechanism.

3. Materials and Methods

3.1. Materials and Instruments

Loess (30 cm deep under the earth’s surface layer) was collected from Zhangtiegou in Balimiao Village, Wenquan Township, Xifeng District, Qingyang City, and the impurities on the surface were removed before use. Chitosan (deacetylation degree ≥ 95%), MO (Analytical purity, Guoyao Group Chemical Reagent Co., Ltd., Beijing, China), acetic acid, hydrochloric acid, sodium hydroxide, and ethanol were analytically pure (Tianjin Tianli Chemical Reagent Co., Ltd., Tianjin, China). Deionised water was used for the experiments.
The experiment used the following instruments: Fourier transform infrared spectrometer (FTIR-8400S, Shimadzu Corporation, Kyoto, Japan), adsorption specific surface area aperture distributor (Tristar II 3020, Mackbrothers LLC, Charlotte, NC, USA), X-ray diffractometer (D/max-RB, Rigaku Holdings Corporation, Kyoto, Japan), scanning electron microscope (S-3000N, Hitachi High-Technologies Corporation, Kyoto, Japan), Zeta potential analyser (JS94H, Zhongchen Digital Technology Equipment Co., Shanghai, China), thermogravimetric analyser (Q-500, TA Instruments, New Castle, DE, USA), precision pH metre (PHS-3C, Lei Magnetic Instrument Factory, Shanghai, China), ultraviolet–visible spectrophotometer (754N, Aoyi Scientific Instrument Co., Shanghai, China), visible spectrophotometer (722S light Technology Co., Shanghai, China), electric centrifuge (80–1, Danrui Experimental Equipment Co., Changzhou, China), electronic balance (AB204-N, Mettler Ledoequipment Co., Zurich, Switzerland), vacuum-drying oven (DZF-6020, Ganyi Instrument Equipment Co., Shanghai, China), water bath thermostatic oscillator (SHZ-88, Peiying Experimental Equipment Co., Suzhou, China), digital thermostatic water bath (HH-1, Jerer Electric Appliance Co., Changzhou, Jiangsu, China), ultrasonic cleaner (410T, Guanyuan Technology Co., Beijing, China), electro-thermostatic blast oven (DHG-9140A, Aoke Environmental Test Equipment Co., Hangzhou, China), and timer-controlled magnetic stirrer (MYP13-2D, Shanghai Qianjun Scientific Instrument Co., Shanghai, China).

3.2. Loess Modification

A sample of 100.0 g of natural loess ground through 50-mesh sieve was added to 500 mL of deionised water, stirred, and fully dispersed. After standing the mixed system for 120 min, impurities such as suspended solids in the upper layer and fine sand in the bottom were removed, and the loess mud in the middle layer was taken out. The above operation was repeated twice, and finally the loess mud was centrifuged, dried at 110 °C, and ground through a 100-mesh standard sieve to obtain the pre-treated loess powder. The loess powder was then added to 500 mL of 3 mol/L hydrochloric acid, heated to 100 °C under condensation reflux and stirred at 300 r/min for 120 min. After the reaction, the mixture was cooled to room temperature and filtered, and the filter cake was washed repeatedly with deionised water until the filtrate was neutral (pH = 7). The filter cake was then dried at 110 °C to constant weight, ground and passed through a 100-mesh sieve to obtain modified loess (ML).

3.3. Preparation of ML@CS

A total of 2.0 g of CS was added to 100 mL of 5% acetic acid solution and stirred at 70 °C until it was completely dissolved. A small amount of distilled water was added to 10.0 g of the ML. This mixture was dispersed using ultrasonic waves and added to the CS solution. After magnetic stirring at 60 °C for 180 min to fully reaction, the mixture was centrifuged and the solid was collected. The solid was washed repeatedly with deionised water until the filtrate became neutral, and then dried at 80 °C, ground, and passed through a 100-mesh sieve to obtain ML@CS.

3.4. Characterisation of the Prepared Composite

The composition and changes of the materials were characterized by FT-IR spectroscopy (the sample was mixed with standard KBr and pressed into tablets; the scanning range was 400~4400 cm−1). The surface morphology of the composite and the adhesion of CS on ML surface were observed via SEM. Approximately 5 nm-thick gold layer was coated on the sample, and the voltage was 4.9 kV. The phase and crystal structure of the materials were analysed by XRD method (tube potential of 40 kV, tube current of 40 mA, scanning angle of 20°–80°, scanning speed of, 4°/min). The thermal stability of the material was determined via TGA under an N2 atmosphere at 800 °C and 10 °C/min. The Zeta potential of dispersion was also tested.

3.5. Plot of the Standard Curve of MO

A series of MO standard solutions with concentrations (C) of 2, 4, 6, 8, 10, and 12 mg/L were prepared. The 10 mg/L solution was scanned using an ultraviolet–visible spectrophotometer at 300–600 nm, and λmax of MO was determined as 464 nm. Then, distilled water was used as the reference, and the absorbance (A) of the MO standard solutions was measured at λmax using a 722S visible spectrophotometer (the measurement approach of absorbance for the following solution was completely consistent with the aforementioned statement). Taking A as the ordinate and C as the abscissa, the standard curve of A = 0.0714C − 0.0027 (R2 = 0.9993) was plotted.

3.6. Adsorption Tests

3.6.1. Investigation of the Adsorption Conditions

A 50 mL volume of MO solution with a known mass concentration was accurately measured and placed in a 150 mL-conical flask. The pH of solution was adjusted to the set value using 0.1 mol/L HCl or NaOH solution and determined using PHS-3C type precision pH meter (the following methods for adjusting pH were the same), to which a certain amount of ML@CS was added. The conical flask was sealed and shaken at 300 r/min for a certain time in a 25 °C thermostatic oscillator, the resultant mixture was then filtered through a 0.22 μm filter membrane, and the absorbance of the filtrate was determined at λmax. All the experiments were conducted thrice in parallel, and the mean values were obtained. Finally, the mass concentration of MO solution was analysed using the standard curve, and the adsorption capacity Q (mg/g) and removal rate R (%) were calculated according to Equations (1) and (2), respectively, as follows:
Q   = ( C 0 C ) × V W
R = C 0 C C 0 × 100 %
Here, C0 and C are the mass concentrations of MO in the solution before and after adsorption (mg/L), respectively. W is the mass of ML@CS (g) and V is the volume of MO solution (L).
The effects of initial concentration of MO, solution pH, ML@CS dosage, adsorption temperature, and time on the adsorption effect of MO were respectively investigated using Q and R as indexes.

3.6.2. Establishment of the Adsorption Kinetic Model

A 50 mL volume of MO solution with an initial concentration of 200 mg/L was accurately measured, and pH was adjusted to 5.0. After adding 0.05 g ML@CS, the flask was sealed and shaken at a constant temperature of 25 °C (300 r/min), during which samples were taken every 20–240 min. After the sample was filtered through a 0.22 μm filter membrane, and the absorbance of the filtrate was measured at λmax. All the tests were performed thrice in parallel, and the average value was acquired. Qt and Qe were calculated using Equation (1), and the adsorption kinetics were fitted using the pseudo-first-order kinetic model (Equation (3)) and pseudo-second-order kinetic model (Equation (4)).
ln(QeQt) = lnQekft
t Q t = 1 k s Q e 2 + t Q e
Here, Qt and Qe are the adsorption capacities (mg/g) at time t and equilibrium, respectively, t is the adsorption time (min), kf is the pseudo-first-order adsorption rate constant (min−1), and ks is the pseudo-second-order adsorption rate constant (g/mg·min).

3.6.3. Establishment of the Isothermal Adsorption Model

A 50 mL volume of MO solution with an initial concentration of 25–300 mg/L was accurately measured and its pH was adjusted to 5.0, followed by the addition of 0.05 g ML@CS. The flask was then sealed and the solution was shaken (300 r/min) at a constant temperature of 25 °C for 180 min in a thermostatic oscillator. After filtration through a 0.22 μm filter membrane, the absorbance of the filtrate was measured at λmax. All the tests were conducted thrice in parallel and the average value was regarded as the final experimental value. Qe was determined using Equation (1). The isothermal adsorption curve was fitted using Langmuir (Equations (5)) and Freundlich (Equation (6)) models, and the separation factor (RL) was calculated using Equation (7) [45].
C e Q e = 1 k L Q max + C e Q max
ln Q e = ln k F + ln C e n
RL = (1 + kLC0)−1
where C0 and Ce denote the mass concentrations (mg/L) of MO in the solution before adsorption and equilibrium, respectively. Qe denotes the adsorption capacity (mg/g) at adsorption equilibrium, Qmax denotes the maximum adsorption capacity (mg/g) from the point of theory, kL denotes the Langmuir isothermal adsorption constant (L/mg), kF denotes the Freundlich isothermal adsorption constant (mg1−1/n·L1/n/g), n is the Freundlich adsorption coefficient (dimensionless), and RL denotes the separation factor, dimensionless.

3.6.4. Evaluation of Regeneration Performance

Regeneration was an important index for evaluating the adsorption of materials. A superior regeneration performance is conducive to saving resources and reducing production costs. ML@CS saturated with adsorbed MO was added to a 0.5 mol/L NaOH solution, which was shaken at a constant temperature of 25 °C (150 r/min) for 2 h. Then, the product was centrifuged and the resultant solid was washed with ethanol and deionised water 3 to 5 times. The solid was dried at 80 °C to obtain the regenerated ML@CS. Under the optimised adsorption conditions, the regenerated ML@CS was used to adsorb MO until reaching the adsorption equilibrium. Then, the corresponding Qe and R values were calculated.

4. Conclusions

(1) ML@CS adsorption materials were prepared via the solution blending method using loess and chitosan as the main raw materials. ML provided support for CS crosslinking network, which is conducive to improving the stability of CS in an acidic environment, its adsorption, and its mechanical and regeneration properties [46].
(2) ML@CS had a fast adsorption rate, large adsorption capacity, and easy sedimentation and separation for MO. When the initial concentration of MO was 200 mg/L, pH was 5.0, ML@CS dosage was 1.00 g/L at room temperature, and the adsorption time was 180 min, R and Qe reached 99.75% and 199.52 mg/g, respectively, and the theoretical Qmax was 259.76 mg/g. The residual concentration of MO in wastewater after the adsorption treatment was <0.5000 mg/L, which meets the discharge standard.
(3) The adsorption behaviour of MO on ML@CS conformed to the pseudo-second- order kinetic model and Langmuir isothermal adsorption, indicating a spontaneous and exothermic monolayer chemical adsorption process.
(4) The adsorption mechanism of MO on ML@CS was as follows: MO molecules diffused into the pore structure of ML@CS, and an electrostatic attraction occurred between RSO3 in MO molecules and the positive charge on the ML@CS surface. Moreover, -OH on ML@CS formed hydrogen bonds with O and N in MO molecules or through van der Waals Force to finish the adsorption.
(5) ML@CS can be fabricated using abundant raw materials and a simple preparation process. It is economical, has good recycling performance, and does not cause secondary pollution. ML@CS can be used as an anionic dye adsorption material owing to its environmental protection and regeneration properties. These advantages make this a potential application prospect in the field of printing and dyeing wastewater treatment.

Author Contributions

Conceptualization, experimental design, H.H. (Haobin Hu); methodology, validation, H.S.; investigation, writing—original draft, Z.C.; data curation, writing— review & editing, Y.W.; validation, investigation, review, Q.Z.; resources, project administration, H.H. (Huaisheng Hu); formal analysis, supervision, L.Z. All authors have read and agreed to the published version of the manuscript.

Funding

This study was funded the Industry Support Plan Project of Higher Education of Gansu Province (2022CYZC-66), the Key Research and Development Program of Gansu Province (21YF5GM097), the Natural Science Foundation Project of Gansu Province (23JRRM732), the University Youth Doctor Fund Project of Gansu Province (2022QB-169).

Institutional Review Board Statement

Not applicable.

Informed Consent Statement

Not applicable.

Data Availability Statement

No new data were created or analyzed in this study. Data sharing is not applicable to this article.

Conflicts of Interest

The authors declare no conflict of interest.

References

  1. Tanhaei, B.; Ayati, A.; Lahtinen, M. Preparation and characterization of a novel chitosan/Al2O3/magnetite nanoparticles composite adsorbent for kinetic, thermodynamic and isotherm studies of methyl orange adsorption. Chem. Eng. J. 2015, 259, 1–10. [Google Scholar] [CrossRef]
  2. Saratale, R.G.; Saratale, G.D.; Chang, J.S.; Govindwar, S.P. Bacterial decolorization and degradation of azo dyes: A review. J. Taiwan Inst. Chem. Eng. 2011, 42, 138–157. [Google Scholar] [CrossRef]
  3. Darwish, A.A.A.; Rashad, M.; AL-Aoh, H.A. Methyl orange adsorption comparison on nanoparticles: Isotherm, kinetics, and thermodynamic studies. Dyes Pigments 2019, 160, 563–571. [Google Scholar] [CrossRef]
  4. Ou, H.; Chen, Q.; Pan, J.; Zhang, Y.; Huang, Y.; Qi, X. Selective removal of erythromycin by magnetic imprinted polymers synthesized from chitosan-stabilized Pickering emulsion. J. Hazard. Mater. 2015, 289, 28–37. [Google Scholar] [CrossRef] [PubMed]
  5. Verma, A.K.; Dash, R.R.; Bhunia, P. A review on chemical coagulation/flocculation technologies for removal of colour grom textile wastewaters. J. Environ. Manag. 2012, 93, 154–168. [Google Scholar] [CrossRef]
  6. Salama, A. Polysaccharides/silica hybrid materials: New perspectives for sustainable raw materials. J. Carbohyd. Chem. 2016, 35, 131–149. [Google Scholar] [CrossRef]
  7. Xu, L.; Huang, Y.A.; Zhu, Q.J.; Ye, C. Chitosan in molecularlyimprinted polymers: Current and future prospects. Int. J. Mol. Sci. 2015, 16, 18328–18347. [Google Scholar] [CrossRef]
  8. Dai, Y.; Zhou, L.; Tang, X.; Xi, J.; Ouyang, J.; Liu, Z.; Huang, G.; Adesina, A.A. Macroporous ion-imprinted chitosan foams for the selective biosorption of U(VI) from aqueous solution. Int. J. Biol. Macromol. 2020, 164, 4155–4164. [Google Scholar] [CrossRef]
  9. Ye, X.; Shang, S.; Zhao, Y.; Cui, S.; Zhong, Y.; Huang, L. Ultra-efficient adsorption of copper ions in chitosan-montmorillo nite composite aerogel at wastewater treatment. Cellulose 2021, 28, 7201–7212. [Google Scholar] [CrossRef]
  10. Ngah, W.S.W.; Teong, L.C.; Hanafiah, M.A.K.M. Adsorption of dyes and heavy metal ions by chitosan composites: A review. Carbohyd. Polym. 2011, 83, 1446–1456. [Google Scholar] [CrossRef]
  11. Ma, G.F.; Ran, F.; Yang, Q.; Feng, E.; Lei, Z.Q. Eco-friendly superabsorbent composite based on sodium alginate and organo-loess with high swelling properties. RSC Adv. 2015, 5, 53819–53828. [Google Scholar] [CrossRef]
  12. Juang, C.H.; Dijkstra, T.; Wasowski, J.; Meng, X.M. Loess geohazards research in China: Advances and challenges for mega engineering projects. Eng. Geol. 2019, 251, 1–10. [Google Scholar] [CrossRef]
  13. Xing, S.; Zhao, M.; Ma, Z. Removal of heavy metal ions from aqueous solution using red loess as an adsorbent. J. Environ. Sci. 2011, 23, 1497–1502. [Google Scholar] [CrossRef]
  14. He, L.; Huang, Y.; Xie, Z.; Guan, W.; Zeng, Y. Adsorption characteristics of iron on different layered loess soils. Int. J. Environ. Res. Public Health 2022, 19, 16653. [Google Scholar] [CrossRef] [PubMed]
  15. He, Y.F.; Zhang, L.; Wang, R.M.; Li, H.R.; Wang, Y. Loess clay based copolymer for removing Pb (II) ions. J. Hazard. Mater. 2012, 227/228, 334–340. [Google Scholar] [CrossRef]
  16. Hu, H.; Cheng, Z.; Song, H.; Li, H.; Wang, H.; Wang, Y.; Zhang, Q.; Lu, Y. Preparation and properties of loess-based hydrophobic materials. Mater. Chem. Phys. 2023, 305, 127962. [Google Scholar] [CrossRef]
  17. Li, G.Y.; Hou, X.; Mu, Y.H.; Ma, W.; Wang, F.; Zhou, Y.; Mao, Y.C. Engineering properties of loess stabilized by a type of eco-material, calcium lignosulfonate. Arab. J. Geosci. 2019, 12, 1–10. [Google Scholar] [CrossRef]
  18. Liu, L.; Bao, C.L.; Jia, Q.; Xiao, P.F.; Liu, X.T.; Zhang, Q.P. Preparation and characterization of chitosan graphene oxide composites for the adsorption of Au(III) and Pd(II). Talanta 2012, 93, 350–357. [Google Scholar] [CrossRef]
  19. Du, J.Y.; Sun, J.Z.; Zhang, D.H. Preparation of modified zeolite/chitosan composites and study on the adsorption performance of Pb2+. Polym. Eng. Sci. 2023, 64, 196–206. [Google Scholar] [CrossRef]
  20. Reddy, D.H.K.; Lee, S.M. Application of magnetic chitosan composites for the removal of toxic metal and dyes from aqueous solutions. Adv. Colloid Interfac. 2013, 201–202, 68–93. [Google Scholar] [CrossRef]
  21. Pawlak, A.; Mucha, M. Thermogravimetric and FTIR studies of chitosan blends. Thermochim. Acta 2003, 396, 153–166. [Google Scholar] [CrossRef]
  22. Tsai, F.C.; Ma, N.; Chiang, T.C.; Tsai, L.C.; Shi, J.J.; Xia, Y.; Jiang, T.; Su, S.K.; Chuang, F.S. Adsorptive removal of methyl orange from aqueous solution with crosslinking chitosan microspheres. J. Water Process Eng. 2014, 1, 2–7. [Google Scholar] [CrossRef]
  23. Sutar, D.S.; Narayanam, P.K.; Singh, G.; Botcha, V.D.; Talwar, S.S.; Srinivasa, R.S.; Major, S.S. Spectroscopic studies of large sheets of graphene oxide and reduced graphene oxide monolayers prepared by Langmuir-Blodgett technique. Thin Solid Films 2012, 520, 5991–5996. [Google Scholar] [CrossRef]
  24. Wang, Y.; Tang, X.; Chen, Y.; Zhan, L. Adsorption behavior and mechanism of Cd (II) on loess soil from China. J. Hazard. Mater. 2009, 172, 30–37. [Google Scholar] [CrossRef]
  25. Tang, X.; Liu, J.; Wang, Y. Adsorption behavior and mechanism of loess soil towards chromium ion. Rock Soil Mech. 2013, 34, 2136–2142. [Google Scholar]
  26. Liao, B.; Sun, W.; Guo, N.; Ding, S.; Su, S. Comparison of Co2+ adsorption by chitosan and its triethylene-tetramine derivative: Performance and mechanism. Carbohyd. Polym. 2016, 151, 20–28. [Google Scholar] [CrossRef]
  27. Yao, W.; Yu, S.J.; Wang, J.; Zou, Y.D.; Lu, S.S.; Ai, Y.J.; Alharbi, N.S.; Alsaedi, A.; Hayat, T.; Wang, X. Enhanced removal of methyl orange on calcined glycerol-modified nanocrystallined Mg/Al layered double hydroxides. Chem. Eng. J. 2017, 307, 476–486. [Google Scholar] [CrossRef]
  28. Jiang, Y.; Liu, B.; Xu, J.; Pan, K.; Hou, H.; Hu, J.; Yang, J. Cross-linked chitosan/β-cyclodextrin composite for selective removal of methyl orange: Adsorption performance and mechanism. Carbohyd. Polym. 2018, 182, 106–114. [Google Scholar] [CrossRef]
  29. Li, K.; Li, P.; Cai, J.; Xiao, S.; Yang, H.; Li, A. Efficient adsorption of both methyl orange and chromium from their aqueous mixtures using a quaternary ammonium salt modified chitosan magnetic composite adsorbent. Chemosphere 2016, 154, 310–318. [Google Scholar] [CrossRef]
  30. Ou, C.Y.; Zhang, C.H.; Li, S.D.; Yang, L.; Dong, J.J.; Mo, X.L.; Zeng, M.T. Thermal degradation kinetics of chitosan-cobalt complex as studied by thermogravimetric analysis. Carbohyd. Polym. 2010, 82, 1284–1289. [Google Scholar] [CrossRef]
  31. Maneerung, T.; Liew, J.; Dai, Y.; Kawi, S.; Chong, C.; Wang, C.H. Activated carbon derived from carbon residue from biomass gasification and its application for dye adsorption: Kinetics, isotherms and thermodynamic studies. Bioresour. Technol. 2016, 200, 350–359. [Google Scholar] [CrossRef] [PubMed]
  32. Anbia, M.; Hariri, S.A.; Ashrafizadeh, S.N. Adsorptive removal of anionic dyes by modified nanoporous silica SBA-3. Appl. Surf. Sci. 2010, 256, 3228–3233. [Google Scholar] [CrossRef]
  33. Hu, Y.; Quan, C.; Guo, M.; Ye, X.; Wu, Z. Competitive adsorption of methyl orange and ethyl orange by AB-8 resin. Emerg. Mater. Res. 2017, 6, 369–377. [Google Scholar] [CrossRef]
  34. Haque, E.; Jun, J.W.; Jhung, S.H. Adsorptive removal of methyl orange and methylene blue from aqueous solution with a metal-organic framework material, iron terephthalate (MOF-235). J. Hazard. Mater. 2011, 185, 507–511. [Google Scholar] [CrossRef]
  35. Zhang, R.; Zhang, J.; Zhang, X.; Dou, C.; Han, R. Adsorption of Congo red from aqueous solutions using cationic surfactant modified wheat straw in batch mode: Kinetic and equilibrium study. J. Taiwan Inst. Chem. Eng. 2014, 45, 2578–2583. [Google Scholar] [CrossRef]
  36. Liu, X.; Luo, J.; Zhu, Y.; Yang, Y.; Yang, S. Removal of methylene blue from aqueous solutions by an adsorbent based on metal-organic framework and polyoxometalate. J. Alloys Compd. 2015, 648, 986–993. [Google Scholar] [CrossRef]
  37. Zhang, H.; Wang, X.; Liang, H.; Tan, T.; Wu, W. Adsorption behavior of Th (IV) onto illite: Effect of contact time, pH value, ionic strength, humic acid and temperature. Appl. Clay. Sci. 2016, 127–128, 35–43. [Google Scholar]
  38. Adeyinka, G.C.; Moodley, B. Kinetic and thermodynamic studies on partitioning of polychlorinated biphenyls (PCBs) between aqueous solution and modeled individual soil particle grain sizes. J. Environ. Sci. 2019, 76, 100–110. [Google Scholar] [CrossRef]
  39. Meitei, M.D.; Prasad, M.N.V. Adsorption of Cu(II), Mn(II) and Zn (II) by Spirodela polyrhiza (L.) schleiden: Equilibrium, kinetic and thermodynamic studies. Ecol. Eng. 2014, 71, 308–317. [Google Scholar] [CrossRef]
  40. Mittal, A.; Malviya, A.; Kaur, D.; Mittal, J.; Kurup, L. Studies on the adsorption kinetics and isotherms for the removal and recovery of methyl orange from wastewaters using waste materials. J. Hazard. Mater. 2007, 148, 229–240. [Google Scholar] [CrossRef]
  41. Khattabi, E.H.E.; Rachdi, Y.; Bassam, R.; Mourid, E.H.; Naimi, Y.; Alouani, M.E.; Belaaouad, S. Enhanced elimination of methyl orange and recycling of an eco-friendly adsorbent activated carbon. Russ. J. Phys. Chem. B. 2021, 15, S149–S159. [Google Scholar] [CrossRef]
  42. Ma, J.; Yu, F.; Lu, Z.; Jin, L.; Yang, M.X.; Luan, J.S.; Tang, Y.H.; Fan, H.B.; Yuan, Z.W.; Chen, J.H. Enhanced adsorptive removal of methyl orange and methylene blue from aqueous solution by alkali-activated multiwalled carbon nanotubes. ACS Appl. Mater. Interfaces 2012, 4, 5749–5760. [Google Scholar] [CrossRef] [PubMed]
  43. Zhang, T.; Yang, Y.; Li, X.; Jiang, Y.; Wang, N.; Ji, S.; Zhou, Z. Adsorption characteristics and mechanism of azo dyes by powdered activated carbon. J. Cent. South Univ. 2019, 50, 2938–2947. [Google Scholar]
  44. Mohammad, F.; Hossein, A.; Mohamad, E.; Ghadir, N.; Bettina, R. Experimental study on the adsorptive behavior of Congo red in cationic surfactant-modified tea waste. Process Saf. Environ. Prot. 2015, 95, 226–236. [Google Scholar]
  45. Annadurai, G.; Ling, L.Y.; Lee, J.-F. Adsorption of reactive dye from an aqueous solution by chitosan: Isotherm, kinetic and thermodynamic analysis. J. Hazard. Mater. 2008, 152, 337–346. [Google Scholar] [CrossRef]
  46. Dong, Z.; Xu, H.; Bai, Z.S.; Wang, H.Z.; Zhang, L.; Luo, X.J.; Tang, Z.Y.; Luque, R.; Xuan, J. Microfluidic synthesis of high performance monodispersed chitosan microparticles for methyl orange adsorption. RSC Adv. 2015, 5, 78352–78360. [Google Scholar] [CrossRef]
Figure 1. Appearance of ML@CS.
Molecules 29 05052 g001
Figure 2. SEM images of ML and ML@CS.
Molecules 29 05052 g002
Figure 3. Effect of pH on Zeta potentials of ML@CS. The red line means the Zeta potential is 0.
Molecules 29 05052 g003
Figure 4. XRD patterns of the samples.
Molecules 29 05052 g004
Figure 5. FT-IR spectra of the samples.
Molecules 29 05052 g005
Figure 6. TGA curves of the samples.
Molecules 29 05052 g006
Figure 7. Effects of various factors on MO adsorption. (a) Effect of initial concentration at 0.05 g WML@CS, pH 5.0, 25 °C and 180 min, respectively. (b) Effect of WML@CS at pH 5.0, 200 mg/L, 25 °C and 180 min, respectively. (c) Effect of pH at 0.05 g WML@CS, 200 mg/L, 25 °C and 180 min, respectively. (d) Effect of adsorption time and adsorption temperature at pH 5.0, 0.05 g WML@CS, 200 mg/L, respectively.
Molecules 29 05052 g007
Figure 8. Recycling effect of ML@CS.
Molecules 29 05052 g008
Figure 9. Adsorption curves and fitting graphs of MO by ML@CS. (a) Adsorption isotherms. (b) Adsorption kinetics.
Molecules 29 05052 g009
Figure 10. Adsorption mechanism of MO by ML@CS. The yellow oval and the structure in it represent ML@CS, and the surface –OH, –NH2, –OH2+, –NH3+ and –O– form electrostatic and hydrogen bonds with MO.
Molecules 29 05052 g010
Table 1. BET parameters of ML and ML@CS.
MaterialsSpecific Surface Area/(m2/g)Mean Pore Volume/(cm3/g)Mean Aperture/
nm
ML10.630.2282.43
ML@CS59.340.2072.25
Table 2. Fitting parameters of adsorption isotherm models of MO by ML@CS.
T/KFreundlichLangmuir
kF/(mg1−1/n·L1/n/g)1/nR2Qmax/(mg/g)kL/(L/mg)R2
29867.610.3250.897259.760.1890.997
Table 3. Fitting parameters of the adsorption kinetics models of MO by ML@CS.
C0/
(mg/L)
Qe, exp/
(mg/g)
Pseudo-First-OrderPseudo-Second-Order
kf/min−1Qe/(mg/g)R2ks/(g/mg·min)Qe/(mg/g)R2
200199.520.044181.130.9770.0003200.000.998
Disclaimer/Publisher’s Note: The statements, opinions and data contained in all publications are solely those of the individual author(s) and contributor(s) and not of MDPI and/or the editor(s). MDPI and/or the editor(s) disclaim responsibility for any injury to people or property resulting from any ideas, methods, instructions or products referred to in the content.

