
The Autocatalytic Chemical Reaction of a Soluble Biopolymer Derived from Municipal Biowaste

 ,
,  , and
, and
Abstract

1. Introduction
1.1. Processes and Products for the Valorisation of Municipal Biowaste as Feedstock
1.2. The Stake of Further Research for the Valorisation of Municipal Biowaste as Feedstock
1.3. The Autocatalysis Concept
2. Results
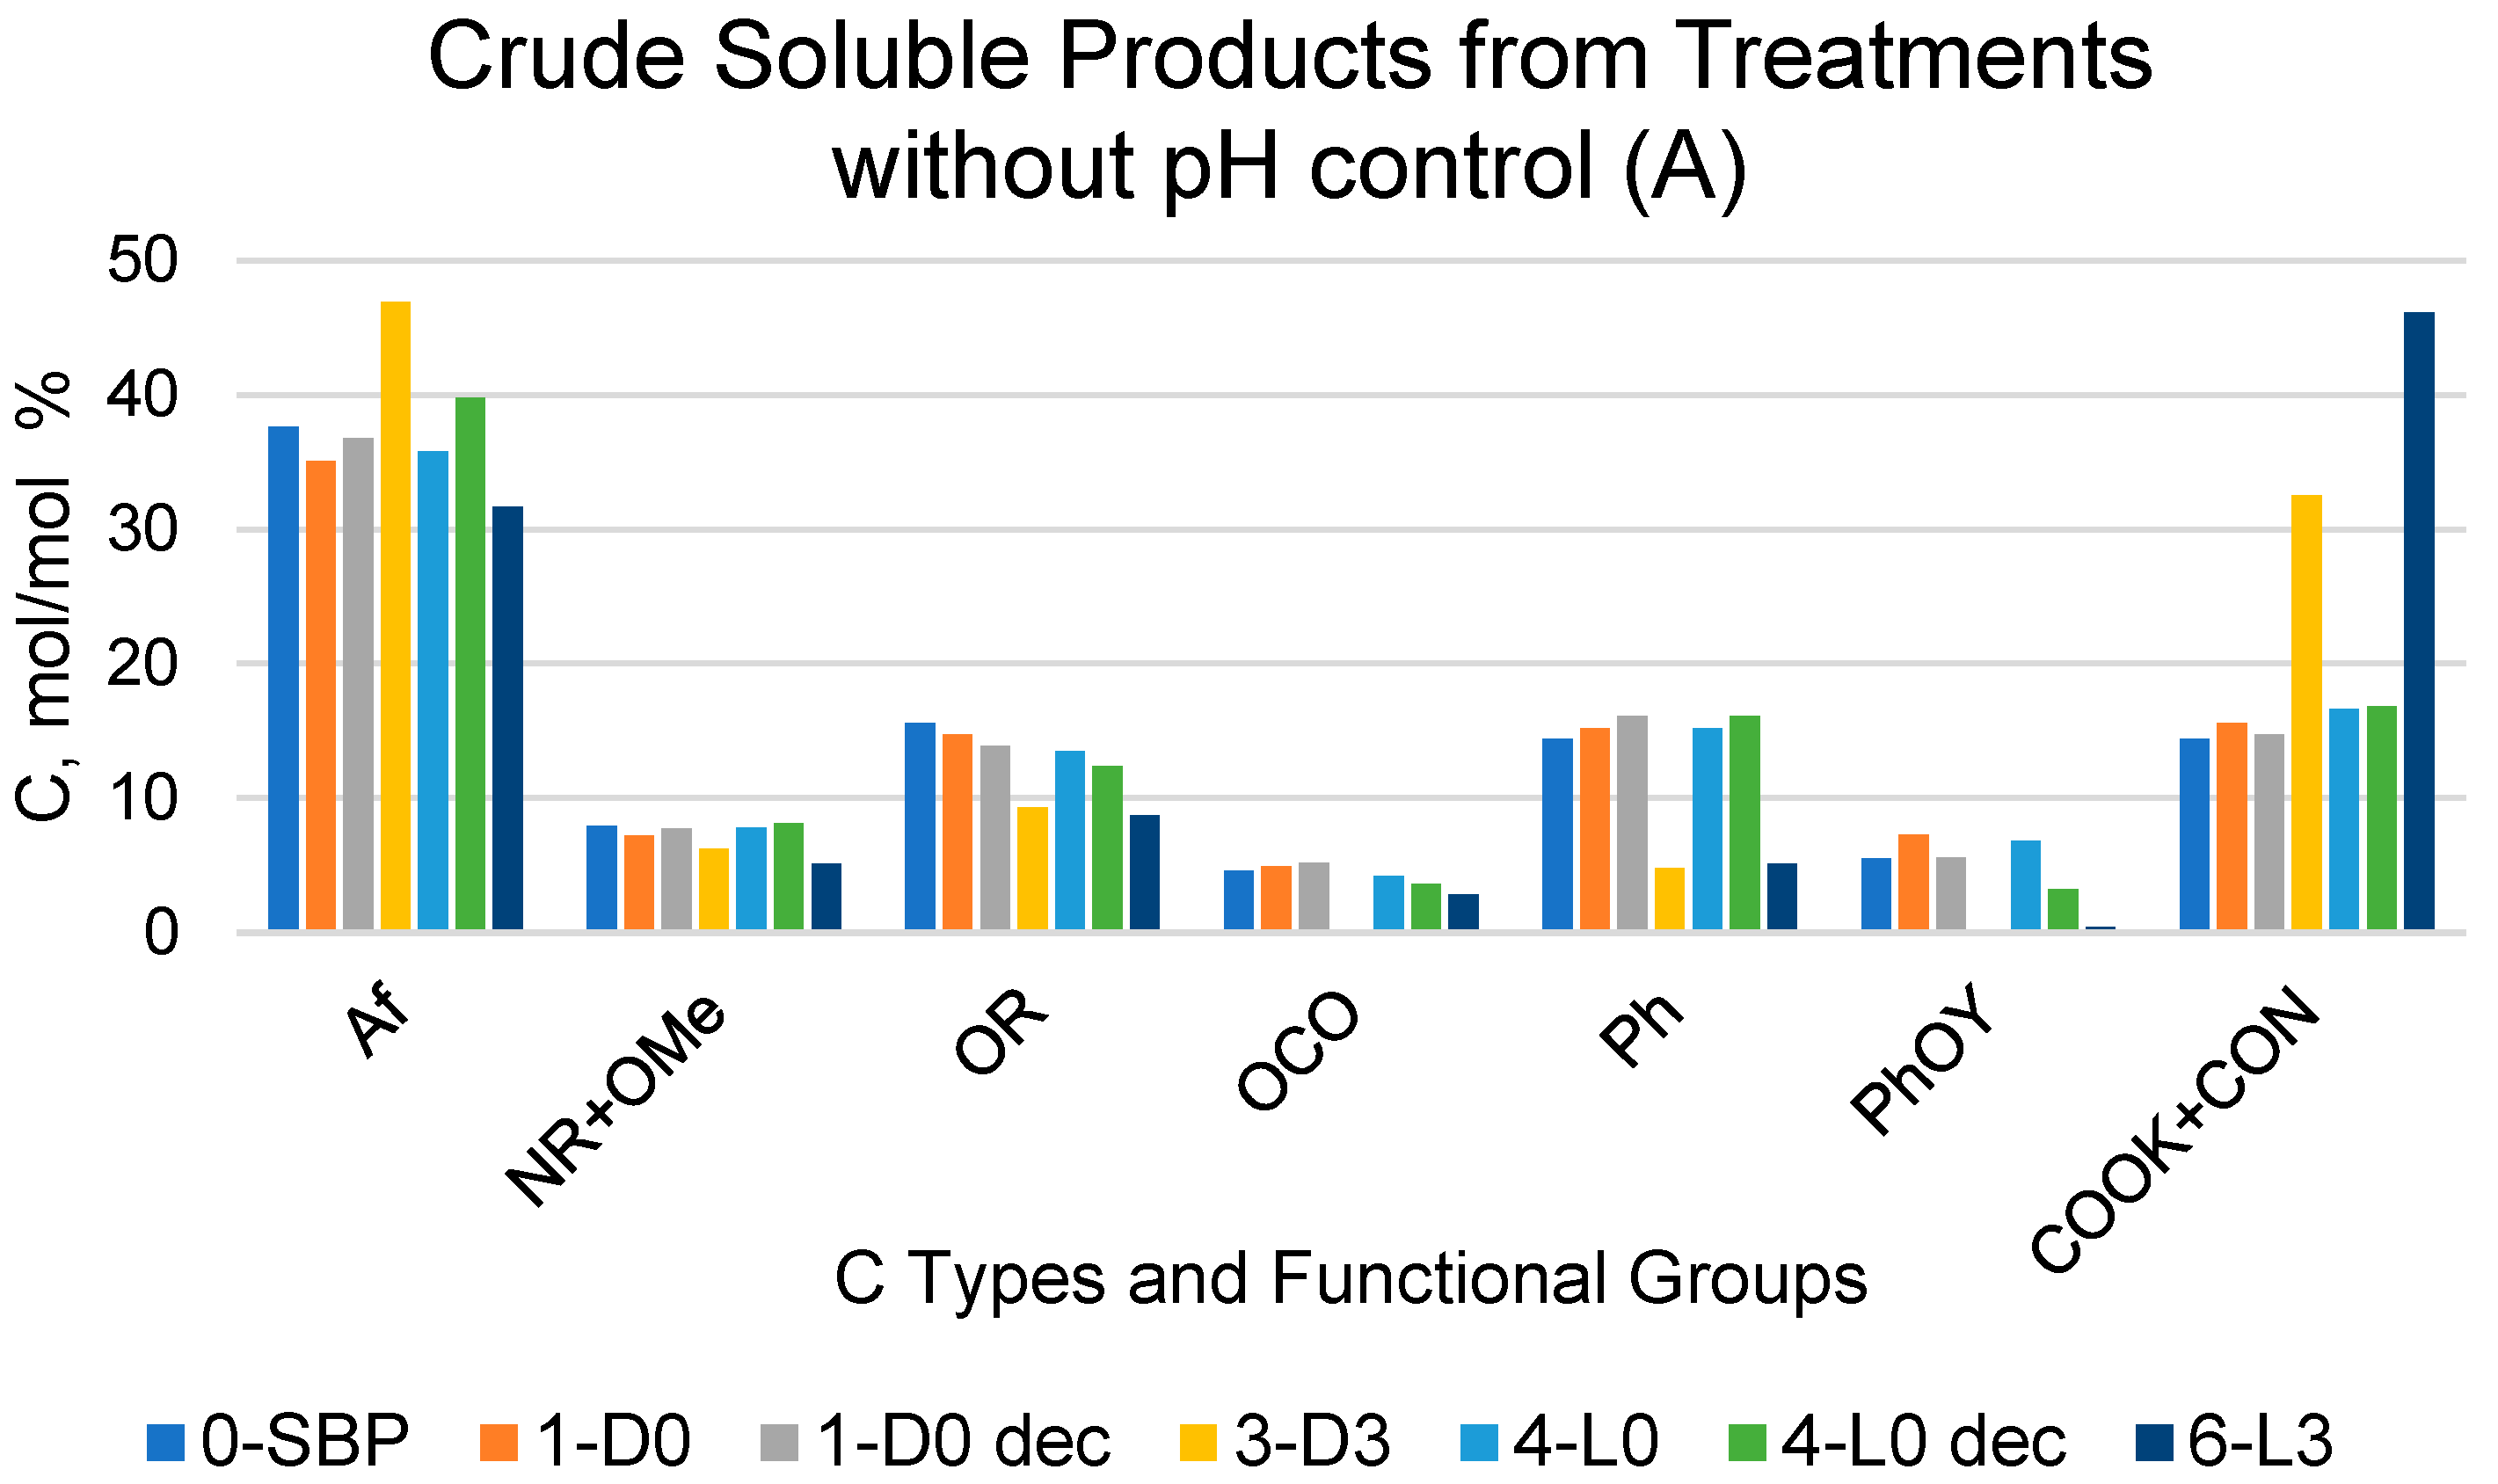
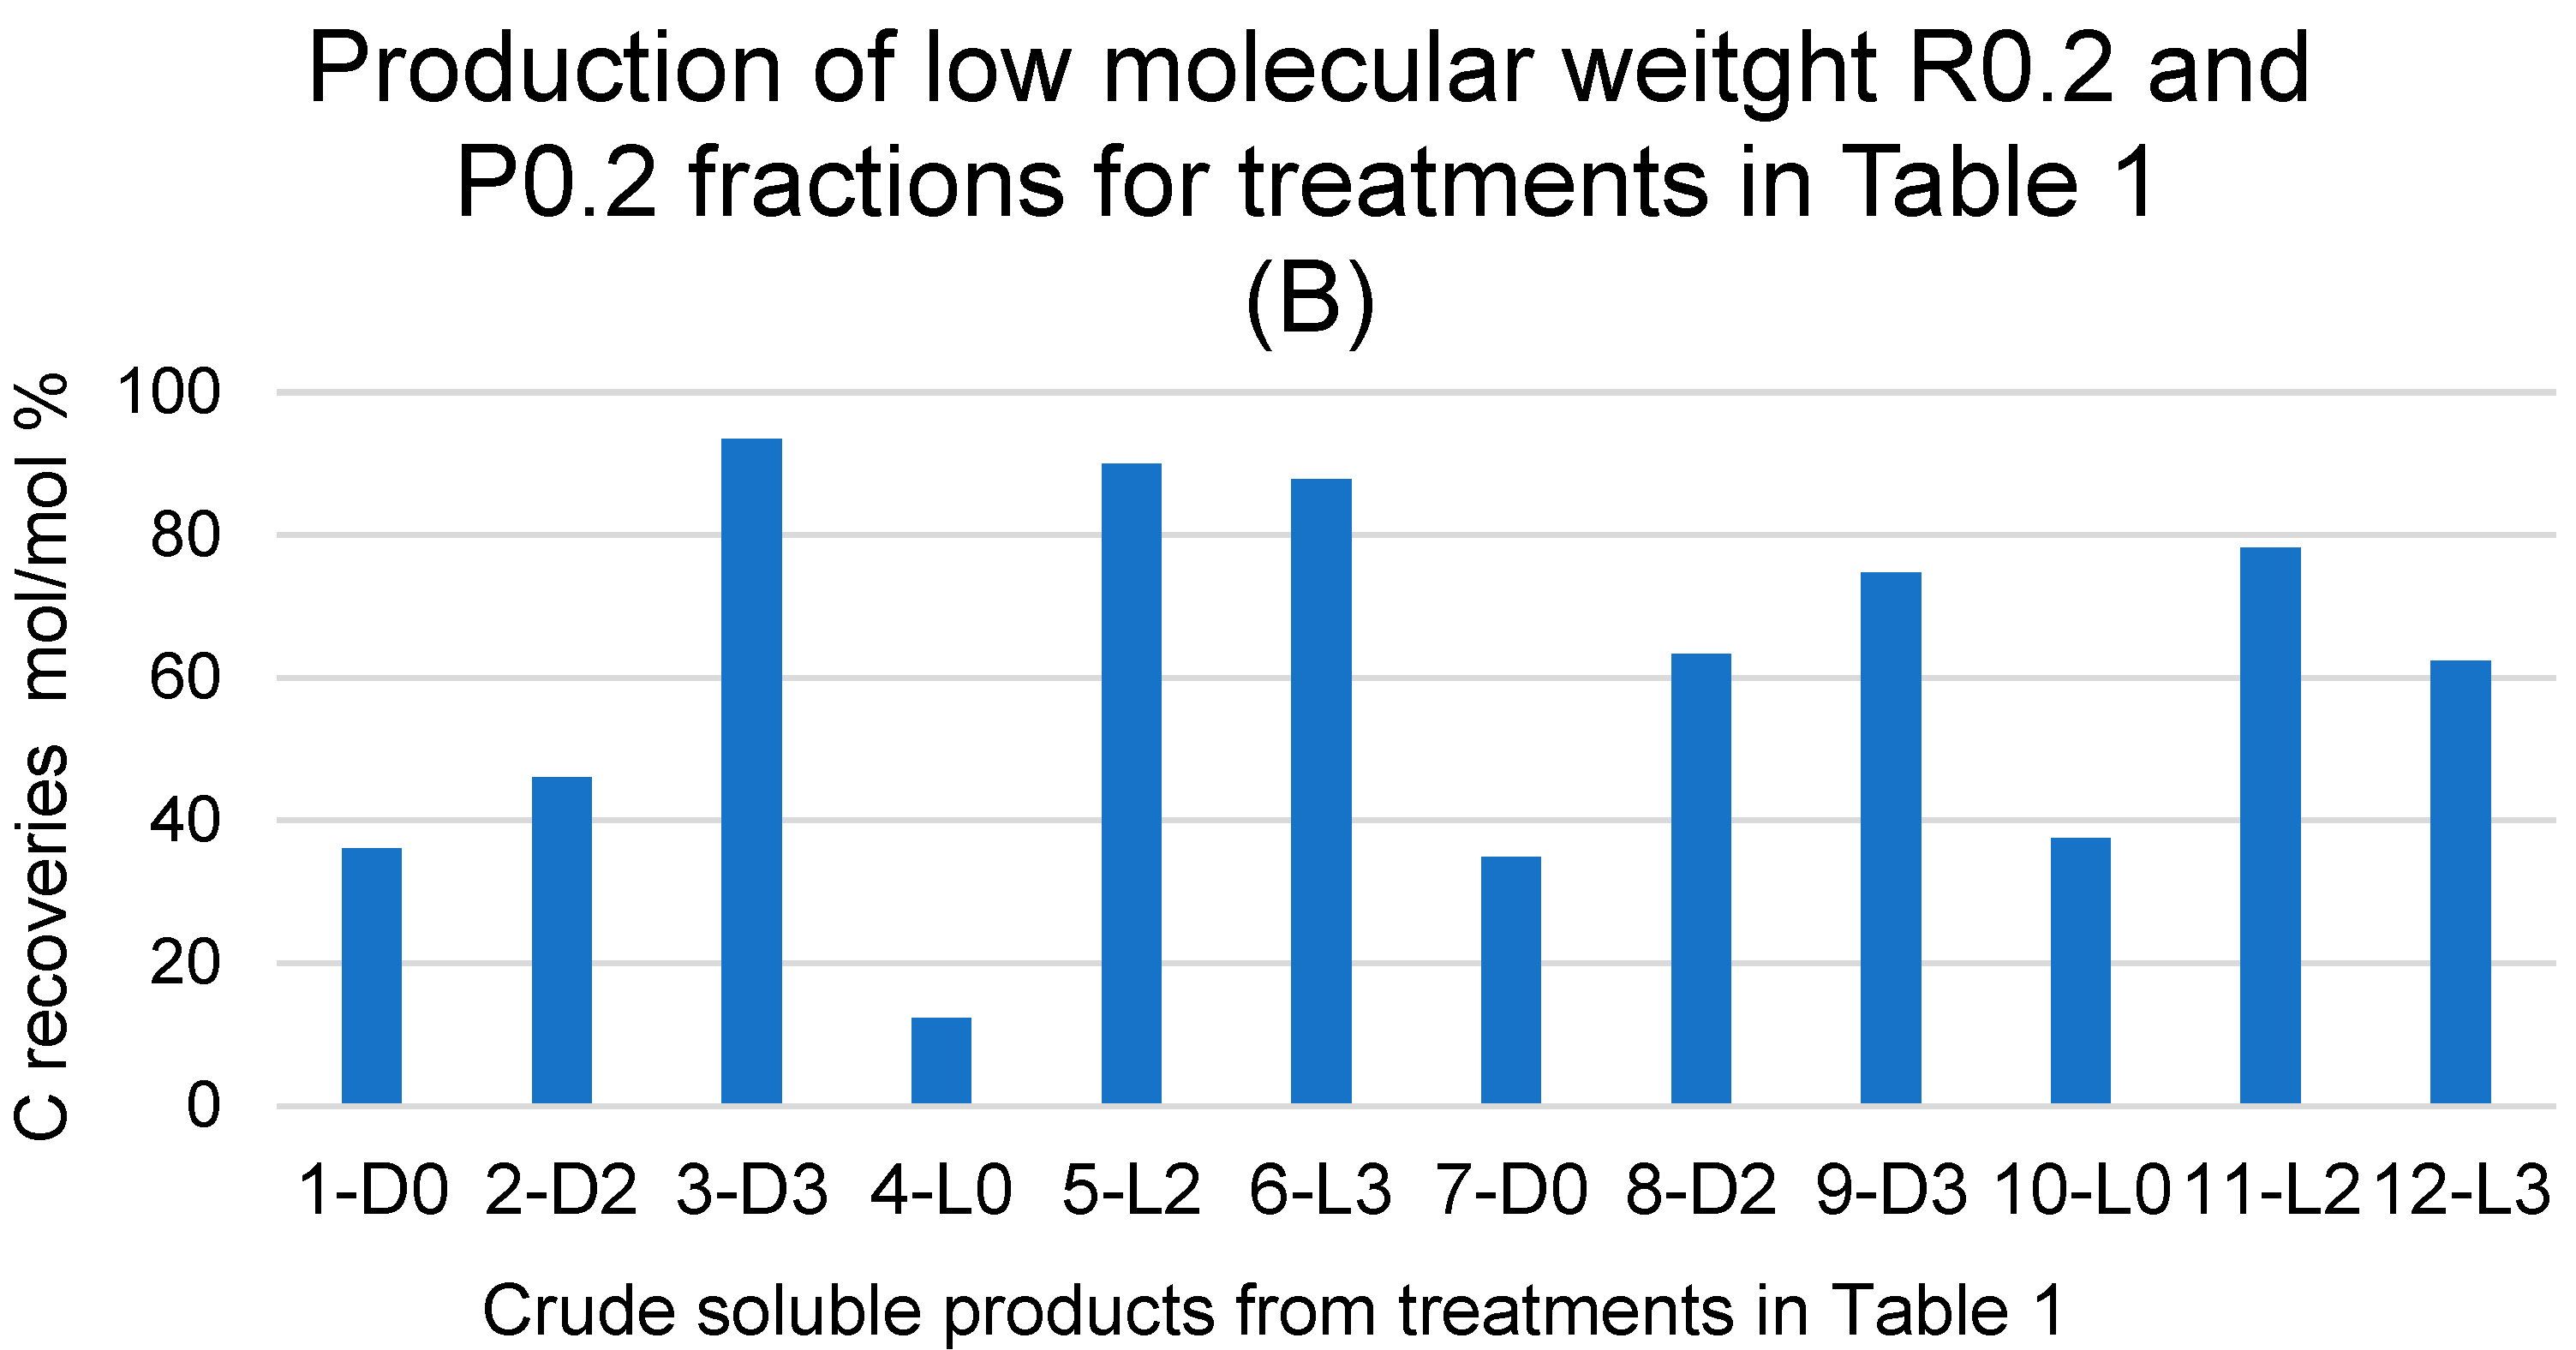
2.1. Treatments of SBP and Recoveries of C in Crude Soluble Products
2.2. Recoveries of Soluble Organic C and CO2 for Treatments in Absence of Added H2O2
2.3. Molecular Weight Distribution in Pristine SBP and Crude Soluble Products Obtained in Absence of Added H2O2
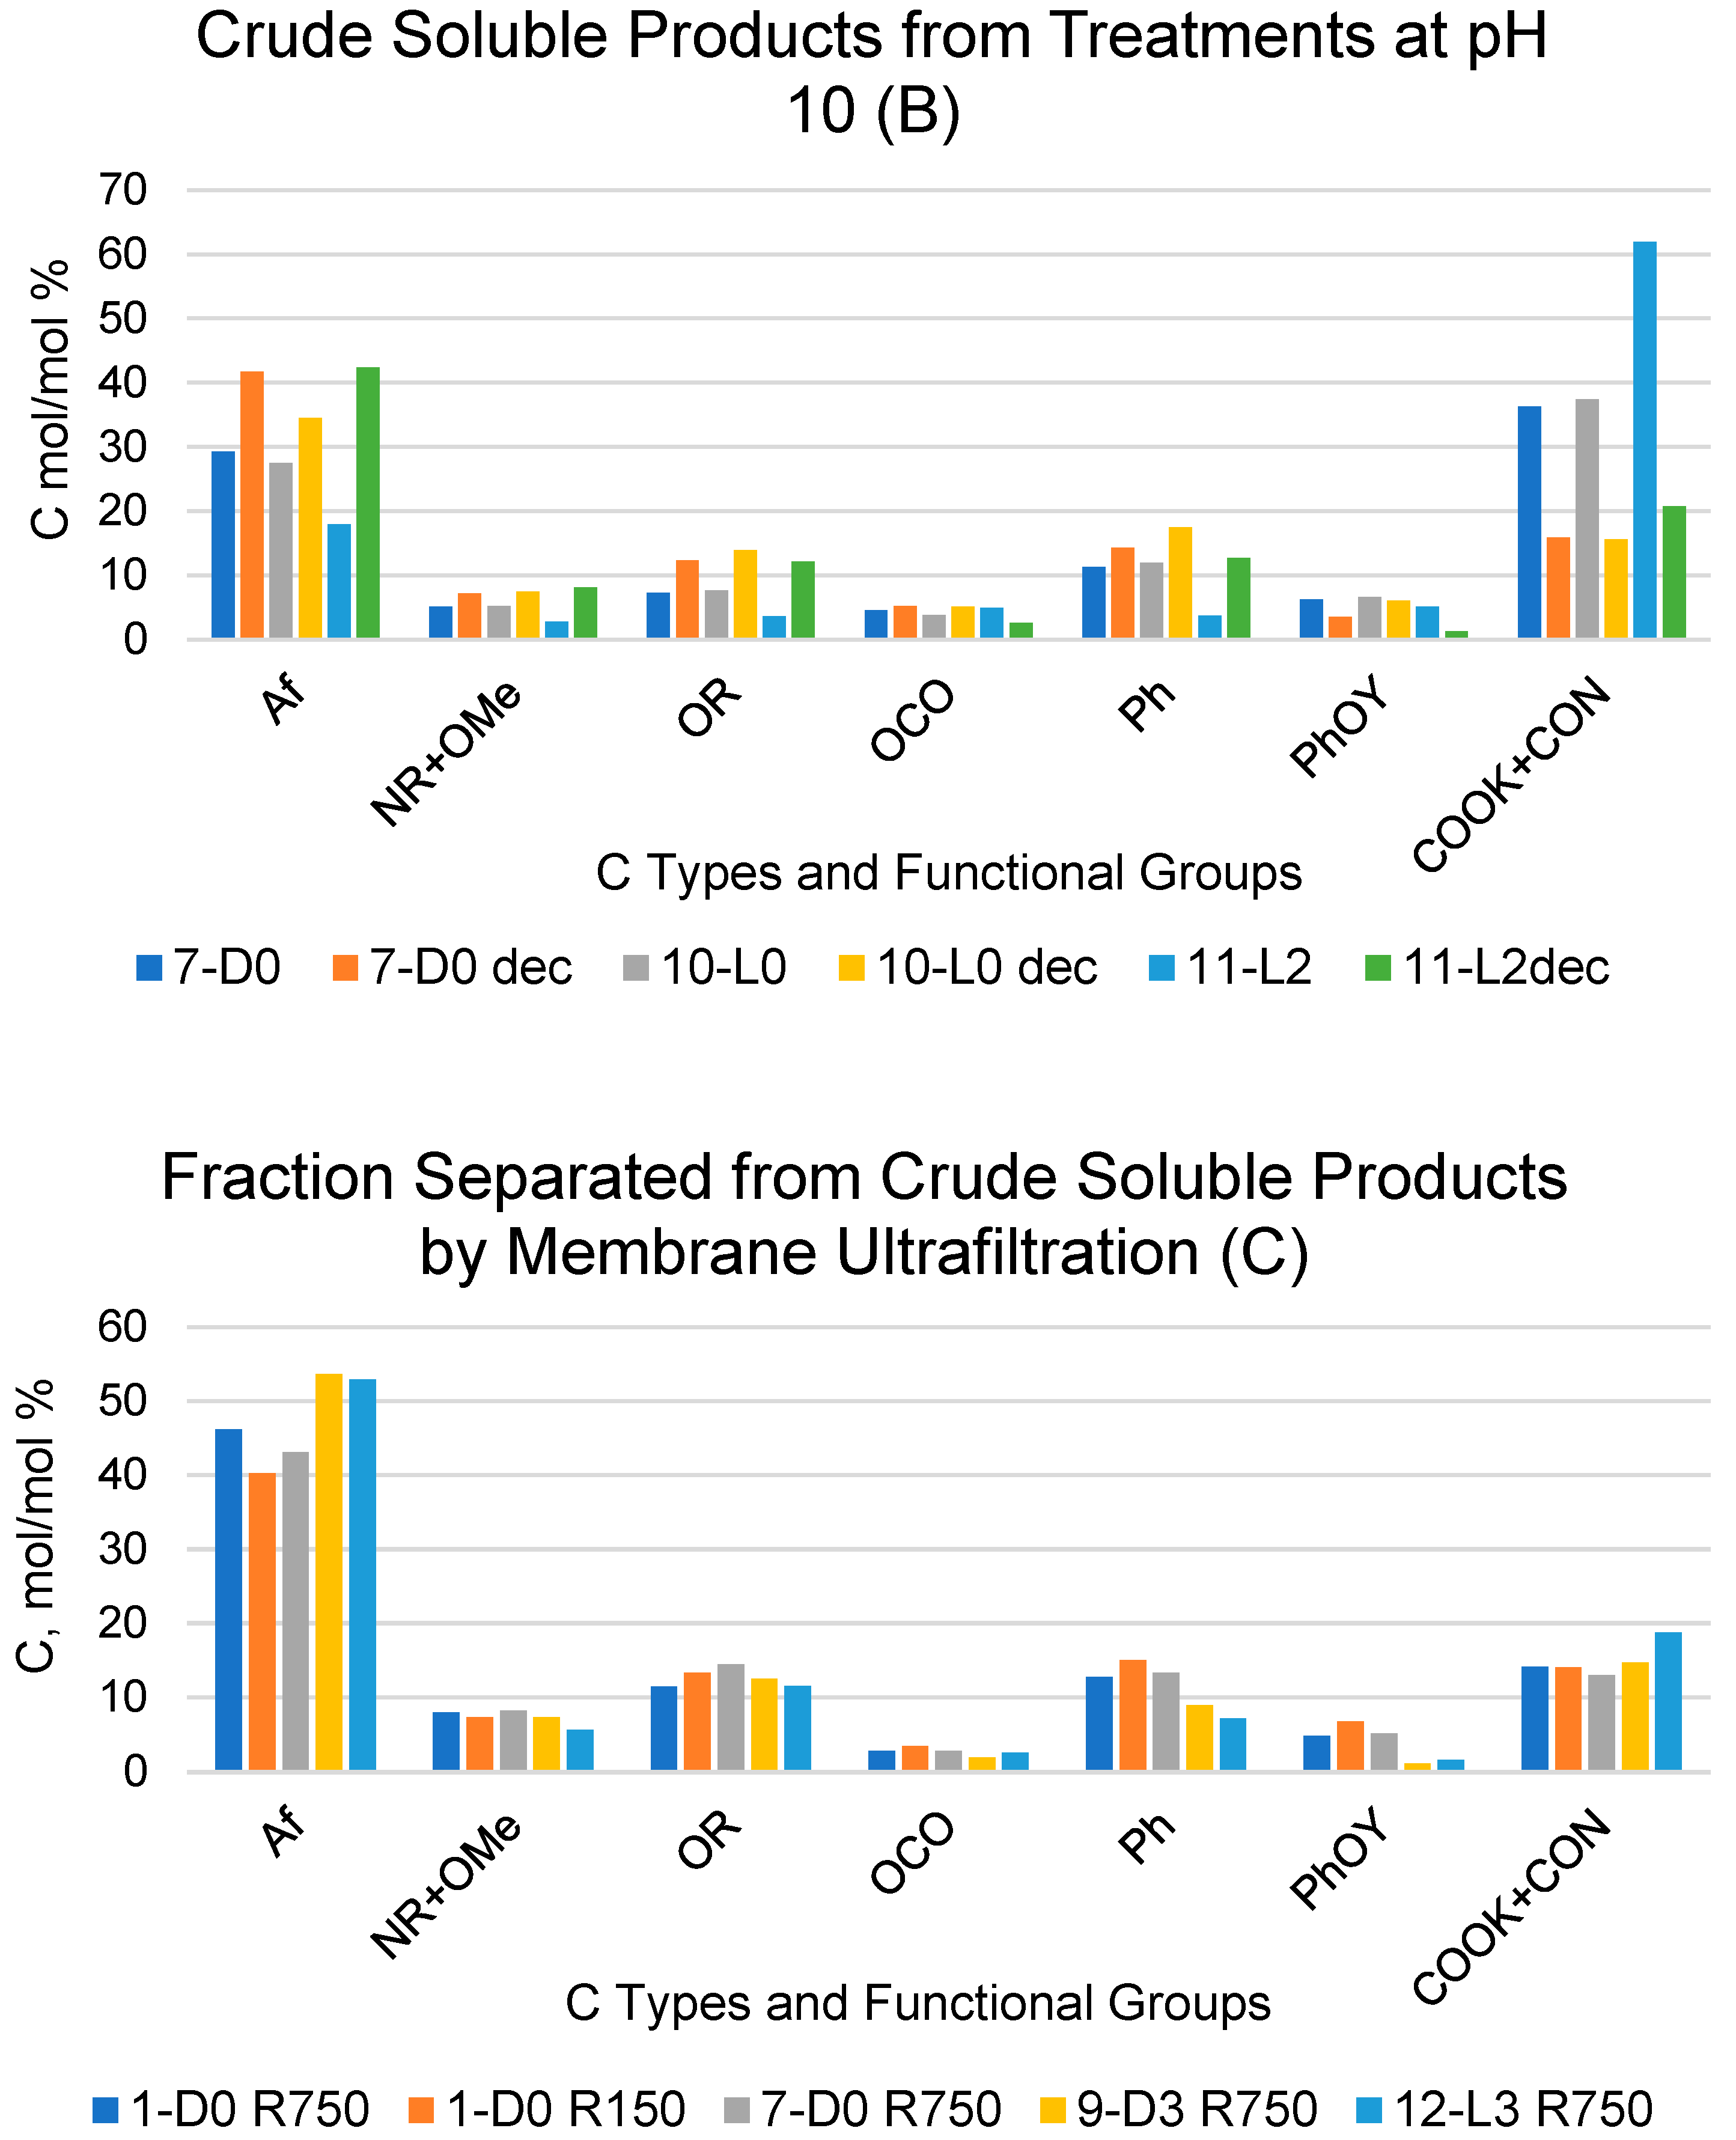
2.4. Products Obtained in the Presence of Added H2O2
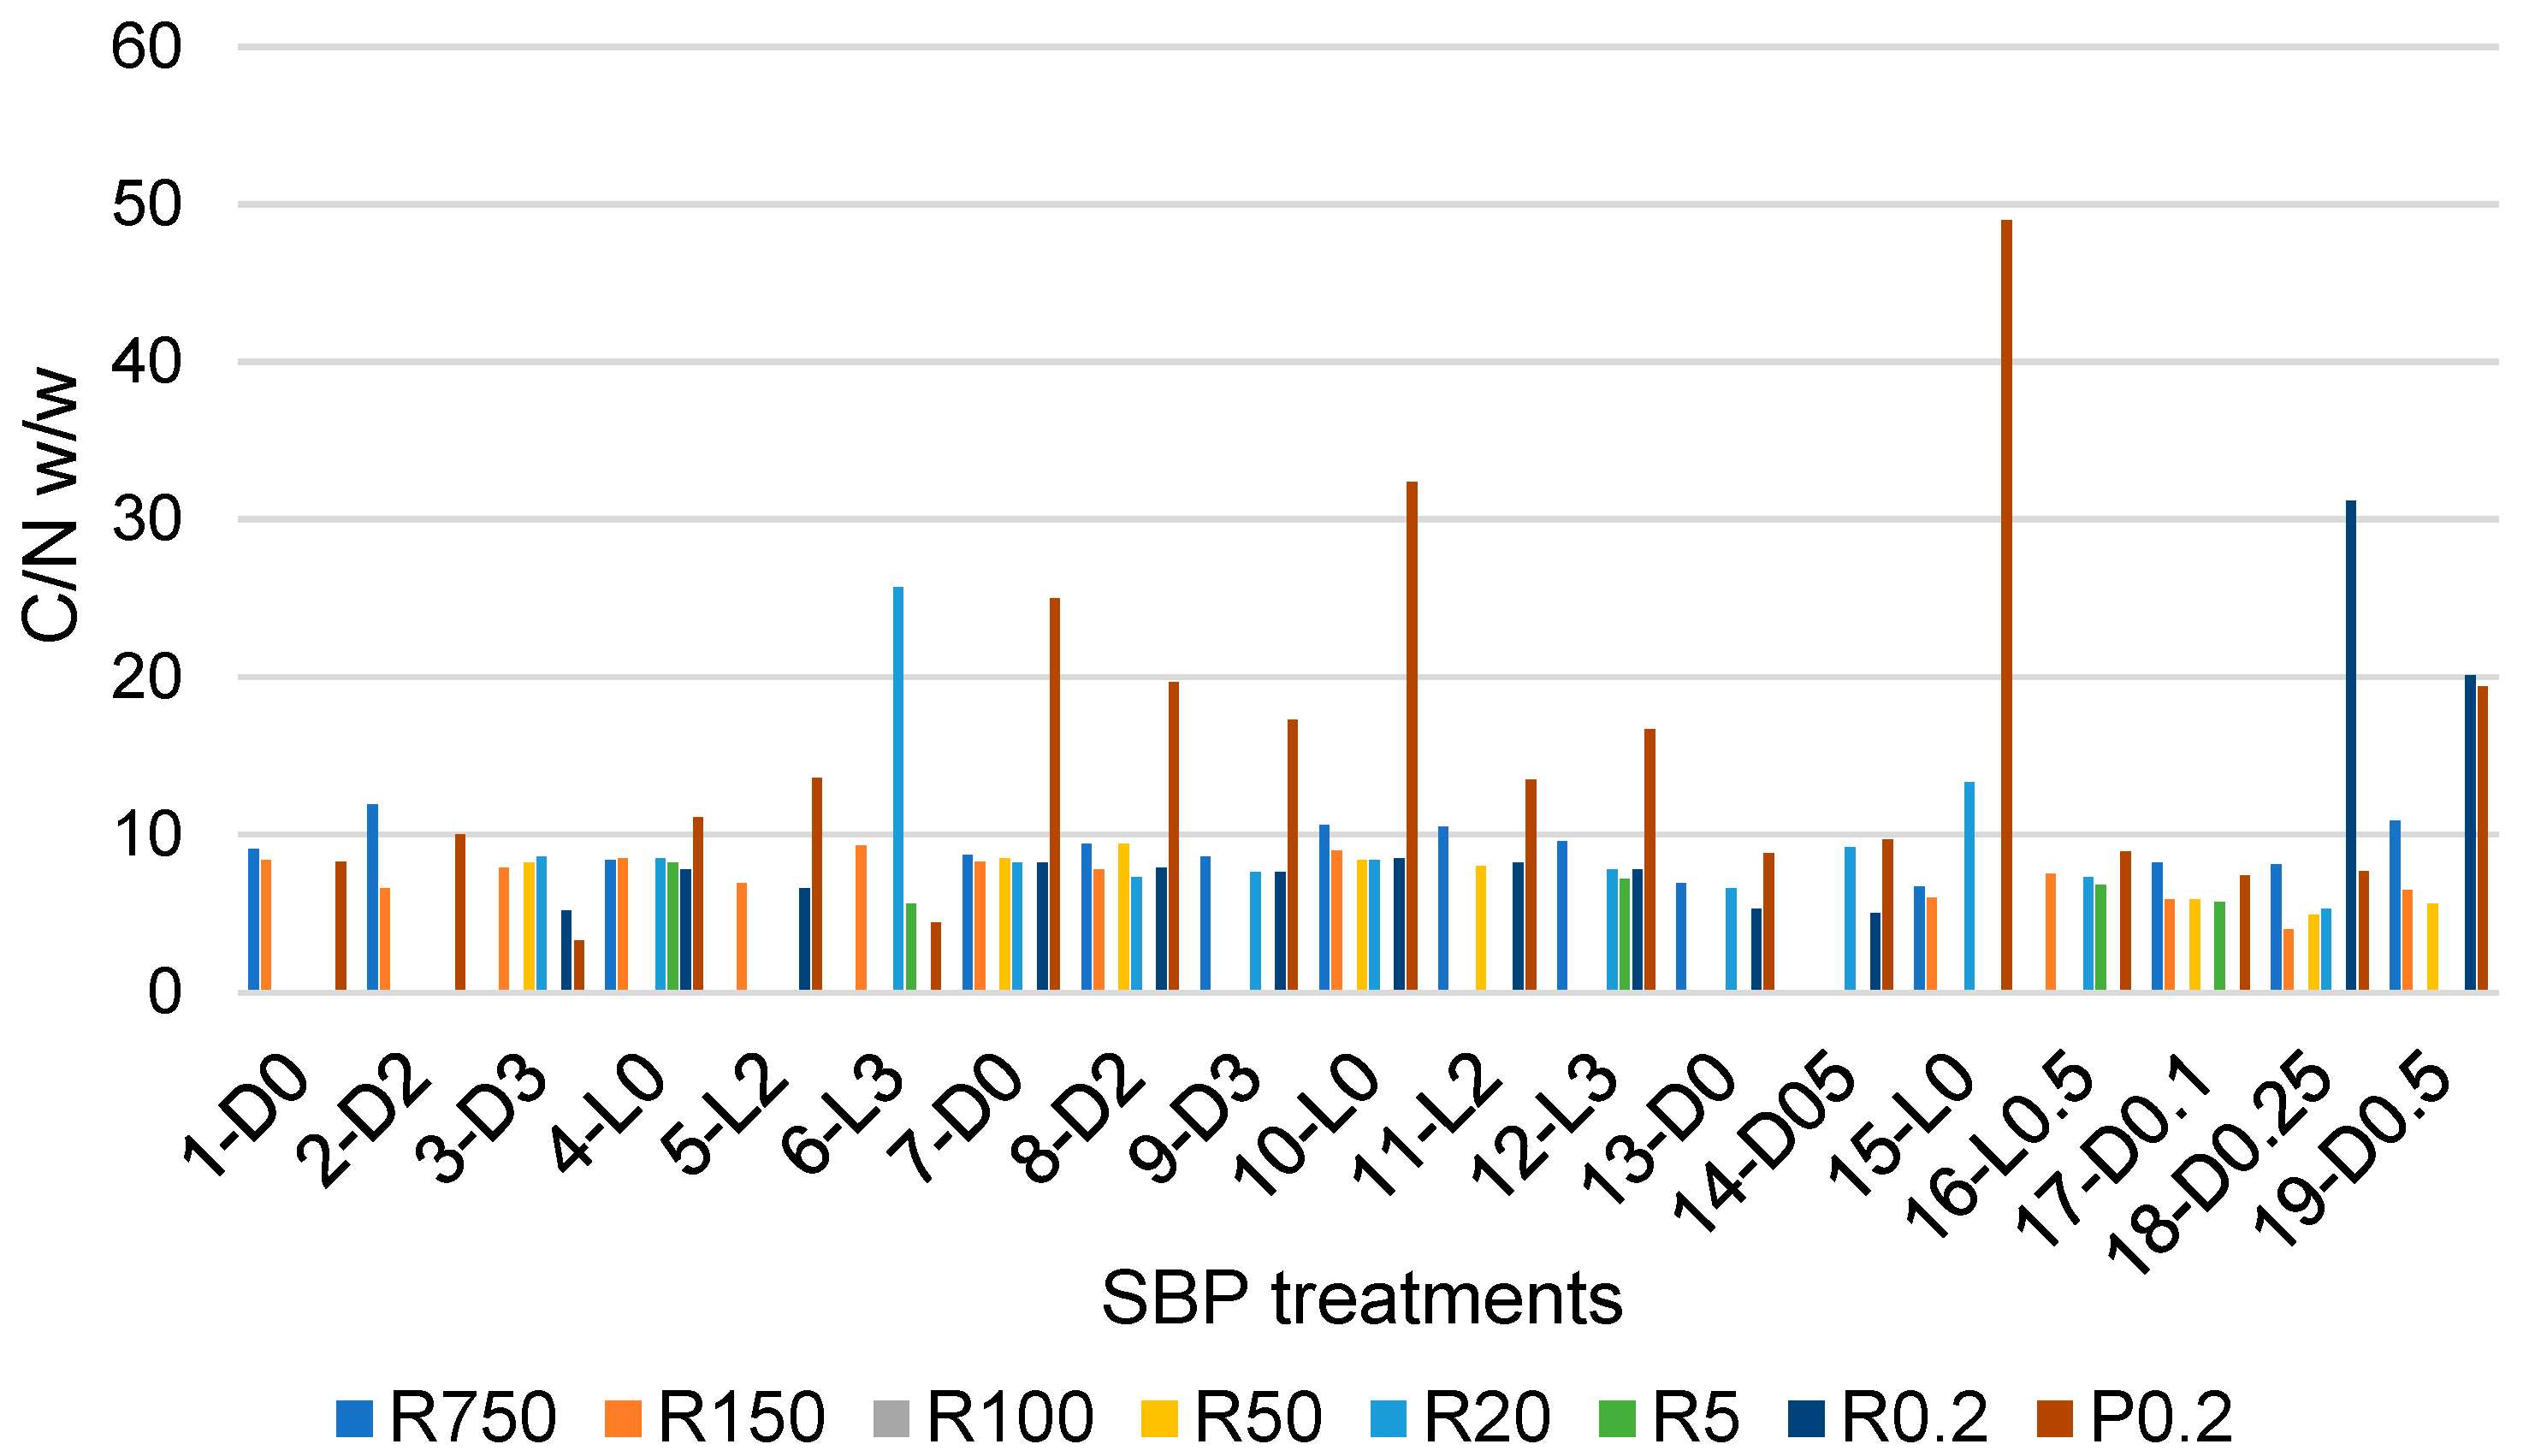
2.5. Chemical Composition and Properties of the Molecular Weight Fractions Obtained in All Treatments
3. Discussion
3.1. The Autocatalytic Property of SBP
3.2. Criticalities for the Implementation of the SBP Catalytic Properties
3.3. Scopes and Perspectives of Future Improvements
4. Materials and Methods
4.1. Materials and Treatments
4.2. Decarbonated CO2-Free Samples
4.3. Products’ Isolation and Characterisation
4.4. Analytical Methods
5. Conclusions
Supplementary Materials
Author Contributions
Funding
Institutional Review Board Statement
Informed Consent Statement
Data Availability Statement
Conflicts of Interest
Abbreviations
References
- Montoneri, E. Municipal waste treatment, technological scale up and commercial exploitation: The case of bio-waste lignin to soluble lignin-like polymers. In Food Waste Reduction and Valorisation; Morone, P., Papendiek, F., Tartiu, V.E., Eds.; Springer: Berlin/Heidelberg, Germany, 2017; Chapter 6; pp. 1–42. [Google Scholar]
- Padoan, E.; Montoneri, E.; Baglieri, A.; Francavilla, M.; Negre, M. Mild chemical treatment of unsorted urban food wastes. Molecules 2023, 28, 7670. [Google Scholar] [CrossRef]
- Montoneri, C.; Montoneri, E.; Tomasso, L.; Piva, A. Compost derived substances decrease feed protein N mineralization in swine cecal fermentation. J. Agric. Sci. 2013, 13, 31–44. [Google Scholar] [CrossRef]
- Bayard, R.; Benbelkacem, H.; Gourdon, R.; Buffière, P. Characterization of selected municipal solid waste components to estimate their biodegradability. J. Environ. Manag. 2018, 216, 4–12. [Google Scholar]
- Bandini, F.; Misci, C.; Taskin, E.; Cocconcelli, P.S.; Puglisi, E. Biopolymers modulate microbial communities in municipal organic waste digestion. FEMS Microbiol. Ecol. 2020, 96, fiaa183. [Google Scholar]
- Pagliano, G.; Ventorino, V.; Panico, A.; Pepe, O. Integrated systems for biopolymers and bioenergy production from organic waste and by-products: A review of microbial processes. Biotechnol. Biofuels 2017, 10, 113. [Google Scholar] [CrossRef]
- Montoneri, E.; Fabbri, G.; Quagliotto, P.L.; Baglieri, A.; Padoan, E.; Boero, V.; Negre, M. High molecular weight biosurfactants from mild chemical reactions of fermented municipal biowastes. ChemistrySelect 2020, 5, 2564–2576. [Google Scholar]
- Nisticò, R.; Evon, P.; Labonne, L.; Vaca-Medina, G.; Montoneri, E.; Vaca-Garcia, C.; Negre, M. Post-harvest tomato plants and urban food wastes for manufacturing plastic films. J. Clean. Prod. 2017, 167, 68–74. [Google Scholar] [CrossRef]
- ACEA. Available online: https://www.aceapinerolese.it (accessed on 10 October 2023).
- Consorzio Italiano Compostatori (CIC). Country Report—The State of the Art of Separate Collection, Composting and AD in Italy. 2017. Available online: https://www.compost.it/wp-content/uploads/2019/08/Rapporto-CIC-2017-Eng-v-2.6-web-version.pdf (accessed on 17 October 2023).
- Dekker, H.; Decorte, M. European Biogas Association, EBA Statistical Report 2021. Available online: https://www.europeanbiogas.eu/wp-content/uploads/2021/11/EBA-STATISTICAL-REPORT-2021-SHORT-VERSION.pdf (accessed on 2 December 2023).
- Meyer-Kohlstock, D.; Schmitz, T.; Kraft, E. Organic Waste for Compost and Biochar in the EU: Mobilizing the Potential. Resources 2015, 4, 457–475. [Google Scholar] [CrossRef]
- Vaneeckhaute, C.; Lebuf, V.; Michels, E.; Belia, E.; VaNoolleghem, P.A.; Tack, F.M.G.; Meers, E. Nutrient recovery from digestate: Systematic technology review and product classification. Waste Biomass Valorization 2017, 8, 21–40. [Google Scholar] [CrossRef]
- Neuwahl & al., Best Available Techniques for Waste Incineration, EU Commission 2019. Available online: https://op.europa.eu/en/publication-detail/-/publication/075477b7-329a-11ea-ba6e-01aa75ed71a1/language-en (accessed on 2 December 2023).
- Chenier, P.J. Basic organic chemicals. In Survey of Industrial Chemistry; Topics in Applied Chemistry; Springer: Boston, MA, USA, 2002. [Google Scholar]
- Eurostat, Chemicals Production and Consumption Statistics 2023. Available online: https://ec.europa.eu/eurostat/statistics-explained/index.php?title=Chemicals_production_and_consumption_statistics (accessed on 2 December 2023).
- Reilly, P.O. Making the Bioeconomy Market: A Review of International Literature May 2017. Available online: https://www.teagasc.ie/media/website/publications/2017/WP2-Making-the-Bioeconomy-Market-DIT.pdf (accessed on 10 October 2023).
- Chen, G.Q. New challenges and opportunities for industrial biotechnology. Microb. Cell Fact. 2012, 11, 111. [Google Scholar]
- Tsagaraki, E.; Karachaliou, E.; Delioglanis, I.; Kouzi, E. D2.1 Bio-Based Products and Applications Potential. 2017. Available online: https://www.bioways.eu/download.php?f=150&l=en&key=441a4e6a27f83a8e828b802c37adc6e1 (accessed on 10 October 2023).
- Isikgor, F.K.; Becer, C.R. Lignocellulosic biomass: A sustainable platform for the production of bio-based chemicals and polymers. Polym. Chem. 2015, 6, 4497–4559. [Google Scholar]
- Van Bogaert, I.; Soetaert, W. Sophorolipids. In Biosurfactants, Microbiology Monographs (MICROMONO, Volume 20); Soberón-Chávez, G., Ed.; Springer: Berlin, Germany, 2011; Chapter 6; pp. 179–210. [Google Scholar]
- Connolly, H.E.; Pattanathu, K.S.M.; Banat, I.; Lord, R.A. Resource-Recovery and Reduction of Oily Hazardous Wastes via Biosurfactant Washing and Bioremediation. Trends in Bioremediation and Phytoremediation, Ulster University 2010, pp. 57–172. Available online: https://pure.ulster.ac.uk/en/publications/resource-recovery-and-reduction-of-oily-hazardous-wastes-via-bios-3 (accessed on 2 December 2023).
- Scarso, A.; Strukul, G. Sustainability Trends in Homogeneous Catalytic Oxidations. In Handbook of Advanced Methods and Processes in Oxidation Catalysis. From Laboratory to Industry; Imperial College Press: London, UK, 2014; Chapter 5; pp. 679–766. [Google Scholar]
- Kumari, P.; Kuma, A. Advanced oxidation process: A remediation technique for organic and non-biodegradable pollutant. Results Surf. Interfaces 2023, 11, 100122. [Google Scholar] [CrossRef]
- John, J.; Ramesh, K.; Chellam, P.V. Metal-organic frameworks (MOFs) as a catalyst for advanced oxidation processes—Micropollutant removal. In Advanced Materials for Sustainable Environmental Remediation, Terrestrial and Aquatic Environments; Giannakoudakis, D., Meili, L., Anastopoulos, I., Eds.; Elsevier: Amsterdam, The Netherlands, 2022; Chapter 5; pp. 155–174. [Google Scholar]
- Avetta, P.; Berto, S.; Bianco Prevot, A.; Minella, M.; Montoneri, E.; Persico, D.; Vione, D.; Gonz’alez, M.C.; M’artire, D.O.; Carlos, L.; et al. Photoinduced transformation of waste-derived soluble bio-based substances. Chem. Eng. J. 2015, 274, 247–255. [Google Scholar]
- Montoneri, E.; Koutinas, M.; Padoan, E.; Negro, V.; Licignano, C.; Leone, S.; Photiou, P.; Kallis, M.; Vyrides, I.; Liendo, F.; et al. Integrated chemical and biochemical technology to produce biogas with reduced ammonia content from municipal biowaste. Validating lab-scale research in real operational environment. Environ. Sci. Adv. 2022, 1, 746–768. [Google Scholar] [CrossRef]
- Konwar, L.J. New biomass derived carbon catalysts for biomass valorization. Ph.D. Thesis, Åbo Akademi University Turku, Turku, Finland, 2016. [Google Scholar]
- Wang, R.; Chen, C.L.; Gratz, J.S. Ozonation, characterization of kraft lignin and its ozonated preparations. Holzforschung 2004, 58, 622–630. [Google Scholar]
- SpectraBase. Potassium Carbonate. Available online: https://spectrabase.com/spectrum/4DkIM6GVb69 (accessed on 20 November 2023).
- Guetzloff, T.F.; Rice, J.A. Does humic acid form a micelle? Sci. Total Environ. 1994, 152, 31–35. [Google Scholar] [CrossRef]
- Yates, I.L.M.; Engebretson, R.R.; Haakenson, T.J.; von Wandruszka, R. Immobilization of aqueous pyrene by dissolved humic acid. Anal. Chim. Acta 1997, 356, 295–300. [Google Scholar]
- von Wandruszka, R.; Ragle, C.; Engebretson, R.R. The role of selected cations in the formation of pseudomicelles in aqueous humic acid. Talanta 2005, 44, 805–809. [Google Scholar] [CrossRef]
- Jafvert, C.T.; Van Hoof, P.L.; Heath, J.K. Solubilization of nonpolar compounds by non-ionic surfactant micelles. Water Res. 1994, 28, 1009–1017. [Google Scholar] [CrossRef]
- Rosen, M.J. Surfactants and Interfacial Phenomena; John Wiley & Sons: Hoboken, NJ, USA, 2004. [Google Scholar]
- Chun, C.L.; Lee, J.J.; Park, J.W. Solubilization of PAH mixtures by three different anionic surfactants. Environ. Pollut. 2002, 118, 307–313. [Google Scholar] [CrossRef]
- Montoneri, E.; Boffa, V.; Savarino, P.; Perrone, D.G.; Montoneri, C.; Mendichi, R.; Acosta, E.J.; Kiran, S. Behaviour and properties in aqueous solution of bio-polymers isolated from urban refuse. Biomacromolecules 2010, 11, 3036–3042. [Google Scholar] [PubMed]
- Mullighan, C.N.; Yong, R.N.; Gibbs, B.F. Surfactant-enhancedremediation of contaminated soil: A review. Eng. Geol. 2001, 60, 371–380. [Google Scholar] [CrossRef]
- Sakar, M.; Nguyen, C.C.; Vu, M.H.; Do, T.O. Materials and mechanisms of photo-assisted chemical reactions under light and dark conditions: Can day–night photocatalysis be achieved? ChemSusChem 2018, 11, 809–820. [Google Scholar] [PubMed]
- Welsh, E. What is Chemiluminescence? Science in School I Issue 19: Summer 2011. Available online: https://www.scienceinschool.org/wp-content/uploads/2014/11/issue19_chemiluminescence.pdf (accessed on 2 December 2023).
- Cefic. 2023. Available online: https://cefic.org/a-pillar-of-the-european-economy/facts-and-figures-of-the-european-chemical-industry/profile/ (accessed on 2 December 2023).
- Falbe, J. Surfactants in Consumer Products: Theory, Technology and Applicatios; Springer Science & Business Media: Berlin, Germany, 2012. [Google Scholar]
- Rust, D.; Wildes, S. Surfactants: A Market Opportunity Study Update. Available online: https://soynewuses.org/wp-content/uploads/Surfactants-MOS-Jan-2009.pdf (accessed on 16 December 2023).
- GMI. Biosurfactants Market—By Product (Sophorolipids, Rhamnolipids, Alkyl Polyglucosides, Sucrose Esters, Lipopeptides, Phospholipids), by Application (Personal Care, Industrial Cleaners, Food Processing, Textiles, Pharma, Bioremediation), & Forecast, 2023–2032. Report ID: GMI484. 2023. Available online: https://www.gminsights.com/industry-analysis/biosurfactants-market-report?gclid=Cj0KCQiA7OqrBhD9ARIsAK3UXh11BqLKP8Mr8lhe12rBRWWxRe_QWlY7Rbfk69CSvr94eSQ13TpkAQgaAlwXEALw_wcB (accessed on 16 December 2023).
- Viale, P. The Manufacture of Basic Chemicals. Eurostat Statics in Focus 58/2008. Available online: https://ec.europa.eu/eurostat/documents/3433488/5582672/KS-SF-08-058-EN.PDF/ab295005-e8cb-49ee-bbef-60bd29819c47?version=1.0 (accessed on 12 November 2023).
- Singh, G. Thriving in the New Reality: Why Production Flexibility is Key for Competitive Refineries. 2020. Available online: https://www.shell.com/business-customers/catalysts-technologies/resources-library/thriving-in-the-new-reality-whyproduction-flexibility-is-key-for-competitive-refineries.html#:~:text=Gurminder%20Singh%20on%20Aug%209%2C%202020 (accessed on 12 November 2023).
- Taraphdar, T.; Yadav, P.; Prasa, M.K.E. Natural Gas Fuels the Integration of Refining and Petrochemicals. 2012. Available online: https://www.digitalrefining.com/article/1000557/natural-gas-fuels-the-integration-of-refining-and-petrochemicals (accessed on 2 December 2023).
- Olsen, T.; Shodowsky, E. Improve refinery flexibility and responsiveness. Hydrocarb. Process. 2015, 87–89. [Google Scholar]
- Shell Global. Thriving in the New Reality: Refinery Revamp Projects FAQ. 2020. Available online: https://www.shell.com/business-customers/catalysts-technologies/resources-library/refinery-revamp-faq.html (accessed on 2 December 2023).
- Reinartz, S.J.; Schmid, T. Production flexibility, product markets, and capital structure decisions. Rev. Financ. Stud. 2016, 29, 1501–1548. [Google Scholar]


| Treatment b | pH c | KOH d | H+/C, d | Recovered Soluble C (mol/mol %) e | |
|---|---|---|---|---|---|
| No. | Type | grams | eq/mol | ||
| 0 | none | 10 | |||
| 1 | D0 | 9 | 79.3 | ||
| 2 | D2 | 5.3 | 58.2 | ||
| 3 | D3 | 4.9 | 36.8 | ||
| 4 | L0 | 9 | 91.8 | ||
| 5 | L2 | 4.9 | 53.9 | ||
| 6 | L3 | 5.1 | 35.1 | ||
| 7 | D0 | 10 | 2 | 0.24 | 100 |
| 8 | D2 | 10 | 2.8 | 0.33 | 94.1 |
| 9 | D3 | 10 | 3.3 | 0.40 | 90.1 |
| 10 | L0 | 10 | 2 | 0.24 | 100 |
| 11 | L2 | 10 | 2.9 | 0.35 | 84.7 |
| 12 | L3 | 10 | 3.3 | 0.40 | 79.3 |
| Treatments No. 1–6 | Treatments No. 7–12 | |
|---|---|---|
| Mean | 65.2 | 99.0 |
| StdDev | 20.1 | 5.9 |
| StdDev% | 30.8 | 5.9 |
| Samples Coupled Together | C Types and Functional Groups | |||||||
|---|---|---|---|---|---|---|---|---|
| Af | NR + OMe | OR | OCO | Ph | PhOY | COX | ||
| 1-D0, 1-D0dec | Mean | 35.9 | 7.4 | 14.3 | 5.1 | 15.6 | 6.4 | 15.1 |
| Std | 1.2 | 0.35 | 0.49 | 0.14 | 0.64 | 1.2 | 0.64 | |
| Std % a | 3.3 | 4.7 | 3.4 | 2.8 | 4.1 | 18.6 | 4.2 | |
| 4-L0, 4-L0dec | Mean | 37.8 | 7.9 | 12.9 | 3.9 | 15.6 | 5 | 16.7 |
| Std | 2.8 | 0.2 | 0.78 | 0.42 | 0.64 | 2.5 | 0.14 | |
| Std % a | 7.5 | 2.7 | 6.0 | 10.9 | 4.1 | 50.9 | 0.85 | |
| Sample | COXorg | CO2 |
|---|---|---|
| 1-D0 | 15.1 ± 0.64 | none |
| 4-L0 | 16.7 ± 0.14 | none |
| 7-D0 | 11.1 | 25.1 |
| 10-L0 | 12.4 | 25.0 |
| Fractions | Mean | StD a | STDr b | Data Points c |
|---|---|---|---|---|
| R750 | 8.5 | 2.7 | 32 | 14 |
| R150 | 7.3 | 1.4 | 20 | 14 |
| R50 | 7.4 | 1.5 | 21 | 8 |
| R20 | 9.5 | 5.2 | 55 | 13 |
| R5 | 6.7 | 1.1 | 16 | 5 |
| R0.2 | 9.9 | 7.4 | 75 | 13 |
| P0.2 | 14.4 | 11.0 | 76 | 19 |
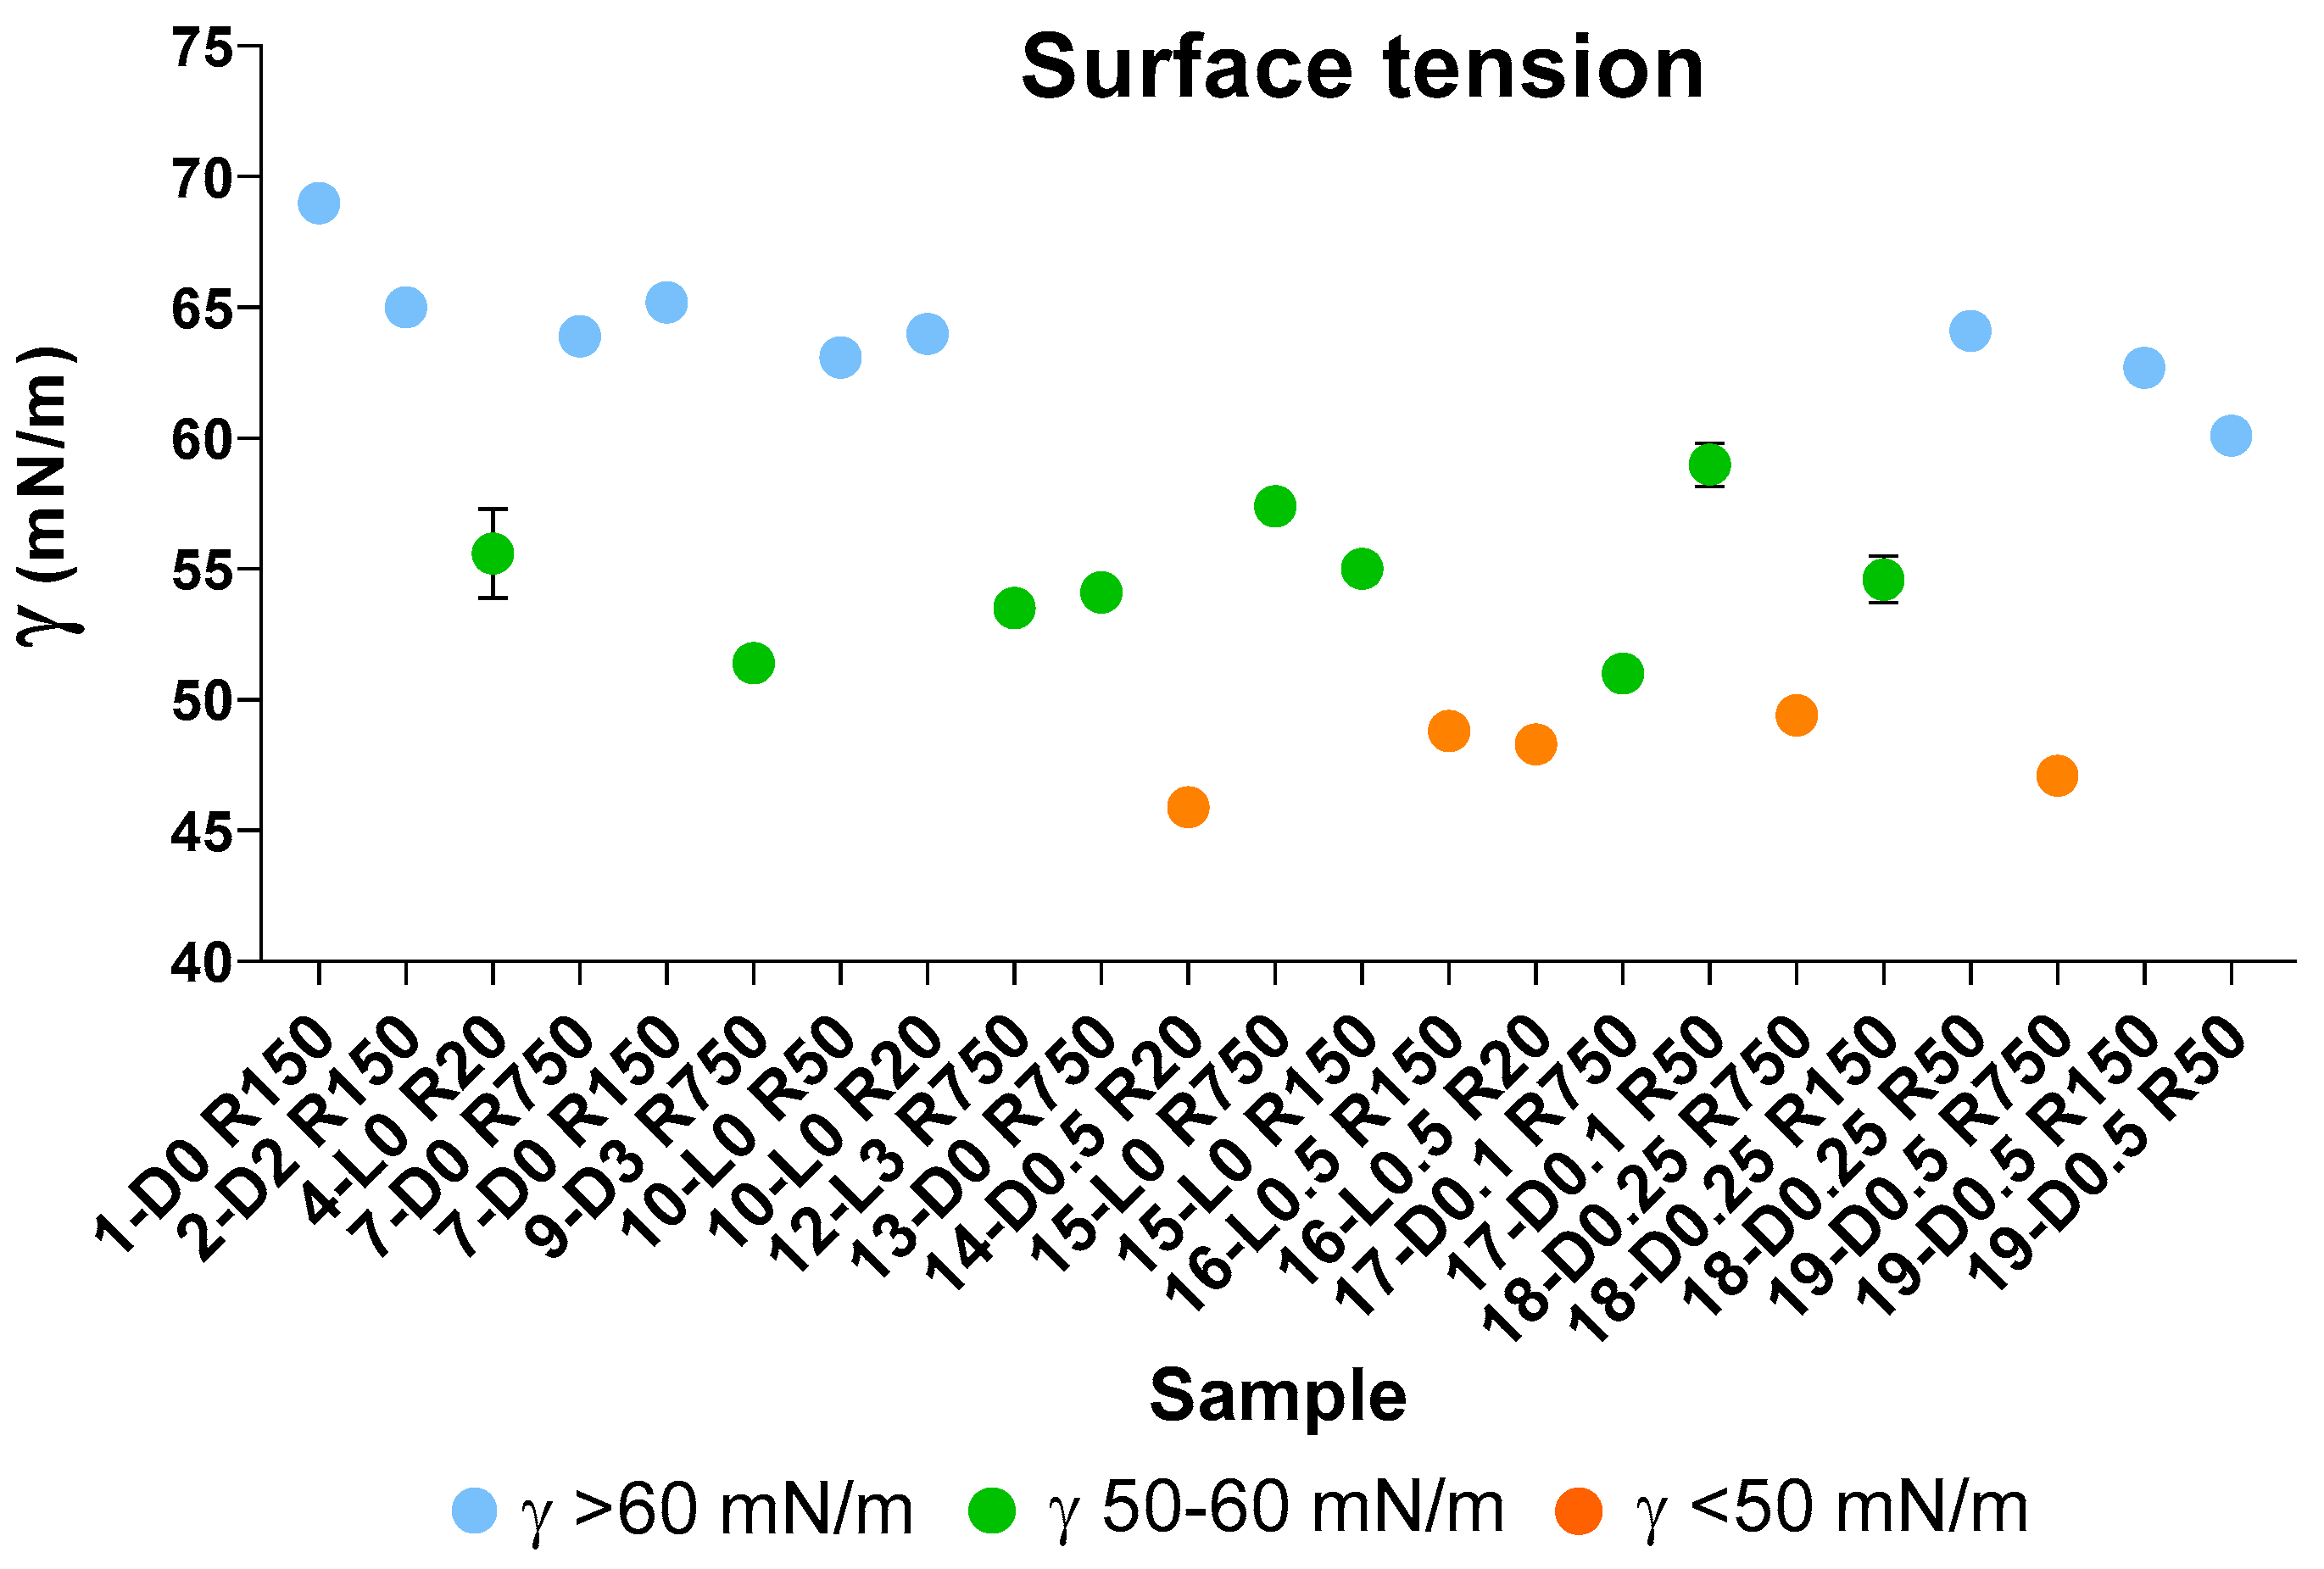
| γ ≥ < 60 | 50 ≤ γ 60 | γ < 50 | |
|---|---|---|---|
| N a | 9 | 9 | 5 |
| Mean b | 64.1 a | 54.7 b | 47.9 c |
| Std c | 2.4 | 2.6 | 1.4 |
Disclaimer/Publisher’s Note: The statements, opinions and data contained in all publications are solely those of the individual author(s) and contributor(s) and not of MDPI and/or the editor(s). MDPI and/or the editor(s) disclaim responsibility for any injury to people or property resulting from any ideas, methods, instructions or products referred to in the content. |
© 2024 by the authors. Licensee MDPI, Basel, Switzerland. This article is an open access article distributed under the terms and conditions of the Creative Commons Attribution (CC BY) license (https://creativecommons.org/licenses/by/4.0/).
Share and Cite
Padoan, E.; Montoneri, E.; Baglieri, A.; Contillo, F.; Francavilla, M.; Negre, M. The Autocatalytic Chemical Reaction of a Soluble Biopolymer Derived from Municipal Biowaste. Molecules 2024, 29, 485. https://doi.org/10.3390/molecules29020485
Padoan E, Montoneri E, Baglieri A, Contillo F, Francavilla M, Negre M. The Autocatalytic Chemical Reaction of a Soluble Biopolymer Derived from Municipal Biowaste. Molecules. 2024; 29(2):485. https://doi.org/10.3390/molecules29020485
Chicago/Turabian StylePadoan, Elio, Enzo Montoneri, Andrea Baglieri, Francesco Contillo, Matteo Francavilla, and Michéle Negre. 2024. "The Autocatalytic Chemical Reaction of a Soluble Biopolymer Derived from Municipal Biowaste" Molecules 29, no. 2: 485. https://doi.org/10.3390/molecules29020485
APA StylePadoan, E., Montoneri, E., Baglieri, A., Contillo, F., Francavilla, M., & Negre, M. (2024). The Autocatalytic Chemical Reaction of a Soluble Biopolymer Derived from Municipal Biowaste. Molecules, 29(2), 485. https://doi.org/10.3390/molecules29020485